
1 Introduction
With the rapid development of renewable energy such as wind power and photovoltaic(PV)power,their impact on the power system is receiving increasing attention [1].Specifically,the small signal stability problem of power systems is a key issue at present [2-3].Nowadays,the deterministic method is mostly adopted for the small signal stability analysis of a power system [4].However,there are many uncertainties that affect small signal stability in an actual power system.This is particularly true for interconnected power systems consisting of stochastic and intermittent wind and PV power generation,in which it is difficult to match the typical operation mode of the damping controller design with the actual operation mode of the system.The limitations of the deterministic method,which cannot truly reflect the stochastic characteristics of the system and can only be used for stability analysis in specific instances,can be compensated for by a probabilistic stability analysis.Thus,probabilistic stability analysis has broad application potential for the stability analysis and control of wind and PV-based power systems [5-7].
Probabilistic small signal stability analysis(PSSSA)was first introduced to study the power system by Burchett and Heydt [5].The traditional method used for PSSSA is a Monte Carlo simulation(MCS)[6-7],in which a variety of random factors can be considered.However,MCS requires a large amount of sampling and repeated operations so does not meet the practical requirements; therefore,a simpler and more efficient analytical method is required.At present,efficient methods for PSSSA can be divided into three categories:the analytical method [8-9],the Point Estimate Method(PEM)[10-11],and the Probabilistic Collocation Method(PCM)[12-14].In [7],a Quasi MCS was adopted in the PSSSA for power systems considering the uncertainty related to wind power and electric vehicle charging.The semi invariant method in the analytical method was adopted in PSSSA for a power system with a wind farm in [8].In [9],the influence of wind power penetration on the probabilistic small signal stability(PSSS)of the power system was analyzed.In [10],the influence of uncertainties such as parameters and loads on the PSSS was analyzed using PEM.The PSSSA of a microgrid was considered in [11].The PCM method was adopted for the PSSSA of an offshore wind power transmission power system through a multi-terminal VSC-HVDC transmission network in [14].However,none of these papers studied the combined problem of wind-solar power; thus,this study adopts PSSSA for a power system consisting of wind and photovoltaic power.
The PCM,which performs simulations by a reasonable selection of a few parameter samples through the probability distribution of parameters,can establish the polynomial relationship between simulation results and uncertain parameters.The PCM has the advantages of simplicity,minimal calculation,high accuracy,correlation,and nonlinearity.In this study,the PCM is employed to investigate the PSSS of a power system consisting of wind and PV power generation.Probabilistic characteristics such as the expected value of the damping ratio,the probabilistic eigenvalue index,and the cumulative distribution function(CDF)are obtained using the probabilistic eigenvalue analysis technique to study the influence of PSSS and the access mode of wind and PV power systems on the changes of probabilistic damping characteristics and provide a reference for power grid planning,design,and operation.Compared with the results of MCS,simulation results of both the 4-machine 2-area system and the New England system verify the accuracy and high efficiency of the PCM.
2 Modeling wind and photovoltaic power
2.1 Modeling the wind power system
A brief description of the doubly-fed induction generator(DFIG)mathematical model is presented in this section.Fig.1 illustrates the structure of the DFIG wind turbine system integrated with a complex power system.

Fig.1 Structure of the integrated DFIG wind turbine system
2.1.1 Wind turbine and drive train
Mechanical torque Tt and mechanical power Pt harnessed by the wind turbine are calculated as follows [21]:
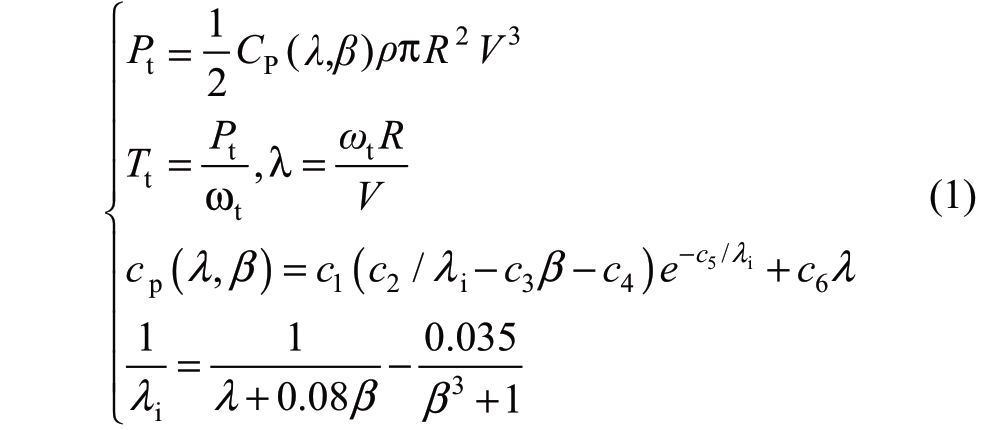
where the coefficients c1 to c6 are constants reflecting the characteristics of wind turbines; i.e.,c1=0.05176,c2=116,c3=0.4,c4=5,c5=21 and c6=0.0068.A simplified 2-mass model of the turbine drive train is adopted in this study and its mathematical expression is as follows [22]:

where Tsh is the shaft torque,Te is the electrical torque,Hg and Ht are the equivalent gear-box and turbine inertia,ωB is the base angular speed,θtw and ωt are the turbine angle and speed,respectively,and K and D are the coefficients of rigidity and torsional vibration,respectively.
2.1.2 Asynchronous generator
The mathematical model of an asynchronous generator in the rotor d-q reference frame can be expressed by the following equations [22]:

where Rs,Xs,and are the stator resistance,reactance,and transient reactance of wind turbines,respectively.Lm,Lrr,and Lss are the mutual inductance coefficient of the stator and rotor,the self-inductance coefficient of the rotor,and the self-inductance coefficient of the stator of the wind turbine,respectively.
 are the transient potential of the dq-axis,respectively,and
 is the transient time constant of the stator open circuit.
2.2 Modeling the photovoltaic power system
The PV generation system model adopts the electromechanical transient model described in [17].Fig.2 illustrates the structure of the grid-connected PV system integrated with a complex power system.

Fig.2 Structure of the grid-connected PV system
2.2.1 Photovoltaic module
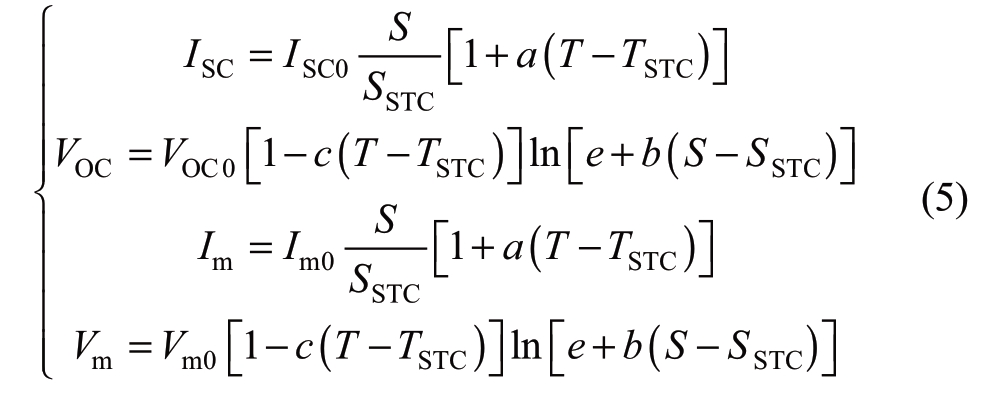
The mathematical equation corresponding to the model is shown in equation(4),where the parameters include:standard ambient light intensity Sref and temperature Tref,short-circuit current Isc0,open-circuit voltage Uoc0,current Im0at the maximum power point,and voltage Um0 at the maximum power point of the PV battery,which are also in the standard environment,the correction value of voltage Uoc/Um,the correction value of current Isc/Im after environmental change, the temperature compensation coefficient α, and the light intensity compensation coefficient β.

The correction value of voltage and current after environmental change is as follows:
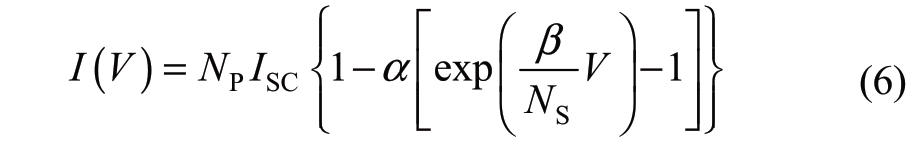
According to the external characteristics of a single PV cell and the number of series-parallel connections,the I-V characteristics of the PV array are as follows:
2.2.2 Model of the Maximum Power Point Tracking(MPPT)
MPPT control tracks the maximum power of different environments by tracking the voltage of the maximum power point.The model of MPPT can be simplified into a lagging link and first-order inertia link as follows:
where γ is the pure lag time constant of the controller, T is the first-order time constant,and Vpvm is the voltage value of the PV array at the maximum power point,which indicates the reference voltage.
2.2.3 DC/DC converter model
DC/DC converters are divided into two types:singlestage and double-stage.Their main functions are boost and power conversion.A two-stage DC/DC converter is adopted in this study.Its input-output relationship is as follows:
where, η is the conversion efficiency of DC/DC converters, N is the number of PV arrays,np and ns are the number of PV cells connected in parallel and in series with PV arrays,respectively,amd ICELL and VCELL are the output current and voltage of PV cells,respectively.The capacitance equation of the DC bus is as follows:
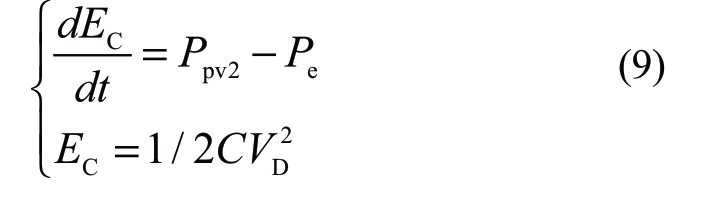
where Ppv2 is the input power of the DC side; Pe is the output power of the inverter side; and EC is the energy stored on the capacitors.
3 Probabilistic model of wind power and PV power
3.1 Wind speed probability model
The wind speed probability model obeys a Weibull distribution,and its probability density function(PDF)and CDF are shown in formulas 10 and 11,respectively,
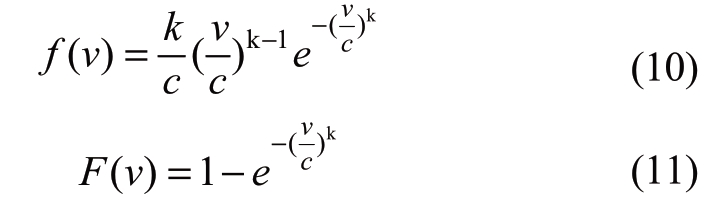
where v is wind speed,k =1 represents a shape parameter reflecting the distribution characteristics of v and corresponding to the shape of the Weibull function,and c =5 is a scale parameter reflecting the average value of v.The range of wind speed is 0-12 m/s.
The wind power model adopts the doubly fed wind turbine model described in [15].The relationship between output power and wind speed can be approximated by piecewise function in the following formula,
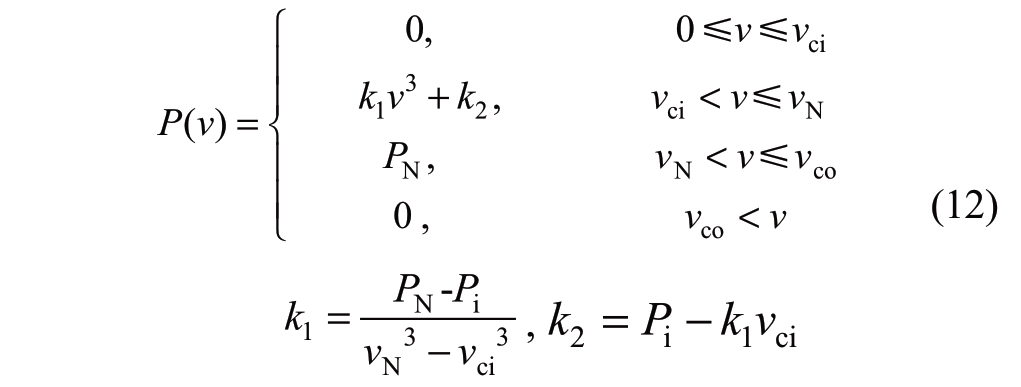
where vci,vN,and vco are the cut-in wind speed,rated wind speed,and cut-out wind speed,respectively,PN is the rated power of the wind turbines,and Pi is the wind power corresponding to the cut-in wind speed vci.
3.2 Probability model of light intensity
According to statistics,the ratio x(x=G/Gmax)of light intensity G to the maximum light intensity Gmax can be approximately regarded as a Beta distribution and its PDF is shown in the following formula [16],
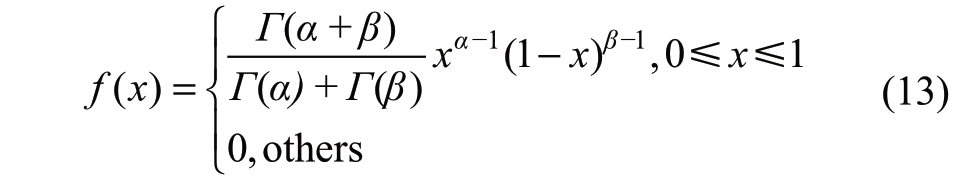
where the units of G and Gmax are W/m2,α and β are the shape parameter of the Beta distribution, and Γ is a Gamma function.The shape parameters can be obtained from the average value μ of light intensity and variance σ2 in a certain period.Their relationship is shown in the following equations:

where =600 W /m2 is the average value of light intensity,assuming σ=μ*10%.When the maximum value is Gmax=1000 W/m2,μ =0.6.The range of light intensity is 0-1000 W/m2.
4 Principle of probabilistic small signal stability analysis using the PCM
4.1 Basic concept of the PCM
A power system consisting of wind power and PV power generation contain several uncertain parameters,such as wind speed and light intensity.The simulation result of a small disturbance is a function of those uncertain parameters.The function is unknown and can be described by a polynomial.Using an orthogonal polynomial,PCM chooses a few parameter samples for simulation in the probability space of the parameters and calculates the coefficients of polynomials according to the simulation results and corresponding parameters.With an orthogonal polynomial,the selected simulation parameter samples are in the high probability region,which covers all regions of the parameter interval.Therefore,a low order polynomial can be used to accurately obtain the expected value of the high order polynomial [13].
4.2 Orthogonal polynomial
If the polynomial function family h0(x),h1(x),…,hn(x)satisfies the following:
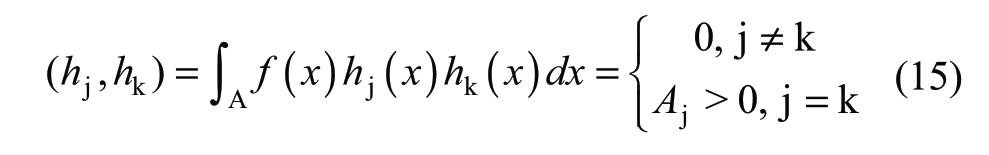
then {hk(x)} is a function family of the orthogonal polynomial.According to the properties of the orthogonal polynomial,any three adjacent polynomials {hk-1(x),hk(x),hk+1(x)} in an orthogonal polynomial sequence with a leading coefficient of 1 have the following recursive relationship:
where ak and bk are constants independent of x,and

Assuming that the PDF of an uncertain parameter x is f(x),according to the above relationships,the orthogonal polynomial sequence {hk} of x can be obtained.The value of the input parameter sample point xi(i=0,1,…,n)is the root of the orthogonal polynomial hk+1(x)=0.
4.3 PSSSA of a power system using the PCM
We assume that the wind speed and light intensity of the uncertainty parameters are x and y,respectively,and obey f1(x)and f2(y),respectively.The corresponding orthogonal polynomials {hi(x)},ti(y)} and parameter sample sets {xi,yj} are determined by the above method.Then,the bivariate polynomial relationship( )ˆgx,y based on the small signal simulation result z and the uncertainty parameters x and y can be established:
where m and n are the actual order of x and y,respectively.The relationship is determined according to the method described in [13].
After m*n times simulations,the coefficients of the polynomials can be determined,as well as the functional relationship between the simulation results and uncertain parameters.The flow chart of PSSSA for a power system with multiple types of renewable energy sources based on PCM is shown in Fig.3.
After determining the polynomial relationship between the output variable and the uncertain parameter,the expectation of the output variable estimation![]() can be calculated according to the property of the orthogonal polynomial:
can be calculated according to the property of the orthogonal polynomial:

It is impossible to judge whether the system is in a small-disturbance,stable state by expectation alone because,when the expectation of the damping ratio is greater than 0,there is still a probability that the damping ratio is less than 0.Therefore,the concept of a probabilistic eigenvalue index used in [7]is introduced to determine the probabilistic small signal stability of the system.Theoretically speaking,the system has a small signal as long as the damping ratios of all modes are greater than zero.
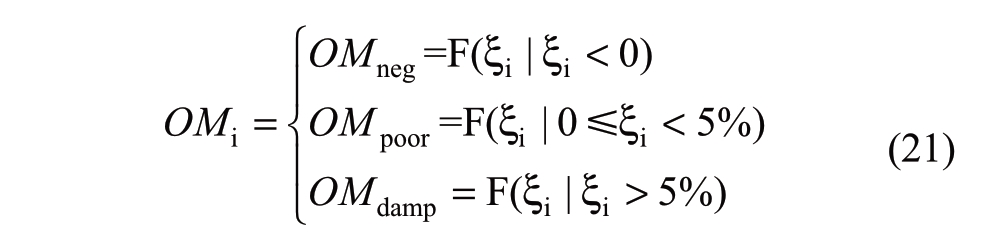
To ensure the dynamic performance of the actual system,the damping ratio should not be less than a certain threshold ξ0, which was set as ξ0=5% in this study.Therefore,the power system operation state can be divided into negative damping(ξ<0), poor damped oscillation(0≤ξ≤5%)and damped oscillation(ξ>5%).The probabilistic eigenvalue index of the system can be defined as:

Fig.3 Flow chart of PSSSA for a power system with multiple types of renewable energy sources based on PCM
The level of stability or instability of the oscillation modes in the system can be directly reflected by the above index.
5 Case studies
5.1 Algorithm verification
In this subsection,the validity of the proposed method is verified using a 4-machine 2-area system with wind power and PV power generation.Fig.4 shows a block diagram of the power system.All synchronous generators in the system use the six-order model,with an exciter and governor.The excitation system of G1 and G4 are simultaneously equipped with a power system stabilizer(PSS).All generator parameters are adopted from [18].
In this case,the benchmark capacity of the system is 100 MVA.The capacities of the wind and PV power plants are 4 p.u.and 6 p.u.,respectively.Part of the capacity of G4 is replaced by wind power,whose power fluctuation is supported by G4.Part of the capacity of G1 is replaced by PV power,whose power fluctuation is supported by G1.The probabilistic models of wind and PV power are described in section 3.To verify the accuracy of the PCM,the results of PSSSA based on MCS with 9400 sampling points are compared for reference.The details of the MCS can be found in [19].
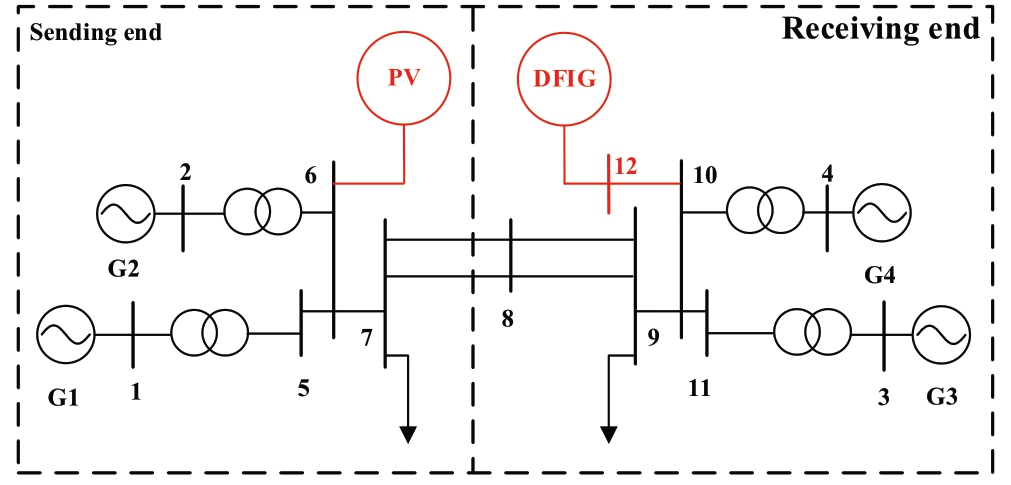
Fig.4 4-machine 2-area system with wind power and PV power generation
The 9400 points sampled by MCS are substituted into a PCM fitting polynomial to calculate the fitted value of the damping ratio of the inter-area mode.The mean square error(MSE)of the fitting result zfk relative to the real result zsk is
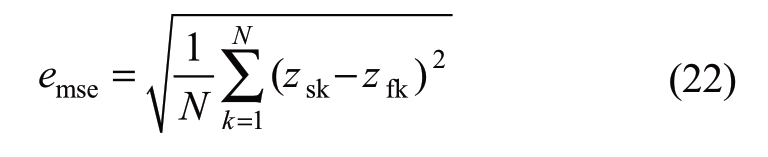
The expectation and standard deviation are calculated according to the fitted value and compared with the results of MCS to obtain the relative errors of the expectation and standard deviation.The relative error is calculated as follows:

Table 1 shows the MSE and relative error of the expectation and standard deviations of the damping ratio of the inter-area mode obtained by the PCM of different orders.The CDF curves of the inter-area mode damping ratio fitted by MCS and PCM of different orders are shown in Fig.5.
As shown in Table 1,with increasing PCM order,the error of the PCM result decreases compared to that of MCS.MSE,the errors of expectation,and the standard deviation of the 3*3 order PCM are all less than 1%,and the accuracy is very high.Although the accuracy can be further improved by improving the order of PCM on this basis,the computation time is also increased.However,there is no need to increase the order of PCM because fitting degree of the 3*3 order PCM is very high(Fig.5)therefore,that PSSS can be analyzed by the 3*3 order PCM.
Table 1 Errors of PCM fitting results
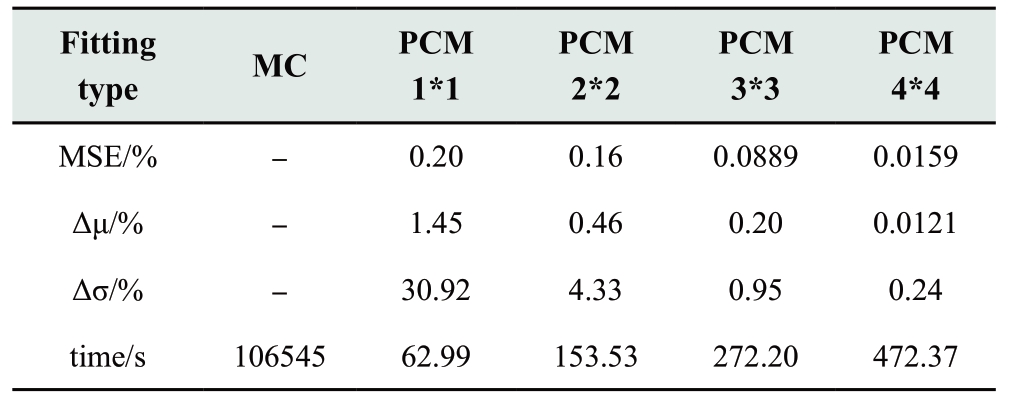
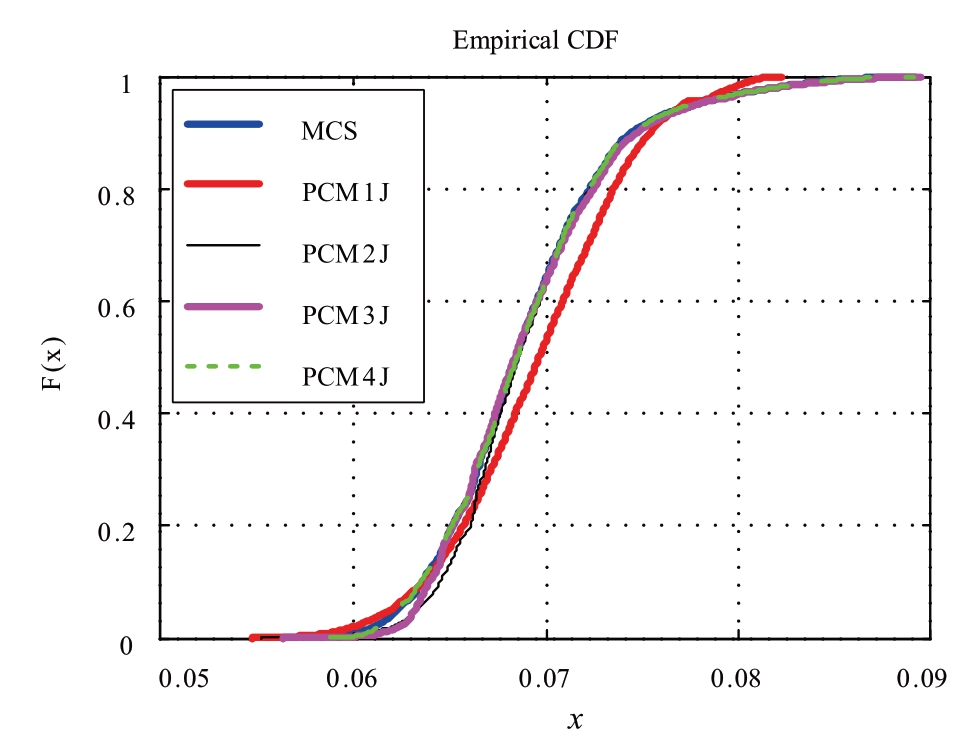
Fig.5 CDF curves of the inter-area mode damping ratio
5.2 Case 1: 4-machine 2-area system
Here,the structure shown in Fig 4 is implemented.The PSS parameters of the 4-machine 2-area system are adjusted so that the damping ratio of the inter-area mode is adjusted to 5% before the PV and wind power are connected.With the above PSS parameters unchanged,the PSSSA of the PCM is conducted in the 4-machine 2-area system consisting of wind power and PV power generation.In order to study the influence of PSSS and the access mode of wind and PV power systems on the changes of probabilistic damping characteristics and provide a reference for power grid planning,design,and operation,this study adopts the following two schemes.A)The output of the synchronous generators is reduced to increase renewable energy penetration; i.e.,the output of the synchronous generators is replaced by the output of PV and wind power.B)Part of the synchronous units are shut off to increase renewable energy penetration; i.e.,the capacity of the synchronous generators is replaced by the capacity of the PV system and wind turbines.The details are as follows.
Scenario A:Increase the capacity of PV and wind power and decrease the output of G1 and G4.The expected damping ratio of the electromechanical mode is obtained(Fig.6).The calculated probabilities of negative and poor damping of inter-area modes are all zero; thus,the probability eigenvalue index is not listed here.
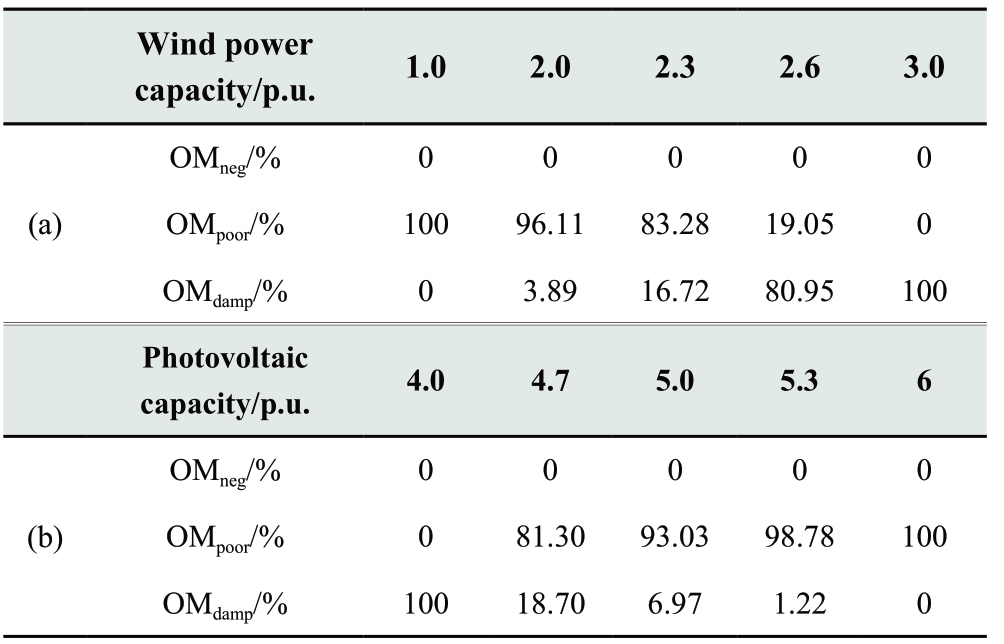
Scenario B:(a)With a constant PV power capacity of 4 p.u.,the access capacity of wind power is increased to correspond to the reduced capacity of G4.(b)With a constant wind power capacity of 3 p.u.,the capacity of PV power is increased to correspond to the reduced capacity of G1.The expected damping ratio of the electromechanical mode is shown in Fig.7,and the probabilistic eigenvalue index of the inter-area mode is shown in Table 2.

Fig.6 Expected damping ratio in scenario A of the 4-machine 2-area system
As shown in Fig.6,as the capacity of PV and wind power increases with the decreasing output of the synchronous unit,the expected damping ratio of the three modes increases gradually.The probabilities of negative and poor damping of inter-area modes are all zero,indicating no risk of low frequency oscillation.Therefore,the PSSS of the system can be improved by reducing the output of the synchronous generators and increasing renewable energy penetration.
As shown in Fig.7,as the capacity of wind power increases,the expected damping ratio of mode 1 remains stable.The expected value of mode 2 and mode 3 gradually decrease and increase,respectively.Conversely,as the capacity of PV power increases,the expected damping ratio of mode 2 remains stable,whereas the expected value of mode 1 and mode 3 gradually decrease.
As shown in Table 2,with increasing wind power capacity,the poor damping probability of the inter-area mode is reduced from 100% to zero.With increasing PV power capacity,the poor damping probability is increased from zero to 100%.This indicates that a change in the capacity of PV and wind power may have different effects on the same mode.

Fig.7 Expected damping ratio in scenario B of the 4-machine 2-area system,(a)with a change in wind power capacity and(b)with a change in PV power capacity
Table 2 Probabilistic eigenvalue index of Case1
5.3 Case 2: New England system
The PSS parameters of the New England system are adjusted so that the damping ratio of the four inter-area modes are slightly greater than 5% before PV and wind power are connected.With the above PSS parameters unchanged,the network topology of the New England system with wind power and PV power generation is shown in Fig.8.

Fig.8 New England system with wind power and PV power generation
The same two scenarios employed in section 5.2(Case 1)are used.
Scenario A:Increase the capacity of PV and wind power and decrease the output of G3 and G6.As the modes affected by G3 and G6 are three inter-area modes,only the expected damping ratio of the three inter-area modes are shown in Fig.9.The calculated probabilities of negative and poor damping of inter-area modes are all zero,so the probability eigenvalue index is not listed here.
Scenario B:(a)With a constant PV power capacity of 1 p.u.,the access capacity of wind power is increased as the capacity of G6 is reduced.(b)With a constant wind power capacity of 3 p.u.,the capacity of PV power is increased as the capacity of G3 is reduced.The expected damping ratio of the three inter-area modes is shown in Fig.10,and the probabilistic eigenvalue index of the inter-area mode 1 is shown in Table 3.
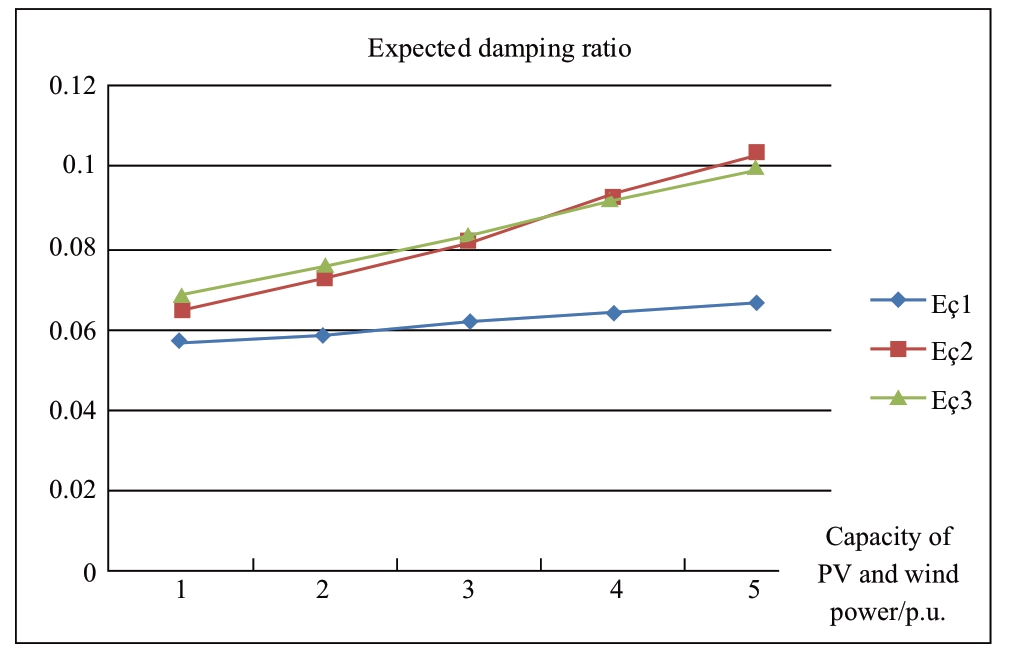
Fig.9 Expected damping ratio in scenario A of the New England system
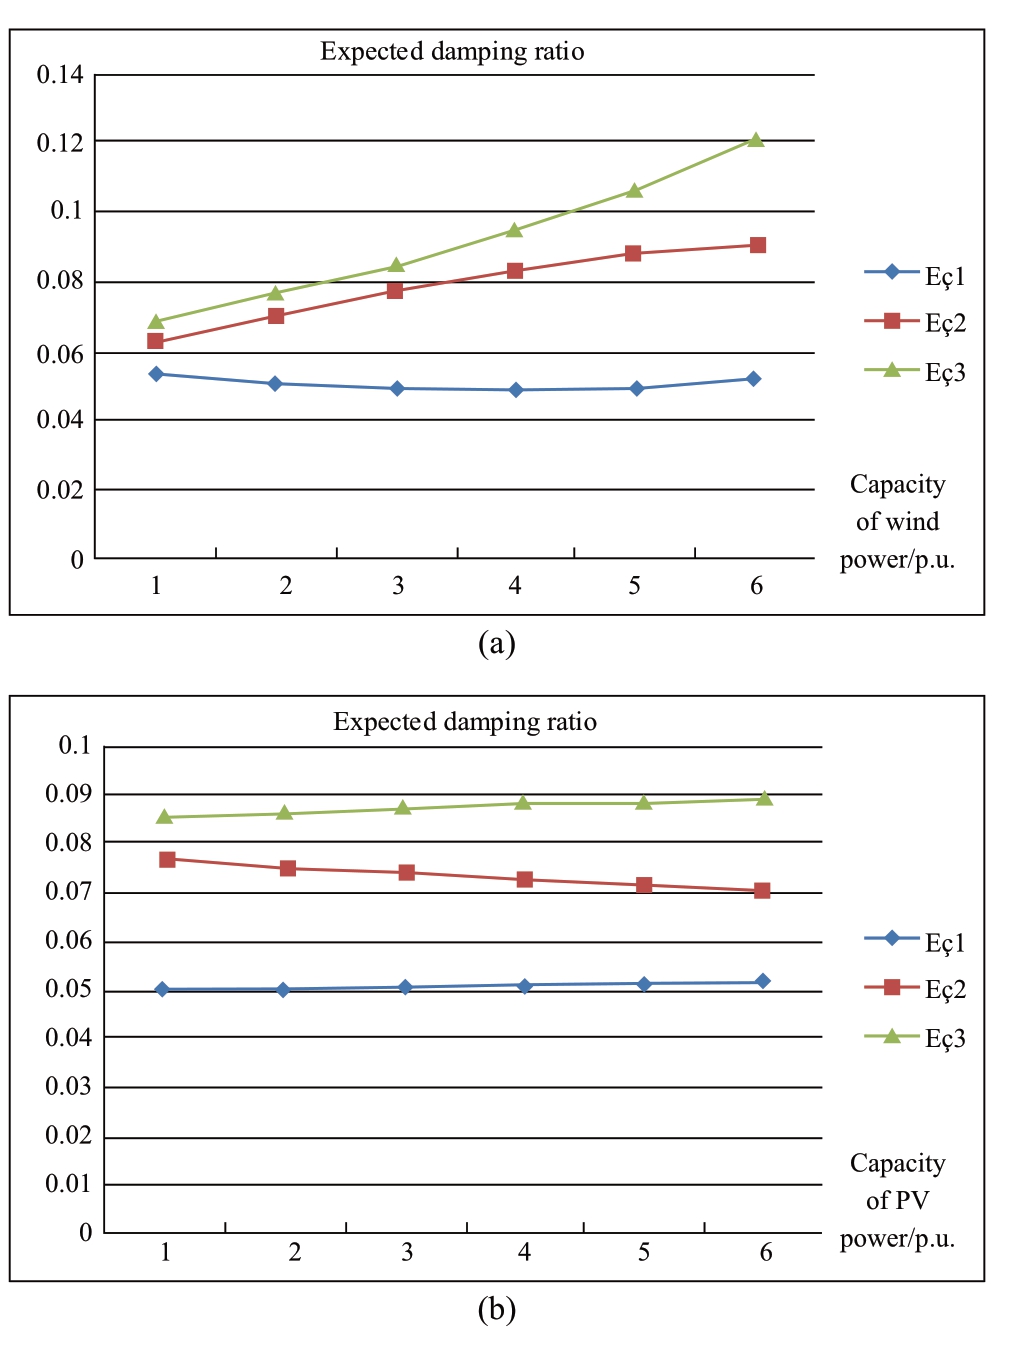
Fig.10 Expected damping ratio in scenario B of the New England system,(a)with a change in wind power capacity and(b)with a change in PV power capacity
As the capacity of PV and wind power increases with a decreasing output of the synchronous units,the expected damping ratio of the three inter-area modes increases gradually(Fig.9).The probabilities of negative and poor damping are all zero.These simulation results confirm the findings of section 5.2.However,if reducing the output of the synchronous units in the actual situation cannot meet the requirements of the economy,a large amount of energy will be wasted.Therefore,part of the synchronous units is typically shut off to increase renewable energy penetration.
Table 3 Probabilistic eigenvalue index of Case2

As the capacity of wind power increases,the expected damping ratio of inter-area mode 1 first decreases then increases(Fig.10),whereas the expected damping ratio of inter-area mode 2 and mode 3 gradually increases.As the capacity of PV power increases,the expected damping ratio of inter-area mode 2 gradually decreases,whereas the expected damping ratio value of inter-area mode 1 and mode 3 gradually increase.A change in the capacity of PV and wind power may have either the same or a different effect on the same mode.As the capacity of wind power increases,the poor damping probability of inter-area mode 1 first increases then decreases.Conversely,as the capacity of PV power increases,the poor damping probability of interarea mode 1 gradually decreases(Table 3).
In summary,shutting off part of the synchronous units to increase renewable energy penetration has more complex effects,which may be beneficial or adverse for the PSSS of the system.This is because,although the additional electromechanical oscillation modes are not added when PV and wind power are connected to the power system,the positive or negative damping torque is provided to the electromechanical oscillation loops of other generators in the system [20].It is therefore affected by many factors such as the location of PV and wind power,access capacity,wind speed,and light intensity.Therefore,it is necessary to determine the influence of PV and wind power integration on the probability of small signal stability based on the results of PSSSA.
6 Conclusions
In this study,we proposed a probabilistic small signal stability analysis algorithm based on the Probabilistic Collocation Method.Using the simulation results of MCS as a reference,the errors of PCM of different orders were analyzed,and the appropriate order of PCM was selected for simulation.We then determined the effects of increasing the renewable energy penetration on the probability of small signal stability by reducing the output of synchronous units and shutting off part of the synchronous units.This analysis involved different examples in the 4-machine 2-area system and the New England system.The following conclusions were drawn:
(1)Compared with the results of MCS,the MSE,errors of expectation,and standard deviation of 3*3 order PCM were all less than 1%.Thus,the computational accuracy requirements were met and the time consumption was much smaller than that of MCS.Therefore,the probabilistic small signal stability(PSSS)of a power system consisting of wind power and photovoltaic power generation can be analyzed by the 3*3 order PCM.
(2)The PSSS of the wind and PV power system was affected by many factors such as access mode,access location,access capacity,wind speed,and light intensity.
(3)The expected damping ratio differed according to the different methods used to increase wind power penetration.Reducing the output of the synchronous generators to increase renewable energy penetration improved the PSSS of the power system.However,shutting off part of the synchronous units to increase renewable energy penetration had both beneficial and adverse effects on the PSSS of the power system.
(4)Shutting off part of the synchronous units to increase renewable energy penetration is typically adopted in the actual situation.In this case,the damping ratio of different modes of the system exhibited different effects with a change of access capacity of PV and wind.Additionally,poor damping and negative damping could occur.Therefore,it is necessary to match the capacity of PV and wind power to prevent the risk of poor damping and negative damping during power grid planning.If poor damping and negative damping cannot be avoided,a damping controller should be installed to suppress low-frequency oscillation.
Acknowledgements
This work was supported by the National Natural Science Foundation of China(NSFC)(No.51577075).
References
[1]Dai H,Wang W,Chi Y(2007)New progress in the research of wind power integration into power system.Power system technology,31(20):16-23
[2]Xue Y,Lei X,Xue F et al(2014)The review on the influence of wind power uncertainty on power system.The Chinese Journal of Electrical Engineering,34(29):5029-5040
[3]Song D,Yang X,Ding Q et al(2011)A summary of the analysis and control method of low frequency oscillation in large-scale interconnected power grid.Power system technology,35(10):22-28
[4]Wang C,Shi L,Yao L et al(2010).Small disturbance stability analysis of large scale doubly fed wind farm.Proceedings of the Chinese Journal of electrical engineering,(4):63-70
[5]Burchett RC,Heydt GT(1978)Probabilistic methods for power system dynamic stability studies.IEEE Transactions on Power Apparatus and Systems 97(3):695-702
[6]Rueda JL,Colomé DG,Erlich I(2009)Assessment and enhancement of small signal stability considering uncertainties.IEEE Transactions on Power Systems,24(1):198-207
[7]Huang H,Chung C,Chan K et al(2013)Quasi-Monte Carlo based probabilistic small signal stability analysis for power systems with plug-in electric vehicle and wind power integration.IEEE Transactions on Power Systems,28(3):3335-3343
[8]Bian X,Huang X,Wong K et al(2014)Improvement on probabilistic small-signal stability of power system with largescale wind farm integration.International Journal of Electrical Power and Energy Systems,Vol.61,pp:482-488
[9]Bu S,Du W,Wang H et al(2012)Probabilistic analysis of small-signal stability of large-scale power systems as affected by penetration of wind generation.IEEE Transactions on Power Systems,27(2):762-770
[10]Yi H,Cheng S,Hou Y(2007)Power system small signal stability probability analysis based on point estimation.Automation of electric power systems,31(23):1-5
[11]Xu X,Lin T,Zha X(2009)Probabilistic analysis of small signal stability of microgrid using point estimate method.In:Proceeding of International Conference on Sustainable Power Generation Supply(SUPERGEN),Nanjing,China
[12]Hockenberry JR,Lesieutre BC(2004)Evaluation of uncertainty in dynamic simulations of power system models:the probabilistic collocation method.IEEE Transactions on Power Systems,19(3):1483-1491
[13]Wu S,Wu W,Zhang B et al(2012)Determination of fitting polynomial order in the evaluation of uncertainty of power system simulation.Power system technology,36(10):125-130
[14] Preece R, Milanović JV(2014)Tuning of a damping controller for multiterminal VSC-HVDC grids using the probabilistic collocation method.IEEE Transactions on Power Delivery,29(1):318-326
[15]Mei F,Pal BC(2005)Modelling and Small-Signal Analysis of a Grid Connected Doubly-Fed Induction Generator.IEEE Power Engineering Society General Meeting,16(3): 2101-2108
[16]Hu X(2011)The probabilistic power flow analysis of distribution network with high penetration of distributed photovoltaic power generation system.Master’s degree thesis of North China Electric Power University,Dec.2011
[17]Sun H,Zhang M,Chen Z et al(2014)General electromechanical transient model of photovoltaic grid connected generation system and its comparison with electromagnetic transient model.Power system protection and control,42(3):128-133
[18]Kundur P,Balu NJ,Lauby MG(1994)Power system stability and control.New York:McGraw-Hill,1994
[19]Yue H(2014)Small disturbance probability stability of power system considering grid connected wind power random fluctuation.Doctoral Dissertation of North China Electric Power University,June 2014
[20]Du W(2011)Graphic interpretation method and its application to the analysis and control of low frequency oscillation in power system,May 2011
[21]Akhmatov V(2005)Induction Generators for Wind Power.Brentwood:Multi-Science Publishing,2005
[22]Liu J,Yao W,Wen J(2017)Small signal stability analysis and control of double-fed induction generator considering influence of PLL and power grid strength.Proceedings of the CSEE,37(11):3162-3173(in Chinese)
Received: 18 December 2018/Accepted: 11 January 2019/Published: 25 February 2019
Wei Yao
w.yao@hust.edu.cn
Cai Yan
caiyan@hust.edu.cn
Linli Zhou
876985387@qq.com,
Jinyu Wen
jinyu.wen@ hust.edu.cn
Shijie Cheng
sjcheng@hust.edu.cn
2096-5117/© 2019 Global Energy Interconnection Development and Cooperation Organization.Production and hosting by Elsevier B.V.on behalf of KeAi Communications Co., Ltd.This is an open access article under the CC BY-NC-ND license(http://creativecommons.org/licenses/by-nc-nd/4.0/ ).
Biographies

Cai Yanreceived his bachelor degree in electrical engineering from Wuhan University,China,in 2018.Currently,he is pursuing the Ph.D.degree in stability analysis and control of renewable energy generations from Huazhong University of Science and Technology(HUST).

Linli Zhoureceived her bachelor and master degrees in electrical engineering from Huazhong University of Science and Technology(HUST),in 2014 and 2017,respectively.She is currently working at UHV AC/DC Transport and Inspection Center of Hubei Electric Power Co.,Ltd,Hubei,China.Her research interests include stability analysis and control of renewable energy generations.

Wei Yaoreceived his bachelor and Ph.D.degrees in electrical engineering from Huazhong University of Science and Technology(HUST),in 2004 and 2010,respectively.He was a post-doctoral researcher in HUST,from 2010 to 2012 and a post-doctoral research associate in the University of Liverpool,from 2012 to 2014.Currently,he is an associate professor in the School of Electrical and Electronics Engineering of HUST.His research interests include power system stability analysis and control,HVDC & FACTS,and renewable energy.
Jinyu Wenreceived his bachelor and Ph.D.degrees both in electrical engineering from Huazhong University of Science and Technology(HUST),in 1992 and 1998,respectively.He was a visiting student from 1996 to 1997 and research fellow from 2002 to 2003 at the University of Liverpool,UK.He was a senior visiting researcher at the University of Texas in 2010.From 1998 to 2002,he was a director engineer in Xinjiang Electric Co.Ltd.in China.In 2003 he started to work in the HUST and now is a professor at HUST.His current research interests include renewable energy integration,energy storage application,DC grid,and power system operation and control.
Shijie Chengreceived his bachelor degree from Xi’an Jiaotong University,in 1967,master degree from Huazhong University of Science and Technology(HUST),in 1981,and Ph.D.degree from the University of Calgary,in 1986,respectively,all in electrical engineering.He has been a professor in HUST since 1991.His research interests are power system control,stability analysis,application of artificial intelligence,and energy storage.Prof.Cheng is a Fellow of the Chinese Academy of Sciences.
(Editor Chenyang Liu)