
1 Introduction
In recent years,installed renewable power generation capacity worldwide,especially that of wind and solar power,has increased rapidly [1].Nevertheless,because of the intermittent and fluctuating characteristics of renewable power generation output,an increase in renewable energy integration into the power grid requires increasing regulating capacities in the power system to ensure efficient operation [2].However,renewable energy systems can be developed on a large scale and connected to the power grid in a relatively short period,compared with the gradual process involved in the development and transformation of existing power systems.There are several methods to increase flexibility of a power system,such as by retrofitting the existing coal-fired power plants,building new pumped storage stations and gas-fired power plants,and using cross-regional power lines to obtain power support from neighboring power grids;each of these methods has different advantages and disadvantages as well as associated costs in terms of renewable energy development.Considering this,several studies have been conducted on integrating renewable energy in and increasing flexibility of power grids [3-7];though some of these works included the costs of regulating measures for future development in their analytical models,in a majority of these studies,appropriate case studies were not undertaken to study the operational costs of a given power system.
Therefore,in this study,three different cases are set up and a time series production simulation analysis model is adopted to study the effects and associated costs of different methods used to improve the flexibility of a given power system to ensure increased renewable energy consumption.
2 Time Series Production Simulation Analytical model
The transition to renewable energy usage has led to an increase in the development and integration of wind and solar energy into power grids.Due to the minute-level fluctuant and intermittent generation output characteristics of wind power and solar power[8],a time-series production simulation model is proposed to study system operational cost in detail.
2.1 Objective function
The incorporation of renewable energy in a power system is determined by certain factors,including maximum system load,daily load curve and peak-valley difference,power source mix,capacity of cross-regional lines,as well as power transmission curve and demand side response of the system,among others.To promote the consumption of renewable energy in lieu of non-renewable energy in a power system with different energy sources,several adjustment methods have been proposed,each of which have their merits and demerits.Here,the objective of the optimization function is to minimize system operational costs.
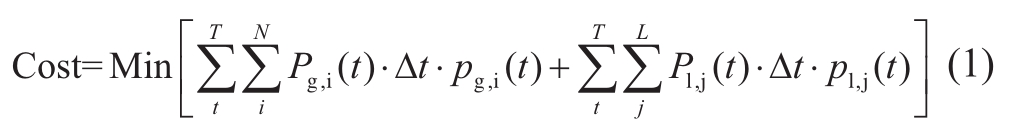
where
Pg,i(t):operational capacity of theith power plant at timet.
pg,i(t):generation cost of theith power plant at timet.
Power generation costs of thermal power plants are primarily determined by investment,maintenance and operational costs,as well as fuel costs.It should be noted that fuel costs change with a change in the load rate.In particular,the higher the load rate is,the lower the fuel consumption rate is.

Fa,i:fixed cost.It consists of investment depreciation,financial expenses,repair costs,wages,and welfare costs,among others.
Va,i:variable cost,excluding fuel cost.It consists of certain material costs that are associated with power generation.
βr,i(t):fuel consumption rate of the thermal power unit at timet.
Qg,i(t):thermal power generation at timet.
Pl,j(t):operation capacity oflth transmission line at timet.
pl,j(t):input electricity cost oflth transmission line at timet.
Δt:time interval considered in the study.
T:total duration of the study,such as one year.
N:other power sources,excluding those of wind and solar power.
L:total number of transmission lines.
2.2 Constraints
2.2.1 Maximum accommodating capacity for wind power and solar power:
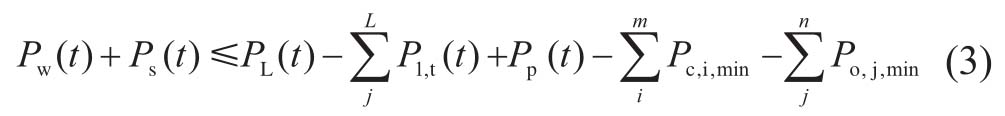
where
Pw(t):wind power capacity in operation at timet.
Ps(t):solar power capacity in operation at timet.
PL(t):system load at timet.
Pp(t):pumping capacity or generating capacity of pumped storage power station at timet.This value will be negative when it’s at the generation state.
Pc,i,min:minimum technical output of theith coal-fired unit.
Po,j,min:minimum technical output of thejth other generator.
m:total number of coal-fired power units in operation.
n:total number of the other units in operation.
2.2.2 Unit commitment constraints:
Unit commitment is a traditional optimization problem[9-11],which can be solved using several methods,such as priority list method,heuristic method,dynamic programming method,and mixed integer programming method [12].In this study,all available generating units are sorted on the basis of their economy and adjusting capacity.In particular,when a system operational constraint,such as power balance constraint is encountered,a unit with good regulation ability,but less economy will advance in its generating order.Then,the priority list method is used to find the optimized solution for unit commitment.The primary constraints of the unit commitment problem that need to be satisfied are as follows:
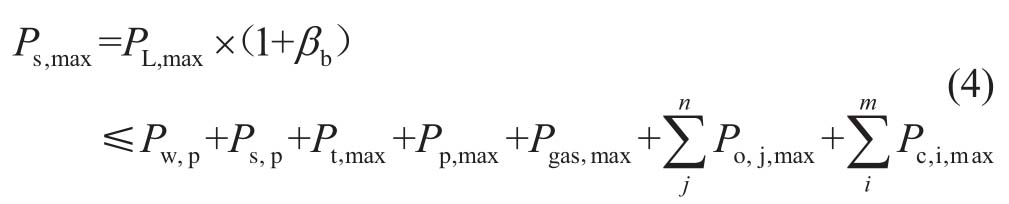
where
Ps,max:maximum capacity required by a research cycle.
PL,max:maximum system load for a research cycle.
βb:reserve factor of electric power system.
Pw,p:capacity credit of wind power,which is the minimum available generation capacity with 95% guaranty.
Ps,p:capacity credit of solar power,which is the minimum available generation capacity with 95% guaranty.
Pt,max:maximum available capacity of the power transmission line.
Pp,max:maximum power generation capacity of pumped storage power stations.
Pgas,max:maximum power generation capacity of gasfired power stations.
Pc,i,max:maximum available capacity of theith coal-fired power unit.
Po,j,max:maximum available capacity of thejth other generator unit.
2.2.3 System electricity balance constraints:
The electricity constraints take into account the balance in any time interval as well as during the study period as a whole:
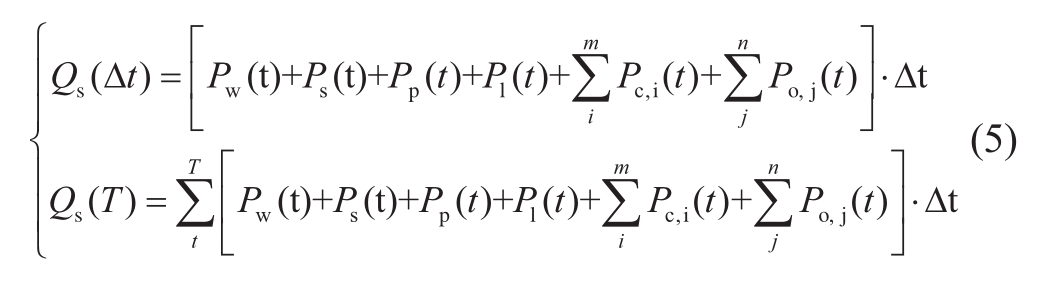
where
Pl(t):transmission capacity of the transmission line at timet.
Qs(Δt):electricity demand of the system during period Δt.
Qs(T):electricity demand of the system during research periodT.
Pp(t):Pp(t)will change between pumping statePp,p(t)and generating statePp,g(t)according to demand.
2.2.4 Electricity balance of pumped-storage power plant:
In each pumping-generating cycle,the total electricity generated must equal to the product of the pumped generation and efficiency coefficient:where
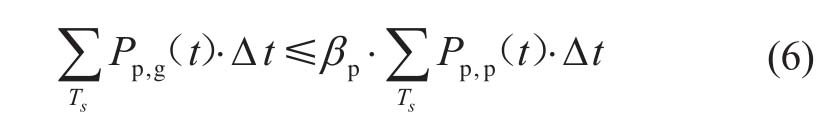
Pp,p(t):pumping capacity of pumped storage power station at timet.
Pp,g(t):power generation capacity of pumped storage power station att.
βp:coefficient of power generation efficiency of pumped storage power plants.
Ts:duration for one pumping-generating cycle,such as a day,week,etc.
2.2.5 Electricity balance of hydropower plant:
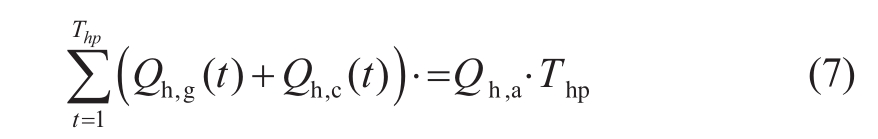
where
Qh,g(t):generation attth time of the period;it is the sum of run-off-river power station and hydropower station with reservoir.
Qh,c(t):curtailment attth time of the period.
Qh,a:theoretical average generation of the period.
Thp:study period for the hydropower plant.
2.2.6 Operational capacity constraints for power units:
The operational output of each unit attth time must be between its minimum technical output and maximum available capacity:
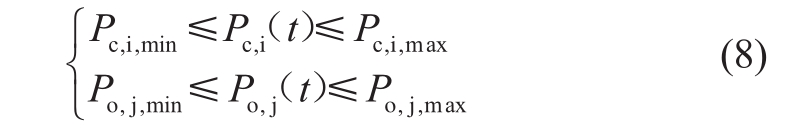
where
Pc,i(t):generation capacity of theith coal-fired unit at timet.
Po,j(t):generating capacity of thejth other unit at timet.
2.2.7 Capacity constraints for transmission lines:
The transmission capacity at timetmust be between the minimum and maximum capacities:
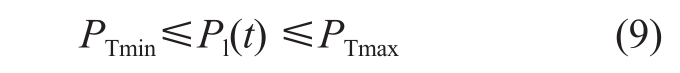
where
PTmax:maximum operational capacity for the transmission line.
PTmin:minimum operational capacity for transmission line.
2.2.8 Ramping rate of generation units:
where
ΔPg,i(t):ramping output of uniti.
ΔPg,max:maximum ramping ability of uniti.
2.2.9 CO2emission constraints:
where
Eco2:total CO2emission.
Eco2,max:CO2emission limit.
Qi,c:electricity generated byith coal-fired units.
Qi,g:electricity generated byith gas-fired units.
Qi,o:electricity generated byith other thermal units.
Kc,c:CO2emission coefficient for coal-fired generation.
Kc,g:CO2emission coefficient for gas-fired generation.
Kc,o:CO2emission coefficient for generation by other thermal units.
2.2.10 Air pollution emission constraints:
where
Eap:total air pollution emissions.
Eap,max:air pollution emission limit.
Ka,c:air pollution emission coefficient for coal-fired generation.
Ka,g:air pollution emission coefficient for gas-fired generation.
Ka,o:air pollution emission coefficient for other thermal units.
2.3 Solution process
As previously mentioned,the proposed mathematical model is solved using the priority list method.All operation units are sorted based on their generation cost and regulating ability to form the priority list.Then,based on some conditions,the backtracking algorithm is used to obtain the optimized solution.
First,system data,such as minute-level load data,minute-level wind power and solar power output data,as well as other installed power capacities and crossregional power transmission curves are inputted in the model simulation.Second,operational capacities for wind power and solar power are subtracted from the original load curve to obtain the net equivalent load curve.Third,unit commitment is determined based on the net equivalent load curve and unit priority list;subsequently,each operating unit is included in the net load curve.Fourth,if regulating balance of the pumped-storage power stations is not satisfied,it will go back to the previous step to adjust either consumption or generation of this kind of power stations,and adjusting the place of other units on the net load curve.Fifth,if regulating balance of the entire system is not satisfied,it will increase the curtailment of wind power and solar power generation,and consequently,modify the net load curve.When all these conditions are satisfied,the optimization result for the system is outputted.
Fig.1 shows the detailed flow chart for the solution process.
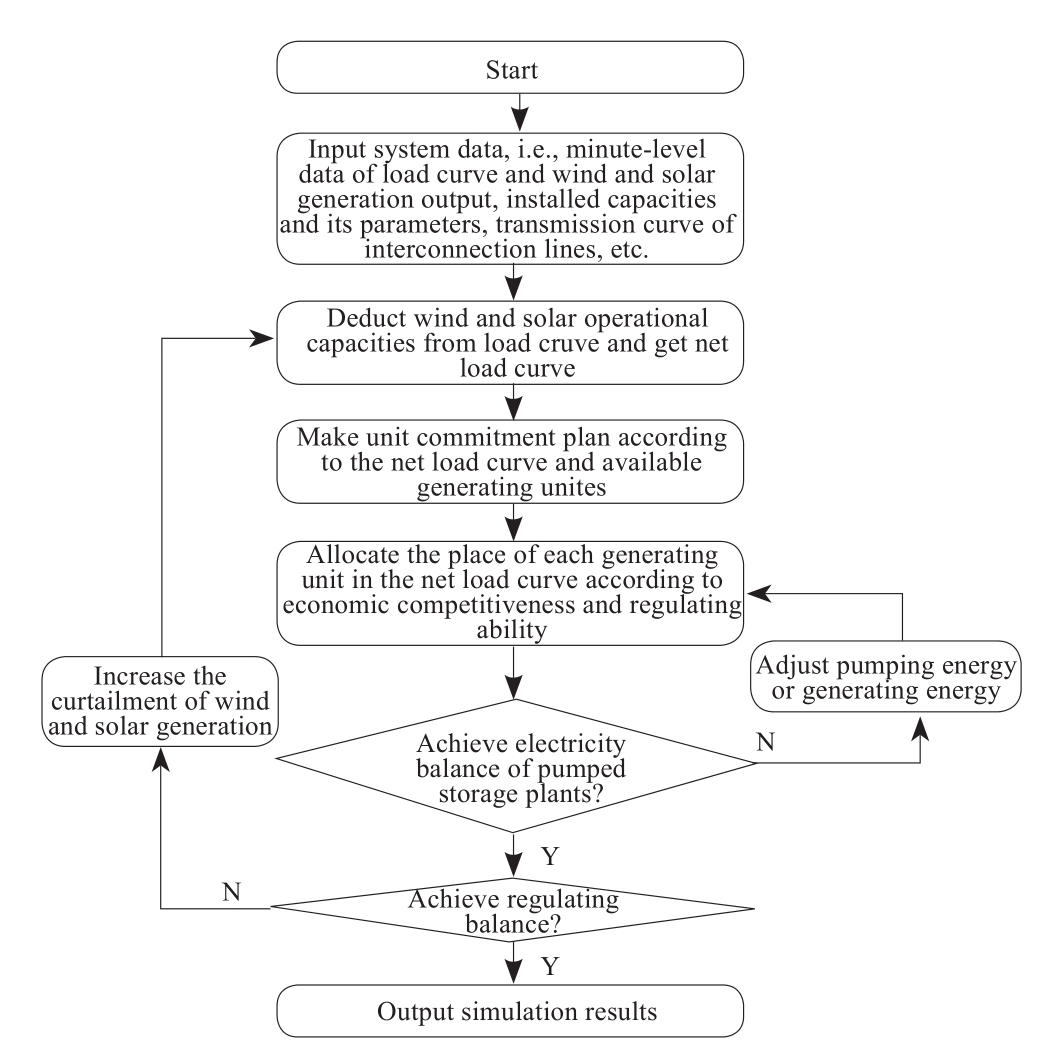
Fig.1 Solution process for the proposed model
3 Case Studies
In this study,a power system with a large-scale electricity import,high thermal power capacity and high renewable penetration is selected as the test system.Three different cases are set up with different development scenarios to study the regulating costs of different measures in accommodating wind power and solar power generation.
3.1 Example system
The example system has a maximum power load of 155 GW,and the forecasted electricity demand is 850 GWh.The total installed power capacity is 156 GW in 2020.The transmission capacity of cross-regional lines is 55 GW.The primary contribution for the generation capacity is from a coal-fired unit,which accounts for 53% of the total electricity generation.Flexible regulating capacities of the system are primarily those from pumped-storage power plant and gas-fired generation units,accounting for 4% and 18% of the electricity generation,respectively.The pie-chart representation of the capacity mix of this example system is depicted in Fig.2.
In terms of changes in the yearly load curve characteristics,the maximum power load was observed in August.Furthermore,the minimum power load in a year occurs in February,which is only 0.51 times the maximum power load.The peak and valley differences of a typical day load curve in summer and winter is 24% and 18.5%,respectively.The typical day load curves of the system for four seasons are shown in Fig.3.
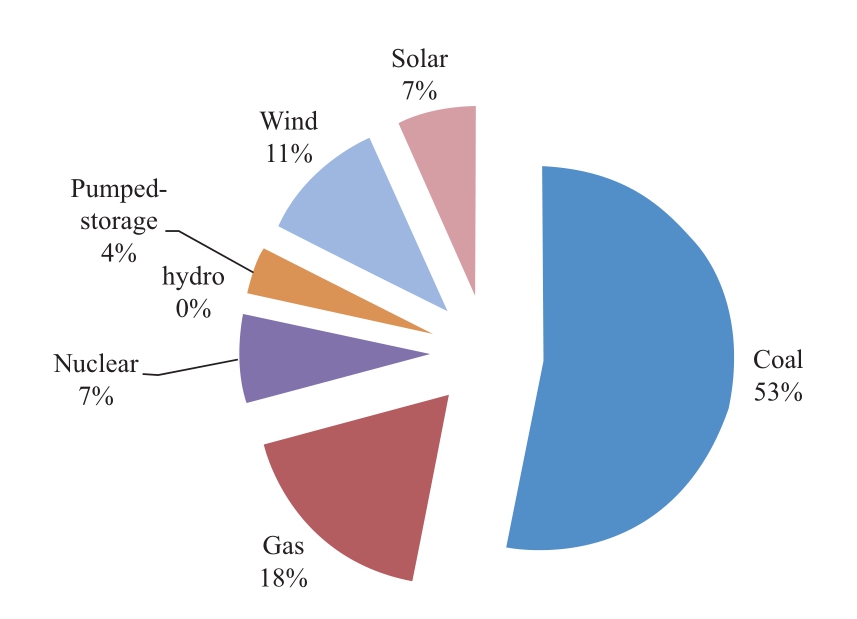
Fig.2 Installed capacity mix of the example system
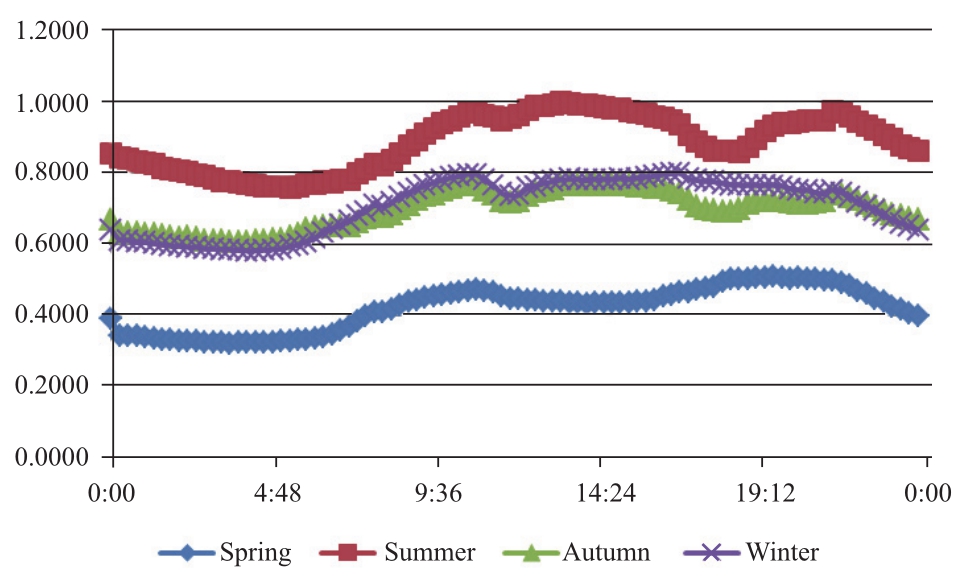
Fig.3 Typical day load curves of the example system during the four seasons
The minute-level outputs of solar power and wind power on a day in the four seasons are shown in Fig.4 and Fig.5.
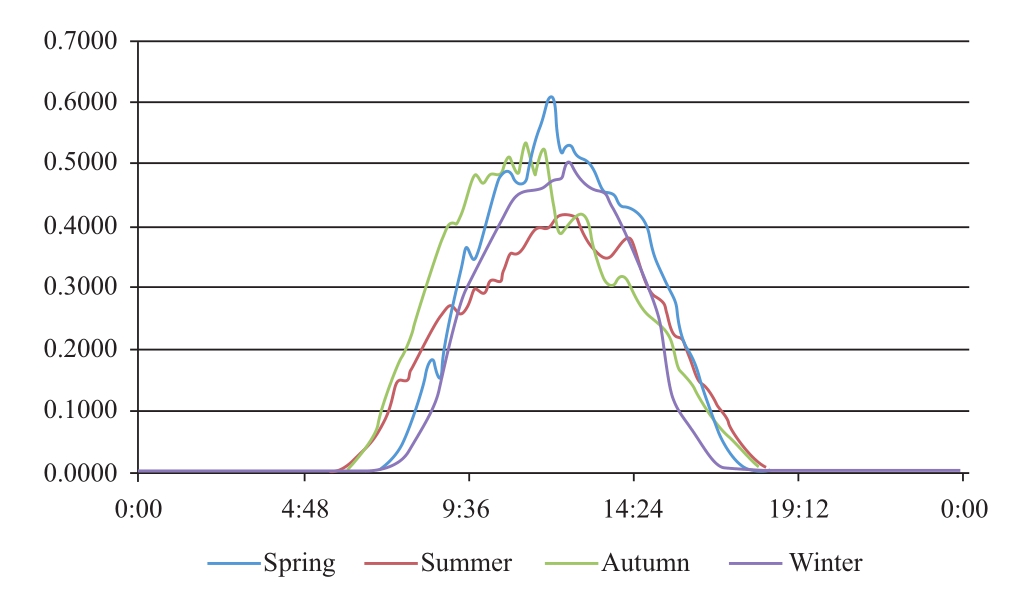
Fig.4 Daily minute-level solar power output for four seasons
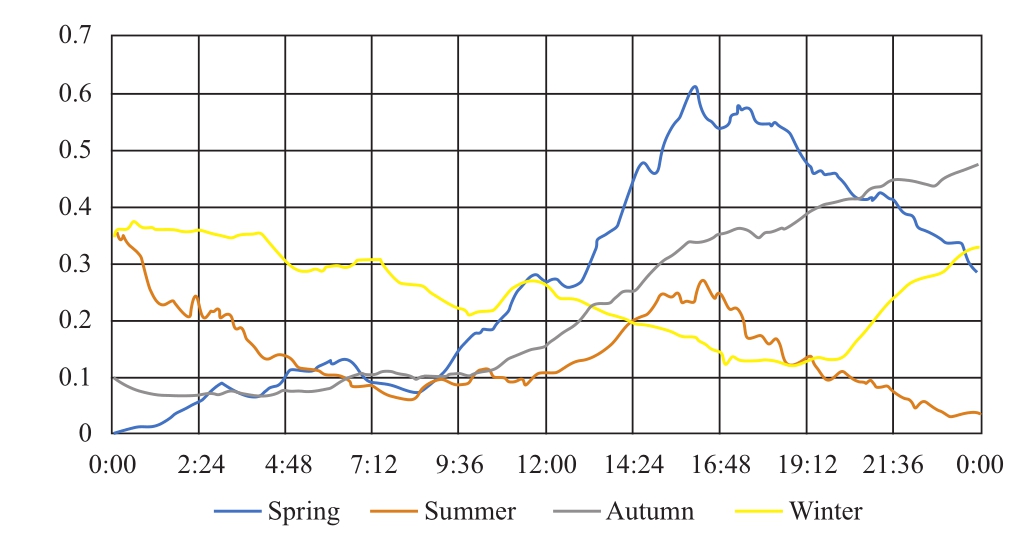
Fig.5 Daily minute-level wind power output for four seasons
3.2 Related parameters
·The average peak-shaving range of the transmission curve is set to 18% in summer and autumn,and 33%in winter and spring.
·The minimum technical output of the combined heat and power unit (CHP)is set to 75%,of the coal-fired unit to 50%,and of the gas turbine unit to 0%,of their rated capacities.
·The retrofitting cost for thermal units is about 150 RMB per kW.After retrofitting,the minimum technical output of the CHP unit can be lowered to 50%,and of the coal-fired unit to 30%.However,the gross coal consumption rate will increase with a decline in output;in addition,a sharp rise in the same will be observed when to the output declines to the minimum technical output range.
·The generation efficiency of the pumped storage power plant is 75%.
Table 1 Related economic parameters of the system
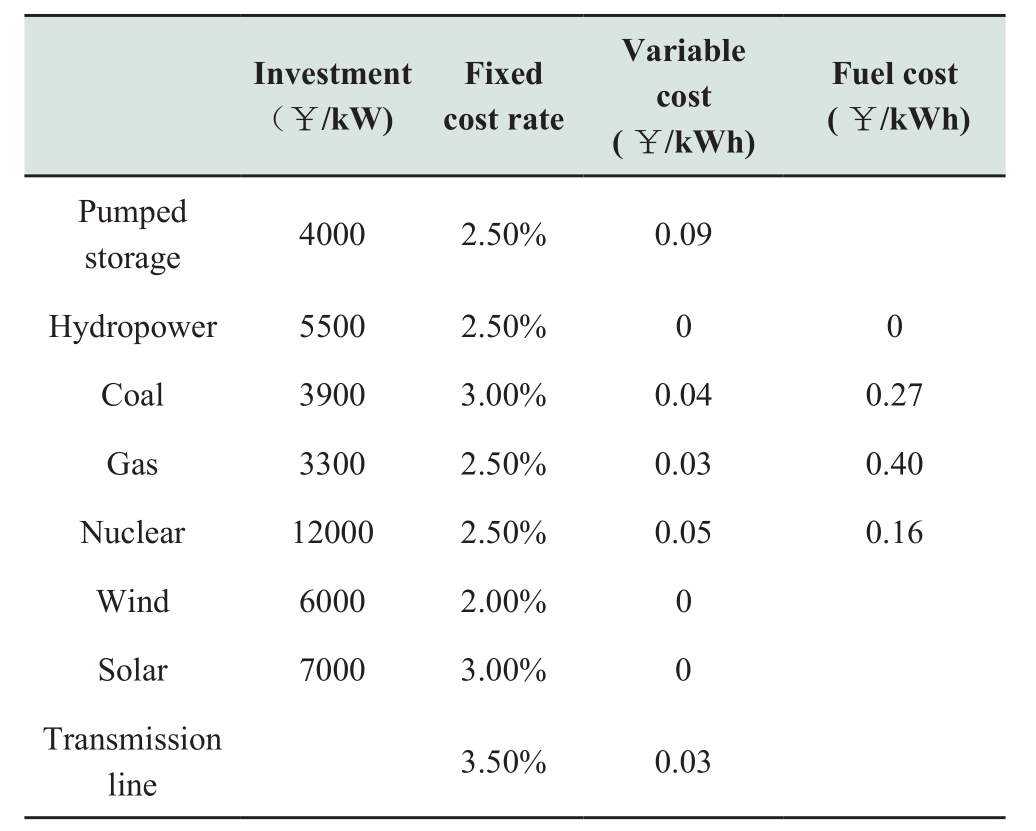
3.3 Simulation and results
To demonstrate the effects and determine the costs of different regulating measures in promoting renewable energy accommodation,we set up the following three cases in our study.
Case 1:Using transmission lines’ regulating capability [13].
Case 2:Building new flexible capacities,such as gasfired and pumped storage plants.
Case 3:Retrofitting and upgrading coal-fired units’regulating ability as well as building pumped storage plants[14].
Based on the yearly load duration curve,in summer,autumn,and winter,it is possible to ensure full consumption of renewable generation due to relatively high load levels if operational priority is given to hydropower,pumped storage units,and gas-fired units,because these units have good adjusting ability to satisfy the peak valley difference of the load curve and handle fluctuation of renewable generation.However,because the lowest load levels occur during spring time,renewable energy consumption is not guaranteed in spring.In particular,simulation results show the curtailment of renewable generation primarily occurred during spring.The simulation result for a typical day in spring is shown in Fig.6.
From Fig.6,it can be observed that,during early hours in a day,such as from 0–6 a.m.,curtailment occurred because the lowest load level and cumulative minimum technical output of the operational units could not be further decreased.In particular,the curtailment of wind power generation was accounted for 16% of the total theoretical generation in a day.
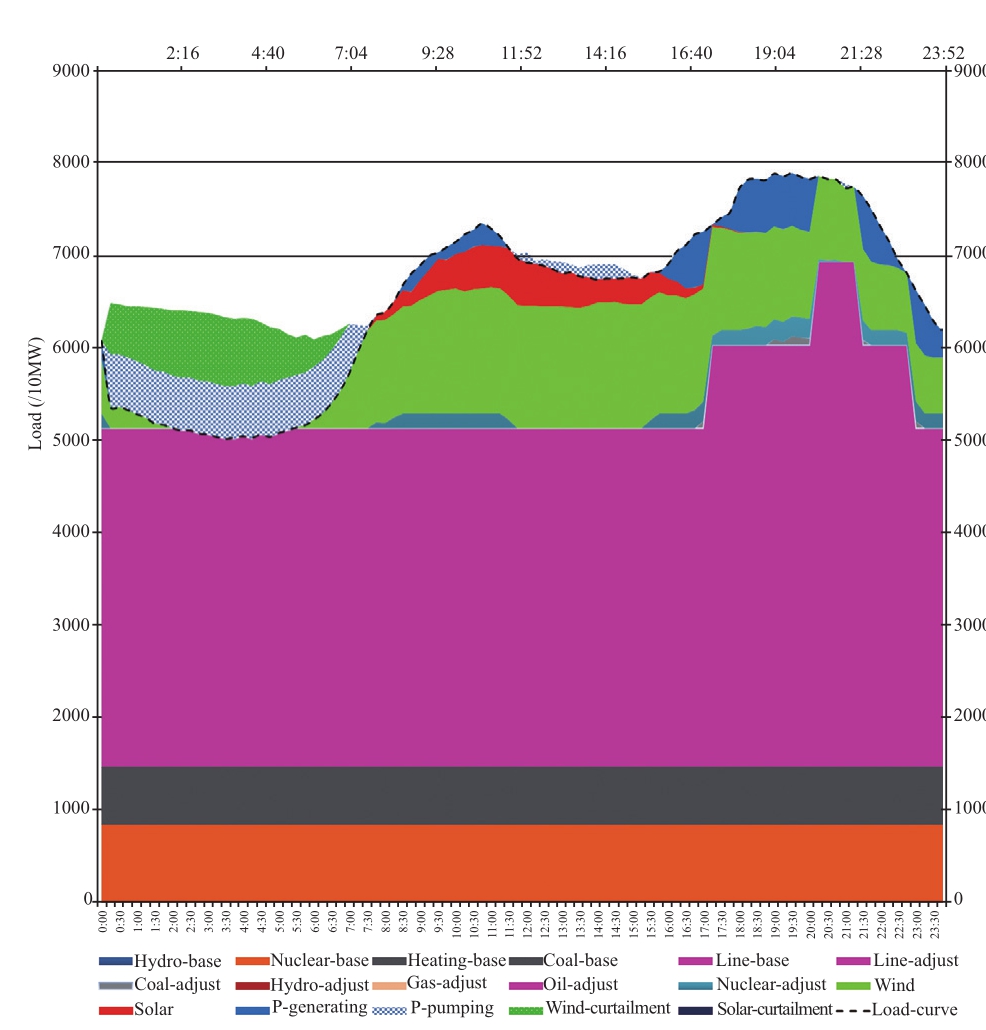
Fig.6 System simulation for a typical day in spring
In Case 1,to eliminate the curtailment of renewable generation during the early morning hours,the peak-shaving range of transmission lines was increased from 33% to 50%of the total capacity.In this manner,the minimum import power from transmission lines decreased about 9.3 GW,and thus,all curtailment could be avoided.In this case,the additional cost incurred by changing the peak shaving depth is considerably small and depends on the connected systems on the other side of the lines.The simulation result for Case 1 is shown in Fig.7.
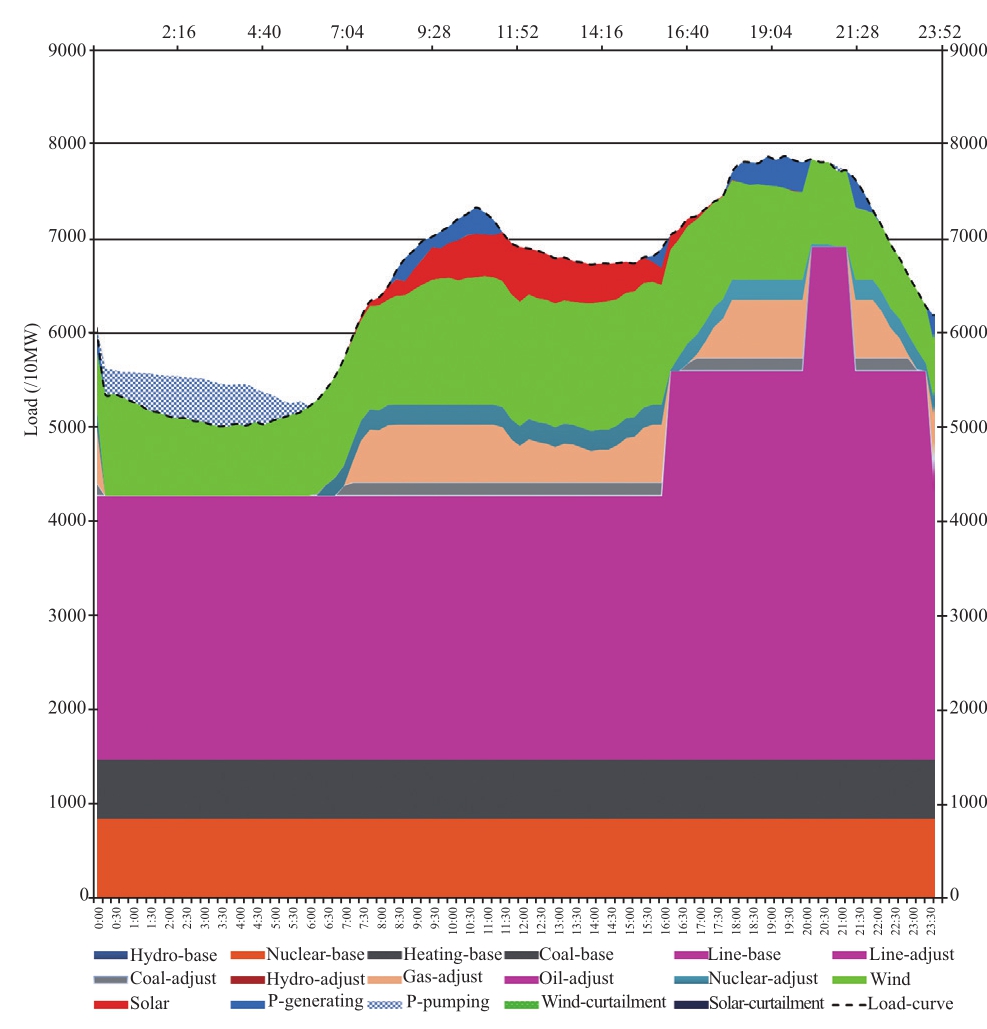
Fig.7 System simulation for a typical day for Case 1
In Case 2,to eliminate curtailment,some gas-fired units and pumped storage units are constructed to add flexible regulating ability to the system.According to the simulation result,gas generation capacity of 5.5 GW and pumped storage capacity of 2 GW was required to eliminate curtailment.The added cost for constructing new generating units is about 26.2 billion RMB.The newly added fixed cost is 0.7 billion RMB,and the sum of variable and fuel costs is about 0.3 billion RMB per year.The simulation result of a typical day in spring for Case 2 is shown in Fig.8.
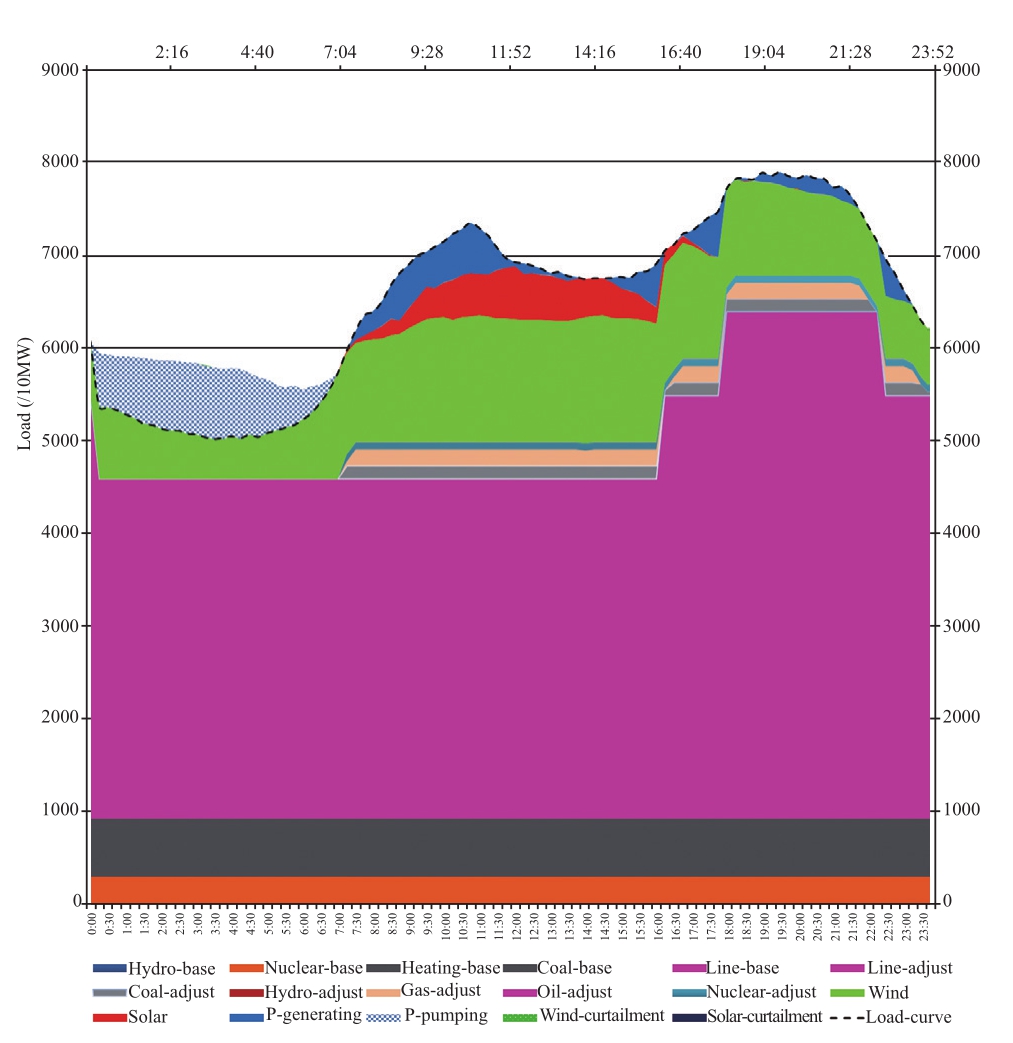
Fig.8 System simulation for a typical day for Case 2
In Case 3,the regulation ability of the coal-fired generation unit is used as the primary measure to solve curtailment problems.According to the simulation result,the minimum technical output for CHP and coal-fired units need to be reduced to 50% and 30%,respectively,using retrofitting procedures.Because of the large capacity of the transmission line and comparatively high base load rate,a 3.5-GW pumped storage power plant is required to accommodate more renewable generation at valley time periods.In this case,the added cost for retrofitting thermal generating units is about 2.2 billion RMB,and the added cost for constructing new pumped storage units is about 14.0 billion RMB.The newly added fixed cost is 0.4 billion RMB,and the sum of variable and fuel costs is about 0.27 billion RMB per year.The simulation result for Case 4 is shown in Fig.9.
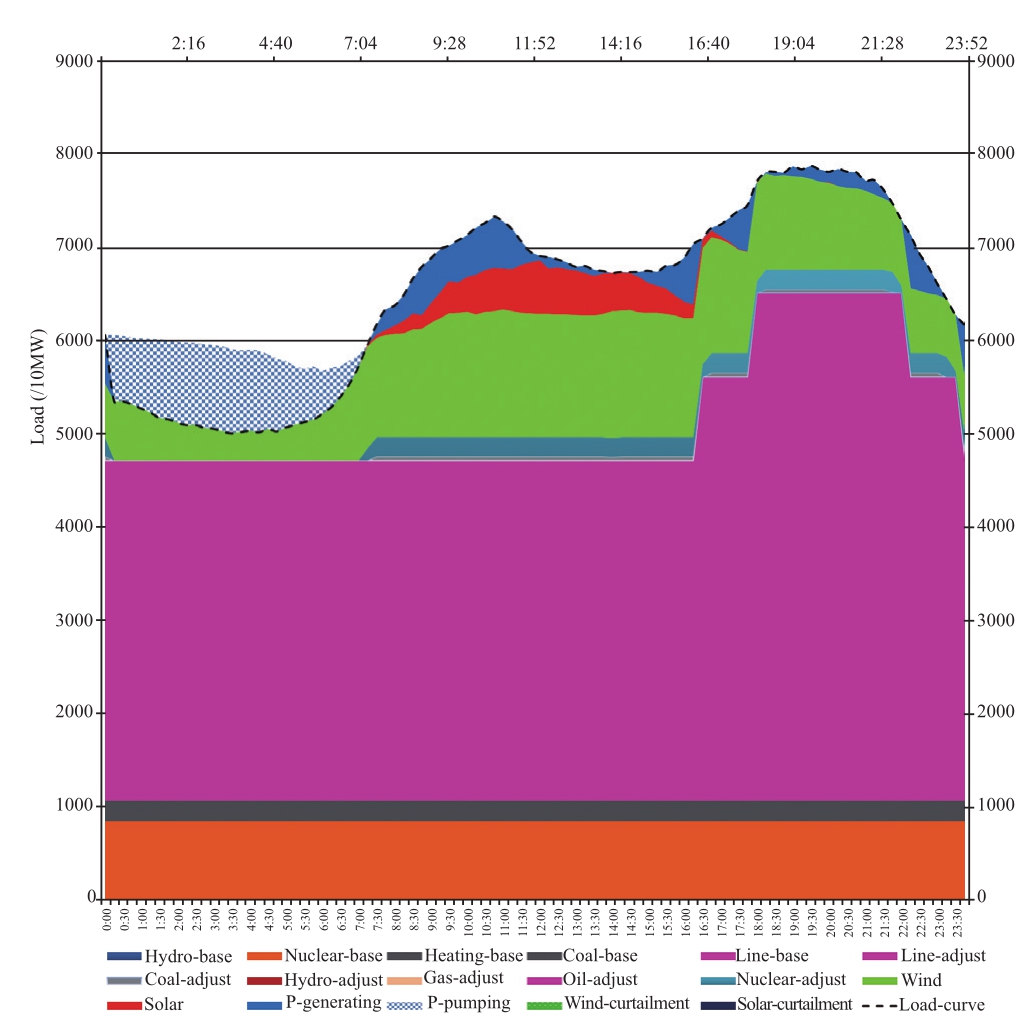
Fig.9 System simulation for a typical day for Case 3
4 Conclusion
Based on our simulation results,all three cases considered in our study fulfill the goal of eliminating renewable curtailment during the early morning hours in spring;however,the system investment as well as operational and maintenance costs in Case 1 are the lowest compared with the other two cases.Furthermore,the total cost of Case 2 is lower than that in Case 3.Thus,considering the rapid growth of renewable energy development in the world,to increase cross-regional transmission line capacity,transmission line regulation in receiving areas might be an effective and economical method to enhance system flexibility in order to integrate more renewable energy sources into the power system.Furthermore,in large-scale electricity receiving areas,retrofitting thermal power units is not sufficient to accommodate renewable generation at valley times in the load curve,and additional pumped storage plants are required to reduce curtailment during such times by raising the equivalent system load.
Acknowledgements
This work was supported by National Key Research and Development Programe of China (No.2018YFB0904000);the State Grid Science &Technology Project (Title:Northeast Asia Power Grid Interconnection Feasibility Study).
References
[1] International Renewable Energy Agency.Renewable Capacity Statistics,2018
[2] Saifur R,Manisa P (2011)Operating Impacts and Mitigation Strategies with Large-scale Wind Power Penetration in the Unite State.Automation of Electric Power Systems,35(22):3-11
[3] Lannoye E,Flynn D,O’Malley M.Transmission (2015)Variable generation,and power system flexibility.IEEE Transactions on Power Systems,30(1):57-66
[4] Holttinen H,Tuohy A,Milligan M et al (2013)The flexibility workout:managing variable resources and assessing the need for power system modification.IEEE Power and Energy Magazine,11(6):53-62
[5] Lu Z X,Li H B,Qiao Y (2017)Flexibility Evaluation and Supply/Demand Balance Principle of Power System With Highpenetration Renewable Electricity.Proceedings of the CSEE,37(1):9-19
[6] Bouffard F,Nosair H (2017)Flexibility envelopes for power system operational planning.IEEE Transactions on Sustainable Energy,6(3):800-809
[7] Zhao J Y,Zheng T X,Litvinov E (2015)A unified framework for defining and measuring flexibility in power system.IEEE Transactions on Power Systems,31(1):339-347
[8] Shu Y B,Zhang Z G,Guo J B et al (2017)Study on Key Factors and Solution of Renewable Energy Accommodation.Proceedings of the CSEE,37(1):1-8 (in Chinese)
[9] Liu F,Pan Y,Yang J F et al (199)Unit Commitment Model for Combined Optimization of Wind Power-Thermal Power-Pumped Storage Hydro.Proceedings of the CSEE,35(4):766-775
[10] Yajvender P V,Ashwani K (2011)Economic-emission unit commitment solution for wind integrated hybrid system.International Journal of Energy Sector Management,5(2):287-305
[11] Wang Y,Xia Q,Kang C Q (2011)Unit commitment with volatile node injections by using interval optimization.IEEE Transactions on Power Systems,26(3):1705-1713
[12] Chen H Y,Wang X F (1999)A Survey of Optimization-based Methods for Unit Commitment.Automation of Electric Power Systems,23(4):51-56
[13] Liu Z Y,Zhang Q P,Dong C et al (2014)Efficient and security transmission of wind,photovoltaic and thermal power of large-scale energy resource bases through UHVDC projects.Proceedings of the CSEE,34(16):2513-2522
[14] Liu J Z,Zeng D L,Tian L et al (2015)Control strategy for operating flexibility of coal-fired power plants in alternate electrical power system.Proceedings of the CSEE,35(21):5385-5394 (in Chinese)
2096-5117/© 2019 Global Energy Interconnection Development and Cooperation Organization.Production and hosting by Elsevier B.V.on behalf of KeAi Communications Co.,Ltd.This is an open access article under the CC BY-NC-ND license (http://creativecommons.org/licenses/by-nc-nd/4.0/ ).
chaofeng81@126.com
Chao Feng
zhangyantao@epri.sgcc.com.cn
Yantao Zhang
zhangyuhong@epri.sgcc.com.cn
Yuhong Zhang
7519216 @qq.com
Fan Liu
youpeiyu@chinasperi.sgcc.com.cn
Peiyu You
zhangdong@sgeri.sgcc.com.cn
Dong Zhang
Received:13 September 2018/ Accepted:30 October 2018/ Published:25 December 2018
Biographies
Dong Zhangreceived his Ph.D.degree in High Voltage Engineering and Insulation Technology from the School of Electronic Information and Electrical Engineering of the Shanghai Jiao Tong University in 2007.He is currently working as a senior researcher in the State Grid Energy Research Institute of the SGCC,China.His interest areas for research include,but are not limited to,global energy interconnection,enterprise development strategy,power system planning and economic analysis,coordination development between traditional power sources and renewable energy power sources,and international power cooperation,etc.

Peiyu Youreceived his master degree in electrical engineering from the college of electrical engineering of Zhejiang University in 2013.He is working as a researcher in the State Grid Economic and Technological Research Institute Co.,Ltd.of the SGCC,China.His research areas contain but not limited to power system planning and economic analysis,global energy interconnection,Voltage Source Converter based High Voltage Direct Current Transmission (VSC-HVDC),etc.

Fan Liureceived his master degree in Software Engineering and master in Finance from Huazhong University of Science and Technology in 2006.After graduation,he worked at State Grid Hubei Electric Power CO.LTD.He is now a Director of General Duty Room and Secretary of Operation Management.

Yuhong Zhangreceived her master degree in electric power system and automation from the department of electric power engineering of North China Electric Power University in 2011.She is a senior engineer at China Electric Power Research Institute.Her research areas contain but not limited to power system analysis and power grid planning.

Yantao Zhangreceived his master degree of electric power system and automation from Xi’an Jiaotong University in 2005.He is working as a research fellow engineer at China Electric Power Research Institute.His research areas contain power system modeling,simulating and planning.

Chao Fengreceived his bachelor degree at Tianjin Foreign Studies University,Tianjin,China,in 2006.He is working in SINOHYDRO Bureau 14 company,and as the Representative of Power China and SINOHYDRO at Antananarivo,101,Madagascar.His research interests include renewable energy,hydropower engineering,etc.