
1 Introduction
In recent years,large-scale power outages caused by extreme natural disasters have become more frequent and have caused huge losses to society and economy [1].A distribution power grid makes the power distribution network resilient.The resilience of a distribution power grid is defined as its ability to restore service to critical loads in the shortest time after an extreme natural disaster[2,3].Enhancing the resilience of the distribution power grid includes three aspects:preventive measures before the occurrence of extreme weather,rapid response strategies under extreme weather,and restoration measures after extreme weather.This paper is concerned with the last aspect.
The rapid restoration of the traditional distribution system has been extensively researched [4-8].Nevertheless,power outages due to natural disasters have unique features.Multiple faults may occur and trigger widespread blackouts or the substations may collapse so that the main grids cannot supply power to the distribution systems.It cannot be recovered by reconfiguration of the distribution network in a short time.To improve the grid resilience,new service restoration techniques are required to reduce the outage duration and protect critical loads.
Microgrids are considered an effective and reliable solution for ensuring stable power supply to consumers and integrating distributed energy resources [9].When a permanent fault occurs on its neighboring feeder,a microgrid can isolate itself from the grid and serve its local load using its distributed generators (DGs).The authors of [10] reported that microgrids could be used as an emergency power supply to critical loads under extreme event conditions to improve the resilience of the distribution power grid.Presently,the application of a microgrid in a power distribution system to achieve rapid power recovery after extreme natural disasters and thus enhance the resilience of the distribution network has not been adequately researched.References[11] and [12]used the microgrid to supply power to critical loads in the distribution power grid.The shortest path method was used to locate the path from the microgrid to the critical load to achieve maximum load recovery.In [13],the distribution network was split into multiple microgrids for optimal scheduling and self-healing,which increased the resilience of the distribution power grid.In [14],the use of a microgrid network was proposed to shorten the power outage time in the distribution network after a disaster and effectively enhance the resilience of the distribution power grid.
When multiple faults occur,the power supply from the main grid to the distribution system is interrupted.This paper uses existing microgrids in the distribution system to supply power to critical loads on faulty feeders.The importance of the load in the distribution power grid is quantified by the analytic hierarchy process (AHP).The output model of the microgrid is established to resolve the uncertainty in the distributed generation output.A power supply recovery model for the distribution power grid is established under constraints.The distribution power grid recovery model is generally NP-hard and computationally expensive.Piecewise linearization is used to address the distribution system power flow constraints.Then,the recovery model of the distribution network is converted from general programming into mixed integer programming(MIP)as opposed to the original nonconvex program.A modified 33-node distribution system is used to validate the proposed method.
The remainder of this paper is organized as follows.In Section 2,the importance of the load of the distribution power grid is quantified and the load restoration problem is formularized.Section 3 describes the piecewise linearization.Section 4 discusses the simulation results of the IEEE 33-node distribution system.The conclusions are presented in Section 5.
2 Problem Formulation
The power supply capacity of the microgrid is limited after the occurrence of an extreme disaster.Research on resilience enhancement strategies focuses on maintaining power supply to critical loads in such situations.The AHP can quantify the importance of load nodes according to the actual situation,identify the critical load nodes,and provide a direction for developing a strategy to enhance the distribution power grid resilience.
2.1 Weighting of Load Based on AHP
2.1.1 Index System Construction
The index system is composed of a series of indicators that can reflect the essential attributes or characteristics of the evaluated object and the basis for evaluating the research object [15].The distribution power grid index system is constructed according to the principles of the AHP.From the top to the bottom,the indicator layers are O = {Weight of the load of the distribution power grid},A = {Level 1 load,Level 2 load,Level 3 load},B = {node contraction network aggregation,node ingress,controllable load proportion}.The load level can directly affect the weight of the load in the distribution power grid.Therefore,it is used as a second layer indicator.The parameters of the load nodes at various levels have considerable influence on their weights.Accordingly,the third layer indicators are node contraction network aggregation,node ingression,and controllable load proportion.
2.1.2 Evaluation Model
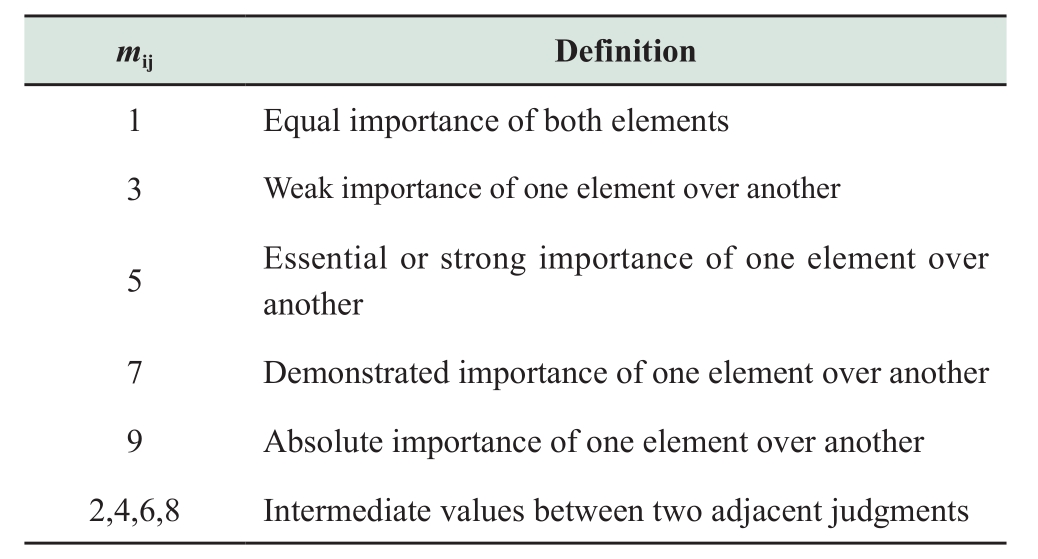
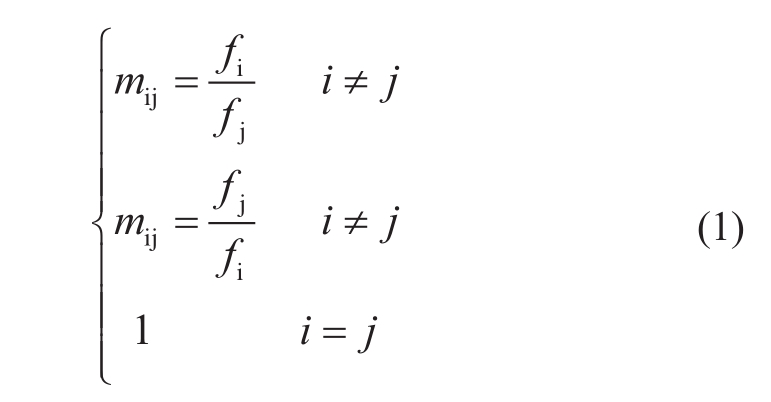
The index of a certain level is set asF=[f1,f2,…,fn] and the importance offiandfjis compared to a certain index in the upper level.The value ofmij,calculated asfij=fi/fj,is represented by the numbers 1–9 and their reciprocals.The definition of each value in the scale is shown in Table 1.
Table 1 AHP scale definition
Finally,the judgment matrixMis formed,the elements of which are defined as follows.
2.2 Recovery Model
A conceptual resilience curve associated with an extreme event,as shown in Fig.1,has been proposed in[16].The time period associated with the event is divided into several subintervals.The corresponding states of the distribution system are also de fined.In Fig.1,F(t)denotes the function for the system performance.The system states include event progress (t1 to t2),post-event degraded state(t2 to t3),restoration state (t3 to t4),post-restoration state (t4 to t5),and infrastructure recovery (t5 to t6).
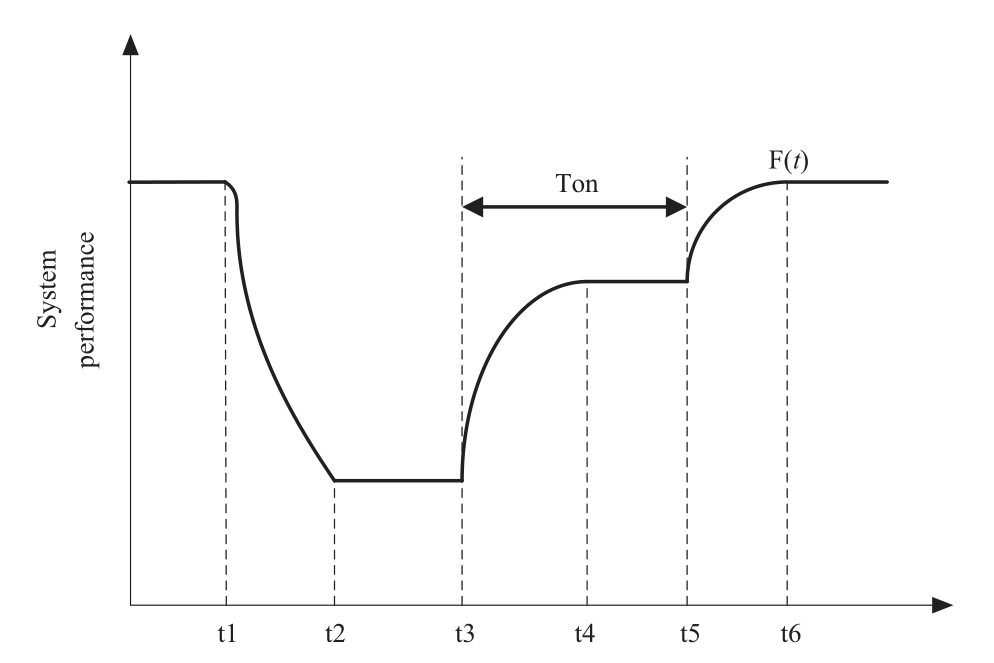
Fig.1 A conceptual resilience curve associated with an extreme event
2.2.1 Objective
The time period relevant to our paper is t3 to t5 (Ton),i.e.,the restoration state and post-restoration state,during which the restoration strategy is applied.In the actual recovery process,Toncan be determined by the distribution system dispatch center according to the actual situation.The resilience of a distribution power grid can be defined as the area of the system’s performance over a specific period of time,as follows:
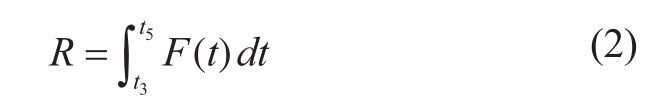
whereRis the resilience metric for the period [t3,t5].
Increasing the resilience of the distribution power grid is equivalent to increasing the value ofR.F(t)is regarded as the product of the load and its corresponding weight at timet.
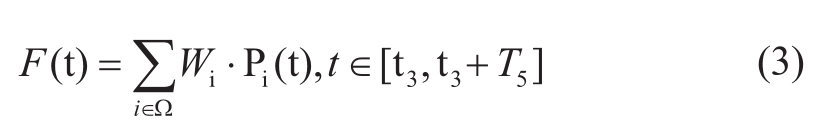
where Ω is the set of restored buses;Wiis the weight of the loadiand represents its level of priority.
For the discretization of total research time,Tonis divided intoNdiscrete time periods.The step length of each time period isH=Ton/N;therefore,the resilience of the system can be expressed as
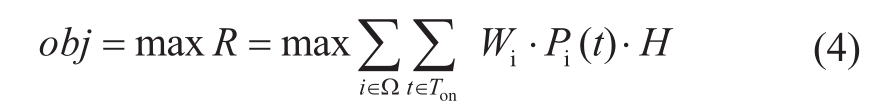
Ris the total energy supplied to the loads weighted by their priority and maximizingRis selected as the objective.
2.2.2 Constraints
The following are the distribution system power flow constraints.
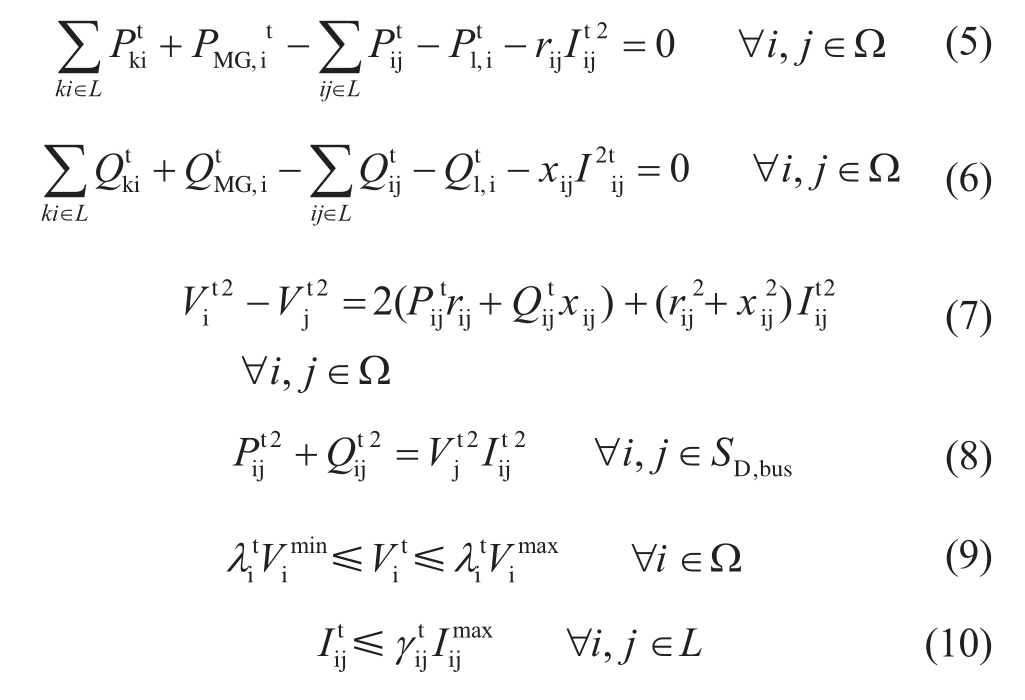
Constraints (6)and (7)represent the active and reactive power balance constraints respectively.L is the set of lines. is the power supplied by the microgrid at timet.
 ,
, and
and i,
i, are the active and reactive power at timetat the inflow and outflowinodes respectively
 represent the active and reactive power of the load node at timetrespectively.
 and
and are the decision variables for the switch state of the load nodeiand for the switch state of the feederijrespectively.
The microgrid output constraints are as follows:
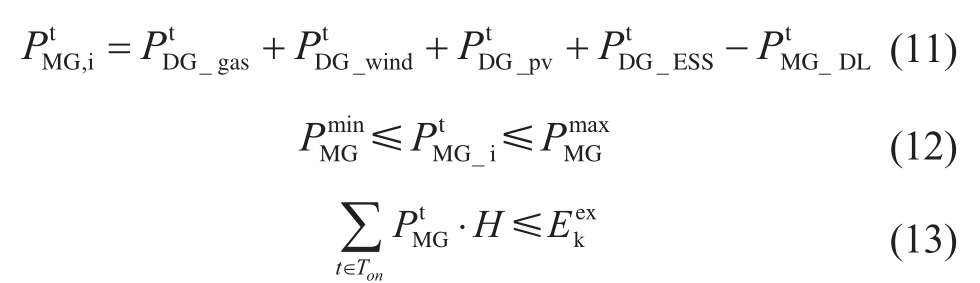
where

 andPare the output DG_ESS,t power of the gas turbine,output power from wind generation,output power from PV generation,and energy storage at timetrespectively.
 is the upper limit of the amount of energy that microgridkcan provide to its external loads.
The topological constraint is

wheregis the topology after outage recovery.A radial network structure should be maintained.Grepresents the permissible radial topology sets.
The controllable load constraints are
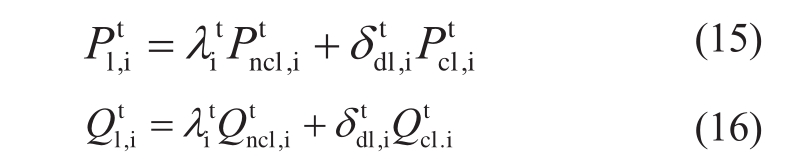
The sustainable power capacity constraints are
During the time period considered in the analysis,equations (17)and (18)can ensure that the load receives continuous power supply.
3 Optimization Model
The commonly used power flow constraint model is a linear DC power flow model,which ignores reactive power constraints and voltage fluctuations.Therefore,this paper uses the DistFlow power flow model for a radial distribution power grid.Piecewise linearization is used to deal with the distribution system power flow constraints.

where is the rated voltage of the distribution power grid node.On the left side of equation (9),VD,jis replaced by
 ,and constraint (9)can be simplified to equation (20).
The voltage of the distribution network nodes should meet the constraint condition in equation (10).Because the voltage amplitude interval is narrow,the error in the simplified method of introducing the node voltage constant in equation (19)is relatively small.
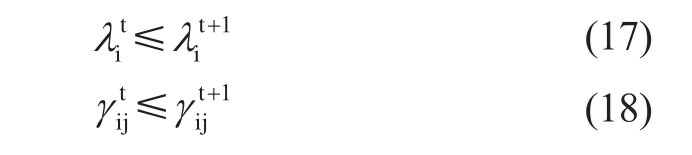
Based on equation (20),a piecewise linear function is used to approximate the squ ared term of the variable.In the piecewise linear function,is the upper limit value of the variabley,and
 is the discrete segmentation number of the piecewise linear function.
The definition and specific approximation process of the piecewise linear approximation function can be referred from [17].
After the above processing,the original model can be transformed into an MIP problem.The CPLEX solver can be invoked on the MATLAB platform for arriving at an effective solution.
4 Simulation and Results
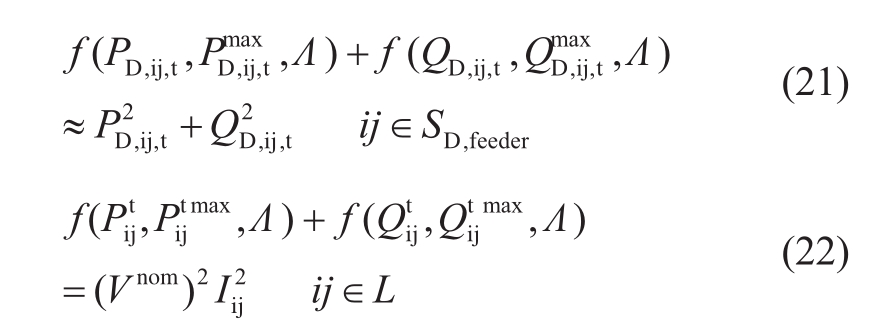
In the modified 33-bus distribution system,two microgrids are connected to the distribution power grids.The substations are at fault due to a disastrous event,as shown in Fig.2.The system parameters are shown in Table A1 in the appendix.The load node weight is obtained according to the AHP based on the actual situation.The load nodes 9,17,21,and 28 are critical.The actual daily output curves of wind power and photovoltaic power are shown in Fig.B1 in the appendix.The total study duration isTon= 2 h and the step length is 5 min.
Fig.2 IEEE 33-bus test system
Owing to the limited capacity of the microgrid,it is important to prioritize the power supply to critical loads.The following is an analysis of the optimization of power distribution system restoration schemes under four scenarios,where different load weights and different microgrid power outputs at different time points within 24 h of a day starting at 00:00 are discussed.
Scenario 1:The extreme event occurs at 02:00;the available wind power output is low,the available photovoltaic power is zero,and the initial value of the SOC(state of charge)is set to 0.9.
Scenario 2:The extreme event occurs at 14:00;the available wind power output is high,the photovoltaic power available is higher than the available wind power output,and the initial value of the SOC is set to 0.2.
Scenario 3:The extreme event occurs at 14:00;the available wind power output is high,the photovoltaic power available is higher than the available wind power output,and the initial value of the SOC is set to 0.9.
Scenario 4:The extreme event occurs at 2:00.The load weight is disregarded,i.e.,each load node has the same degree of importance.At this time,the available wind power output is low,the photovoltaic power available is zero,and the initial value of the SOC is set to 0.9.
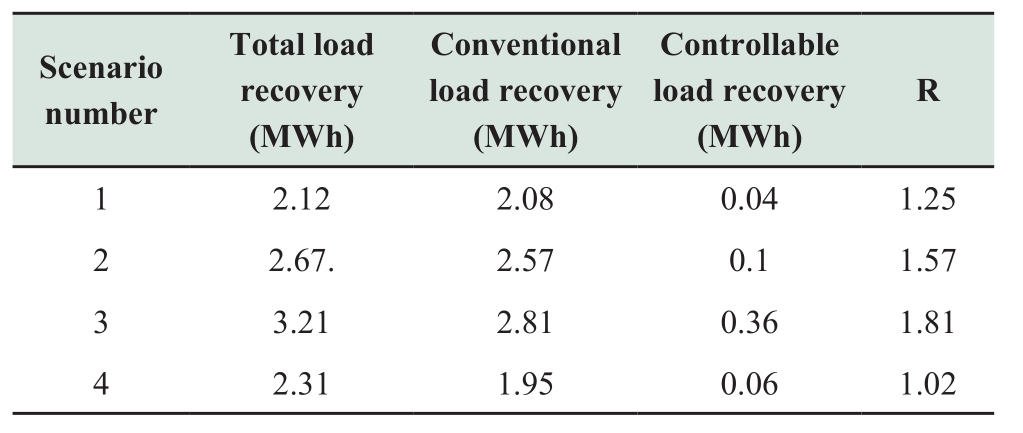
Table 2 Optimized results of the distribution system under different restoration schemes
In the recovery scenario,the black solid load point represents the load point recovered att=0,the red solid load point represents the load point recovered within the time period [t,t+T],and the unshaded load point represents the unrecovered load node.
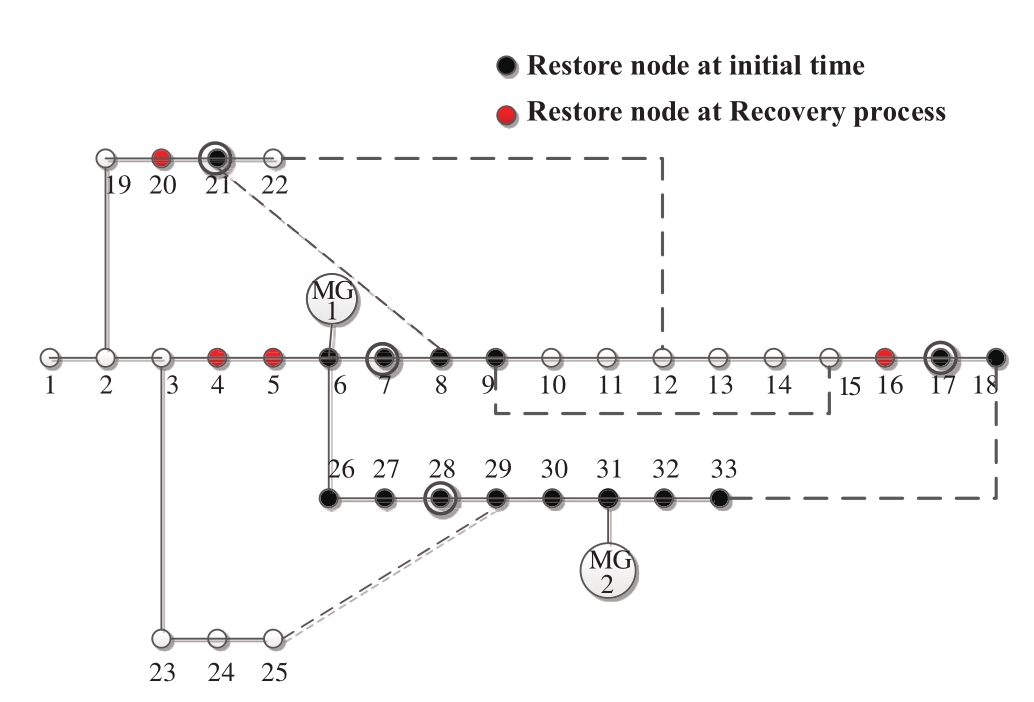
Fig.3 Restoration plan for scenario 1
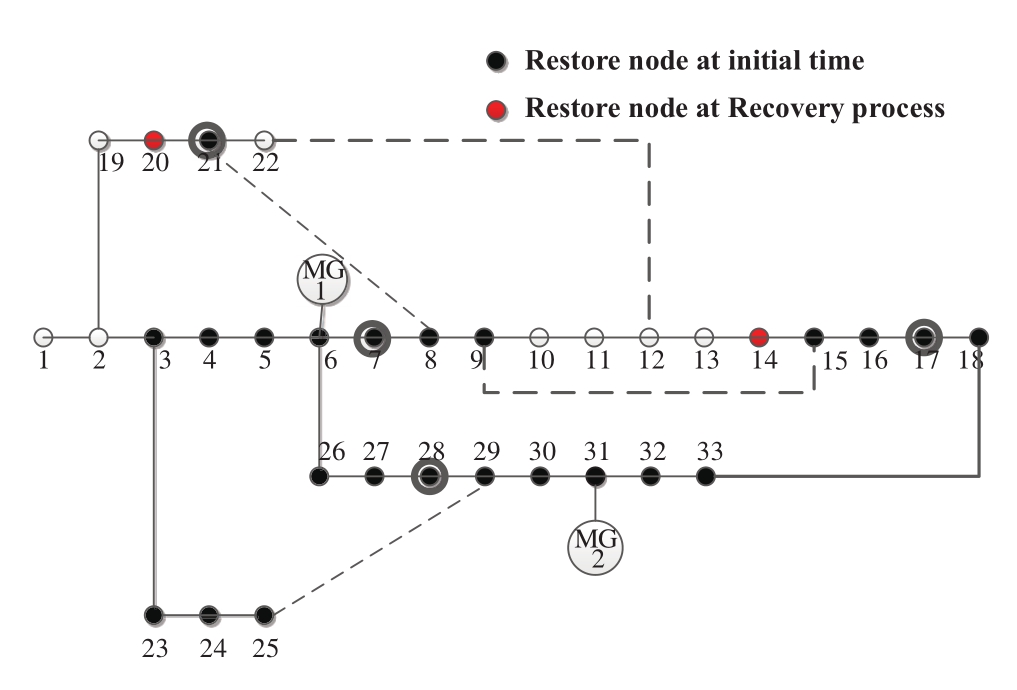
Fig.4 Restoration plan for scenario 2
From Table 2,we can see that for the different outputs of the microgrid,the restoration periods are very different.When the wind power output is low and the PV output is 0,the recovered load is relatively small,which can also ensure the continuous supply of power to key loads based on load node weights.Scenario 4 does not consider the importance of the load node.In comparison with scenario 1,the critical load node 17 does not receive continuous power supply,which may cause heavy losses.
The main role of the controllable load in the model proposed in this paper is to stabilize the volatility of the power output from the microgrids.It can be seen that the controllable load recovery in scenario 1 and scenario 4 is obviously smaller than in the other two scenarios because the power supply capacity of the microgrid is high in the other scenarios.Therefore,it is necessary to restore the load in a controlled manner to meet the power balance of the microgrid supply.
The simulation adopts the modified IEEE 33-bus node power distribution system.The microgrid in the distribution system consists of different types of DGs,such as gas turbine,wind power generation,photovoltaic power generation,and energy storage.The power in the microgrid is different at different time periods.It can be seen that when the recovery period is at night,photovoltaic and wind turbines lack the available power generation output,which will affect the recovery process of the distribution network and reduce the recovered distribution load;however,it can still ensure continuous power supply to critical loads.The examples presented above verify the validity of the model.Under extreme weather conditions,the microgrid can play an important role in the restoration of power to enhance the resilience of the distribution power grid.
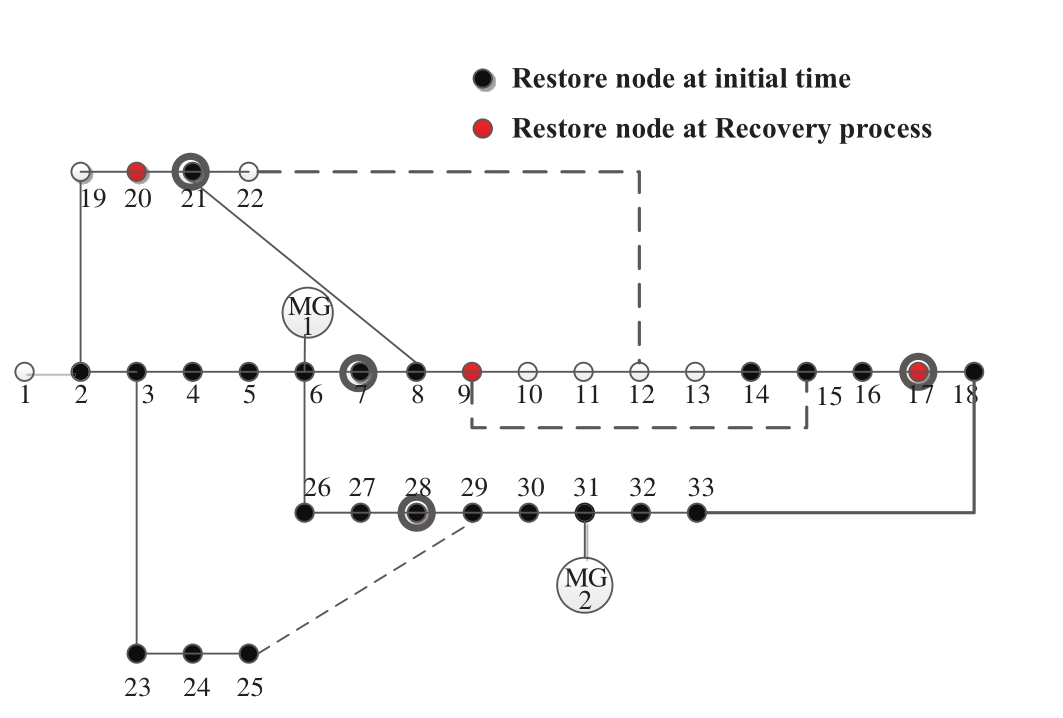
Fig.5 Restoration plan for scenario 3
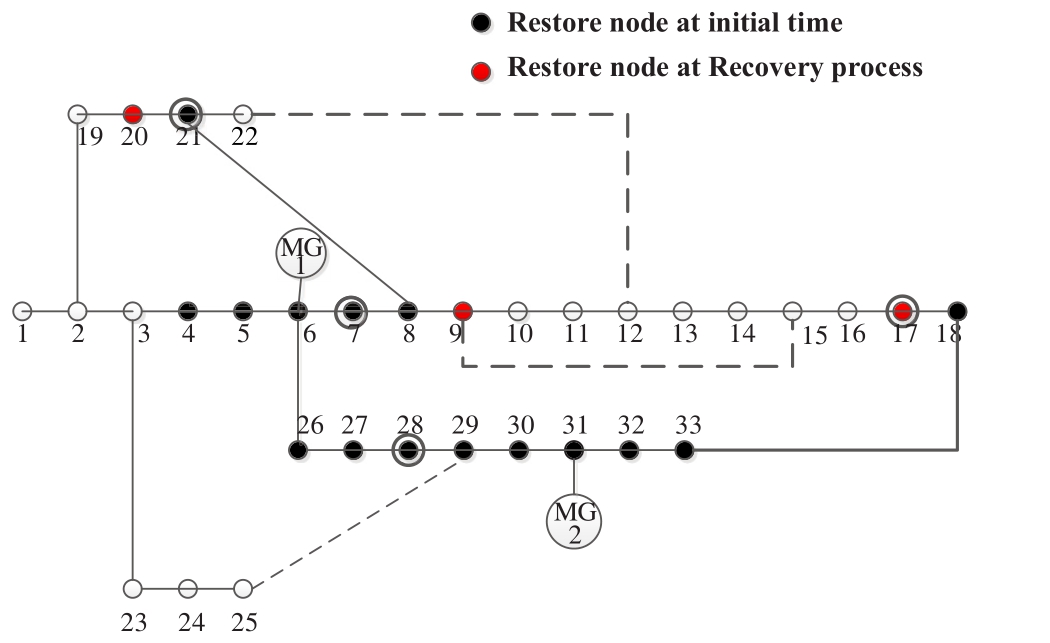
Fig.6 Restoration plan for scenario 4
5 Conclusion
This paper presented a method to enhance the distribution system resilience against extreme events by using a microgrid to supply power.First,a nonlinear power supply recovery model with maximum resilience was established based on the definition of distribution network resilience.Secondly,piecewise linearization was used to transform the model into an MIP problem for arriving at an effective solution.The strategy was effective in reducing the fault loss of the distribution power grid in the event of extreme weather and improving the resilience of the power system.The simulation considered the time of occurrence of the extreme event,the wind power output,photovoltaic power output,initial value of the SOC,and the load node weight.The results of the simulation under different scenarios varied,but each result demonstrated a significant improvement when compared with the simulation results of the conventional load recovery.We can see that under extreme weather conditions,the distribution scheme can ensure continuous supply of power from the microgrid to critical loads.The simulation results verify the validity of the model and prove the enhanced resilience of the distribution system against extreme events.
Appendix A
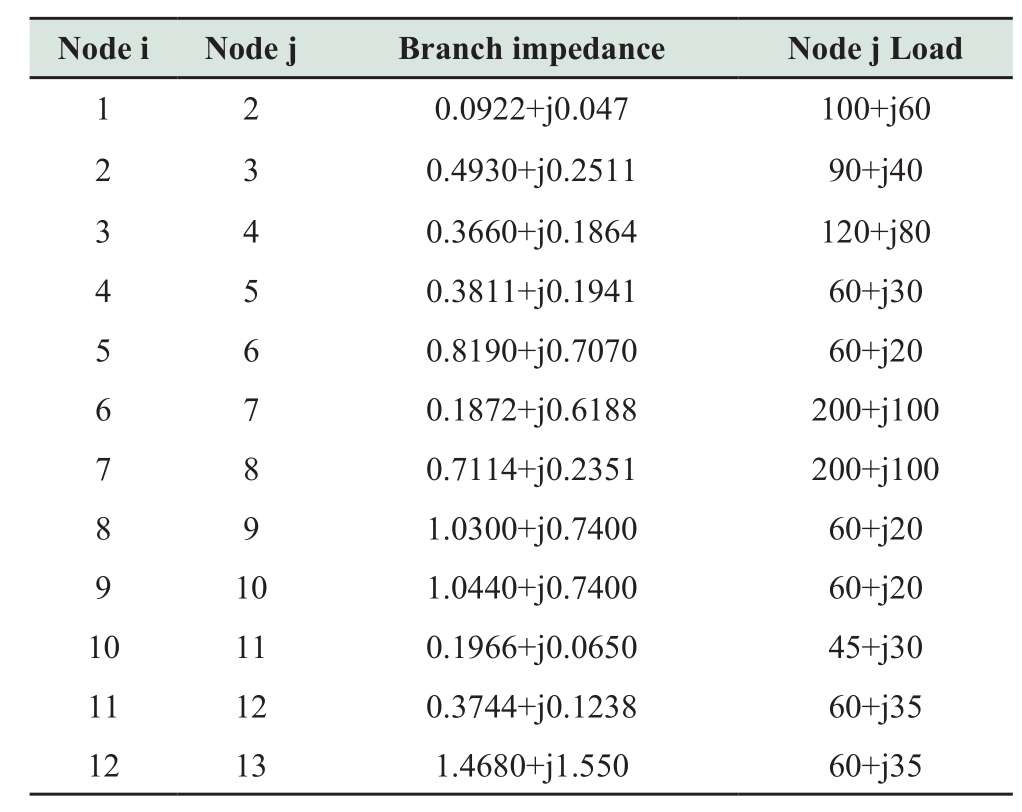
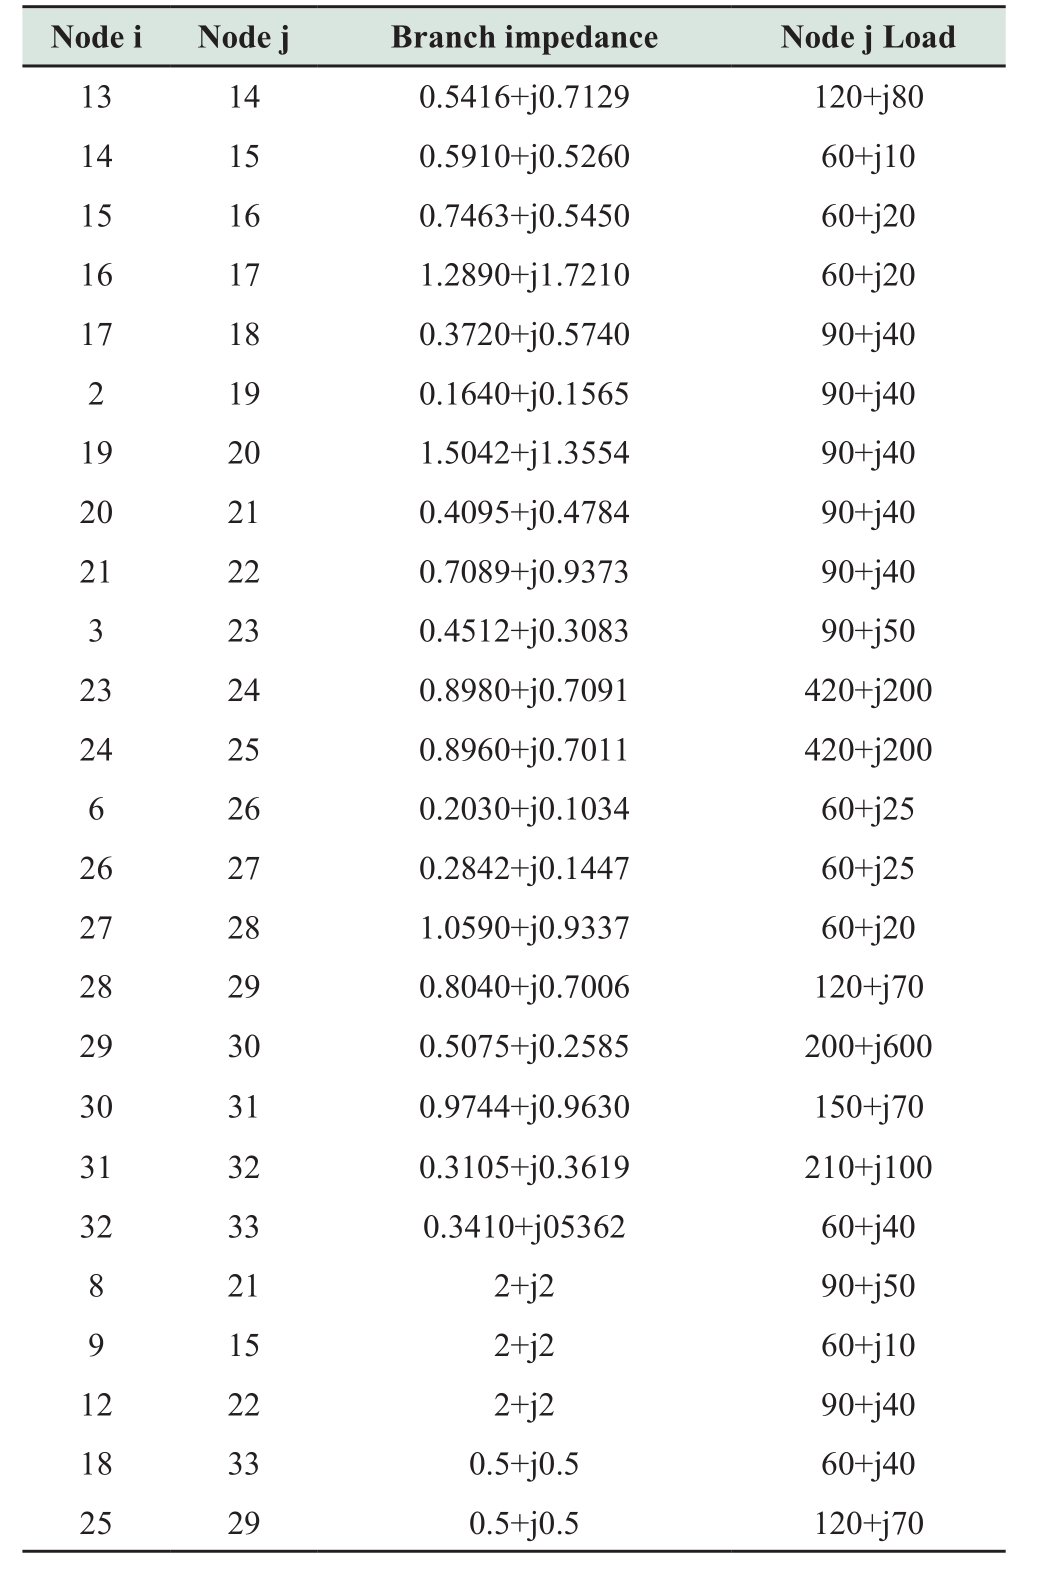
Table A1 System parameters
Continue
Appendix B

Fig.B1 Typical daily output curves of wind and photovoltaic power
Acknowledgements
This work was supported by the State Grid Science &Technology Project (Grant No.17H300000437).
References
[1] Ton D T,Wang W T P (2015)A More Resilient Grid:The US department of energy joins with stakeholders in an R&D Plan.IEEE Power &Energy Magazine,13(3):26-34
[2] Liu C (2015)Distribution Systems:Reliable but not resilient? [In My View].IEEE Power &Energy Magazine,13(3):93-96
[3] Bie Z,Lin Y,Li G et al (2017)Battling the Extreme:A Study on the Power System Resilience.Proceedings of the IEEE,105(7):1253-1266
[4] Panteli M,Trakas D N,Mancarella P et al (2016)Boosting the power grid resilience to extreme weather events using defensive islanding.IEEE Transactions on Smart Grid,7(6):2913-2922
[5] Sakaguchi T,Matsumoto K (1983)Development of a knowledge based system for power system restoration.IEEE Transactions on Power Apparatus &Systems,102(2):320-329
[6] Liu C C,Lee S J,Venkata S S (1988)An expert system operational aid for restoration and loss reduction of distribution systems.IEEE Transactions on Power Systems,3(2):619-626
[7] Solanki J M,Khushalani S,Schulz N N (2007)A Multi-Agent Solution to Distribution Systems Restoration.IEEE Transactions on Power Systems,22(3):1026-1034
[8] Miu K N,Chiang H D,Yuan B et al (1998)Fast service restoration for large-scale distribution systems with priority customers and constraints.IEEE Transactions on Power Systems,13(3):789-795
[9] Siqing S,Zhigang M,Jing W et al (2009)Distribution Network Fault Restoration Based on Improved Adaptive Genetic Algorithm.In:Second International Conference on Intelligent Computation Technology and Automation.IEEE Computer Society,2009:318-321
[10] Schneider K P,Tuffner F K,Elizondo M A et al (2016)Evaluating the feasibility to use microgrids as a resiliency resource.In:Power and Energy Society General Meeting,2016:1-1
[11] Xu Y,Liu C C,Schneider K P et al (2016)Microgrids for service restoration to critical load in a resilient distribution system.IEEE Transactions on Smart Grid,9(1):426-437
[12] Gao H,Chen Y,Xu Y et al (2016)Resilience-oriented critical load restoration using microgrids in distribution Systems.IEEE Transactions on Smart Grid,7(6):2837-2848
[13] Chen C,Wang J,Qiu F et al (2016)Resilient distribution System by microgrids formation after natural disasters.IEEE Transactions on Smart Grid,7(2):958-966
[14] Arif A,Wang Z (2017)Networked microgrids for service restoration in resilient distribution systems.IET Generation Transmission &Distribution,11(14):3612-3619
[15] Sharma M J,Moon I,Bae H (2008)Analytic hierarchy process to assess and optimize distribution network.Applied Mathematics&Computation,202(1):256-265
[16] Panteli M,Mancarella P (2015)The Grid:Stronger,bigger,smarter,presenting a conceptual framework of power system resilience.IEEE Power &Energy Magazine,13(3):58-66
[17] Cavalcante P L,López J C,Franco J F et al (2016)Centralized self-healing scheme for electrical distribution systems.IEEE Transactions on Smart Grid,7(1):145-155
2096-5117/© 2019 Global Energy Interconnection Development and Cooperation Organization.Production and hosting by Elsevier B.V.on behalf of KeAi Communications Co.,Ltd.This is an open access article under the CC BY-NC-ND license (http://creativecommons.org/licenses/by-nc-nd/4.0/ ).
zhubinruo@126.com
Binruo Zhu
Wangchengmin@sjtu.edu.cn
Chengmin Wang
Handong@163.con
Dong Han
W.wx1993@outlook.com
Wenxian Wu
Xiening@sjtu.edu.cn
Ning Xie
249157190 @qq.com
Jiaren Wang
Received:5 June 2018/ Accepted:24 July 2018/ Published:25 December 2018
Biographies

Jiaren Wangreceived his bachelor degree at Shanghai Jiaotong Universty,China,2016.He is working towards master degree at Shanghai Jiaotong University.His research interest includes distribution planning and risk assessment.

Ning Xiereceived her Ph.D.degree in Politecnico di Torino,Italy,2010.She received master and bachelor degree in Wuhan University,China.Now she is associate professor in Shanghai Jiaotong University.Her research interest includes power system economic operation and smart grid.

Wenxian Wureceived his bachelor degree at Ningde Normal University,Fujian,2016.He is working towards master degree at University of Shanghai for Science and Technology,Shanghai.

Dong Hanreceived his bachelor degree at Northeast Electric Power University,Jilin,2007,received master degree at Harbin Institute Of Technology,Haerbin,2009,received Ph.D.degree at Shanghai Jiao Tong University,Shanghai,2015.He is working in University of Shanghai for Science and Technology,Shanghai.

Chengmin Wangreceived his Ph.D.degree in Harbin Institute of Technology,China,2002.He received the master and bachelor degree in Northeast Electric Power University,China.Now he is professor in Shanghai Jiaotong University.His research interest includes distribution planning and electricity market.

Binruo Zhureceived her bachelor degree in Shanghai University.Now she in working in Electric Power Research Institute,State Grid Shanghai Municipal Electric Power Company.Her research interest includes Smart grid and energy metering.