
0 Intr oduction
With the rapidly increasing global energy demands,research on alternative and sustainable energy sources has become extremely significant. The extens ive incorporation of renewable energy has brought about several new challenges[1]. With the construction of new power systems making the distribution grid more adaptable, the integration of numerous renewable-energy sources and manageable resources into the grid is resulting in more frequent and intricate interactions between the supply side and consumers[2]. Active distribution networks (ADNs)represent the future of smart grids and constitute a critical technical foundation for new energy consumption. ADNs leverage the real-time operating status of power systems to adaptively regulate sources, networks, and loads, with safety and economy as the control objectives [3].
For optimizing the power flow in ADNs, Wei et al. [4]introduced a price-based demand-response approach to optimize the energy management in multienergy buildin gs.Chen et al. [5] created a model that combined the use of thermal power generation with user-side resources at different timescales. This model reduced the costs and difference between the highest and lowest energy in day-ahead dispatching. Wang et al. [6] presented a multitime-scale peer-to-peer trading strategy to encourage collaboration among aggregators in response to demand. Reference [7]presents a novel comprehensive retail-bundled energy demand-response management mechanism. Reference [8]establishes a user-side demand-response potential analysis method incorporating different energy-coupling relationships to optimize operating costs and achieve significant economic benefits at the user side. The capacit y configuration of various energy sources in active-distribution grids primarily focuses on energy-storage units. References[9,10] address energy-storage system (ESS) configuration across three aspects: peak-shaving and valley-filling capabilities, voltage quality, and power regulation. Selecting the optimal optimization algorithm is critical with regard to the above optimization objectives. This is particularly true in the context of economic dispatching, and is essential for effective energy management [11]. The traditional particle-swarm optimization algorithm utilizes a fixed particle count with constrained search spaces, leading to slow convergence and diminished adjustment accuracies. The adaptability and problem-solving capabilities of the antcolony optimization algorithm in complex dispatching scenarios have led to its recent investigation [12]. Similarly,the differential evolution algorithm has sparked considerable attention owing to its ease of use and speed of computing, as demonstrated in the latest publications [13].Nevertheless, these algorithms still exhibit inherent limitations in solving nonlinear models, including suscep tibility to local-optima trapping and slow convergence speeds.
In ADNs, the heterogeneous power-generation characteristics of diverse resources—including generation units,loads, and ESSs—significantly increase the complexity of the multivariable, multilevel optimization problems. Existing research lacks comprehensive consideration of the coordinated dispatching and capacity planning optimization for wind power, photovoltaic (PV) generation, ESSs,and controllable loads. This study therefore concentrates on ADNs incorporating wind-PV distributed generation,schedulable controllable loads, and ESSs, with principal innovations demonstrated in the following aspects:
1) Within an ADN framework, this study establishes wind-power generation models, PV generation models, and load-demand models to systematically ch aracterize the generation-consumption patterns of distributed energy resources and controllable loads.
2) Targeting the minimization of the distributionnetwork operational costs, an integrated optimal dispatch model is developed, incorporating multiple constraints: demand-response mechanisms, ESS operations, renewable-energy-accommodation limits, and power-flow-balance requirements.
3) Building upon the optimal dispatch framework, a capacity-allocation model for wind-PV-storage hybrid systems is formulated with the objective of minimizing the ADN’s equival ent daily total cost.The optimal configuration is derived using the advanced whale-migration algorithm (WMA).
1 Description and model develo pment for ADNs
1.1 Description of ADN structure
The architectural framework of the ADN is illustrated in Fig. 1. The distributed energy resources integrated into the distribution network comprise three principal components: distribut ed generation units, ESSs, and demandside controllable loads.
Intermittent renewable-energy sources, such as wind and PV power, are used mainly by the distributed generation segment. The energy-storage framework is mostly made up of dispersed energy-storage facilities, while controllable loads principally consist of adaptable demandside resources that can take part in demand-response schemes via load reduction and temporal shifting. The ADN employs advanced power electronics and communication technologies to actively coordinate and manage these distributed energy resources and storage devices,thereby maintaining system stability and operational security, while facilitating high-penetration renewable-energy integration.
1.2 Development of the system model
1.2.1 Wind-power generation model
Wind-power generation is subject to a multitude of multifaceted factors, including but not limited to the temperature, solar irradiance, and geographical location. This renders the output of wind power highly erratic and intermittent, with considerable temporal variability. Despite this inherent randomness, wind-power output manifests discernible cyclical patterns,to a certain degree.Therefore,comprehensive assessment and forecasting of wind variations within the target area are imperative, prior to wind-farm-capacity determination.
The active power output of wind turbines is influenced by natural factors. These include wind speed and direction.Human control also has an influence. Among these factors, the most significant influence is of the real-time wind speed. To ensure that the turbine operates safely, the amount of wind that can hit the blades is limited. Based on the characteristics of the blades, the wind spe ed v W can be categorized into cut-in wind speed  ,rated wind speed
  , and cut-out wind speed
  .As the wind speed changes continuously, the output power P Wof the wind turbine also varies; the relationship between the two is described by the function presented in (1).
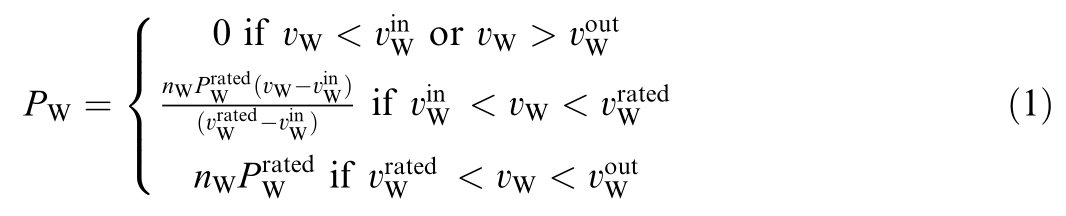
where 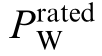 is the rated power of a single wind turbine and nWis the number of wind turbines.
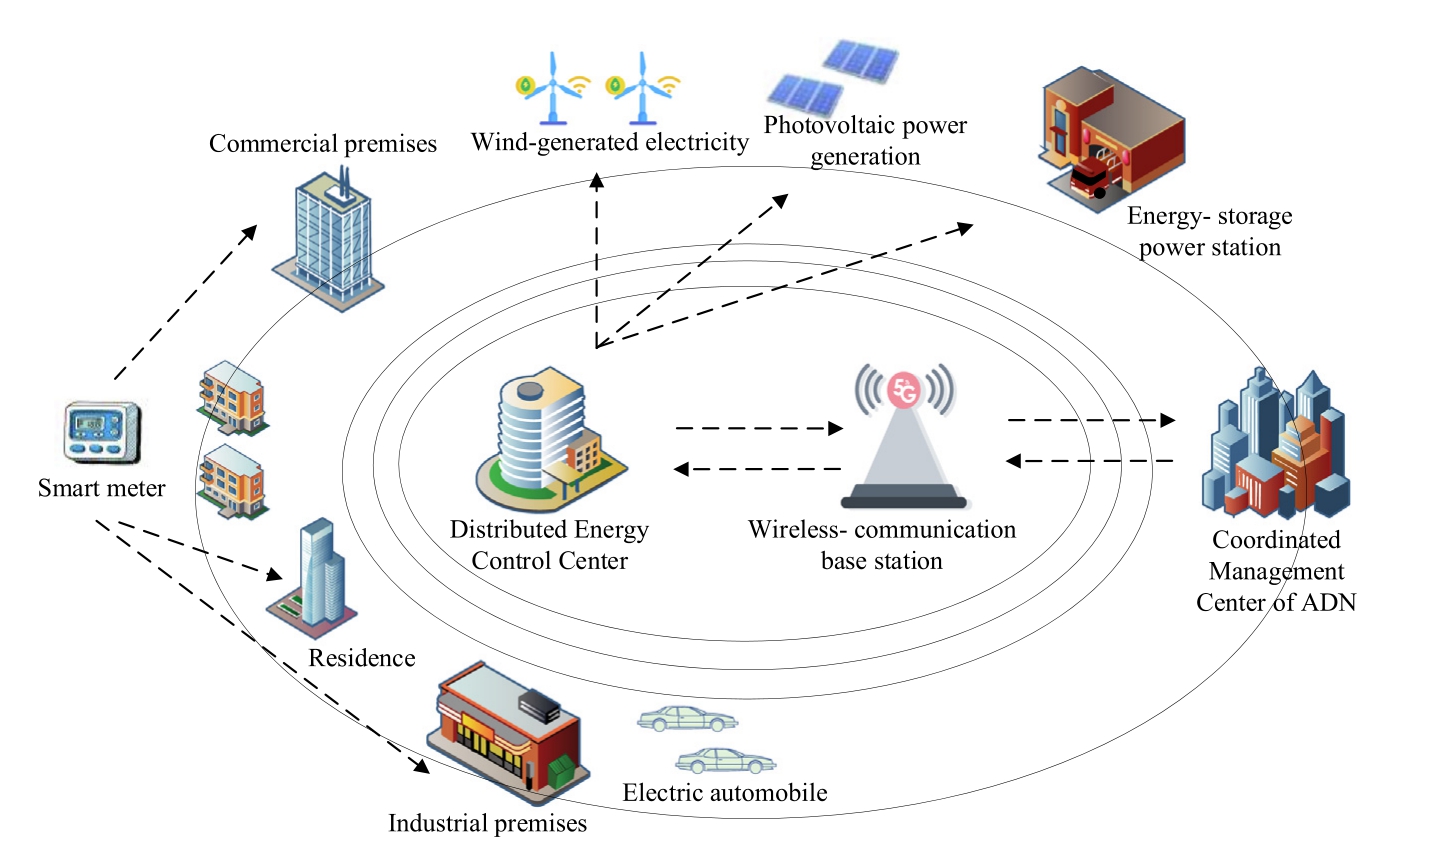
Fig. 1. Architectural framework of the ADN.
1.2.2 PV-power generation model
The operating state of PV cells is related to both the sunlight intensity and temperature. Within a certain output-voltage range, the current remains constant, and the output power increases linearly. Under the same light-radiation intensity, the higher the temperature is,the lower the maximum output power of the cell will be.Under the same temperature, the stronger the light radiation intensity is, the greater the current generated and co rresponding maximum output power will be.Currently,PV power generation uses the maximum power-point tracking(MPPT) method, which achieves maximum power output by adjusting the voltage of the PV cell. In practical applications,the MPPT strategy can effectively improve the utilization rate of PV power generation.
The output power of a PV cell array with an assembly capacity of SP Vis:

where ηPV tris the photoelectric conversion efficiency of the PV panel, ηPVc on is the grid-connection efficiency, and ηINt r is the inverter-conversion efficiency.
1.2.3 Load model
Renewable energy sources such as wind and solar power are not always reliable because they are intermittent and not always available. This can significantly change the amount of energy produced, because they are affected by the weather. Security and operational stability of distribution networks are inevitably put at risk by the large-scale integration of distributed energy resources. Activating demand-side flexible loads and energy-storage units within distribution grids to complement clean-energy production constitutes an effective strategy for addressing renewableintegration challenges.
The demand-response capabilities and capacities of the load groups managed by load aggregators vary. Load aggregators allocate specific output plans to individual users, and the response outputs of load aggregators in the t-th time period is:

where nuser represents the total number of users who can participate in the demand response,  represents the response status of user i at time t, and Pitrepresents the response power of user i at time t.
2 Optimized dispatch model
2.1 Objective function
The optimization variables in the optimized dispatch model include the active load matrix for each node within the dispatch period, P_load,and power vector for the ESS,P_es. The specific matrix elements are:
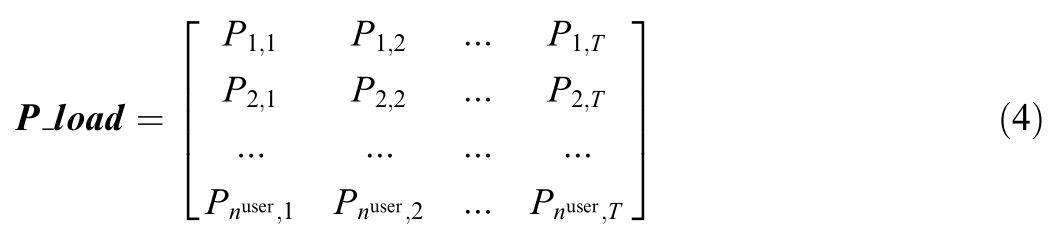
where T represents the total number of time periods in a dispatch cycle;
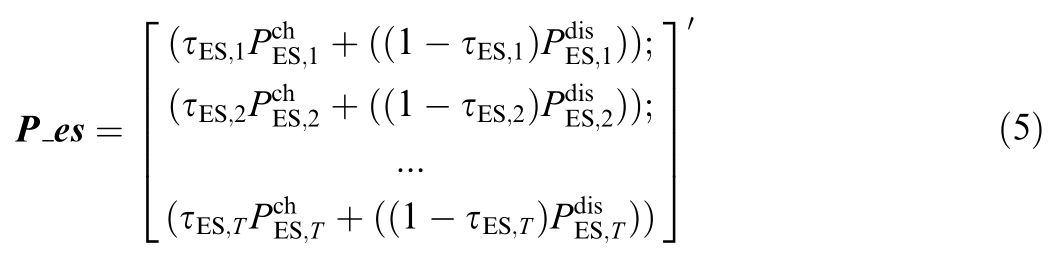
where []´denotes the transpose of the matrix, which is used to maintain the same dimensions as that of P_load; and τEShdenotes the binary variable representing the charging or discharging state of the ESS at the h-th dispatching time period.  and
and  represent the charging and discharging powers, respectively, of the ESS at h-th dispatching time period.
It is noteworthy that the output power Pi h ,for any load i participating in the response, at the h-th dispatching time period, is the combined result of the power load reduction and power shifting
  .This corresponds one-toone with the elements in (4).In summary, the optimization variables for the fir st stage are represented as:

The purpose of this study is to enhance the dispatch model by reducing the operational expenses of ADN,which is specifically expressed as:
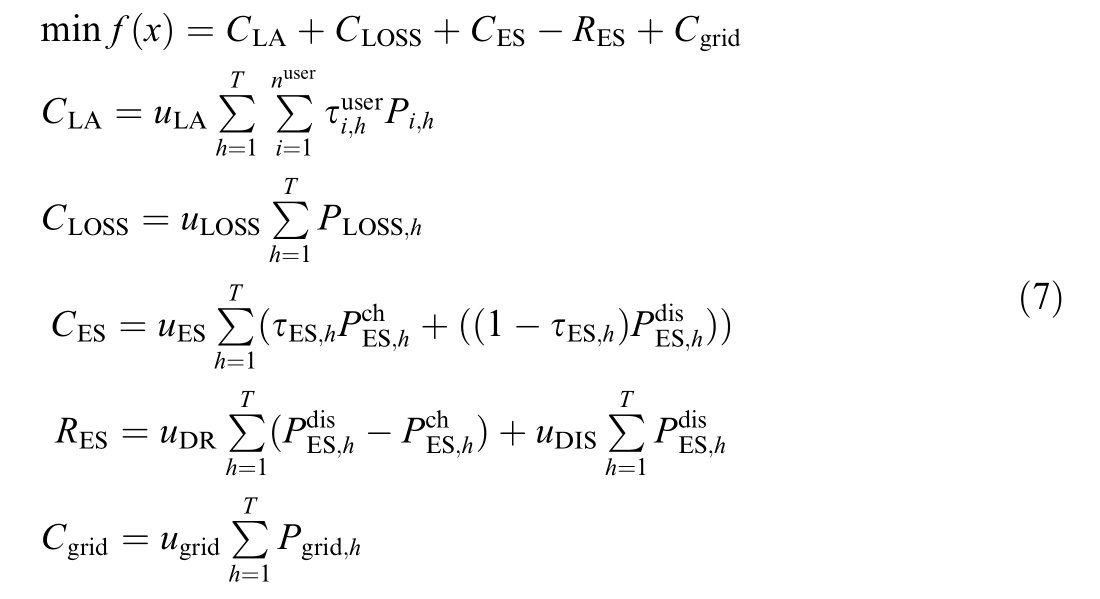
where CL Arepresents the demand-response dispatch cost,CLO SS represents the network-loss cost, CESrepresents the ESS dispatch cost, RESrepresents the subsidies and revenues of the ESS, Cgri drepresents the grid-power purchase cost, uL Arepresents the unit cost of demand-response dispatch, uL OSSrepresents the unit cost of the network loss, PL OSS hrepresents the network loss in the h-th dispatching time period, uES represents the unit dispatch cost of the ESS, which contains a comprehensive consideration of the ESS losses, uDRrepresents the revenue from the unit price difference between the discharge and charging of the ESS, uDIS represents the unit discharge revenue,u grid represents the unit grid power-purchase cost, and Pgrid hrepresents the grid power-purchase power in the h-th dispatching time period.
2.2 Constraints
1) The demand-response constraints are given by
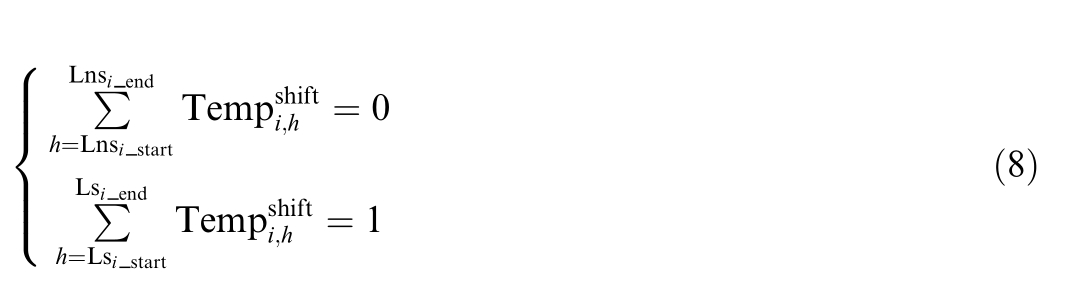
where Tem p represents the binary variable of the transferable load iin the h-th dispatching time period;Lnsi start and Lnsi endrepresent the start and end time periods,respectively, of the nontransferable load interval; and Lsi start Lsi endrepresent the start and end time periods,respectively, of the transferable load interval.

where  indicates the power reduction of load i in the h-th dispatching time period,
  indicates the maximum proportion of the original load that can be reduced, and
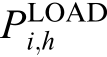 indicates the power of load i that can be reduced in the h-th dispatching time period.
2) Energy-storage-device constraints, for the m-th ESS:
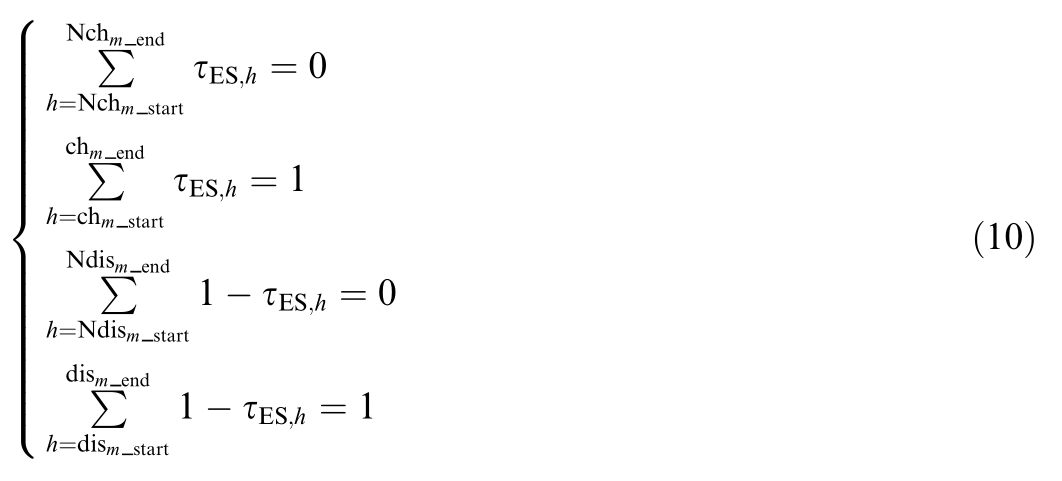
where Nchm start and Nchm end denote the start and end time periods, respectively, during which charging is prohibited for the m-th ESS; chm start and c hm enddenote the start and end time periods, respectively, during which charging is required for the m-th ES S;Ndism startand Ndism enddenote the start and end time periods, respectively, during which discharging is prohibited for the mth ESS; and dis m start dis m enddenote the start and end time periods, respectively, during which discharging is required for the m-th ESS.
The power constraint for charging or discharging any ESS in the h-th dispatching time period is

where 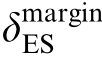 indicates the reserve margin of the ESS, and PESindicates the rated power of the ESS.
3) Wind-turbine and PV constraints a t any given time:

where Wis the wind-turbine output fluctuation coeffi-cient, PWpreis the predicted value of the wind-turbine output at any given tim e.P Wmin an d PWmaxrepresent the minimum and maximum values, respectively, of the wind power output.

where P Vrepresents the PV output fluctuation coefficient and PP Vprerepresents the predicted value of the PV output at a given time. PPV min and PP Vmaxrepresent the minimum and maxi mum values, respectively, of the PV power output.
4) Power-flow constraints at any given time:
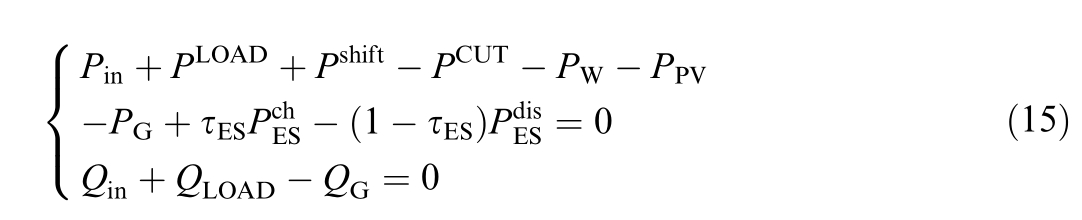
where Pin and Qinrepresent the active power and reactive power, respectively, injected into the node; P G and QGrepresent the active power and reactive power, respect ively,of the generator. QLOADrepresents the reactive power of the load.
5) Line voltage, current, and power general constraints:

where  represents the line voltage,
  and
and  represent the minimum and maximum limits, respectively, of the line voltage;
  represents the line current;
  and
and represent the minimum and maximum limits, respectively, of the line current;
  represents the line power,
 and
and  rep resent the minimum and maximum limits, respectively, of the line power.
The application of second-order cone relaxation techniques facilitates the transformation of the nonlinear power-flow constraints into a computationally tractable mixed-integer linear-programming formulation. This formulated model can be efficiently solved using commercial optimization solvers including CPLEX and GUROBI,which demonstrate superior computational performance while maintaining solution accuracy.
3 Two-stage wind-solar-storage capacity-allocation optimization model
3.1 Objective function
The optimization variables in this two-stage wind-sola r-storage capacity-allocation optimization model are SPV, SW, and SES, which represent the installed capacities of the PV system,wind-power system,and ESSs.The optimization variables are specifically represented as:

where m’, m’’, and m’’’ represent the quantities of the PV systems, wind-power systems, and ESSs, respectively.
Based on minimizing the dispatch operation costs of the ADN and targeting the lowest average daily total cost increa se for the system, the two-stage interactive process can be illustrated as shown in Fig. 2.
The objective function for the second stage includes the equivalent daily investment cost Cinvand equivalent daily operati ng cost Copr,with specific expressions as follows:
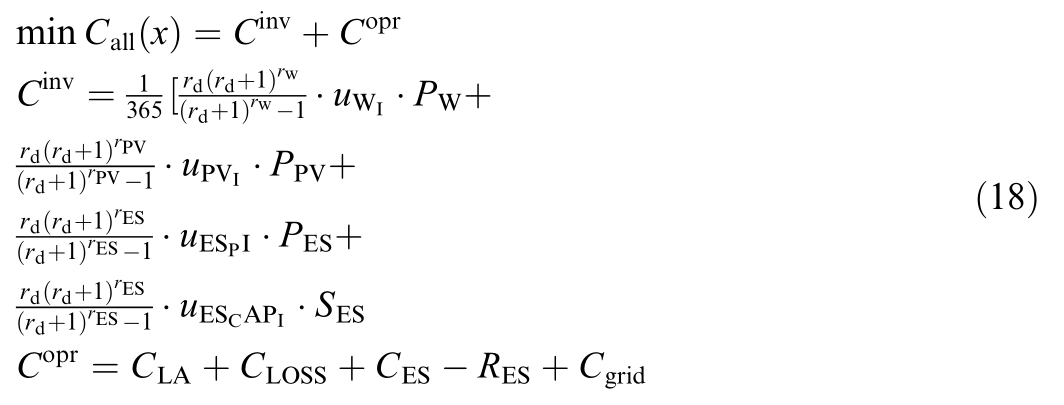
where r d is the discount rate for the equipment; r W , rPV,and rESare the discount years for the wind-turbine equipment,PV equipment, and ESSs, respectively; uW I ,uPV I , uESPI, and uESCAPIare the unit investment costs for the wind-turbine equipment, PV equipment, and ESSs, respectively, in terms of the power and capacity; P W, P PV , P ESand,SES are the configured capacities for wind turbines, PV equipment, and ESSs, respectively.
The constraints of the two-stage wind-solar-storage capacity-allocation optimization model are consistent with the constraints presented in Section 2.2.
3.2 Solution
3.2.1 Introduction to WMA
The WMA is a novel bio-inspired meta-heuristic optimization technique, modeled on the collective migratory behavior of humpback whales. The WMA is different from the normal methods of operation, because it mixes the ideas of leaders and followers with ways of moving that change as needed. This helps to avoid problems and makes it better at achieving success [14,15].
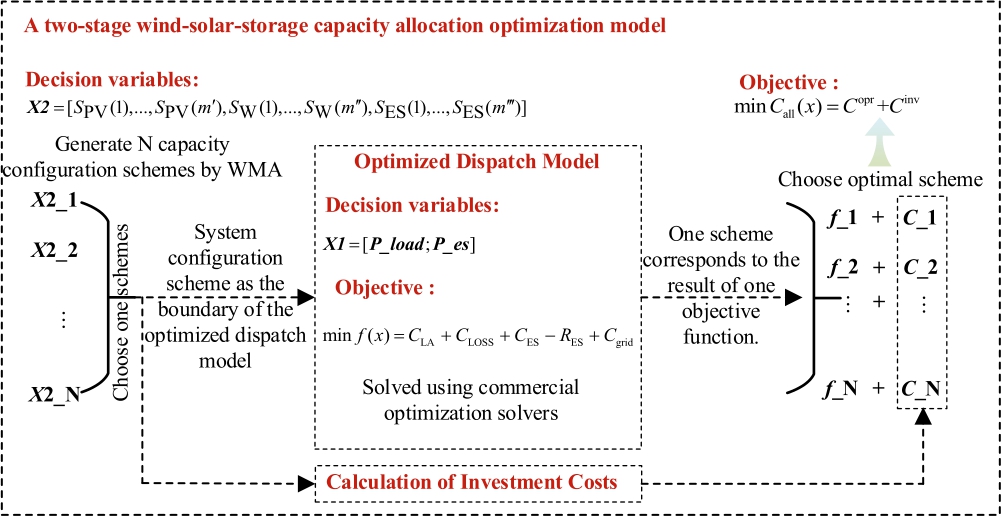
Fig. 2. Schematic of two-stage interaction process.
Population initialization: The random initialization process is presented in (19) to generate an initial proposal.

where W iindicates the position of the i-th whale; L and U are the lower and upper boundaries, respectively, of the whale population position; D indicates the dimension of the position; and Np opindicates the size of the population.And the operation.is defined as an element-wise product,for example, A a1 a2 aD B b1 b2 bD ,A B a1b1 a2b2 aDbD.
Present location of the migrating whales in the ocean: In each group of whales on their migration, those that have covered a great distance, are well aware of the destination,and co nsider reaching the destination crucial, act as leaders of the group. As depicted in (20), they guide the rest on the direction to follow.

where NLrepresents the number of more experienced
Movement of less-seasoned whales (calves) toward their closest neighbor: Assume that all members of the population (whales) are arranged in a row, according to the level of experience they possess or any other parameter one might choose. The most suitable one is positioned at the head and the least suitable one at the tail.

where W 1is the best member (in the following text,denoted as W be st) and W Npopis the worst member.whales (leaders).
Less-experienced whales are led by more seasoned whales(leaders): A reduction in the distance between the points W Mean and W bestindicates that the entire group of experienced whales is drawing near W best.Under such circumstances, naturally, the less-seasoned whales (calves) must also start moving in the same direction,as depicted in(22).

Let the more seasoned whales or leaders explore and look for new areas: In a migrating group of whales, it is the job of the more experienced member s,referred to as leaders,to determine and choose the best route to their destination,as presented in (23).

where r1 and r2are random numbers between [0,1].
3.2.2 Superiority verification
To demonstrate the superiority of the algorithm,CEC2005 [14] test functions are used to evaluate the performance of the WMA, grey wolf optimizer (GWO) [16],sparrow search algorithm (SSA)[17], and whale optimization algorithm (WOA) [18] on three representative test functions: F3 (unimodal function), F9 (multimodal basic function), and F14 (multimodal expanded function, i.e.,a hybrid combination of the first two functions).The function graphs and optimization results of the algorithms are presented in Fig. 3. The cooperative migration behavior of humpback whales achieves a balance between the global and local research efficiencies. The use of W Meanalso enhances the algorithm’s convergence speed, stre ngthening its ability to escape local optima.This equilibrium is essential for surpassing the standard approaches.
4 Case study
4.1 Parameter settings
This paper constructs an ADN dispatch model and two-stage wind-solar-storage capacity-allocation model based on the IEEE-33 node system, as shown in Fig. 4.The rated voltage of the system busbar is 10 kV. Distributed PV power sources are connected to node 5, and distributed wind-power sources are connected to nodes 16 and 27.Two ESSs are connected to node 17.The dispatch cycle spans 24 h, and the simulation time interval is 1 h.
The key parameters of the optimization dispat ching model are presented in Table 1, while those of the twostage wind-solar-storage capacity-configuration optim ization model are detailed in Table 2. Additionally, the timeseries plots illustrate the incentive electricity price for ESS charging and discharging (Fee 1); grid electricity purchase price (Fee 2); and incentive electricity price for the load demand response (Fee 3), as shown in Fig. 5.
Based on the prediction of the original total load, the load power an d output of distributed power are presented in Fig. 6. Once linked to the dispersed energy source, the load energy will vary noticeably and the irregularity will be significant,severely disrupting the distribution network.
4.2 Analysis and discussion of results
4.2.1 Results of dispatching before capacity optimization
In this case study, the configuration of wind-solar-sto rage system before capacity optimization is presented in the Table 3.
Under this configuration scheme, the node voltages in different periods are presented in Fig. 7. After the simulation calculations according to the optimal dispatching model, the voltage of each node can meet the constraints.The fluctuation is relatively gentle, and there is no overlimit situation. The SOC of the two ESSs are presented in Fig. 8, which also satisfies the constraints and ensures the premise of safe and stable operation of the system.
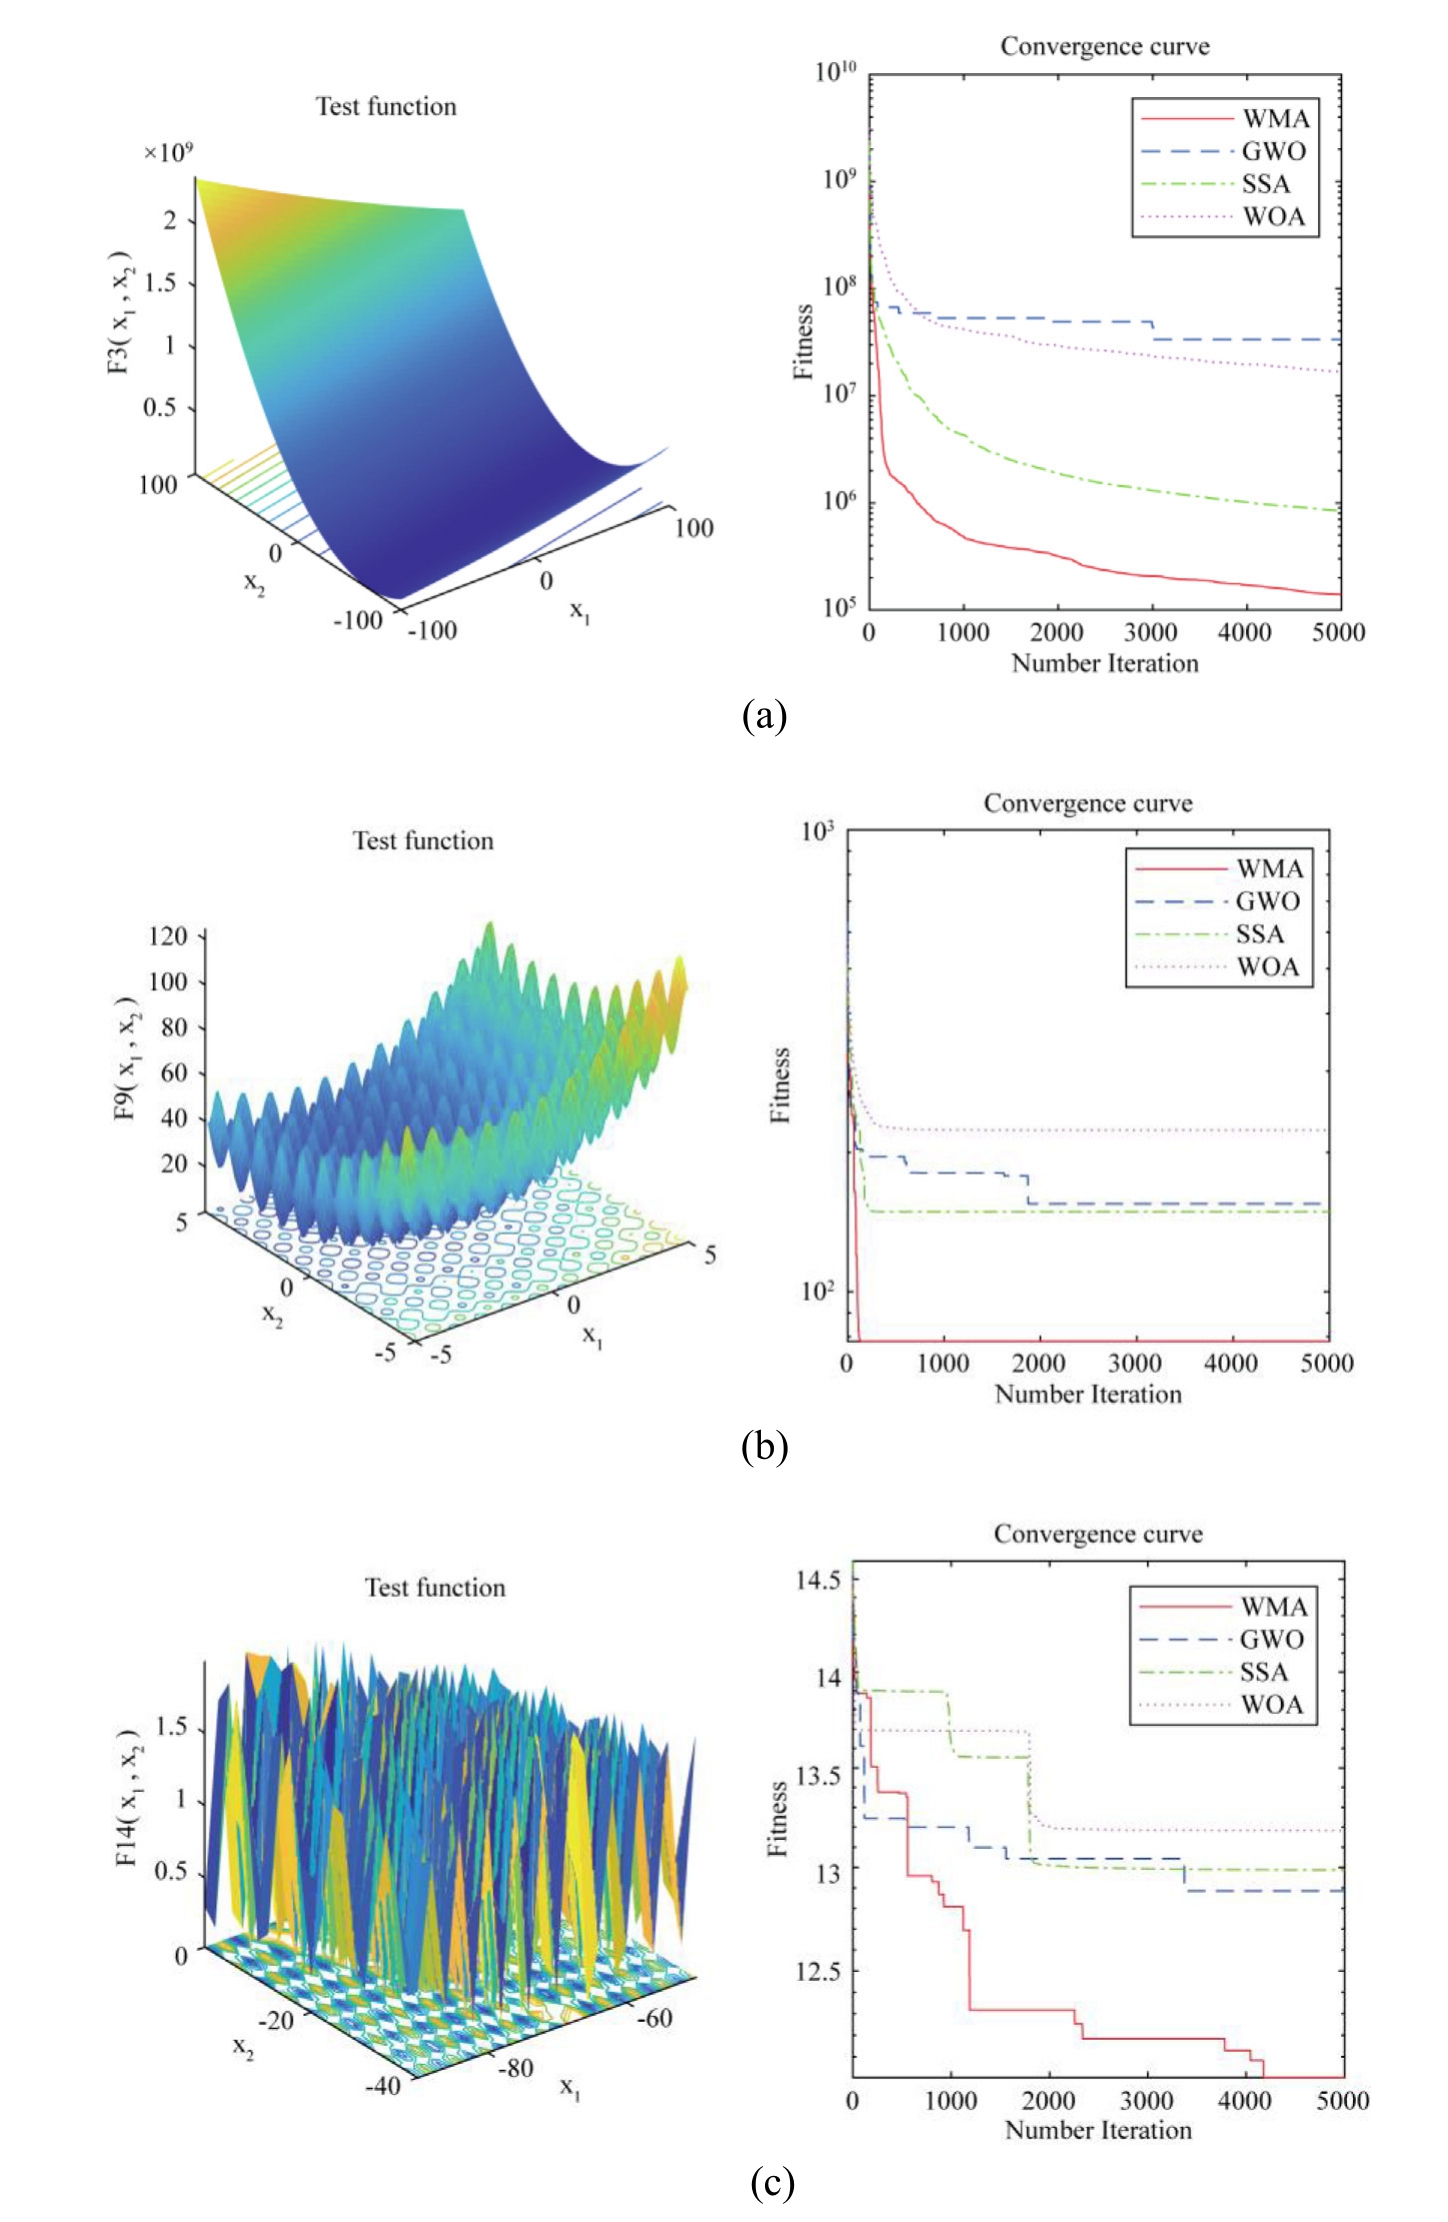
Fig. 3. Function images and convergence curves under four optimization algorithm with three representative functions: (a) F3; (b) F9; and (c) F14.
The load-adjustment results of ADN optimal dispatching are presented in Fig. 9. Although the load participates in the power-flow optimization, the cost of controllable load participation in the distribution network is high.Limited by the economic target,the system has a small amount of load mobilization.
The network loss of the system before and after powerflow optimization is presented in Fig. 10. It can be seen that the network loss is reduced because the objective function of the optimal power flow is economical,and the cost of the network loss is part of the objective function.
In the results of the optimal dispatching, the power curves of the two ESSs are presented in Fig. 1 1. The results are affected by the subsidy prices of energy storage in different time periods. Discharge occurs during the period with higher subsidy price, and no discharge or charging occurs during the period with lower subsidy price.
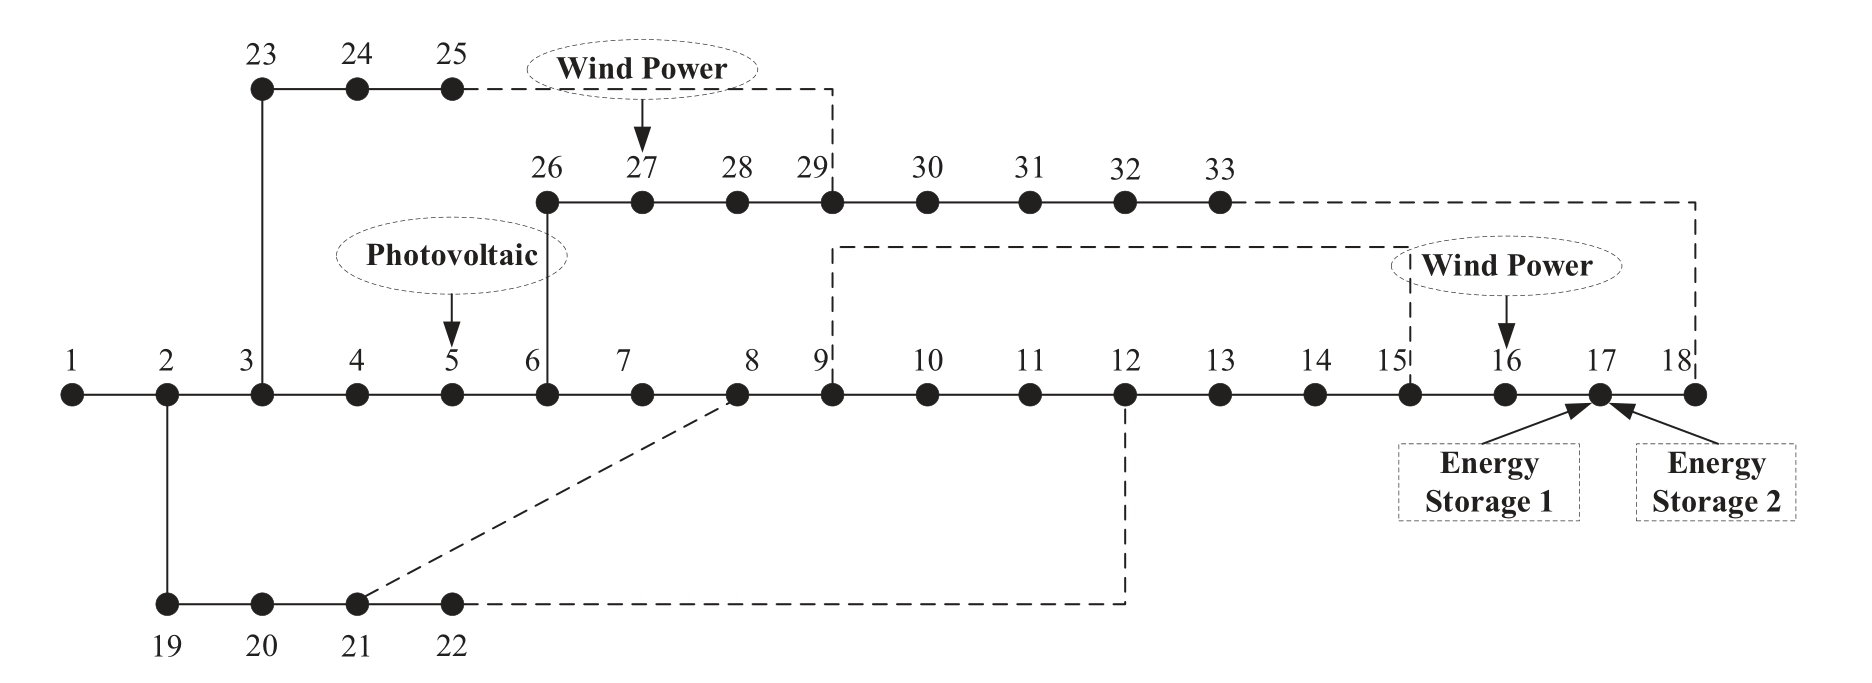
Fig. 4. IEEE 33-node ADN System.
Table 1 Key parameters of the optimization dispatching model.
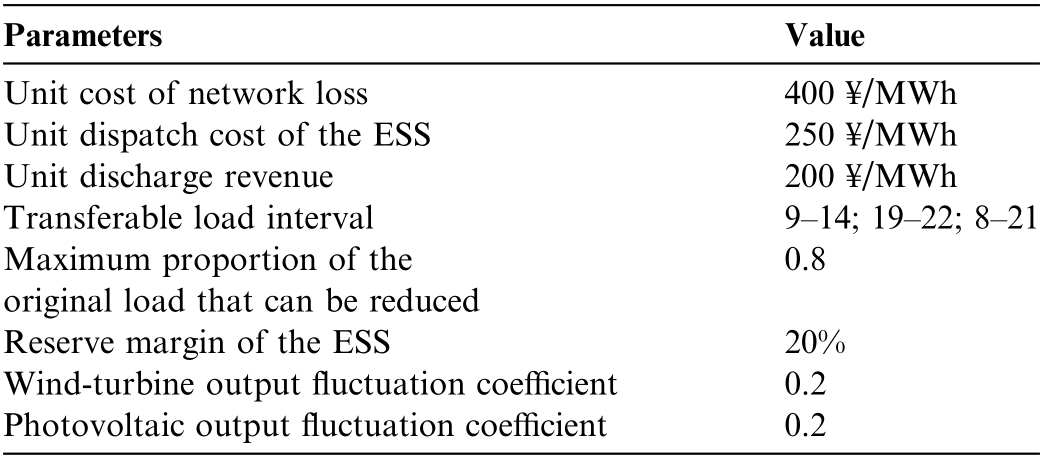
Table 2 Key parameters the two-stage wind-solar- storage capacity-configuration optimization model.
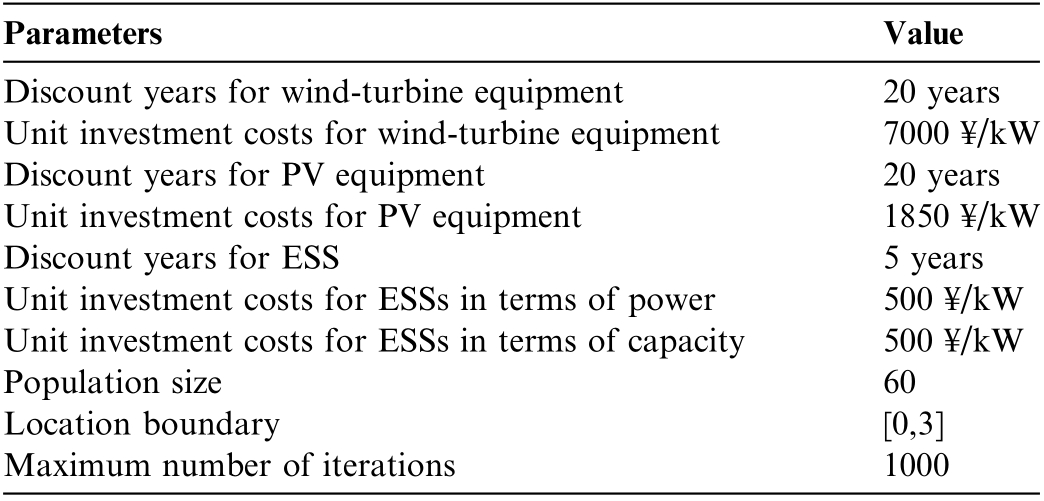
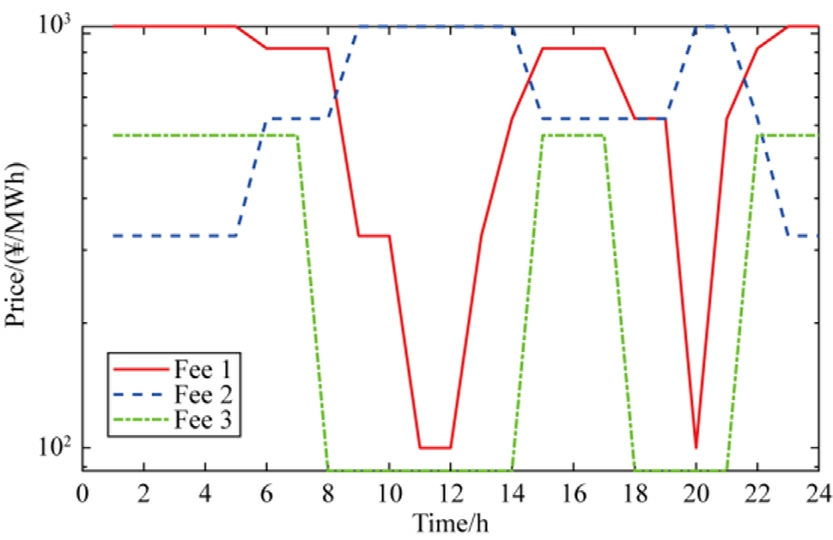
Fig. 5. Time-per iod fee.
The maximum charging power of the ESS is 400 kW.The system optimizes the dispatch plan based on the load-forecast value and calling prices of the ESS and load,considering the prediction error, and reserves a 20% margin for the ESS. The calling cost of the ESS in the optimization is included in the differences between the charging and discharging revenues and discharging subsidies. The cost is much lower than that of load calling;therefore, the calling amount of the energy-storage power is relatively large.
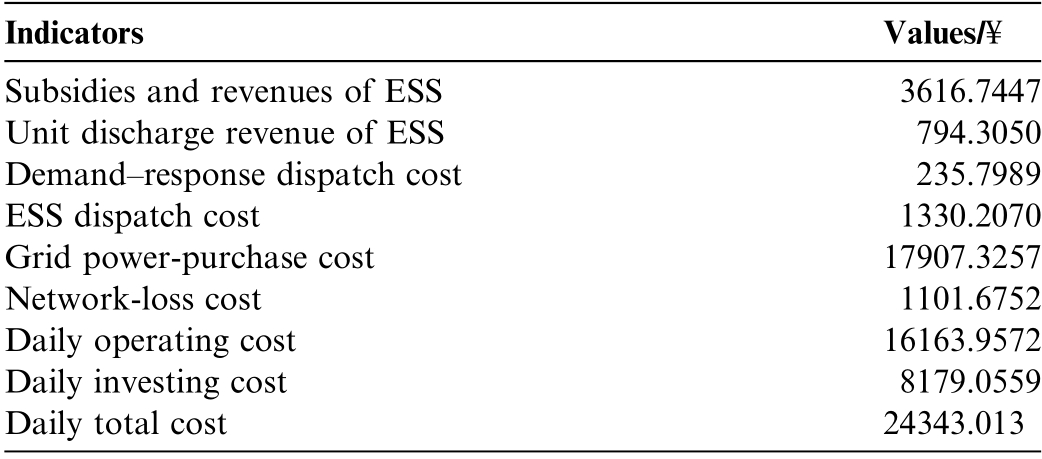
The economic indicators of the optimal operation and investment of the distribution network under this capacity configuration scheme various influencing aspects of the objective function, are presented in Table 4. They mainly include the equivalent daily operation cost and equivalent daily investment cost.
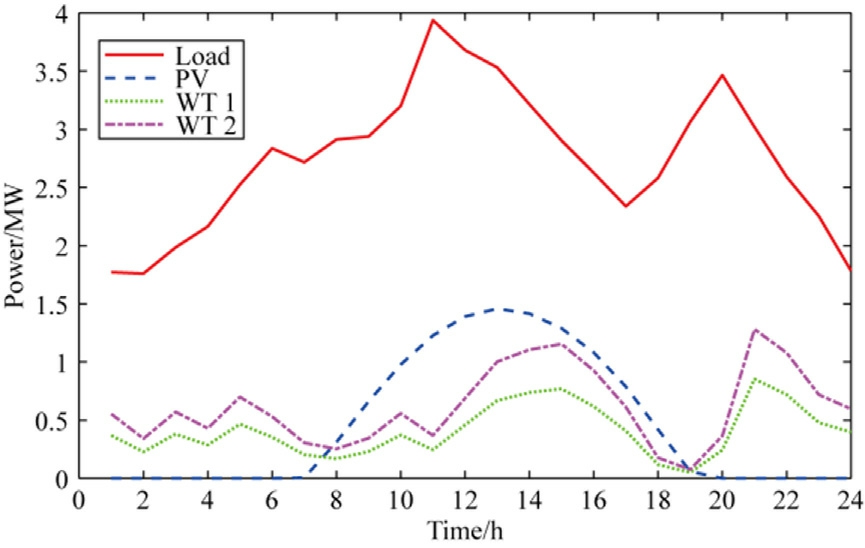
Fig. 6. Load power and output of distributed power.
Table 3 Original configuration scheme of wind-solar-storage.
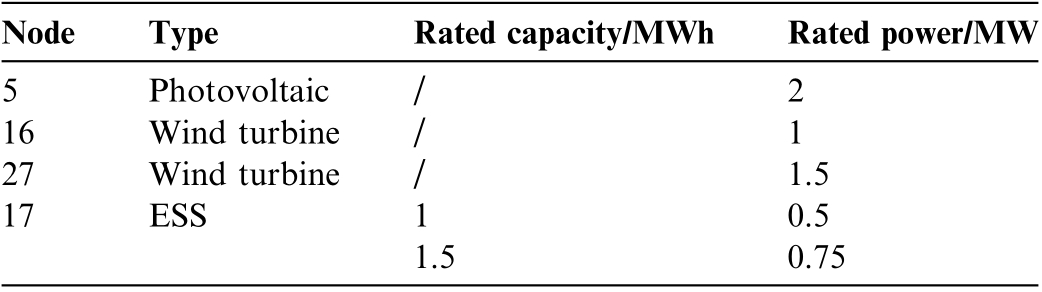
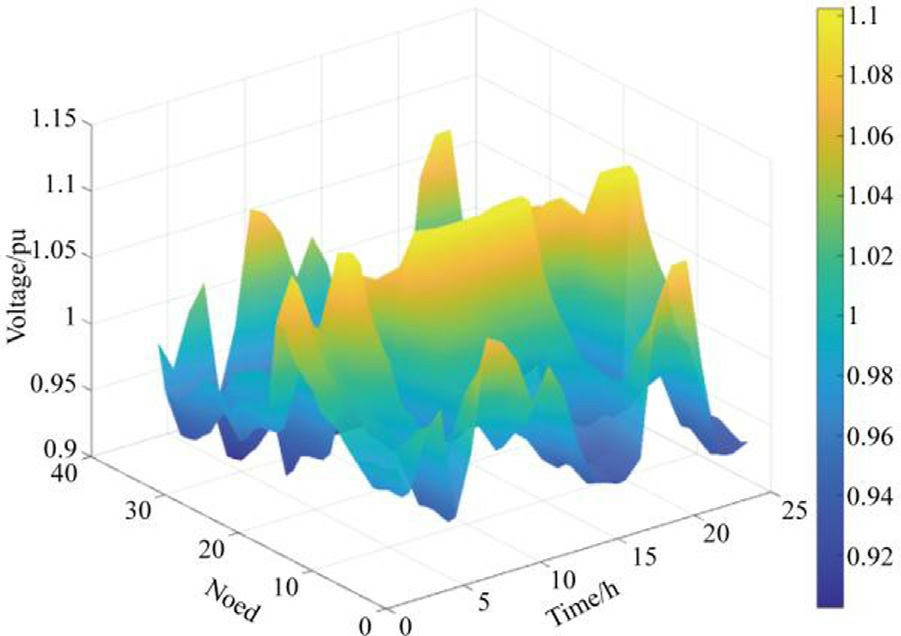
Fig. 7. Node voltage according to the optimal dispatching model.
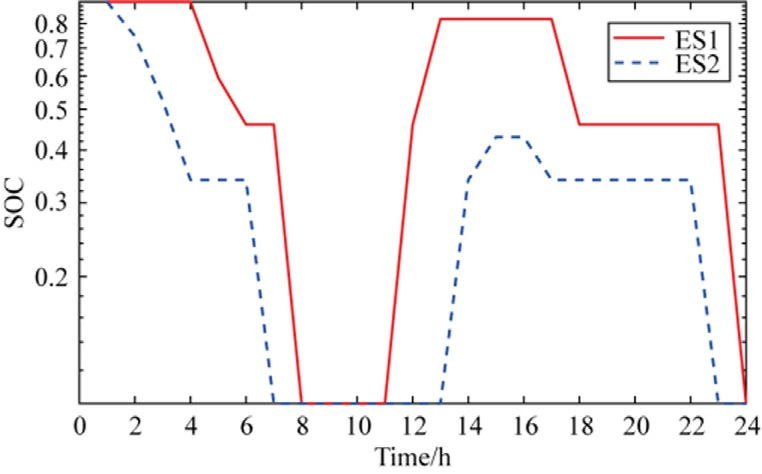
Fig. 8. State of charge according to the optimal dispatching model.
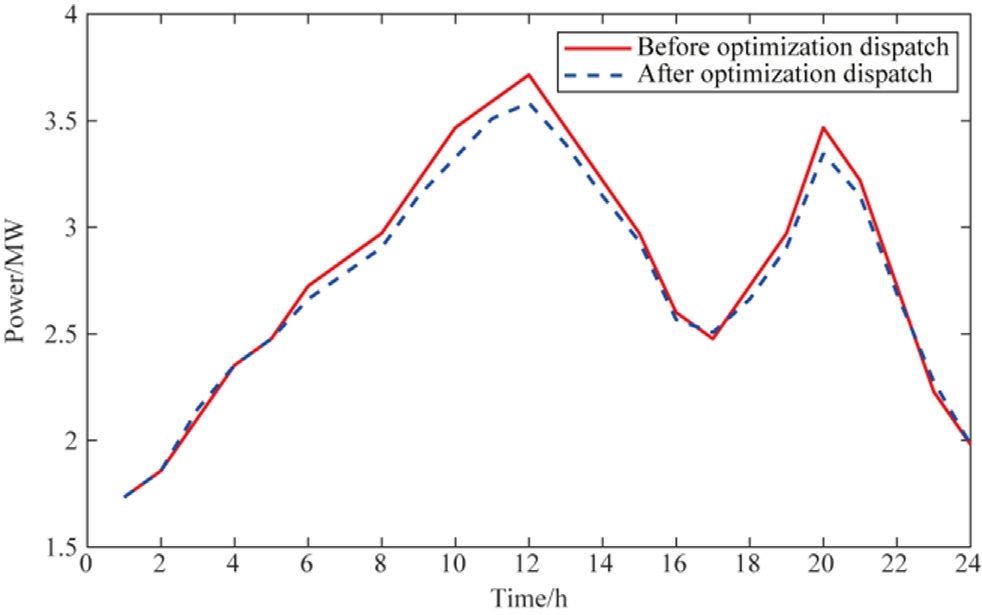
Fig. 9. Load-adjustment results according to the optimal dispatching model.
4.2.2 Results of dispatching after capacity optimization
After the two-stage optimization model optimizes the capacity allocation, the best capacity-allocation results are presented in Table 5. In contradistinction to the original scheme, the capacit y and power of the ESSs are augmented, whilst that of the distributed energy sources such as wind and PV are diminished. This is mainly influenced by the investment price of each energy source.
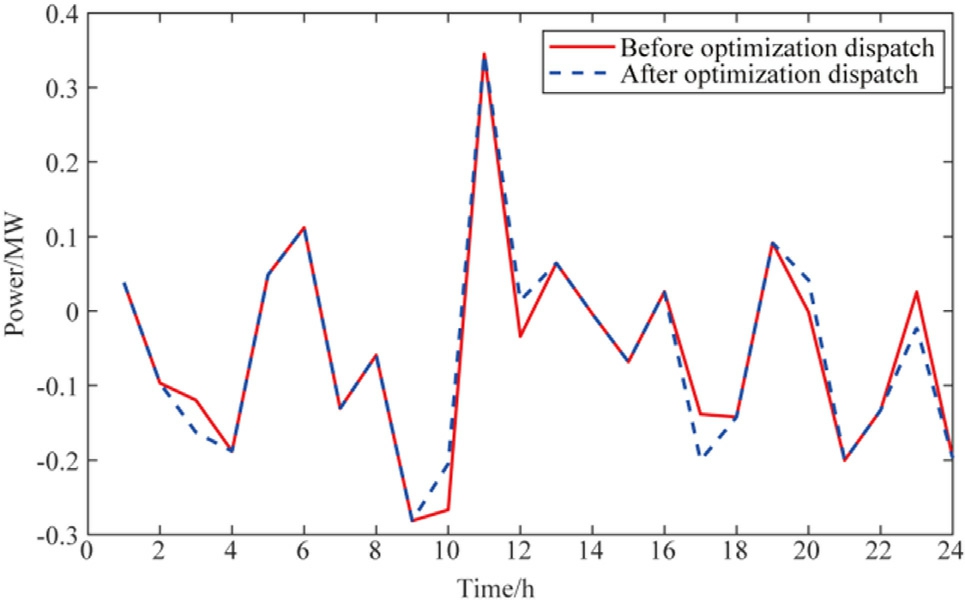
Fig. 10. Network loss of the system according to the optimal dispatching model.
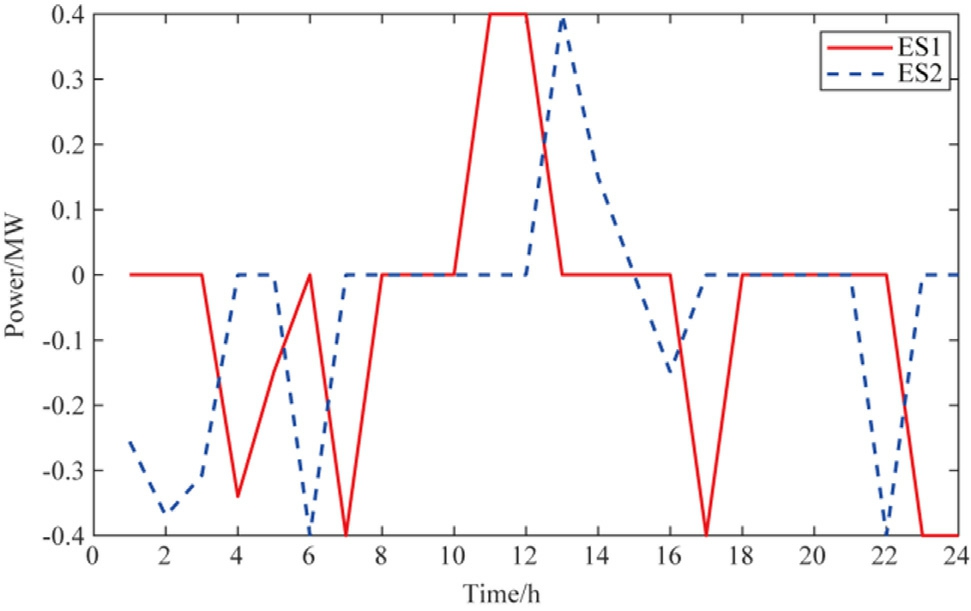
Fig. 11. Power curves of the two ESSs according to the optimal dispatching model.
Table 4 Economic indicators.
The node voltages at different time periods under this configuration are depicted in Fig. 1 2, and the state of charge of the two ESSs is illustrated in Fig. 1 3. As optimized dispatching forms the basis for the two-stage optimization, simulation results confirm that all nodevoltages satisfy the constraint limits with smooth fluctuations and no violations observed. The SOC also remains within the 0.1-0.9 constraint range.
Table 5 Optimized configuration scheme of wind-solar-storage.
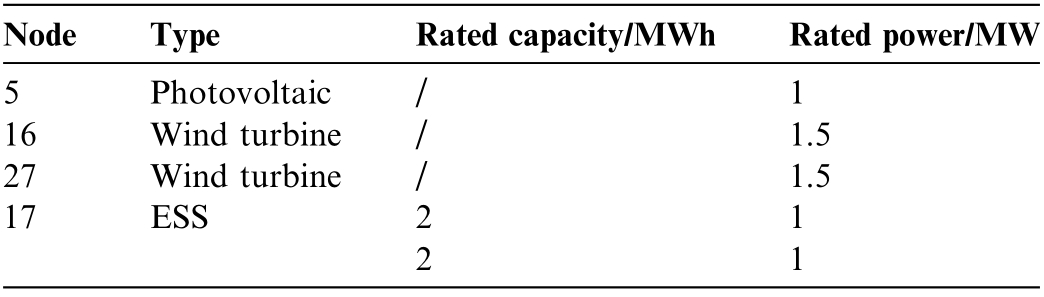
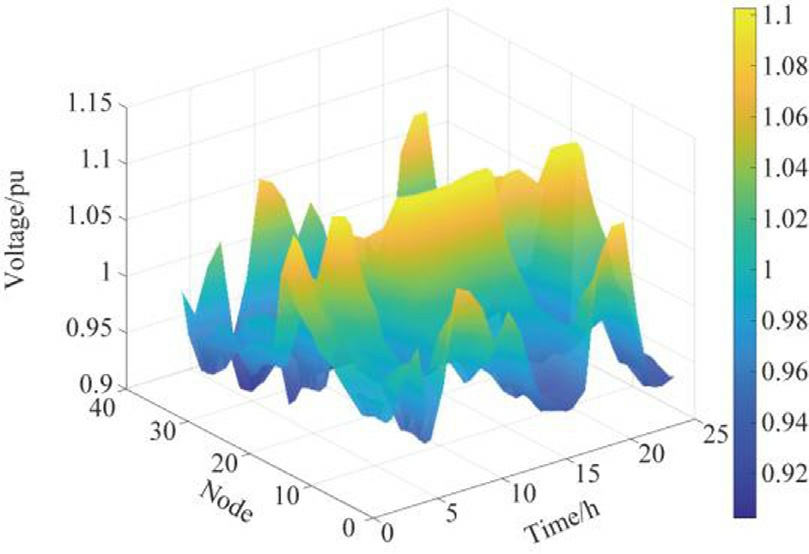
Fig. 12. Node voltage according to the two-stage optimization model.
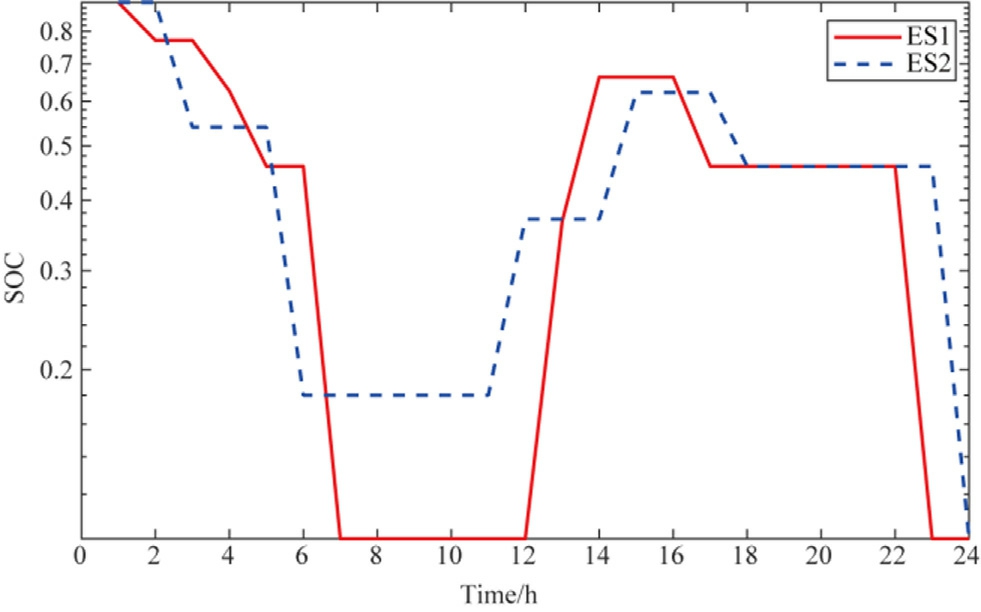
Fig. 13. State-of-charge according to the two-stage optimization model.
The settlement results for the optimized dispatching in the ADN show the load regulation outcomes depicted in the Fig. 14. As shown, constrained by economic objectives,the system implements minimal load adjustments.
Under the optimal capacity-configuration scheme, the power losses at each node, before and after power flow optimization, are depicted in the Fig. 15. The periods exhibiting changes in power loss show slight differences,compared to those before capacity optimizat ion.However,as the power-loss cost is an integral component of the objective function, the optimization result still yields a reduction in the power loss.
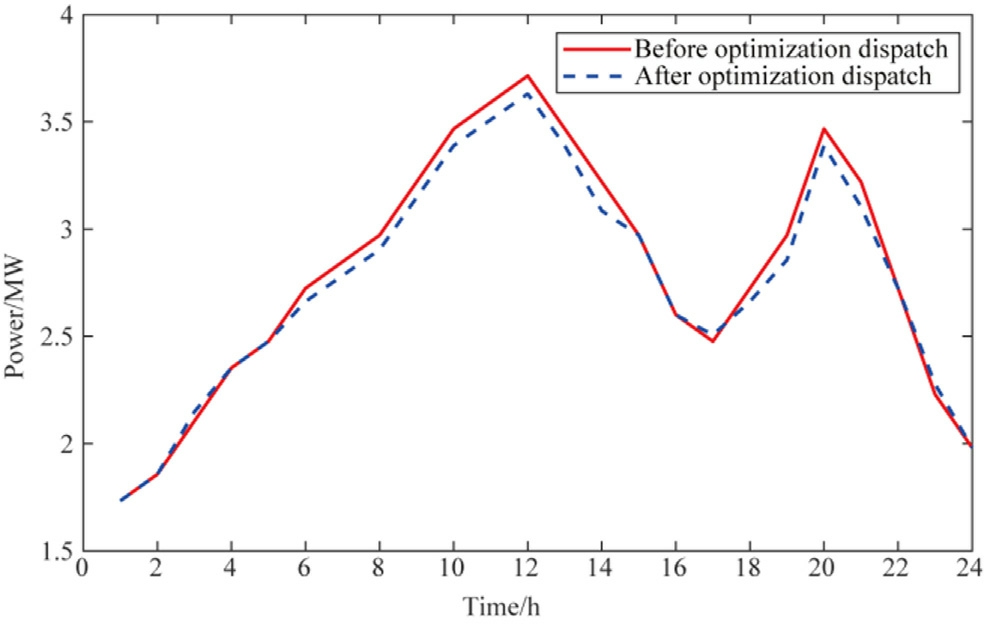
Fig. 14. Load-adjustment results according to the two-stage optimization model.
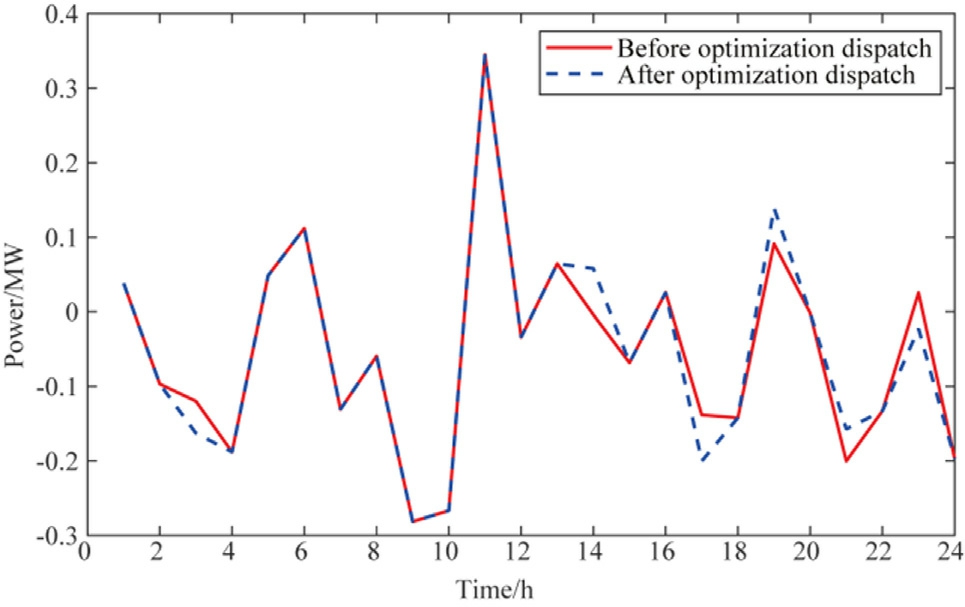
Fig. 15. Network loss of the system according to the two-stage optimization model.
Further, the charging and discharging power curves of the two ESSs are depicted in Fig. 16. The charging and discharging periods of the ESSs remain unchanged, because of the incentive of time-of-use price.
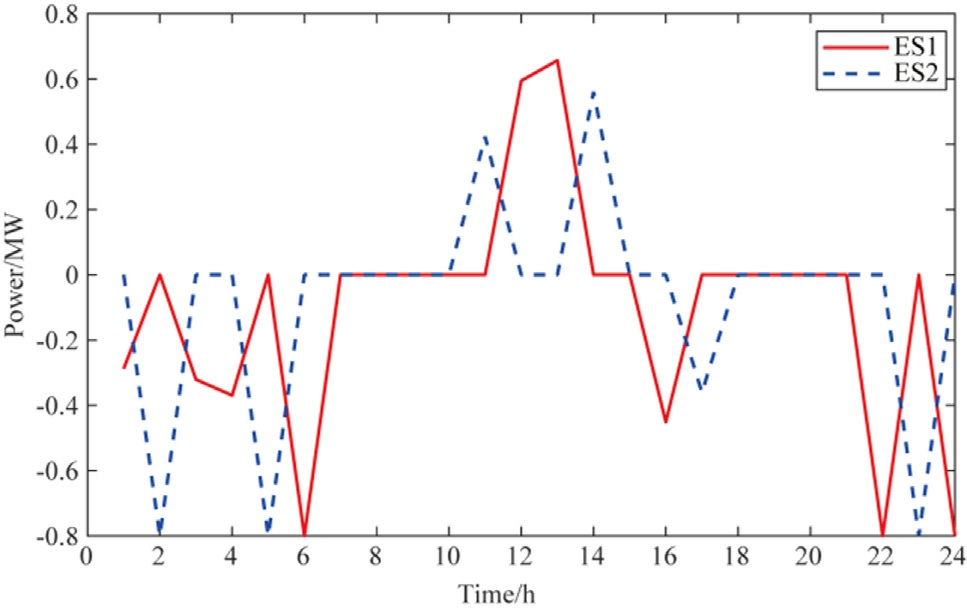
Fig. 16. Power curves of the two ESSs according to the two-stage optimization model.
Table 6 Economic indicators.
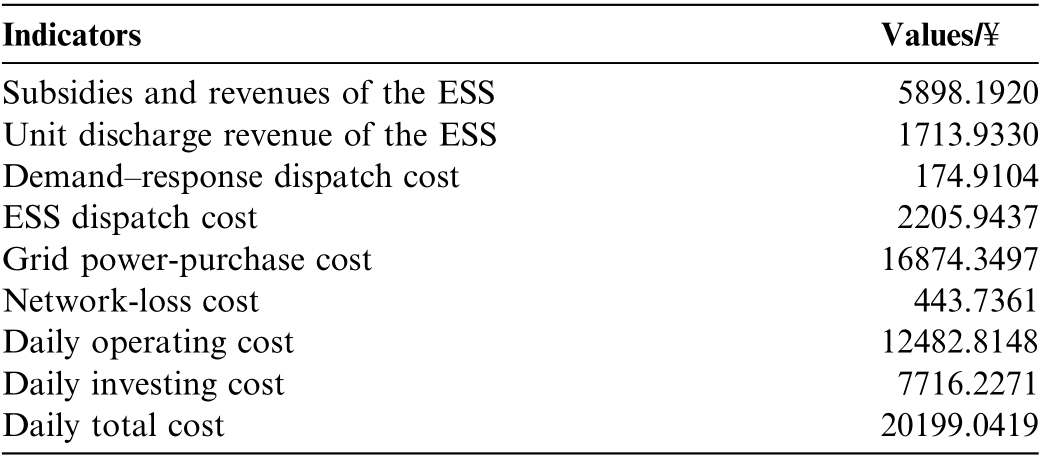
At this moment, the maximum charging power of the energy storage is 800 kW. Similarly, economic indicators for the operational dispatching and investment optimization of the distribution network under this capacity configuration scheme are obtained from the various influencing aspects of the objective function, as shown in Table 6.
The optimization-result analysis indicates that the twostage wind-solar-storage capacity configuration for ADN optimization dispatching reduces the average daily total cost of the ADN by 17%.The coordination of controllable loads and ESSs with renewable-energy output presents a novel approach to address the distribution-network dispatching pressure.
5 Conc lusion
This paper investigated the wind-solar-storage capacity-configuration optimization problem, based on an optimal dispatching model, by proposing a two-stage capacity-optimization configuration method for ADNs.In the first stage, a comprehensive optimal dispatching model was established with the objective of minimizing the dispatching operational cost of the distribution network. In the second stage, a wind-solar-storage capacity-configuration optimization model based on the optim al dispatching model was formulated.Finally,a case study verified that the two-stage wind-solar-storage capacity configuration based on ADN optimal dispatching reduced the average daily total cost of the ADN by 17%.The coordination of controllable loads and ESSs with renewable-energy outputs presented a novel approach to addressing the distribution-network dispatching pressures.
CRediT authorship contribution statement
Wu Zheng: Writing - review & editing, Writing - original draft, Visualization, Validation, Methodology, Data curation, Conceptualization. Ting Tang: Writing - review& editing, Writing - original draft, Visualization, Validation, Software, Methodology, Investigation. Xianggang He: Writing - original draft, Visualization, Validation,Software. Jierui Yang: Writing - original draft, Visualization, Validation.
Declaration of competing interest
The authors declare the following financial interests/personal relationships which may be considered as potential competing interests: Wu Zheng and Ting Tang are currently employed by Southwest Electric Power Design Institute Co.,Ltd.of China Power Engineering Consulting Group. Xianggang He and Jierui Yang are currently employed by Guizhou Power Grid Co., Ltd. of China Southern Power Grid.
References
[1]S. Li, J. Zhang, Y. He, G. Lv, Y. Liu, X. Hu, Z. Wang, X. Ao,Two-Stage capacity allocation optimization method for user-level integrated energy systems considering user satisfaction and thermal inertia,Global Energy Interconnect. 8(2025) 300-315,https://doi.org/10.1016/j.gloei.2024.03.001.
[2]T. Pan, C. Li, C. Yang, Z. Meng, Z. Wang, Z. Zhu, Multiagent,multitimescale aggregated regulation method for demand response considering spatial-temporal complementarity of user-side resources, Global Energy Interconnect. 8 (2025) 240-257, https://doi.org/10.1016/j.gloei.2025.01.004.
[3]N. Zhang, Y. Zhou, M. Yao, J. Zhang, X. Cong, X. Xiao, A fuzzy bi-objective unit commitment model considering source-grid-load interactions, in: 2013 IEEE PES Asia-Pacific Power and Energy Engineering Conference(APPEEC),IEEE,Kowloon,Hong Kong,2013. pp. 1-7. doi: 10.1109/APPEEC.2013.6837227.
[4]C. Wei, Q. Wu, J. Xu, Y. Wang, Y. Sun, Bi-level retail pricing scheme considering price-based demand response of multi-energy buildings,Int.J.Electr.Power Energy Syst.139(2022),https://doi.org/10.1016/j.ijepes.2022.108007 108007.
[5]X. Chen, Y. Li, J. Shimada, N. Li, Online learning and distributed control for residential demand response, IEEE Trans. Smart Grid 12 (2021) 4843-4853, https://doi.org/10.1109/TSG.2021.3090039.
[6]K. Wang, C. Wang, W. Yao, Z. Zhang, C. Liu, X. Dong, M. Yang,Y. Wang, Embedding P2P transaction into demand response exchange:a cooperative demand response management framework for IES, Appl. Energy 367 (2024), https://doi.org/10.1016/j.apenergy.2024.123319 123319.
[7]H. Gao, Y. Zhao, S. He, J. Liu, Demand response management of community integrated energy system:a multi-energy retail package perspective, Appl. Energy 330 (2023), https://doi.org/10.1016/j.apenergy.2022.120278 120278.
[8]W. Zhao, J. Wang, D. Jiang, Demand response potential of customer-side integrated energy system, IOP Conf. Ser.: Earth Environ. Sci 632 (2021), https://doi.org/10.1088/1755-1315/632/4/042026 042026.
[9]S.X.Chen,H.B.Gooi,Sizingofenergystoragesystemformicrogrids,in: 2010 IEEE 11th International Conference on Probabilistic Methods Applied to Power Systems, IEEE, Singapore, Singapore,2010,pp.6-11,https://doi.org/10.1109/PMAPS.2010.5528720.
[10]A. Chaouachi, R.M. Kamel, R. Andoulsi, K. Nagasaka,Multiobjective intelligent energy management for a microgrid,IEEE Trans. Ind. Electron. 60 (2013) 1688-1699, https://doi.org/10.1109/TIE.2012.2188873.
[11]M. El Qasery, A. Ahmed, L. Id-Khajine, Comparative analysis of Ga and Pso algorithms for optimal cost management in on-grid microgrid energy systems with Pv-ba ttery, Integration (2024),https://doi.org/10.2139/ssrn.4745164.
[12]S. Kumar, V. Kumar, N. Katal, S.K. Singh, S. Sharma, P. Singh,Multiarea economic dispatch using evolutionary algorithms,Math.Probl. Eng. 2021 (2021) 1-14, https://doi.org/10.1155/2021/3577087.
[13]M. Hamdi, L. Idomghar, M. Chaoui, A. Kachouri, An improved adaptive differential evolution optimizer for non-convex economic dispatch problems, Appl. Soft Comput. 85 (2019), https://doi.org/10.1016/j.asoc.2019.105868 105868.
[14]M. Ghasemi, M. Deriche, P. Trojovsky´, Z. Mansor, M. Zare, E.Trojovska´, L. Abualigah, A.E. Ezugwu, S.K. Mohammadi, An efficient bio-inspired algorithm based on humpback whale migration for constrained engineering optimization, Results Eng.25 (2025), https://doi.org/10.1016/j.rineng.2025.104215 104215.
[15]M. Ghasemi, M. Zare, S.K. Mohamm adi, et al., Applications of whale migration algorithm in optimal power flow problems of power systems[M]//Handbook of whale optimization algorithm,Academic Press, 2024, pp. 347-364.
[16]S. Mirjalili, S.M. Mirjalili, A. Lewis, Grey wolf optimizer, Adv.advengsoft.2013.12.007.Eng. Softw. 69 (2014) 46-61, https://doi.org/10.1016/j.
[17]J. Xue, B. Shen, A novel swarm intelligence optimization approach:sparrow search algorithm, Syst. Sci. Contr. Eng. 8 (2020) 22-34,https://doi.org/10.1080/21642583.2019.1708830.
[18]S. Mirjalili, A. Lewis, The whale optimization algorithm, Adv.Eng. Softw. 95 (2016) 51-67, https://doi.org/10.1016/j.advengsoft.2016.0 1.008.
Received 2 September 2025; re删vis除ed 8 Decembe r 2025; accepted 7 January 2026
Peer review under the responsibility of Global Energy Interconnection Group Co. Ltd.
* Corres删ponding au除thor.
E-mail address: zhengwu@swepdi.com (W. Zheng).
https://doi.org/10.1016/j.gloei.2026.01.007
2096-5117/© 2026 Global Energy Interconnection Group Co. Ltd. Publishing services by Elsevier B.V. on behalf of KeAi Communications Co. Ltd.This is an open access article under the CC BY-NC-ND license(http://creativecommons.org/licenses/by-nc-nd/4.0/).

Wu Zheng received his Bachelor’s degree from the China Three Gorges University,in June 2008. He received his Master’s degree from the Sichuan University, in June 2011. He is currently working in the Energy Planning Research Institute, Southwest Electric Power Design Institute Co., Ltd. of China Power Engineering Consulting Group in Chengdu, Sichuan Province. His research interests includepowersystem planning.