
0 Intr oduction
Under the dual pressures of global energy security and climate crisis, the development and utilization of renewable energy sources have gained increasing attention. To promote energy structure transformation, the National Energy Administration’s ‘‘14th Five-Year Modern Energy System Planning” proposes accelerating the construction of large-scale wind power and photovoltaic power generation base projects in desert regions [1]. These areas have abundant annual sunshine hours and solar radiation, providing natural advantages for developing large-scale photovoltaic power generation. However, due to the spatial mismatch between load centers and renewable energy distribution, power needs to be transmitted across regions.Voltage source converter based high voltage direct current transmission (VSC-HVDC) is an imp ortant means for power delivery from renewable energy bases [2], with unique operational characteristics: the system cannot be reduced to zero power and must maintain minimum power transmission to sustain the basic working state of the converter station, ensuring reliable response to power transmission demands at any time [3]. This characteristic places high requirements on the power and energy guarantee of the converter station.
Desert regions generally feature high altitude, large daynight temperature difference s, and frequent extreme weather [4]. Meanwhile, the power grid infrastructure in these remote areas is weak, mak ing it difficult to provide stable and sufficient power [5]. These special geographical environments and grid conditions mean that ‘‘pure photovoltaic power stations” without conventional power support will continue to exist for some time. The intermittent nature of photovoltaic power generation causes station output to be affected by natural weather conditions: zero power generation at night, prolonged low or zero output during continuous rainy days, and sudden cloud cover significantly reducing generation efficiency. Additionally,photovoltaic power generation exhibits a typical ‘‘camelhump” daily output characteristic, while receiving-end power loads typically peak in the morning and evening,creating a noticeable temporal mismatch.
The intermittency of photovoltaic generation and its temporal mismatch with load characteristics bring two prominent issues: on one hand, when sunlight is abundant,photovoltaic output far exceeds load demand, causing significant power curtailment; on the other hand, although VSC-HVDC systems support power reversal from receiving to sending end during low/no light conditions, during peak load periods at the receiving end, the grid’s own scheduling resources are tight, and additional reverse transmission power demands will intensify its supply pressure and affect grid stability. Therefore, there is an urgent need for a solution capable of cross-period energy allocation, which can both absorb surplus power to reduce curtailment and provide reliable power supply to the converter station during receiving-end peak load periods,effectively achieving energy time-shifting while reducing reverse transmission pressure during peak load periods and ensuring the safe operation of the entire VSCHVDC transmission system.
Energy storage provides an effective pathway to solve this problem [6]. Batteries (BAT) offer high efficiency,mature technology, and fast response speed, but limited energy density, while hydrogen energy storage (HES) features high power and energy density, suitable for longcycle, large-capacity energy storage. Single storage methods struggle to simultaneously meet long-term energy security and daily regulation requirements, making electric-hydrogen hybrid energy storage combining the advantages of both an ideal solution for such scenarios[7].
Currently, electric-hydrogen hybrid energy storage technology has be come a research hotspot, with its complementary performance effectively addressing the limitations of single storage methods.Reference[8] optimized various components of a 100% wind-powered microgrid through a mixed-integer linear programming model, showing that electric-hydrogen hybrid energy storage systems can economically and efficiently balance demand fluctuations across various time scales. Reference [9] confirmed that hybrid storage can not only achieve short-term power balance but also provide long-term emergency power supply capab ilities, demonstrating excellent performance especially during extreme weather or natural disasters.Reference[10] proposed a zero-carbon microgrid technical solution based on batteries and hydrogen storage for remote areas rich in renewable energy but with weak grid infrastructure, which can effectively achieve year-round stable power supply through cross-seasonal hydrogen storage and the battery’s rapid response characteristics, while offering good economic and environmental benefits.
Existing research mainly focuses on system configuration and operational optimization in conventional application environments, while research on coordinated operation strategies balancing power curtailment absorption and power supply guarantee in the special scenario of ‘‘pure photovoltaic VSC-HVDC transmission” has not yet been conducted, and control strategies lack multi-scenario adaptability for varying weather conditions and forecasting uncertainties specific to VSC-HVDC operational requirements. In view of this, this paper proposes a solution and operational strategy for configuring electrichydrogen hybrid energy storage systems, through the coordination of short-cycle electric storage and long-cycle hydrogen storage, to achieve ‘‘valley storage peak release”and ‘‘forward state extension” for pure photovoltaic VSCHVDC systems: absorbing surplus power during abundant sunlight and receiving-end load troughs, and releasing energy to supply the VSC-HVDC converter station during receiving-end grid load peaks, extending the time of forward power transmission, achieving early delivery and delayed reverse transmission. The system adopts on-site hydrogen production, where electrolyzers are installed at the converter station to produce hydrogen using surplus photovoltaic power, avoiding the safety risks and high costs of long-distance hydrogen transportation. Considering the complexity and uncertainty of pure photovoltaic VSC-HVDC system operation under complex weather conditions, this paper constructs an operational strategy framework based on fuzzy logic control to achieve multiscenario adaptive decision-making. Meanwhile, to overcome the subjectivity in membership function design of conventional fuzzy control, particle swarm algorithm is used to optimize membership function parameters,improving control precision and adaptability, with case simulations verifying the effectiveness of the proposed scheme and strategy.
To address these challenges, this paper proposes a comprehensive solution from two key technical perspectives:
1) A novel electric-hydrogen hybrid energy storage configuration is designed specifically for pure photovoltaic VSC-HVDC converter stations, establishing coordinat ed operation between short-cycle battery storage and long-cycle hydrogen storage.
2) A multi-scenario adaptive control framework based on fuzzy logic with particle swarm optimized membership functions is developed to handle complex weather variations and operational uncertainties inherent in pure renewable energy transmission systems.
1 Operational mode modeling of pure photov oltaic VSCHVDC system
1.1 Weather pattern classification based on photovoltaic output
The output of photovoltaic power stations is influenced by meteorological factors, with the system operating in different conditions under various weather conditions.Using the Self-Organizing Map (SOM)clustering algorithm [11],the weather of each day throughout the year is classified into three categor ies: sunny, cloudy, and rainy. The selected feature vector d is:
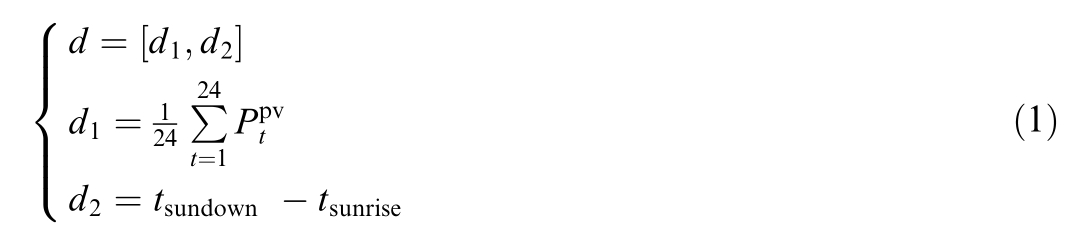
where d1 and d2 represent the daily average photovoltaic output and sunlight duration, respectively.  is the photovoltaic output at a certain time of the day, and tsunrise and tsundown are the sunrise and sunset times of the day,for which:

1.2 Photovoltaic net output characteristics and energy transfer analysis
The basic power supply requirement of the converter station is defined as Psys, and its difference with the photo-
voltaic output  is the photovoltaic net output
  :
:

During periods when the photovoltaic net output is negative, photovoltaic output alone cannot meet the converter station’s power supply requirements, and this power deficit is defined as S1. During periods when the photovoltaic net output is positive,photovoltaic output not only meets the converter station’s requirements but also has surplus power, which is defined as S2, as shown in Fig. 1. Here, S1 is represented in orange and S2 in green.
Based on the output conditions of photovoltaic power stations, the weather conditions throughout the year are categorized into two main types: ‘‘sufficient photovoltaic output days”, which include sunny and cloudy weather,and‘‘insufficient photovoltaic output days”,which are primarily rainy days.
On ‘‘sufficient photovoltaic output days”, the surplus power in the S2 region can be stored by the electrichydrogen hybrid energy storage system or transmitted to the receiving-end load. For the S1 region, power deficits during non-peak load periods can be met through reverse transmission from the receiving end, while power deficits during morning and evening peak periods are typically supplemented by battery discharge.
On ‘‘insufficient photovoltaic output days”, the system prioritizes storing the limited surplus power in the S2 region. Power deficits in the S1 region during morning and evening peak periods are still addressed by the energy storage system. Due to battery capacity limitations and significantly shortened lighting time under rainy conditions, hydrogen energy storage often needs to discharge synergistically. In case of continuous rainy days,hydrogen energy storage may need to assume the primary discharge task.In extreme cases,when energy storage is depleted and light conditions are poor, reverse transmission from the receiving end is required even during peak periods to ensure the safe and stable operation of the VSC-HVDC system.
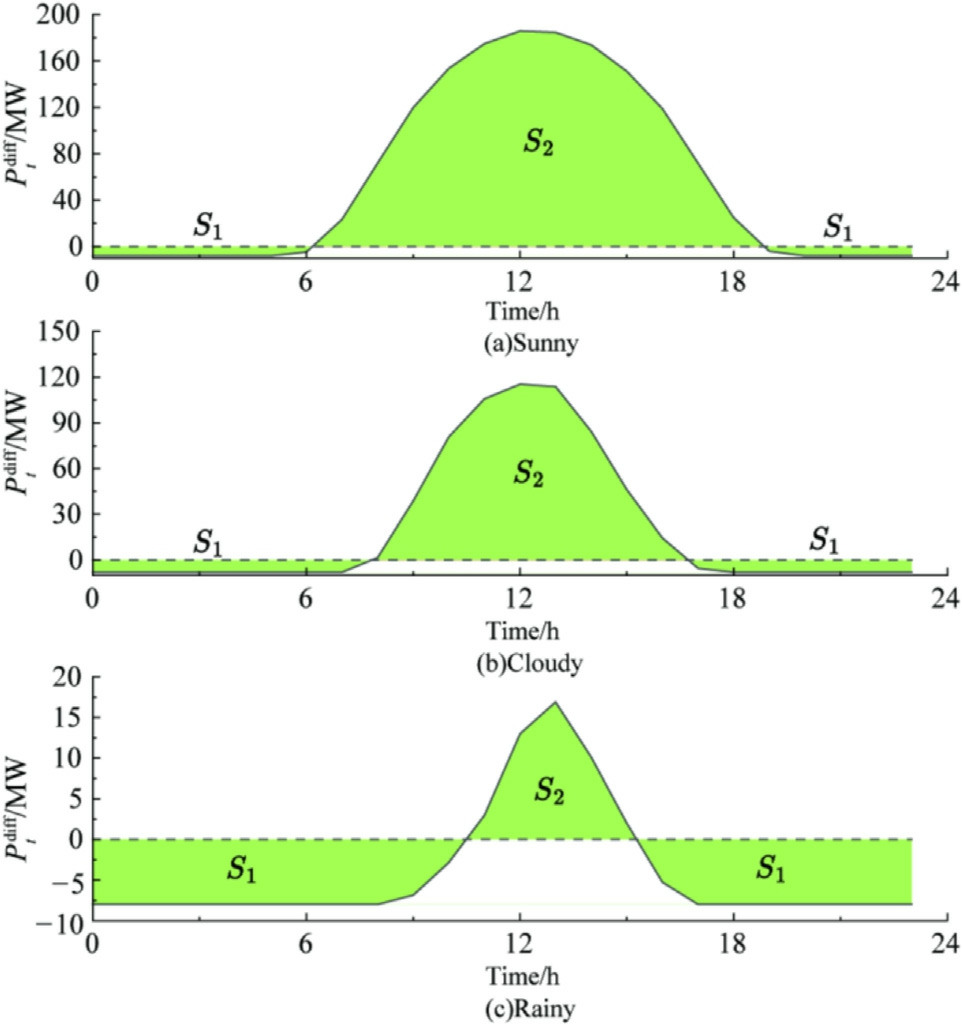
Fig. 1. Schematic representation of S1 and S2 for three basic weather conditions.
1.3 Temporal analysis of photovoltaic output and load demand
Photovoltaic power generation exhibits distinct daily variation patterns, with daily output showing a typical‘‘camel-hump” characteristic, generally rising gradu ally from sunrise,peaking at noon,and then gradually decreasing until sunset.
The receiving-end load exhibits a ‘‘double-peak” characteristic, with load levels showing two significant peaks during the day, corresponding to morning and evening electricity consumption peaks, while the noon period is a daytime load trough. This temporal misalignment between photovoltaic output and load demand makes it difficult to fully utilize large amounts of surplus power. To address this issue, the system uses energy storage to achieve temporal energy transfer,effectively storing energy during photovoltaic surplus periods and releasing it during insufficient photovoltaic generation periods, meeting the converter station’s basic power supply requirements while improving renewable energy consumption.
To further compare the temporal matching differences between photovoltaic output and receiving-end load, and to study the power utilization strategy during surplus photovoltaic generation periods on sunny and cloudy days, the S2 region during sunny days is selected for analysis,denoted as  .The surplus power in this region can be used for outward transmission,battery charging,or hydrogen energy storage. Residual power
  is defined as the difference between
  and the receiving-end load
  ,i.e.:

As shown in Fig. 2, under sunny conditions, th e curve forms two characteristic regions with the horizontal axis: the region below the axis (denoted as S3) indicates that photovoltaic output is insufficient to fully meet outward transmission demands, while the region above the axis (denoted as S4) represents the remaining power beyond outward transmis sion demands. If energy storage is not conducted during this period,this portion of electrical energy will be curtailed. Therefore, efforts should be made to utilize this power for reasonable storage,reducing the curtailment rate and providing guaranteed power supply for the converter station during load peaks. Under cloudy weather conditions, the area of S4 decreases and its duration shortens, indicating reduced curtailment time and amount.
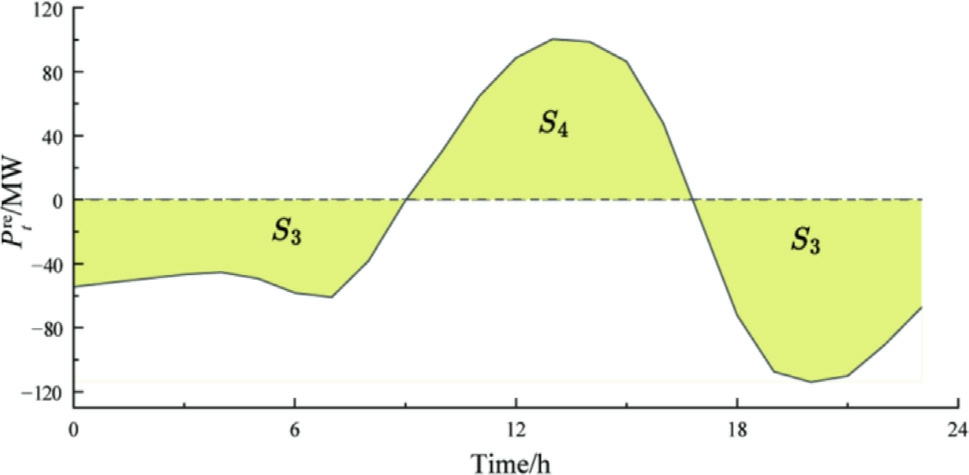
Fig. 2. Sch ematic  characteristic curve for sunny days.
This power matching characteristic provides an important basis for the operational control of the energy storage system. If the system only charges energy storage in the S4 region, it can maximize curtailment absorption, but if the area of this region is insufficient, it may lead to inadequate energy storage charging, affecting the reliability of converter station power supply in future periods. If the energy storage period is extended beyond the S4 region, i.e., conducting energy storage charging during non-curtailment periods,the area of S3 will further increase,meaning more originally outbound power is allocated to energy storage.Therefore, reasonable operational planning is essential.
2 System topology and ope rational constraints
The system topology is shown in Fig. 3. At the sending end, multiple photovoltaic power stations are connected in parallel to the system. Each photovoltaic power station consists of photovoltaic arrays, inverters, and transformers, with their outputs converging at the Point of Common Coupling (PCC). After stepping up voltage and being converted to direct current by the sending-end converter station, power is transmitted to the receiving end through high-voltage direct current transmission lines. At the receiving-end converter station,direct current is converted back to alternating current and connected to the receivingend grid through transformers. The receiving-end grid is connected to power sources and loads.
The power transmitted to the receiving end at a c ertain time  satisfies the following constraint:
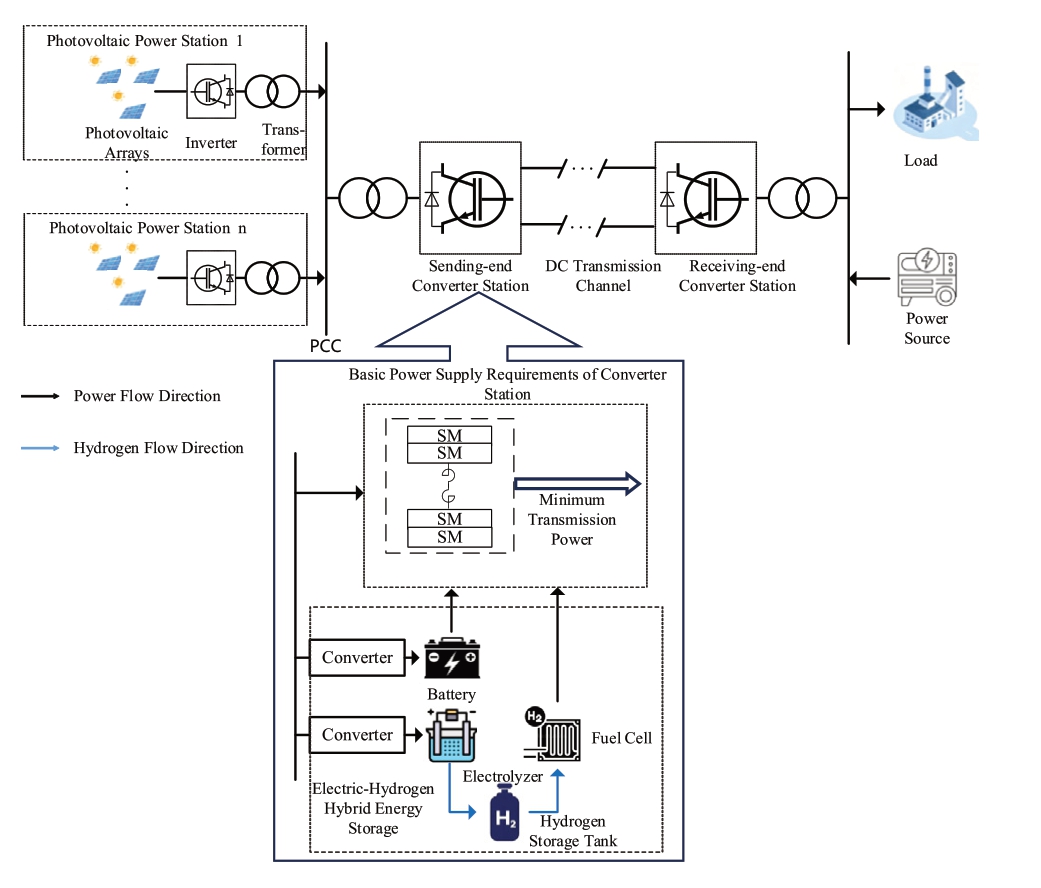
Fig. 3. Schematic diagram of the structure of the system.

The reverse transmission power from the receiving-end grid  satisfies the constraint:

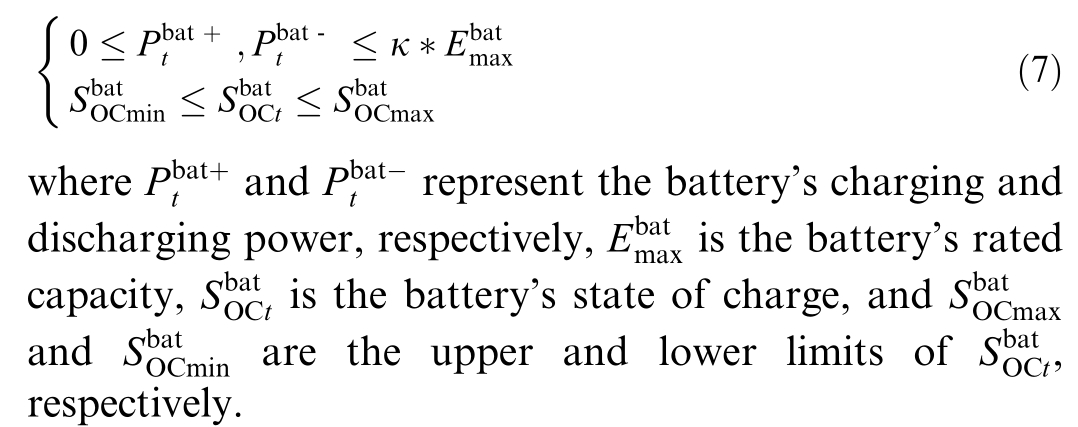
The station is equipped with an electric-hydrogen hybrid energy storage system, including the battery, the electrolyzer(ELY), the hydrogen storage tank(HST), and the fuel cell(FC). The battery undergo daily charge-discharge cycles to meet the converter station’s power supply requirements during peak load periods. Assuming a charge-di scharge rate of κ C, where C is the multiplier of the battery’s charge-discharge capability, defined as the ratio of hourly charge-discharge current to the battery’s rated capacity, the battery must satisfy the constraint:
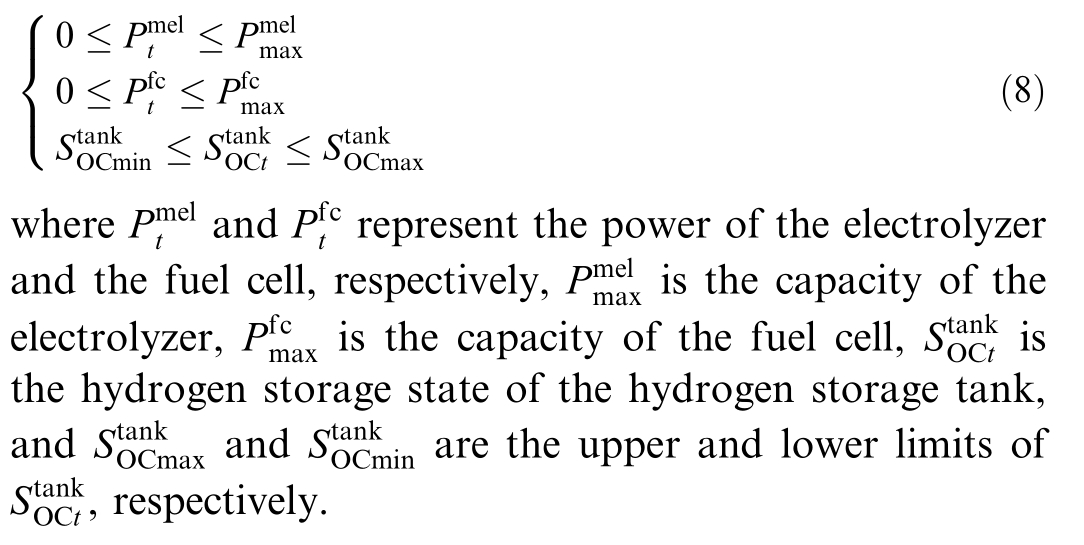
Meanwhile, hydrogen energy storage leverages its large capacity and long-cycle storage advantages. During favorable weather conditions, the electrolyzer produces hydrogen on a small scale, gradually accumulating reserves.During extreme weather conditions such as continuous rainy days, the fuel cell consume hydrogen to generate electricity, providing multi-day power supply guarantee for the converter station. The system must satisfy the following constraints:
3 Proposal of system optimi zed operation strategy
The VSC-HVDC converter station must always maintain minimum power transmission, and the basic power supply requirement of the converter station, Psys, is set as a hard constraint in the operation strategy design. Operational decisi ons need to simultaneously consider current weather conditions, energy storage status, and future weather forecasts among other multidimensional factors,coordinating energy storage behavior to ensure reliable fulfillment of the converter station’s power supply requirements. This complex mapping relationship from multiple inputs to multiple outputs is difficult to handle through traditional control methods. Fuzzy logic control, through linguistic rule sets and membership functions, can effectively construct nonlinear mappings between system states and decisions. Therefore, this paper constructs an operation strategy fram ework based on fuzzy logic, mainly divided into five modules: weather prediction and classification module,fuzzy logic controller module,power calculation module, power update (PU) module, and electrichydrogen energy storage SOC update module. The operation strategy is shown in Fig. 4.
1) Weather Prediction and Classification
The weather prediction and classification module functions to predict short-term weather conditions for the current day and the next three days, feeding results back to the input of the fuzzy logic controller. The input to the module is the current time t. First, the current time is mapped to a specific date n, where: n = t/24. W hen (t
1) mod24 = 0, photovoltaic output values for the next 96 h are predicted. According to (1), the weather conditions for each day are classified: for sunny days  2,for cloudy days
  1, and for rainy days
  0.
0.
Fig. 5 shows three typical weather prediction sequence scenarios when the current day is sunny, corresponding to different future weather combinations. Specifically,Scenario 1:  2 2 0 1 i 0 1 2 3;Scenario 2:
 2 0 0 0 i 0 1 2 3;Scenario 3:
  2 2 2 2 i 0 1 2 3.
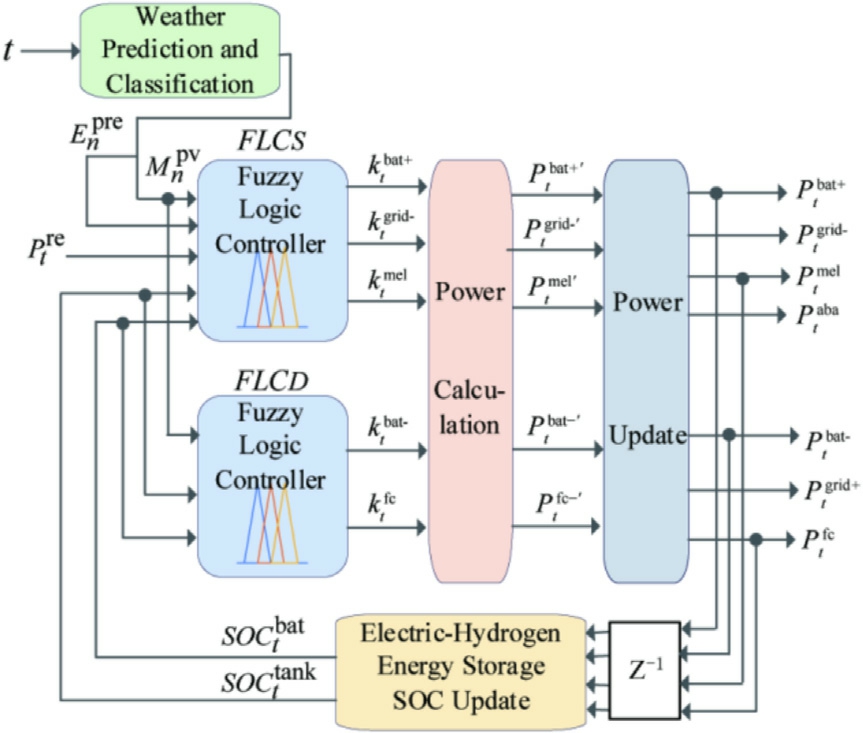
Fig. 4. Operation strategy block diagram.
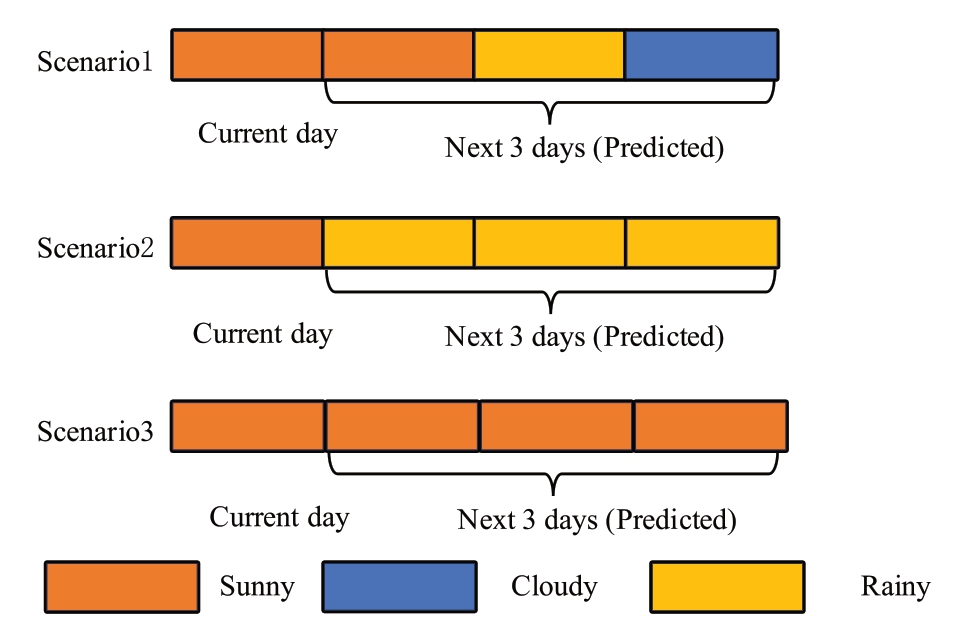
Fig. 5. Predictive sequences of PV output for three different scenarios.
Scenario 1: The electric-hydrogen hybrid energy storage system needs to consider the occurrence of a brief rainy day (the second future day) during the current sunny day. Since this rainy day is preceded and followed by good weather conditions, the energy storage system stores energy during the curtailment periods of the current day in preparation for the upcoming rainy day.
Scenario 2: Continuous rainy days occur over the next three days. Facing this scenario, relying solely on energy storage during the curtailment periods of the current day will hardly support the converter station’s power supply during peak load periods across multiple days. Therefore,it is necessary to expand the time window allowed for energy storage,reserving some power for storage even during non-curtailment periods, to ensure the survival of the VSC-HVDC system during future continuous rainy days.
Scenario 3: Since all days in the future sequence are sunny, peak load periods mainly rely on battery discharge for support, typically without consuming previously stored hydrogen. The energy storage system only produces hydrogen during daytime curtailment periods. However,continuous good weather leads to persistently high hydrogen storage levels, limiting hydrogen production space and causing more power curtailment. To address this situation,fuel cells can appropriately consume hydrogen during noncurtailment periods to support power transmission, then replenish hydrogen during curtailment periods the next day, increasing outbound power transmission and reducing curtailment rates through this cycle.
For the current day under cloudy weather conditions,although the curtailment period is slightly shortened, the strategy remains fundamentally similar. Under rainy day conditions, since photovoltaic power generation is significantly reduced, power outward transmission is typically not considered, and all limited surplus power is used for energy storage replenishment. In this case, the time window allowed for energy storage expands to the entire S2 region,maximizing energy storage under unfavorable light conditions.
Through  ,the power surplus/deficit situation for the next three days is quantified. For sunny and cloudy days,the power that can generally be converted to hydrogen for cross-day transfer is:

where  is the area of the S4 portion on day n,
  is the area of the S1 portion on day n, ηmel is the electrolyzer effi-ciency, ηbat = ηbat+*ηbat-, and ηbat+ and ηbat-are the battery charging and discharging efficiencies, respectively. α1 is the proportion coefficient of peak load periods on sunny days,representing the proportion of receiving-end peak load periods within the S1 region, used to calculate the power deficit that needs battery support. α2 is the proportion coefficient of peak load periods on cloudy days.
For rainy days, the power deficit that needs to be compensated by hydrogen energy storage is:

where  is the area of the S2 portion on day n, ηfc is the fuel cell efficiency, and α3 is the proportion coefficient of peak load periods on rainy days. Therefore, for day n,the power surplus/deficit for the next three days
  can be defined as:

where σ1, σ2, and σ3 are normalization coefficients. The sequence of weather conditions over the next three days affects the power surplus/deficit. If the next three days are rainy, sunny, and sunny, then the current day will need to produce more hydrogen to cope with the imminent rainy day. If the next three days are sun ny, sunny, and rainy,then the current day’s hydrogen production pressure is reduced because there are still two sunny days to accumulate hydrogen. σ1 >σ2 >σ3,indicating that days closer to the current day require more focused consideration.
2) Fuzzy Logic Controll er
The fuzzy logic controller proposed in this paper has two different FLCs, Surplus and Deficit, named FLCS and FLCD respectively. The objectives of the controller include minimizing the converter station’s dependence on the receiving end during peak load periods, maintaining the battery state of charge  and hydrogen storage tank state
  within reasonable and safe ranges,and ensuring reasonable photovoltaic power transmission while reducing curtailment.
Different modules operate according to power surplus( > 0, S2) and deficit (
 < 0, S1) conditions. During power surplus, the fuzzy logic controller has five inputs:battery SO
 , hydrogen storage tank SO
 ,current weather type
  ,future three-day power surplus/deficit
 ,and
,and  .At this time, the FLCS control module allocates excess energy in the S2 region, with three outputs:
 ,
,  ,
, ,corresponding to battery charging,hydrogen production via electrolyzer, and transmission to the receiving-end load. During energy deficit, the fuzzy logic controller has three inputs: battery
  ,hydrogen storage tank
  ,and current weather type
  .Here, the FLCD controls the energy storage system to fill the energy gap in the S1 region, with output s
  an d
an d ,corresponding to battery discharge and fuel cell discharge.
The fuzzification process depends on the number of inputs, domains, and the type and parameters of membership fun ctions for fuzzy sets. The domains for inputs and outputs are shown in Table 1.
Input Epnre contains 3 membership functions, divided into S (Small), M (Medium), and B (Big). Input  contains three membership functions: S (Sunny), C (Cloudy),and R (Rainy). Both
  and
and  contain 3 membership functions, with fuzzy sets including S, M, and B.
  contains four membership functions, with fuzzy sets including BN (Big Negative), SN (Small Negative), SP (Small Positive), and BP (Big Positive). For outputs, in addition to the fuzzy sets S, M, and B, a new membership function Z (Zero) is introduced to make control more flexible.For example, in scenarios where hydrogen production is not desired, selecting Z for executing
  output control would be more appropriate than selecting S.The membership functions for inputs and outputs are shown in Fig. 6.
The FLC rule base is created based on membership functions, covering all operational scenarios. The FLCS rule base contains 324 rules (5 inputs, with each input containing 3, 3, 3, 3, and 4 membership functions respectively,resulting in 3 3 3 3 4 =324 combinations),while the FLCD rule base contains 27 rules (3 inputs, with each input containing 3,3,and 3 membership functions,resulting in 3 3 3 combinations).
In the case of  > 0, differentiated energy storage strategies are adopted based on future weather predictions.For sunny and cloudy days
 = 1 or 2), energy storage operation depends on future weather forecasts. When future weather conditions are favorable
  is M), energy storage only occurs during curtailment periods
  is SP/BP, S4); when future weather is predicted to be unfavorable
  is S),the range of permitted energy storage periods is expanded, allowing storage during non-curtailment periods
  is BN/SN, S3). Simultaneously, SOC statusaffects power allocation strategy—when SOC is at a higher level, more power will be allocated to hydrogen production or outbound transmission. For rainy days, surplus power is prioritized for battery charging.
Table 1 Input and output domains.
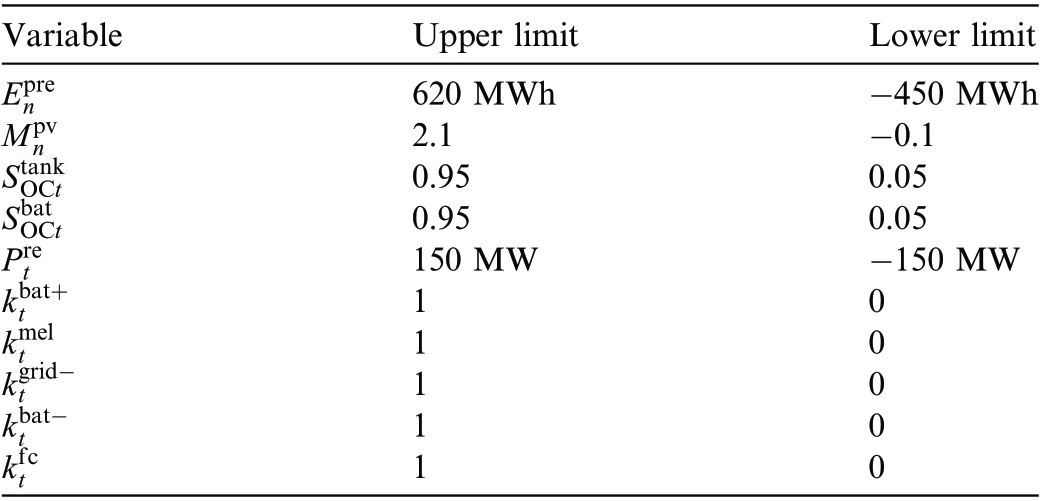
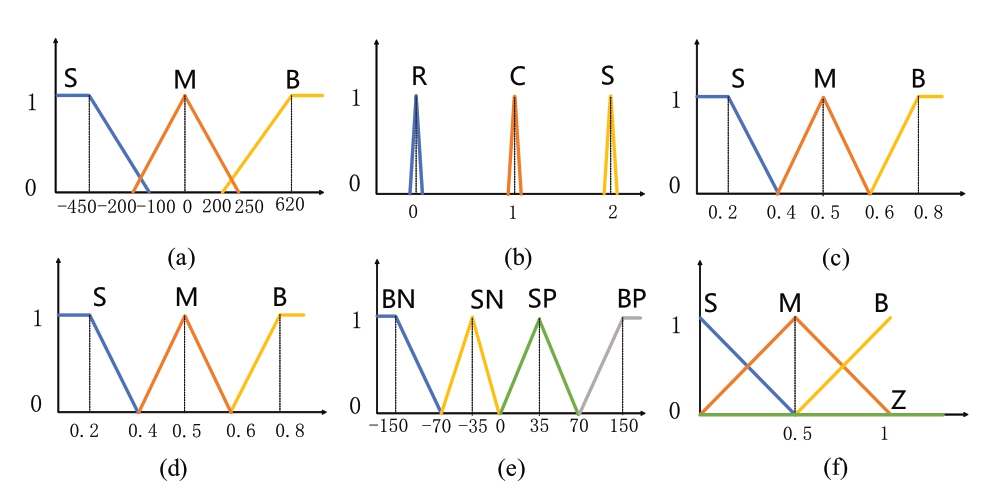
Fig. 6. Membership functions. a)  b)
b)  c)
c)  d) S
d) S .e)
.e) f)k
f)k /
/ /
/ /
/ //
// .
.
In the case o < 0, the energy storage system’s discharge strategy depends on current weather conditions:on non-rainy days, batteries discharge with priority, while on rainy days, batteries and fuel cells discharge jointly based on levels, ensuring power guarantee for the converter station during critical periods.
When continuous favorable weather is forecast in the future ( is B), to reduce curtailment and avoid power waste, fuel cells will assist with outbound transmission.The core concept of this strategy is that under energy surplus conditions (
 > 0, S2), for segments with relatively abundant hydrogen (
 is B/M), a new output variable
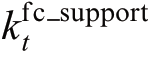 is introduced. During non-curtailment periods(
 is BN/SN, S3), fuel cells are guided to discharge in support of outbound transmission. The value of
 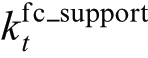 can be S (Small), M (Medium), or B (Big).
This strategy design offers dual benefits: on one hand, it enhances power outbound transmission; on the other hand, by releasing hydrogen reserves in advance, it reserves energy storage space for potential future curtailment periods, effectively reducing curtailment and achieving more efficient energy utilization.
The fuzzy logic control module employs Mamdanibased inference and center of gravity defuzzification. The membership functions, rule base, and boundaries of the fuzzy controller are adjustable, and their settings will affect the final results. Since this paper has already established relatively clear operational rules, and to reduce computational complexity, only the input membership functions are adjusted. This process uses particle swarm algorithm to minimize the operational objective, which is set to comprehensively consider two key performance indicators:Energy Dependence with the Grid (EDG) and the station’s Outgoing Power (OP). The particle swarm algorithm is selected for its effectiveness in handling high-dimensional continuous optimization problems without gradient requirements.
The EDG indicator [12] is used to quantify the converter station’s demand for reverse transmission from the receiving end during peak load periods, expressed as:

where Egrid+ is cthe total electrical energy reversetransmitted from the receiving end during peak load periods throughout the year, and Esys is the total energy demand of the converter station during this period.
Under the premise of ensuring reliability, the goal is to transmit su rplus power outward. The OP is expressed as:

Considering both indicators above, the objective function can be formulated as:

where ω1 and ω2 are the weights for each objective,EDGREF is the reference value for grid energy dependence,and OPREF is the reference value for the station’s outbound trans mission capability. The closer pecrformance indicators are to their reference values, the better the results for corresponding indicators.
Besides the EDG and OP parameters, power curtailment rate also needs to be consider ed. Its calculation method and meaning are as follows [13]:
Power Abandonment Rate (PAR) is defined as the ratio of curtailed power to generated power:

where  is the curtailed power. A lower curtailment rate repres ents more efficient energy utilization.
The membership functions to be optimized include 5 parameters for  ,5 adjustable parameters each for
 and
and  ,and 6 adjustable parameters for
  ,ultimately requiring 21 parameters to be adjusted through particle swarm algorithm. During parameter adjustment,the shape of triangular membership functions cannot be changed, and there cannot be gaps between membership functions.The corresponding constraints are given in[15].
3) Power Cal culation
After processing, the output parameters yield the corresponding battery charging power  ,outbound grid power
 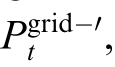 electrolyzer hydrogen production power
 , battery discharging power
  ,and fuel cell discharging power
  .Normalizing each parameter gives:

where i = 1-5 represent battery charging, transmission to receiving end, electrolyzer hydrogen production, battery discharging, and fuel cell discharging, respectively.  are the outputs of various fuzzy logic controllers, and
  are the normalized parameters of
  .Under power surplus conditions,
  and
and  are zero;under power deficit conditions,

,and  are zero.
Therefore, the output is:

where  represents the power allocated to each component.
For the special operating condition of predicted continuous favorable weather in the future, this paper proposes an innovative fuel cell outbound support strategy. In this strategy, the functional positioning of fuel cells undergoes a transformation—no longer limited to filling energy gaps during peak load periods in the S1 region, but parti cipating in power outbound transmission.The actual discharge power of fuel cells is mainly determined according to fuzzy rules. To achieve precise control, a discharge power ratio coefficient 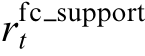 is introduced, with values determined by (18):

Based on this, the power of fuel cells is calculated as:

Correspondingly, the system’s outbound transmission power is adjusted to:

4) Power Upd ate
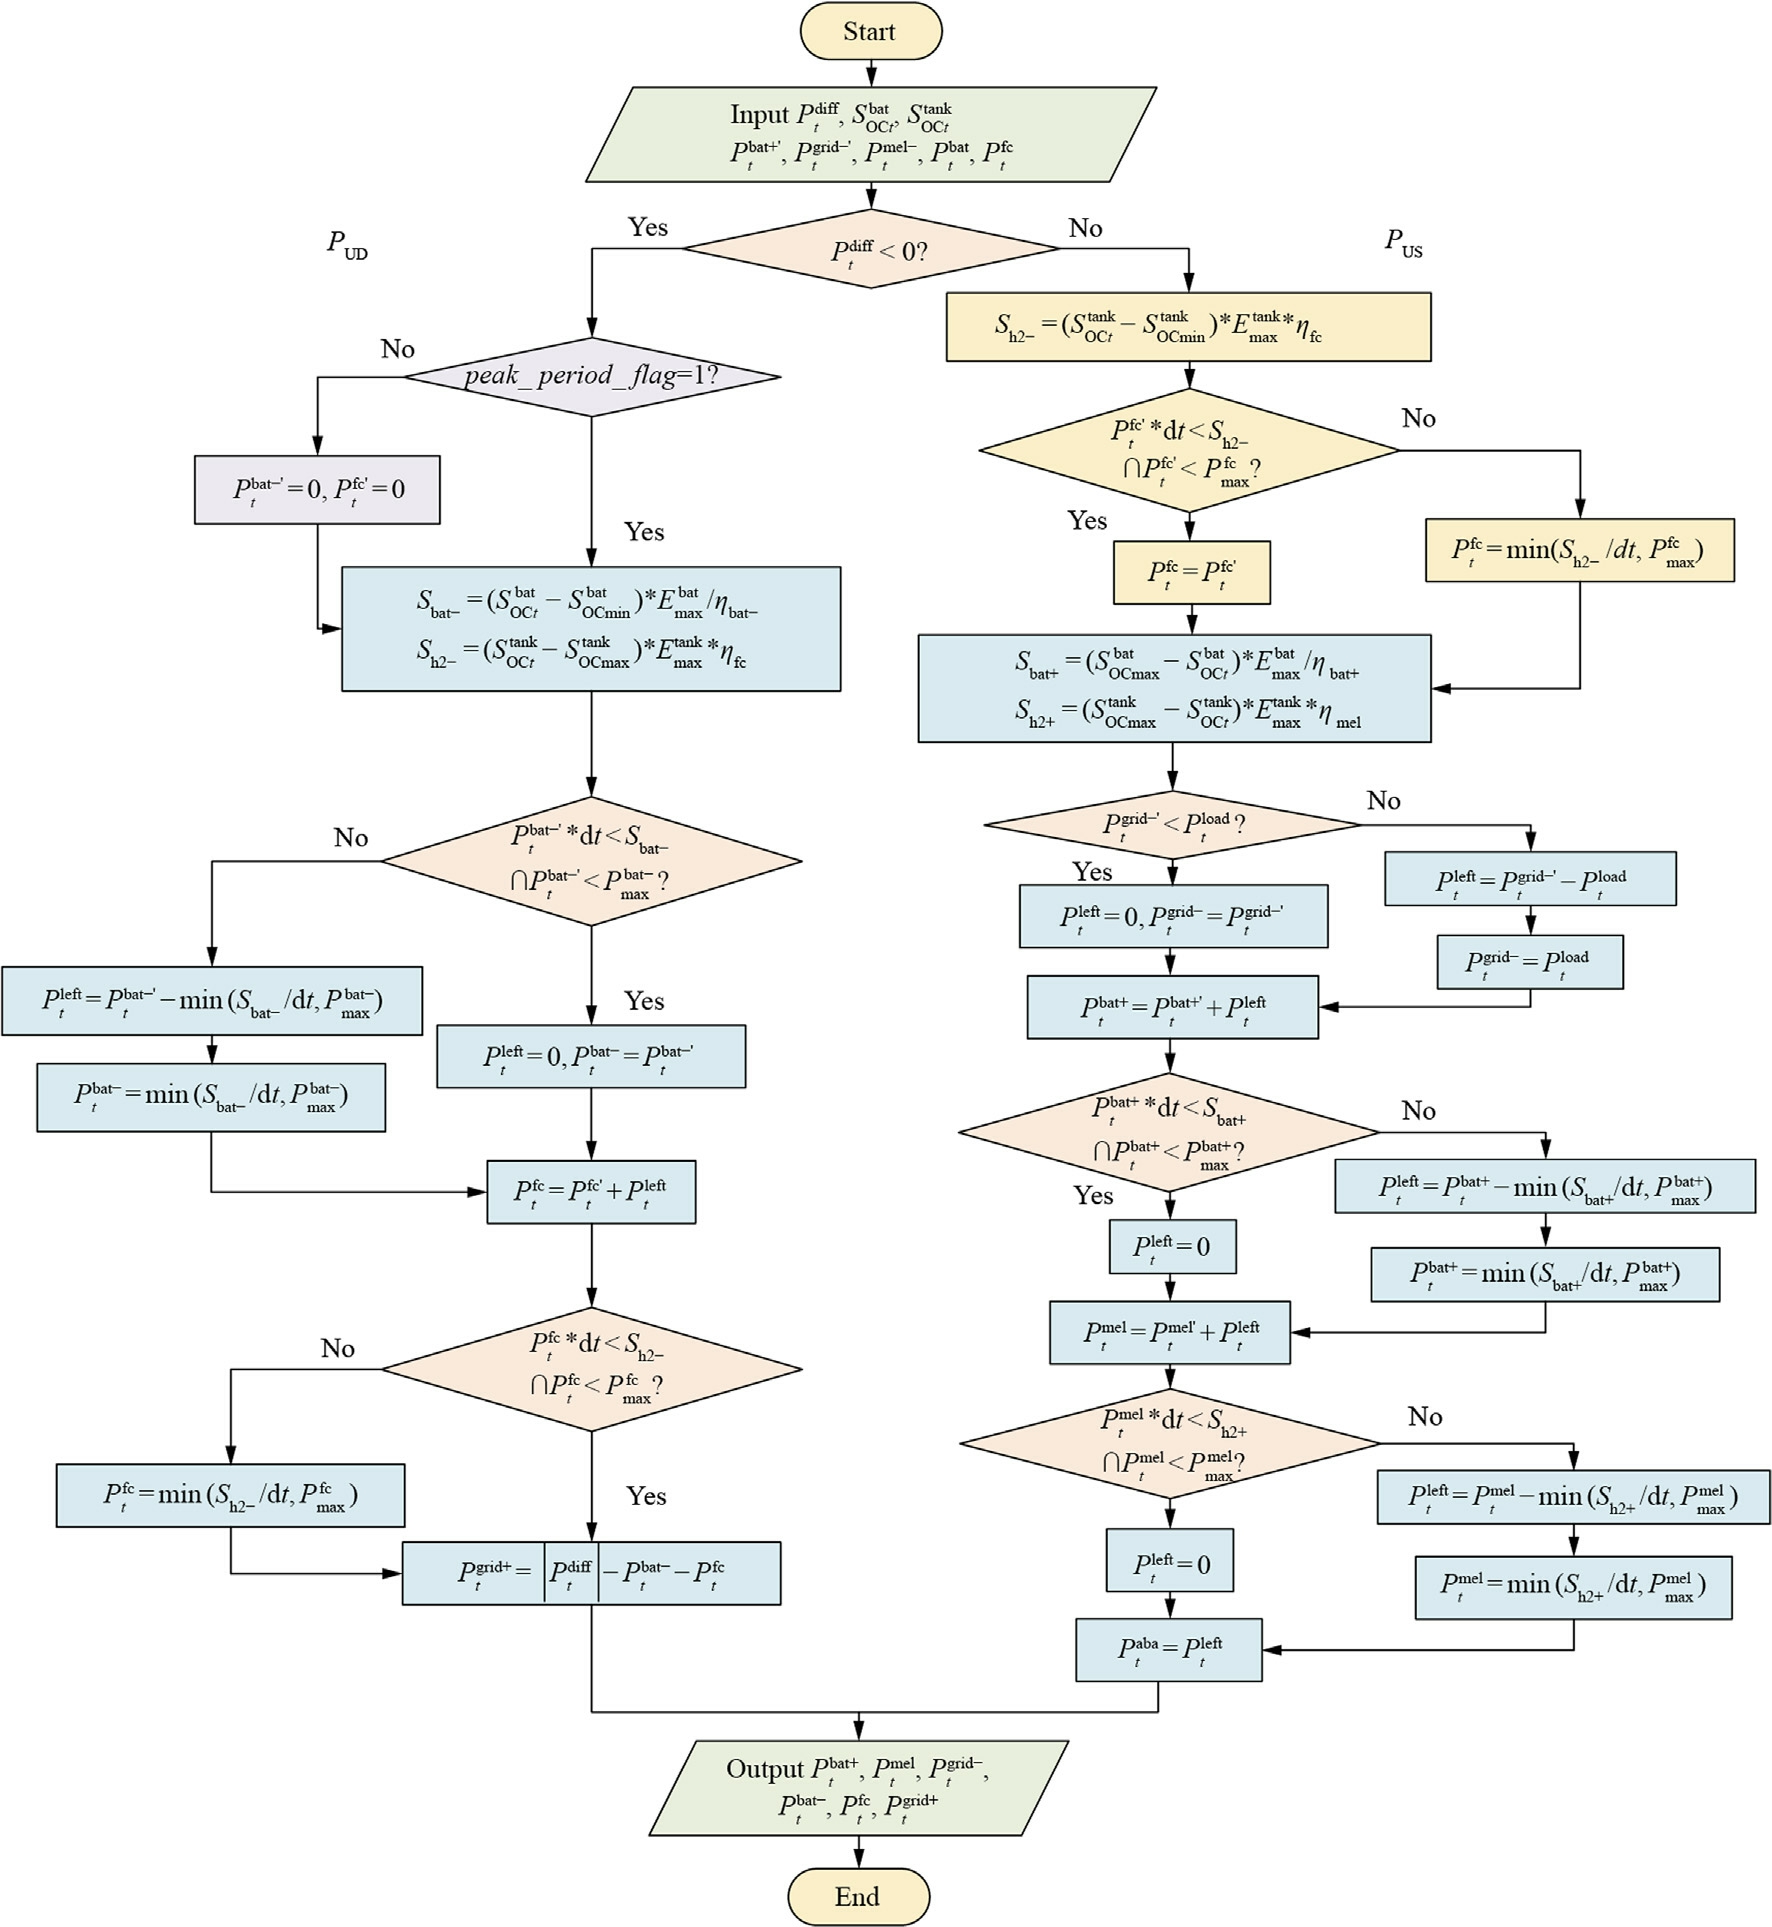
The power update module mainly handles power limit issues after fuzzy logic control, considering various constraints and calculating the fina l power allocation values through the power update module.The power update process is shown in Appendix A. The power update module is similarly divided into PUS and PUD parts, with inputs being the outputs from FLCS after power calculation(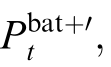
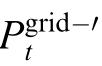

 and outputs from FLCD after power calculation (
 ), ultimately outputting the actual power of each component. Additionally, the power update module needs to add discharge period constraints,introducing a peak load flag peak_period_flag as a judgment condition. If peak_period_flag = 1, battery and fuel cell discharge power calculations continue;if peak_period_flag = 0, the power of both is directly set to zero.
WhenP  > 0, S
 and
and  represent the charging limit of the battery and the hydrogen storage limit of the hydrogen tank, respectively:

where  is the equivalent energy storage of the hydrogen tank:

where HHVH2 is the higher heating value of hydrogen, and H is the capacity of the hydrogen storage tank.
If the 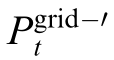 output by FLCS exceeds the current receiving-end load demand
  excess power is allocated to the energy storage system. If
 an d
an d exceed charging and hydrogen storage limits, or exceed the maximum battery charging power
  and electrolyz er capacity
  constraints, the remaining power becomes curtailed power.
When < 0,
< 0,  and
and  represent the discharge limits of the battery and hydrogen storag e tank at that time, calculated by:

If  and
and  output by FLCD exceed the discharge limits, or exceed the maximum battery discharge power
 and fuel cell capacity
  constraints, these powers are limited, and the deficit power is covered by reverse transmission from the receiving end
  .
.
For the case of fuel cell discharge supporting outbound transmission, constraint conditions in the power update section need to be adjusted. The system needs to ensure that the discharge power of fuel cel ls 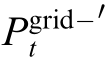 does not exceed the discharge limit of the hydrogen storage tank or the capacity constraint of fuel cell
  ,which is achieved by calculating Sh2- and performing constraint verification.
5) Electric-Hydrogen Energy Storage S OCUpdate
The electric-hydrogen energy storage SOC update module completes updates to the battery  and hydrogen storage tank
  , with inputs being
  ,
,  ,
, ,
, fromC time t-1. According to (26), S
 is updated;according to (27),
  is updated; and the updated S
 and
and  are returned to the input side of FLC for the next round of operation.


where dt is the time resolution.
4 Case analys is
To verify the effectiveness of the proposed operation strategy, this paper constructs a typical pure photovoltaic VSC-HVDC transmission system case based on the design scheme of the Tibet-Guangdong VSC-HVDC transmission project. The Tibet region possesses unique advantages in photovoltaic power generation due to its abundant sunshine,thin air,and high transparency[16,17]. The region’s sunshine duration shows distinct seasonal variations: during spring and autumn, sunrise and sunset occur roughly between 7:30-19:30; in summer, daylight hours reach 13-14 h; in winter, they shorten to 10-11 h. Photovo ltaic power generation typically peaks between 11:00-15:00.The receiving-end Guangdong region experiences morning peak loads from 07:00-09:00 and evening peak loads from 18:00-20:00.
The discharge periods of the energy storage system vary slightly with seasons. Taking cloudy days in spring as an example, the morning energy storage discharge period extends from 07:00 (beginning of morning peak) to approximately 08:00 (when photovoltaic output begins to exceed the converter station’s power supply requirements),while the evening energy storage discharge period extends from approximately 18:00 (when photovoltaic output begins to fall below the converter station’s power supply requirements) to 20:00 (end of evening peak). In summer,with extended daylight hours, the end time of morning energy storage discharge advances, and the start time of evening discharge delays.In winter,due to shortened daylight hours,the end time of morning discharge delays,and the start time of evening discharge advances. This paper uses energy storage requirements on cloudy days in spring as the benchmark for battery capacity configuration and continuous three-day rainy weather conditions as the basis for hydrogen energy storage system configuration.
A photovoltaic power station with an installed capacity of 200 MW is selected as the power source for the VSCHVDC transmission system. Considering the peak utilization characteristics of photovoltaic power stations, converter station capacity is typically designed at 60%-70%of photovoltaic installed capacity, set here at 120 MW.According to actual engineer ing specifications, the basic power supply requirement of the converter station is generally 10% of its rated capacity, making Psys 12 MW.For hydrogen energy storage configuration, ηmel is set at 0.8, ηfc at 0.6 [14]. HHVH2 is set at 39.39 kWh/kg, at 0.95, and
  at 0.05. For electric energy storage configuration, ηbat+ and ηbat- are both set at 0.95,
 at 0.95,
  at 0.05, and κ at 0.4. α1, α2, and α3 are set at 0.1, 0.2, and 0.4, respectively. ω1 and ω2 are set at 0.7 and 0.3, respectively. EDGREF is set at 0.01,and OPREF at 0.7. For the particle swarm algorithm, the number of particles N = 50, maximum iteration number Imax = 100, and initial values are the original values in Fig. 6. The time resolution dt is 15 min. Based on case requirement analysis and system characteristics,the capacities of various components are shown in Table 2.
To evaluate the performance of the optimization operation strategy proposed in this paper, four comparison systems were designed: #1 and #2 have the same energy storage capacity as our configuration. #1 is a rule-based strategy that allocates power during energy surplus according to the priority of battery-electrolyzer-power outbound transmission, and during energy deficit and receiving-end peak load periods according to the priority of battery-fuel cell-receiving-end reverse transmission. #2 is an optimization-goal-based strategy solved by Gurobi,with an annual operation objective given by (14), aiming to achieve the dual goals of low receiving-end reverse transmission dependence and high power outbound transmission. #3 is not equipped with energy storage and employs the same strategy as #2. #4 adopts the operation strategy proposed in this paper but without membership function optimization, while #5 represents the operation strategy with optimized membership functions.
Table 3 shows the operational results of each system.The comparison results demonstrate distinct performance patterns reflecting the inherent characteristics of each control approach. The rule-based system (#1) achieves the lowest EDG (0.0098) by strictly prioritizing energy stora ge during all surplus periods. However, this rigid approach results in the highest PAR(0.1769)as it lacks the flexibility to adapt storage decisions based on system conditions,leading to excessive curtailment when stora ge capacity is reached.
Table 2 Capacity of each component.
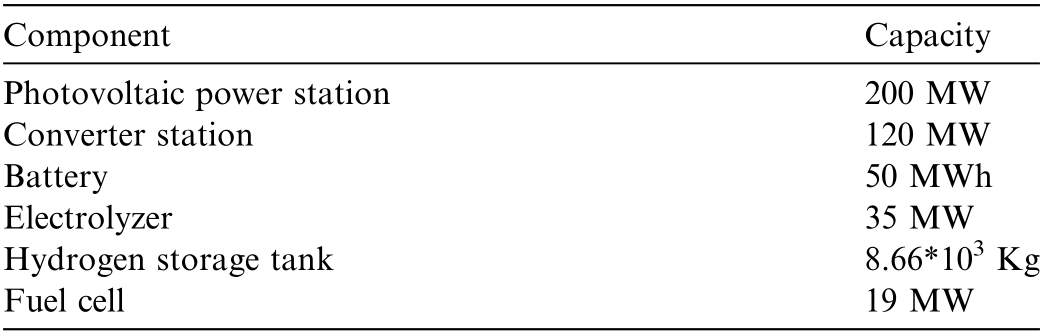
Table 3 Capacity of each component.
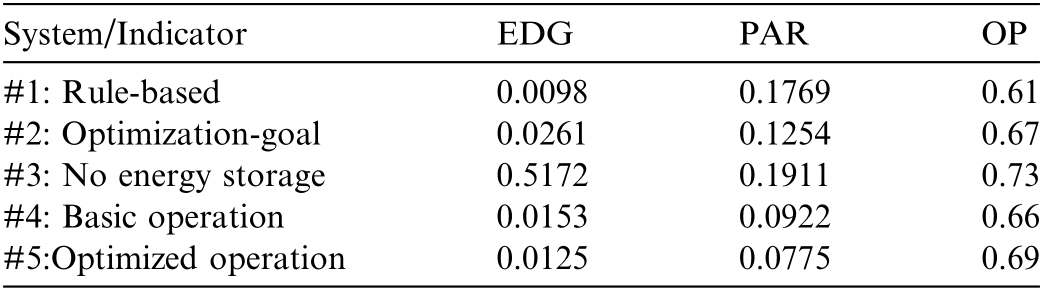
The optimization-goal-based system (#2) performs well in balancing multiple objectives, achieving moderate results across all metrics (EDG: 0.0261, PAR: 0.1254,OP: 0.67). While theoretically optimal for its defined objective function, its performance is constrained by computational requirements and sensitivity to forecast uncertainties.
Fig. 7 presents a comprehensive visualization of the performance improvements achieved by the proposed optimized operation system (#5) relative to each baseline method across all three key metrics. #5 exhibits significant performance advantages, its EDG is 0.0125, 52% lower than #2, benefiting from the fuzzy control strategy’s effective scheduling of the energy storage system, providing timely energy compensation during power deficiency,thereby significantly reducing receiving-end reverse transmission during peak load periods. #5 ensures good performance in other indicators while maintaining a low EDG,with a power curtailment rate approximately 56% lower than #1 and 38% lower than #2, while also having good outbound transmission capability. Membership function optimization further enhances operational effectiveness.Compared to the pre-optimization#4,#5 shows improvement in different performance indicators: EDG decreased by 19%, PAR decreased by 16%, and OP increased by 4%. These results indicate that optimized membership functions can achieve more precise power allocation.
The electric-hydrogen energy storage SOC curves and power balance for days 156 to 165 in system #5 s annual operation results are shown in Fig. 8. Orange, blue, and yellow in the background mark different weather conditions, with orange representing cloudy, blue representing sunny, and yellow repres enting rainy. The black dashed lines in the figure indicate daily receiving-end peak load periods.
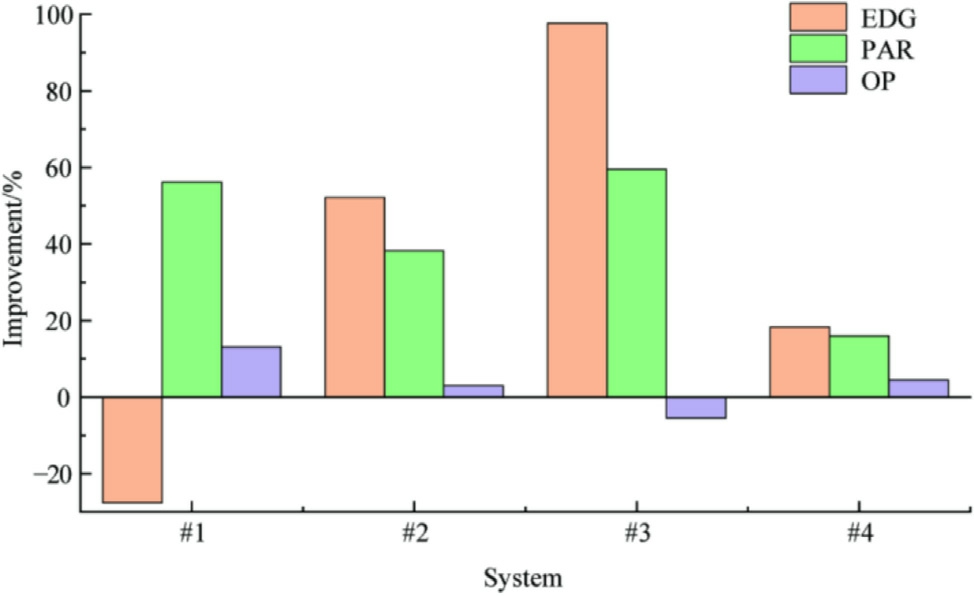
Fig. 7. Performance improvements of the proposed strategy (#5)compared to baseline system.
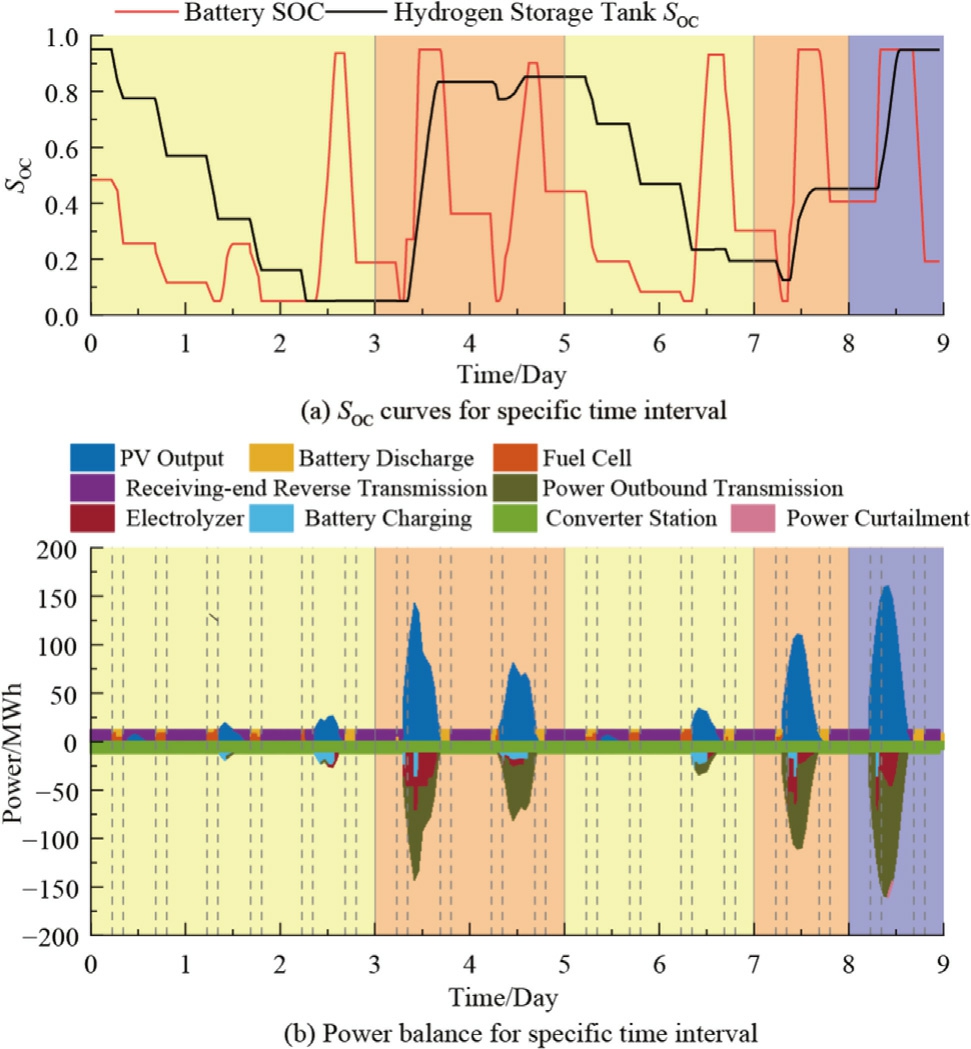
Fig. 8. SOC curves and power balance diagram for days 156 to 165.
The first three days are consecutive rainy days, with photovoltaic power generation having shorter duration and lower average output. During this time, fuel cells substantially consume previously accumulated hydrogen for discharge. When both the hydrogen storage level and battery state of charge reach their lower limits, the receivingend grid must reverse-transmit power during peak load periods to maintain normal system operation. Days 3-5 are cloudy, and with two consecutive rainy days predicted to occur ( is S), the system significantly extends hydrogen production time during the day to accumulate energy reserves for the upcoming adverse weather. During days 5-7, rainy-day photovoltaic generation exceeds minimum requirements at certain periods, with surplus power first considered for battery charging; if
  reaches the B region, FLCS allocates some power to hydrogen production or outbound transmission. Days 8 and 9 are cloudy and sunny respectively, with
  being M, so energy storage only occurs during curtailment moments, with other periods prioritizing power outbound transmission.During this period, batteries undergo daily charge-discharge cycles, and hydrogen gradually accumulates. Evidently,the proposed operation strategy efficiently absorbs surplus power under favorable weather conditions,ensures reliable power supply to the converter station under extreme conditions such as consecutive rainy days, and effectively reduces the receiving-end grid’s reverse transmission pressure during peak load periods.
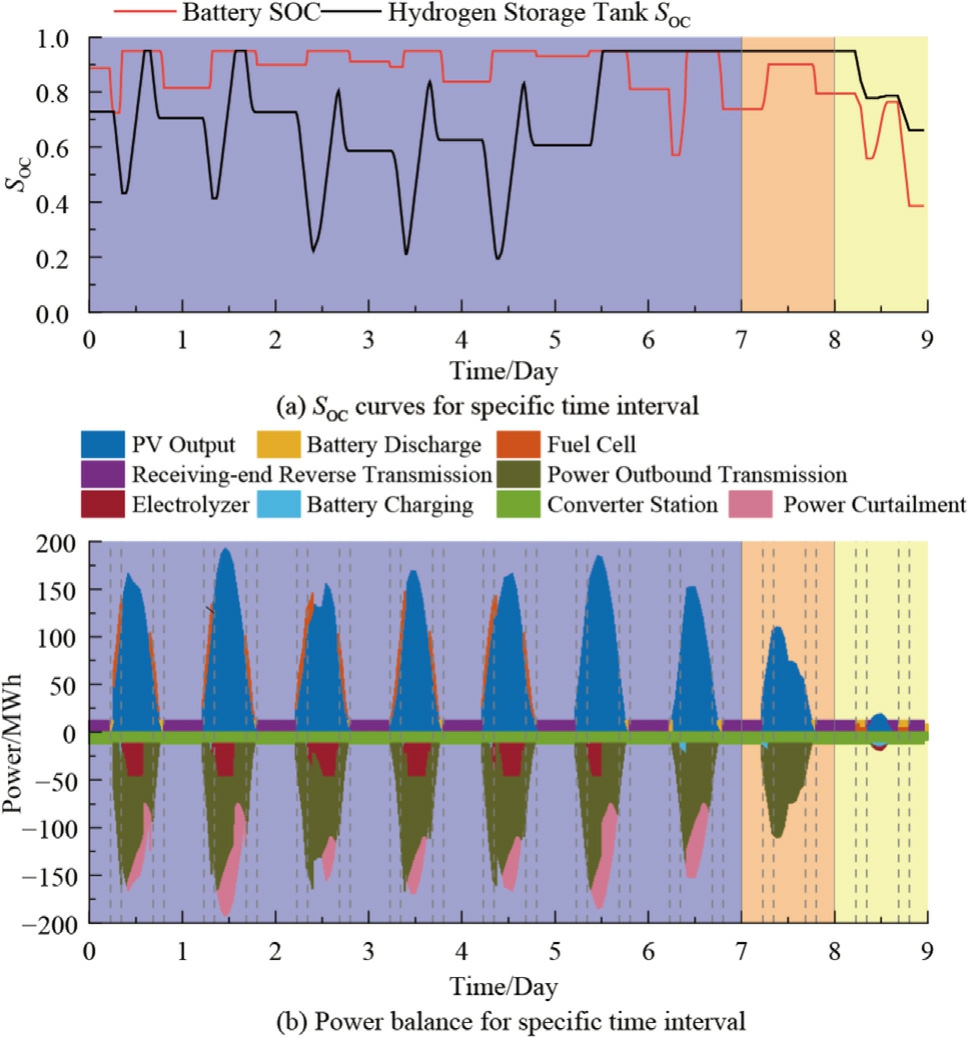
Fig. 9. SOC curves and power balance diagram for days 11 to 20.
The electric-hydrogen energy storage SOC curves and power balance for days 11 to 20 in system #5 s operation results are shown in Fig. 9. Unlike the previously described alternating rainy-cloudy-sunny operating conditions, consecutive sunny days exhibit unique operational characteristics: due to good daylight conditions,  maintains in the high region and displays regular small daily cycle characteristics, while
  shows obvious ‘‘sawtooth” fluctuations, reflecting frequent alternation between hydrogen production and consumption. The power balance diagram further demonstrates the system’s operating mechanism:during curtailment periods, surplus power is simultaneously allocated to battery charging and electrolyzer hydrogen production; during peak load periods, batteries discharge slightly to meet converter station power supply demands; during non-curtailment periods, fuel cells actively discharge in coordination with photovoltaics for joint outbound transmission.
Under these conditions, the fuel cell discharge during non-curtailment periods, not only enhances the system’s overall outbound power transmission but also creates acceptance capacity for subsequent curtailment peak periods by pre-releasing hydrogen storage space, effectively transferring energy from curtailment periods to noncurtailment periods. Evidently, the proposed electrichydrogen hybrid energy storage operation strategy demonstrates excellent adaptability even under consecutive favorable weather conditions, improving the overall system’s energy utilization efficiency and further verifying the applicability and effectiveness of this solution under various typical weather conditions.
5 Concl usion
This paper addresses the temporal mismatch between photovoltaic generation and load as well as power supply demands during peak load periods at pure photovoltaic VSC-HVDC transmission converter stations, proposing a solution based on electric-hydrogen hybrid energy storage and an optimized operation strategy. Case analysis demonstrates the feasibility of the proposed strategy in ensuring reliable operation of pure photovoltaic VSCHVDC systems and achieving efficient energy utilization.The main conclusions are:
1) The paper clearly identifies the power supply requirements of converter stations in pure photovoltaic VSC-HVDC transmission systems and the functional positioning of hybrid energy storage systems. It establishes a coordinated mechanism of short-cycle regulation with batteries for daytime rapid charging and discharge during peak load periods, and hydrogen energy storage for long-term guarantee during continuous rainy weather conditions and discharge support for outbound transmission during favorable weather. This achieves effective energy transfer and utilization across time periods and different weather conditions.
2) The paper proposes a system operation strategy based on fuzzy logic and membership function optimization, establishing a multi-indicator evaluation system that includes energy dependence with the grid, power station transmission capability, and power curtailment rate.
3) Case results show that the proposed electrichydrogen hybrid energy storage operation strategy is effective and reasonable. It can accommodate curtailed photovoltaic power, meet the power supply requirements of sending-end converter stations during receiving-end grid peak load periods coupled with no light or weak light conditions, and reduce dependence on the receiving-end grid during specific periods.Compared with methods based on optimization objectives, the proposed strategy’s energy dependence with the grid indicator is 52% lower.
CRediT authorship contribution statement
Xiaojun Shen: Supervision, Methodology, Conceptualization. Letao Chen: Writing - review & editing, Writing- original draft, Methodology, Data curation. Congying Nie: Supervision. Xubin Liu: Supervision. Liping Wang:
Supervision.
Declaration of competing interest
We declare that we have no conflict of interest.
Acknowledgments
This work was supported by Natural Science Fundation of Shanghai, under the Shanghai Action Plan for Science,Technology and Innovation (22ZR1464800).
Appendix A
References
[1]W. Zhang, K. Bai, Z. Lu, et al., Analysis of the challenges and future morphological evolution of super large-scale renewable energy base, Global Energy Interconnect. 6 (1) (2023) 10-25.
[2]G.M. Ud Din, N. Husain, A. Yahya, et al., Mathematical analysis of advanced high voltage direct current transmission systems, in:2021 International Conference on Applied and Engineering Mathematics (ICAEM), 2021, pp. 61-66.
[3]Z. Yuan, P. Guo, G. Liu, et al., Review on control and protection for renewable energy integration through VSC-HVDC,High Volt.Eng. 46 (5) (2020) 1460-1475.
[4]P. Li, An empirical study of the post evaluation system for high altitude areas of large power grid construction project, North China Electric Power University, Beijing, China, 2016,Dissertation.
[5]Z. Liu, Y. Zhou, C. Jin, et al., Optimization strategy study on installation mix of renewable energy power base for supporting outbound delivery, J. Global Energ. Int. 6 (2) (2023) 101-112.
[6]S. Donglei, S. Yi, S. Yuanyuan, et al., Switching control strategy for an energy storage system based on multi-level logic judgment,Front. Energy Res. 11 (2023).
[7]Y. Jiang, X. Shen, Construction and application of digit al twin in hydrogen production system of alkaline water electrolyze r, High Volt. Eng. 48 (5) (2022) 1673-1683.
[8]M.A. Giovanniello, X.Y. Wu, Hybrid lithium-ion battery and hydrogen energy storage systems for a wind-supplied microgrid,Appl. Energy 345 (2023) 121311.
[9]Z. Zhang, Y. Nagasaki, D. Miyagi, et al.,Stored energy control for long-term continuous operation of an electric and hydrogen hybrid energy storage system for emergency power supply and solar power fluctuation compensation, Int. J. Hydrogen Energy 44 (16) (2019)8403-8414.
[10]X. Shen, X. Li, J. Yuan, et al., A hydrogen-based zero-carbon microgrid demonstration in renewable-rich remote areas: System design and economic feasibility, Appl. Energy 326 (2022) 120039.[11] T. Kohonen, Self-organized formation of topologically correct feature maps, Biol. Cybern. 43 (1) (1982) 59-69.
[12]D.A. Avile´s, F. Guinjoan, J. Barricarte, et al.,Battery management fuzzy control for a grid-tied microgrid with renewable generation,in: Proceedings of the IECON 2012-38th annual conference on IEEE industrial electronics society. IEEE, 2012, pp. 5607-5612.
[13]C. Xu, Y. Ke, Y. Li, et al., name="ref14" style="font-size: 1em; text-align: justify; text-indent: 2em; line-height: 1.8em; margin: 0.5em 0em;">[14]M. Rodriguez, D. Arcos-Aviles, W. Martinez, et al., Fuzzy logicbased energy management for isolated microgrid using metaheuristic optimization algorithms, Appl. Energy 335(2023)120771.
[15]L. Zhou, X. Yuan, Y. Wang, et al.,Survey on the current situation of independent photovoltaic power plant application and failure analysis in Tibet, Tibet Sci. Technol. 10 (2019) 53-55.
[16]Y. Xu, Y. Xu, Y. Huang, Generation of typical operation curves for hydrogen storage applied to the wind power fluctuation smoothing mode, Global Energy Interconnect. 5 (4) (2022) 353-361.
[17]Y. Huang, J.L. Zhang, G.T. Wang, Z. Xu, Transient stability analysis and improvement of isolated renewable energy bases with VSC-DC transmission, CSEE J. Power Energy Syst (2025) 1-11.
Received 4 April 2025; re删vis除ed 12 July 2025; accepted 7 August 2025
Peer review under the responsibility of Global Energy Interconnection Group Co. Ltd.
* Corres删ponding au除thor.
E-mail addresses:xjshen79@163.com (X. Shen), 2233081@tongji.edu.cn (L. Chen), 1808160402@qq.com (C. Nie), liuxubin@csu.edu.cn (X.Liu), wangjiananer@163.com (L. Wang).
https://doi.org/10.1016/j.gloei.2025.08.002
2096-5117/© 2025 Global Energy Interconnection Group Co. Ltd. Publishing services by Elsevier B.V. on behalf of KeAi Communications Co. Ltd.This is an open access article under the CC BY-NC-ND license(http://creativecommons.org/licenses/by-nc-nd/4.0/).

Xiaojun Shen received the Ph.D. degree from Shanghai Jiaotong University, Shanghai,China, in 2007. He is currently a Professor with the Department of Electrical Engineering,Tongji University, Shanghai. His main research directions are new energy-efficient utilization and energy saving, power equipment state perception and intelligent diagnosis.