
0 Introduction
After the first quarter of 2025, China’s total wind and photovoltaic installations reached 1.482 billion kW, surpassing its thermal power installations for the first time.However, the increasing permeation of renewable energy and intensifying power load fluctuations present major challenges to the stabi lity of the frequency of the power system [1-3]. Thermal power units (TPUs) represent the primary mechanism for conventional frequency control.However, these systems are constrained by mechanical inertia and response delays, which hinder their ability to meet the requirements of rapid and frequent automatic generation control (AGC) [4,5]. In this context, energy storage systems (ESSs) have become a vital technical tool for improving the performance of power syst em frequency regulation (FR) owing to their millisecond response speed and bidirectional regulation capability [6,7].
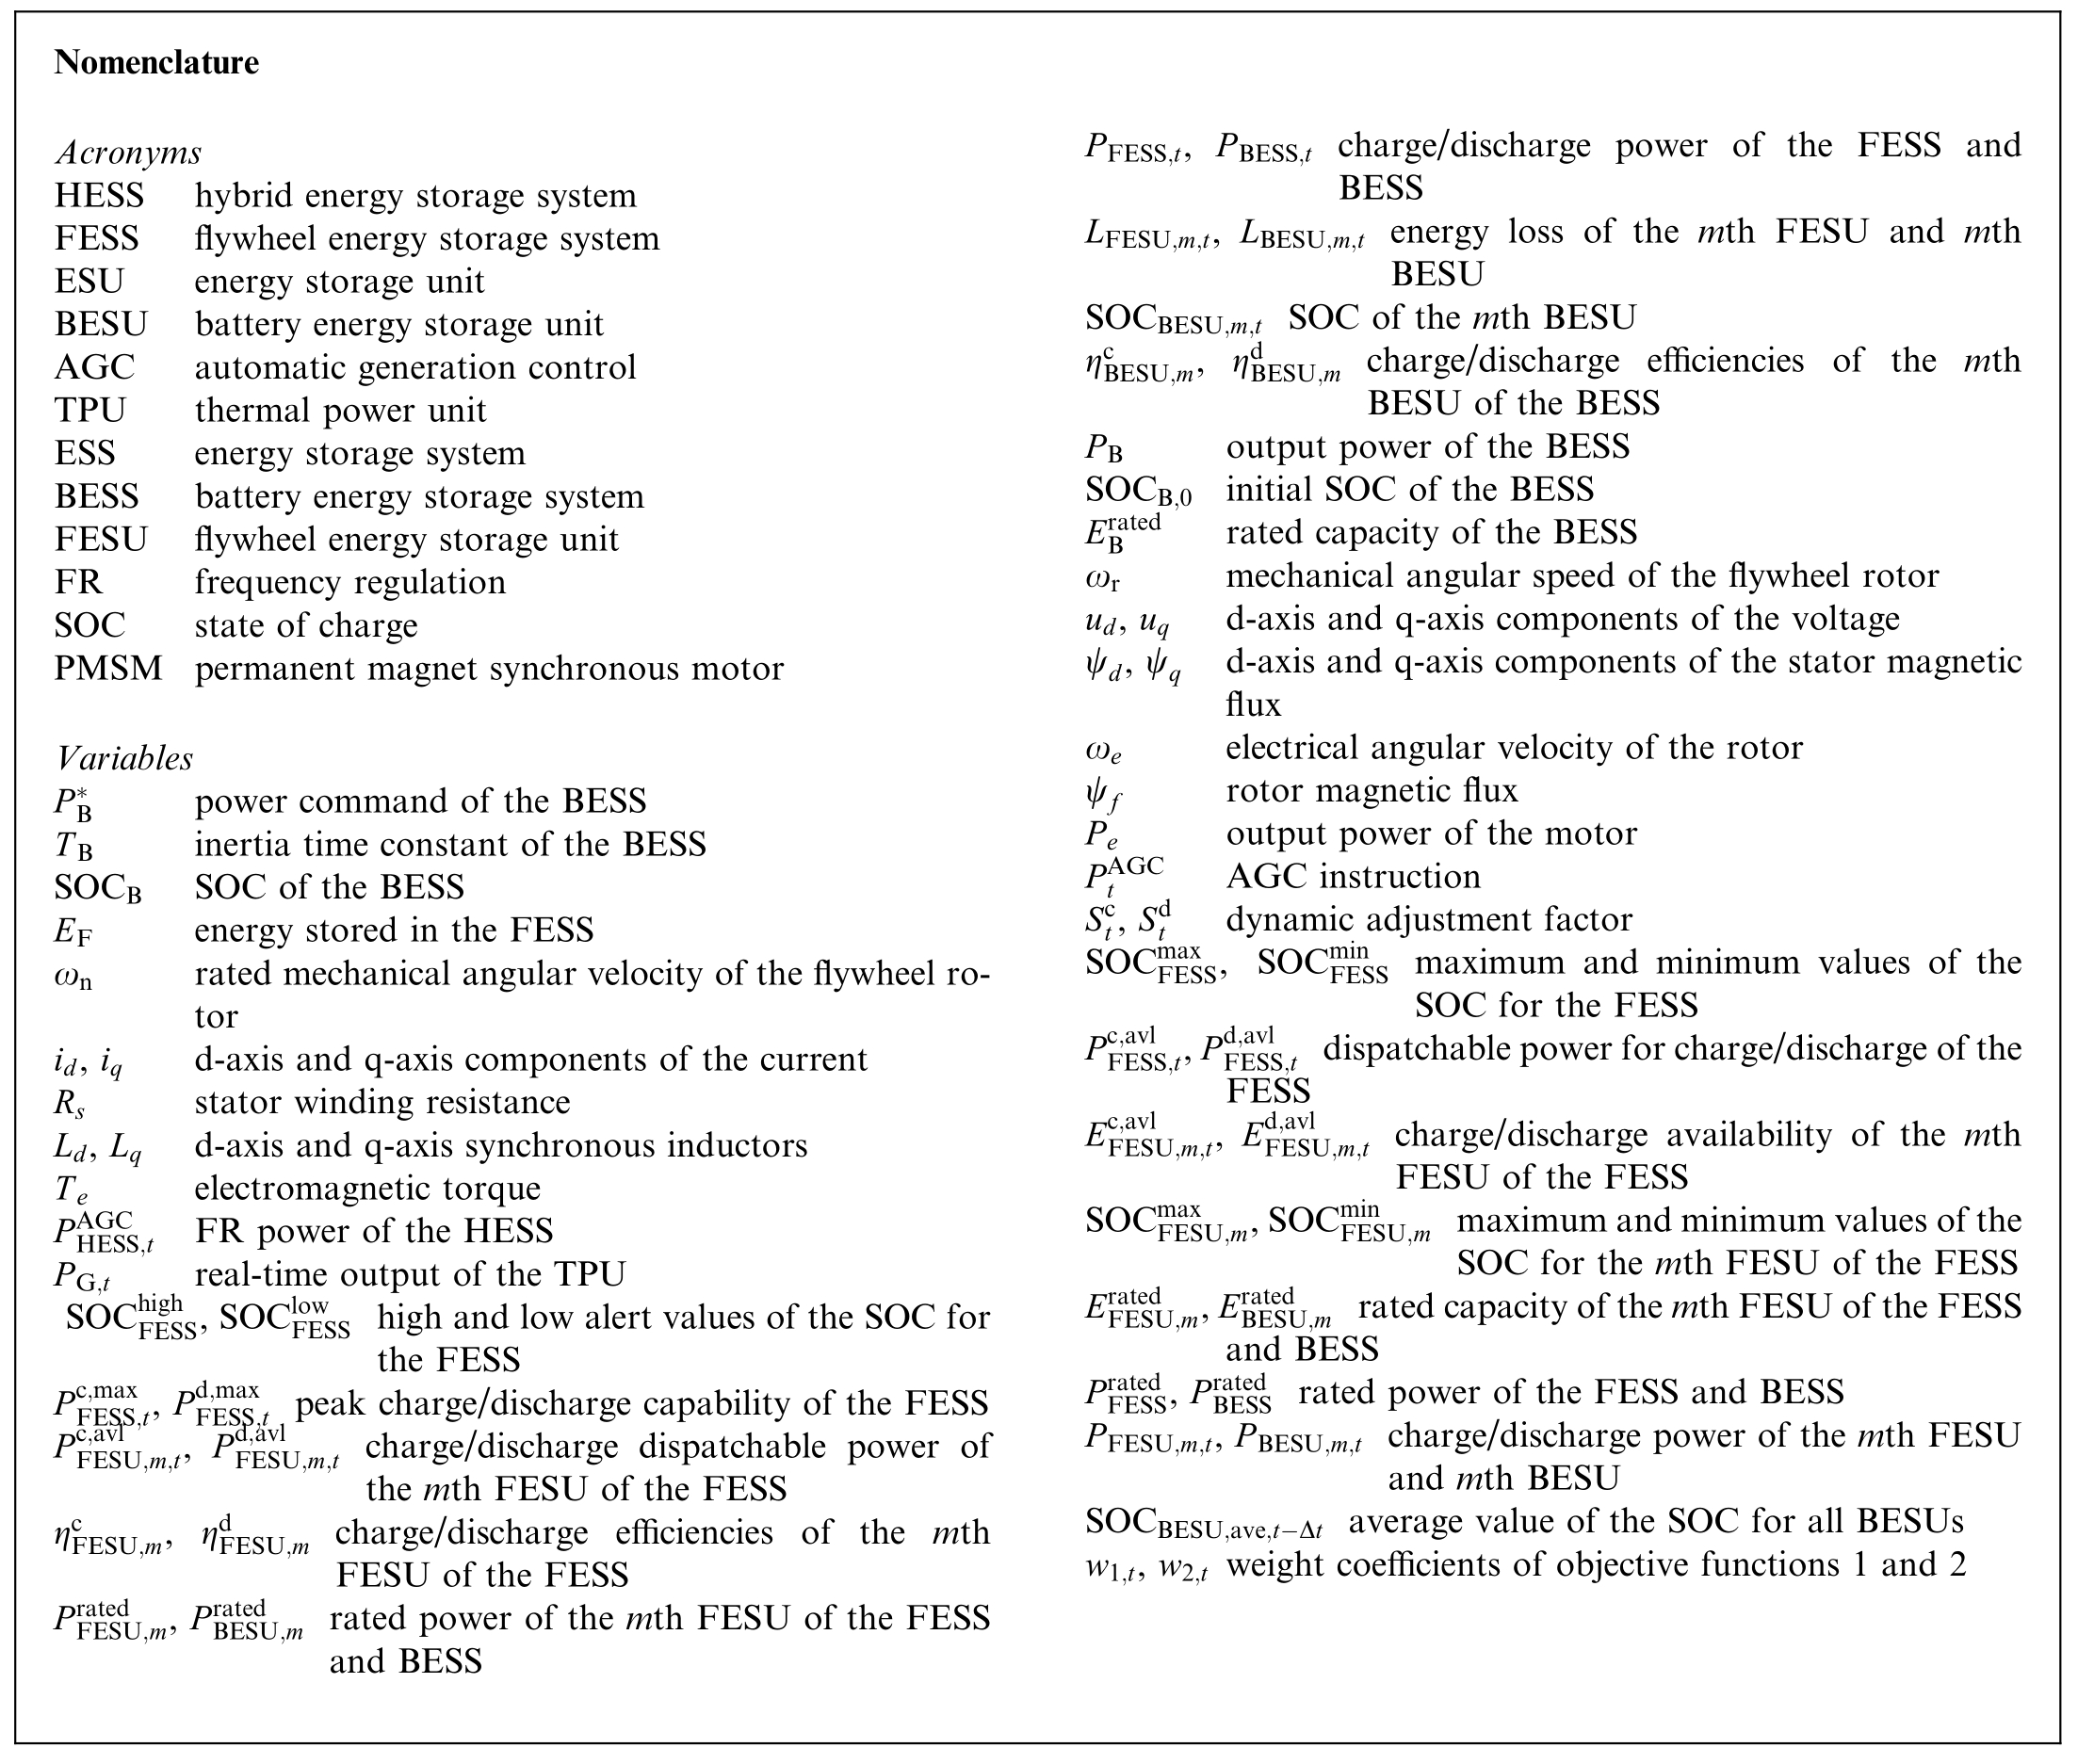
Extensive research has been conducted on the auxiliary FR of ESSs worldwide. In [8], the spectral decomposition of FR power signals was performed, assigning highfrequency components to battery energy stora ge systems(BESSs) and low-frequency elements to TPUs. In [9], a BESS lifetime loss model and a simplified model of TPU wear were developed to present a control strategy that considers the FR loss cost and state of charge (SOC)restoration of the BESS.The results indicated the effectiveness of this strategy in reducing the loss of joint thermalenergy storage FR. In [10], a style="font-size: 1em; text-align: justify; text-indent: 2em; line-height: 1.8em; margin: 0.5em 0em;">Some researchers have attempted to introduce HESSs into FR scenarios. In [16], variational mode decomposition was utilized to decouple power fluctuations, thereby dynamically assigning high-frequency bands to supercapacitors while reserving low-frequency bands for lithiumion batteries. This method only considers the difference between the two ESS types in terms of the response speed,whereas AGC FR is typica lly employed to reduce the lifetime loss of BESSs. In [17], the HESS output was prioritized based on the SOC of each ESS and a dual Logistic function was used to constrain the BESS output to avoid BESS life loss due to overcharge/overdischarge. This method cannot effectively reduce BESS life loss. In [18],the FESS responded preferentially to the FR power instructions when meeting the SOC requirements, and electrochemical ESS helped in responding to FR power instructions. This method effectively reduces the lifetime loss of the BESS but disregards the low energy density of the FESS,which makes the SOC of the FESS to be typically located within the SOC limits. In [19], the operating modes of the HESS were divided based on the SOC of the ESS, and the output of the HESS was prioritized based on the operating modes. This method can be used to maintain the SOC of each ESS within the designated ideal interval;however, it does not leverage the extended lifespan of the FESS.
The control strategy for coordinating the HESS output does not consider the reduction in BESS life loss and the improvement in the sustainable FR capability of the FESS and does not achieve the complementary advantages of the HESS. In addition, the ESS used in this strategy primarily refers to a single ESU. In practice, multiple ESU s with different characteristics usually form an ESS for responding to FR power commands owing to the minimal power and capacity of a single ESU. Coordinating each ESU within the ESS to maximize the per-unit FR performance remains a major challenge.
For the cooperative control of ESUs within the ESS,the control strategy is mostly optimized with the SOC of the ESU. In [20], a cooperative control algorithm was applied to ensure the consistency of the SOC of each ESU. In [21,22], an SOC equalization model for ESUs was established and optimized to recover the SOC equalization of the ESUs, thereby enabling the charge/discharge control of each ESU in this power station. To maintain a consistent SOC for each ESU in[23], the power command of each ESU was assigned based on the charge/discharge margin of each ESU. If the SOC of the ESU is large, the discharge margin is large and a larger discharge power command must be assigned. Conversely, if the SOC of the ESU is small, the charge margin is large and a larger charge power comma nd must be assigned. This strategy disregards the differences in the charge/discharge efficiencies of the ESU. Furthermore, optimization with only the SOC of the ESU may present low charge/discharge efficiency for the ESU and cause the effective SOC status to be constantly out of power.
The primary innovative contributions of this study to address ing these limitations are as follows:
1) The maximum output dynamic adjustment factor is established based on the improved Sigmoid function to adaptively modify the peak charge/discharge capability of the FESS.
2) The real-time dispatchable power constraint of the ESS is introduced based on the available power of each ESU. Subsequently, the coordinated allocation strategy of flywheel prioritization-battery replenishment is used to reduce the lifetime loss of the BESS.This helps in satisfying the peak charge/discharge capability constraints of the FESS and the realtime dispatchable power constraints of the ESS.
3) A multi-objective optimization model is established,based on minimizing the energy loss in the ESS and balancing the SOC. This model is solved using a multi-objective genetic algorithm.
4)The magnitude of the FR power borne by each ESS and the degree of SOC consistency of each ESU are consider ed to construct the adaptive weight coeffi-cients to determine the optimal solution from the Pareto solution set.
The remainder of the paper is organized as follows:Section 1 introduces the HESS and control strategy framework, Section 2 presents the multi-constraint coordinated control strategy for the HESS, Section 3 describes the multi-objective coordinated control stra tegy for the ESU,Section 4 details the construction of the control performance evaluation metrics, Section 5 presents a case study,and Section 6 concludes the paper.
1 Coordinated control of HESS
1.1 Model of HESS
1.1.1 Model of BESS
The FR model of the BESS employ s a first-order inertia model.
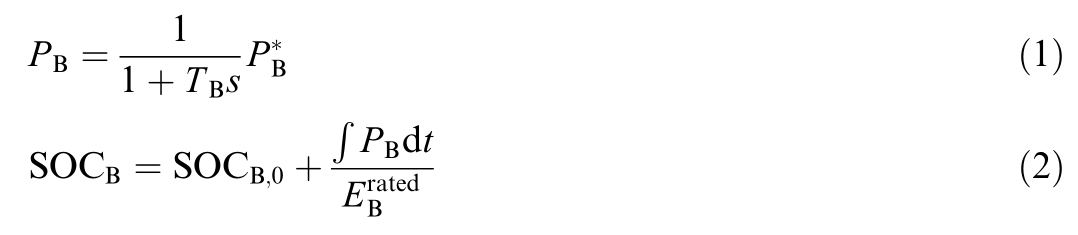
where  , PB, TB , SOC B,0, SOCB, and
  are the power command, output power, inertia time constant, initial SOC, SOC, and rated capacity of the BESS, respectively.
1.1.2 Model of BESS
We selected a permanent magnet synchronous motor(PMSM) for the FESS. The mathematical model of the FESS is established by describing the speed variation process of the PMSM as the charging and discharging process of the FESS.
The energy stored in the FESS is determined on the basis of the rotational speed of the flywheel rotor and can be expressed as

where EFis the energy stored in the FESS, J denotes the inertia of flywheel rotor, and ωr denotes the mechanical angular speed of flywheel rotor.
The SOC of FESS can be express ed as follows:

where ωndenotes the rated mechanical angular velocity of the flywheel rotor.
The voltage equation of PMSM is expressed as

where ud and uqdenote the d-axis and q-axis components of the voltage, respectively, id and iqare the d-axis and qaxis components of the current, respectively, ψd and ψqare the d-axis and q-axis components of the stator magnetic flux, respectively, Rsrepresents the stator winding resistance,and ωeis the electrical angular velocity of the rotor.

The flux linkage equation of PMSM can be expressed as
where Ld and Lqare the d-axis and q-axis synchronous inductors, respectively, and ψfis the rotor magnetic flux.
The electromagnetic torque equation and output power equati on of PMSM can be expressed as

where Te is the electromagnetic torque, p isthe number of pole pairs in the motor, an d Peis the output power of the motor.
The rotational motion of the PMSM can be expressed as follows:

where TLdenotes the mechanical torque from load and B is the damping coefficient.
1.2 FR system with HESS
The TPU-ESS joint FR is a novel power scheduling method that integrates the TPU and ESS for joint scheduling. This helps in achieving frequency balance in the power grid and in enhancing the stability and reliab ility of the power system. In this study, we focused on the HESS assisting the TPU AGC FR. The configuration of the TPU-HESS joint FR system is illustrated in Fig. 1.
The dispatch center automatically generates AGC commands by monitoring real-time information, such as the power system frequency, load and status of generating units. Subsequently, it transmits them to the distributed control system (DCS) of the units and the HESS. The DCS of the unit transmits power commands to the TPU and receives the real-time power and other operation status of the TPU. The hybrid energy storage control system subtracts the received AGC command and real-time output power of the TPU fed back from the unit DCS as the AGC command to be borne by the HESS (hereinafter referred to as the FR power of the HESS).

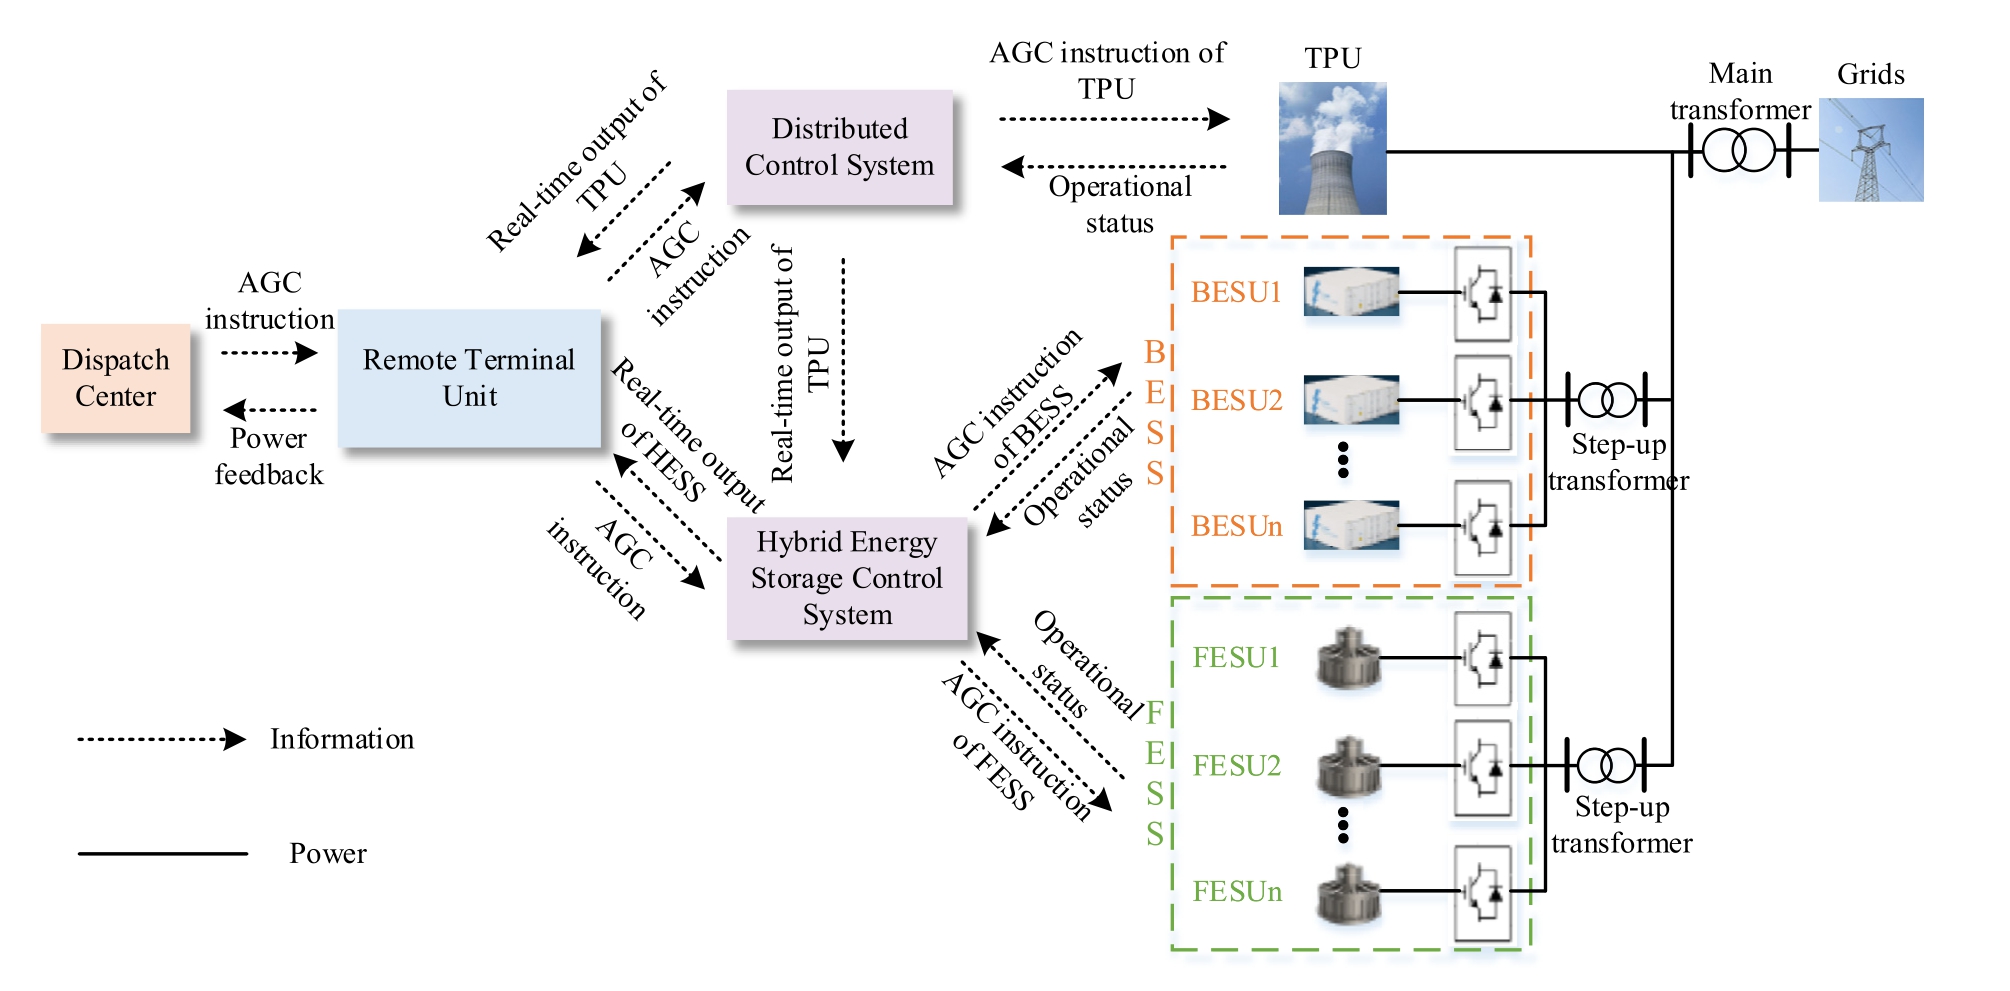
Fig. 1. Structure of TPU-HES S joint FR system.
where denotes the FR power of the HESS at time t.Positive values represent HESS discharge and negative values represent HESS charge.
  is the AGC instruction at time t, and PG,t denotes the real-time output of the TPU at time t.
The hybrid energy storage control system predistributes the FR power of the HESS between the BESS and FESS using the control strategy formulated below.Subsequently, each ESS redistributes the pre-distributed FR power to each of its internal ESUs.
1.3 Coordinated control strategy framework
Different types of ESSs exhibit different characteristics,and the characteristics of the ESU vary significantly within the ESS. In this study, we propose a cooperative control strategy for the participation of HESS in the AGC FR to optimize the advantage s of the HESS. The specific framework is shown in Fig. 2.
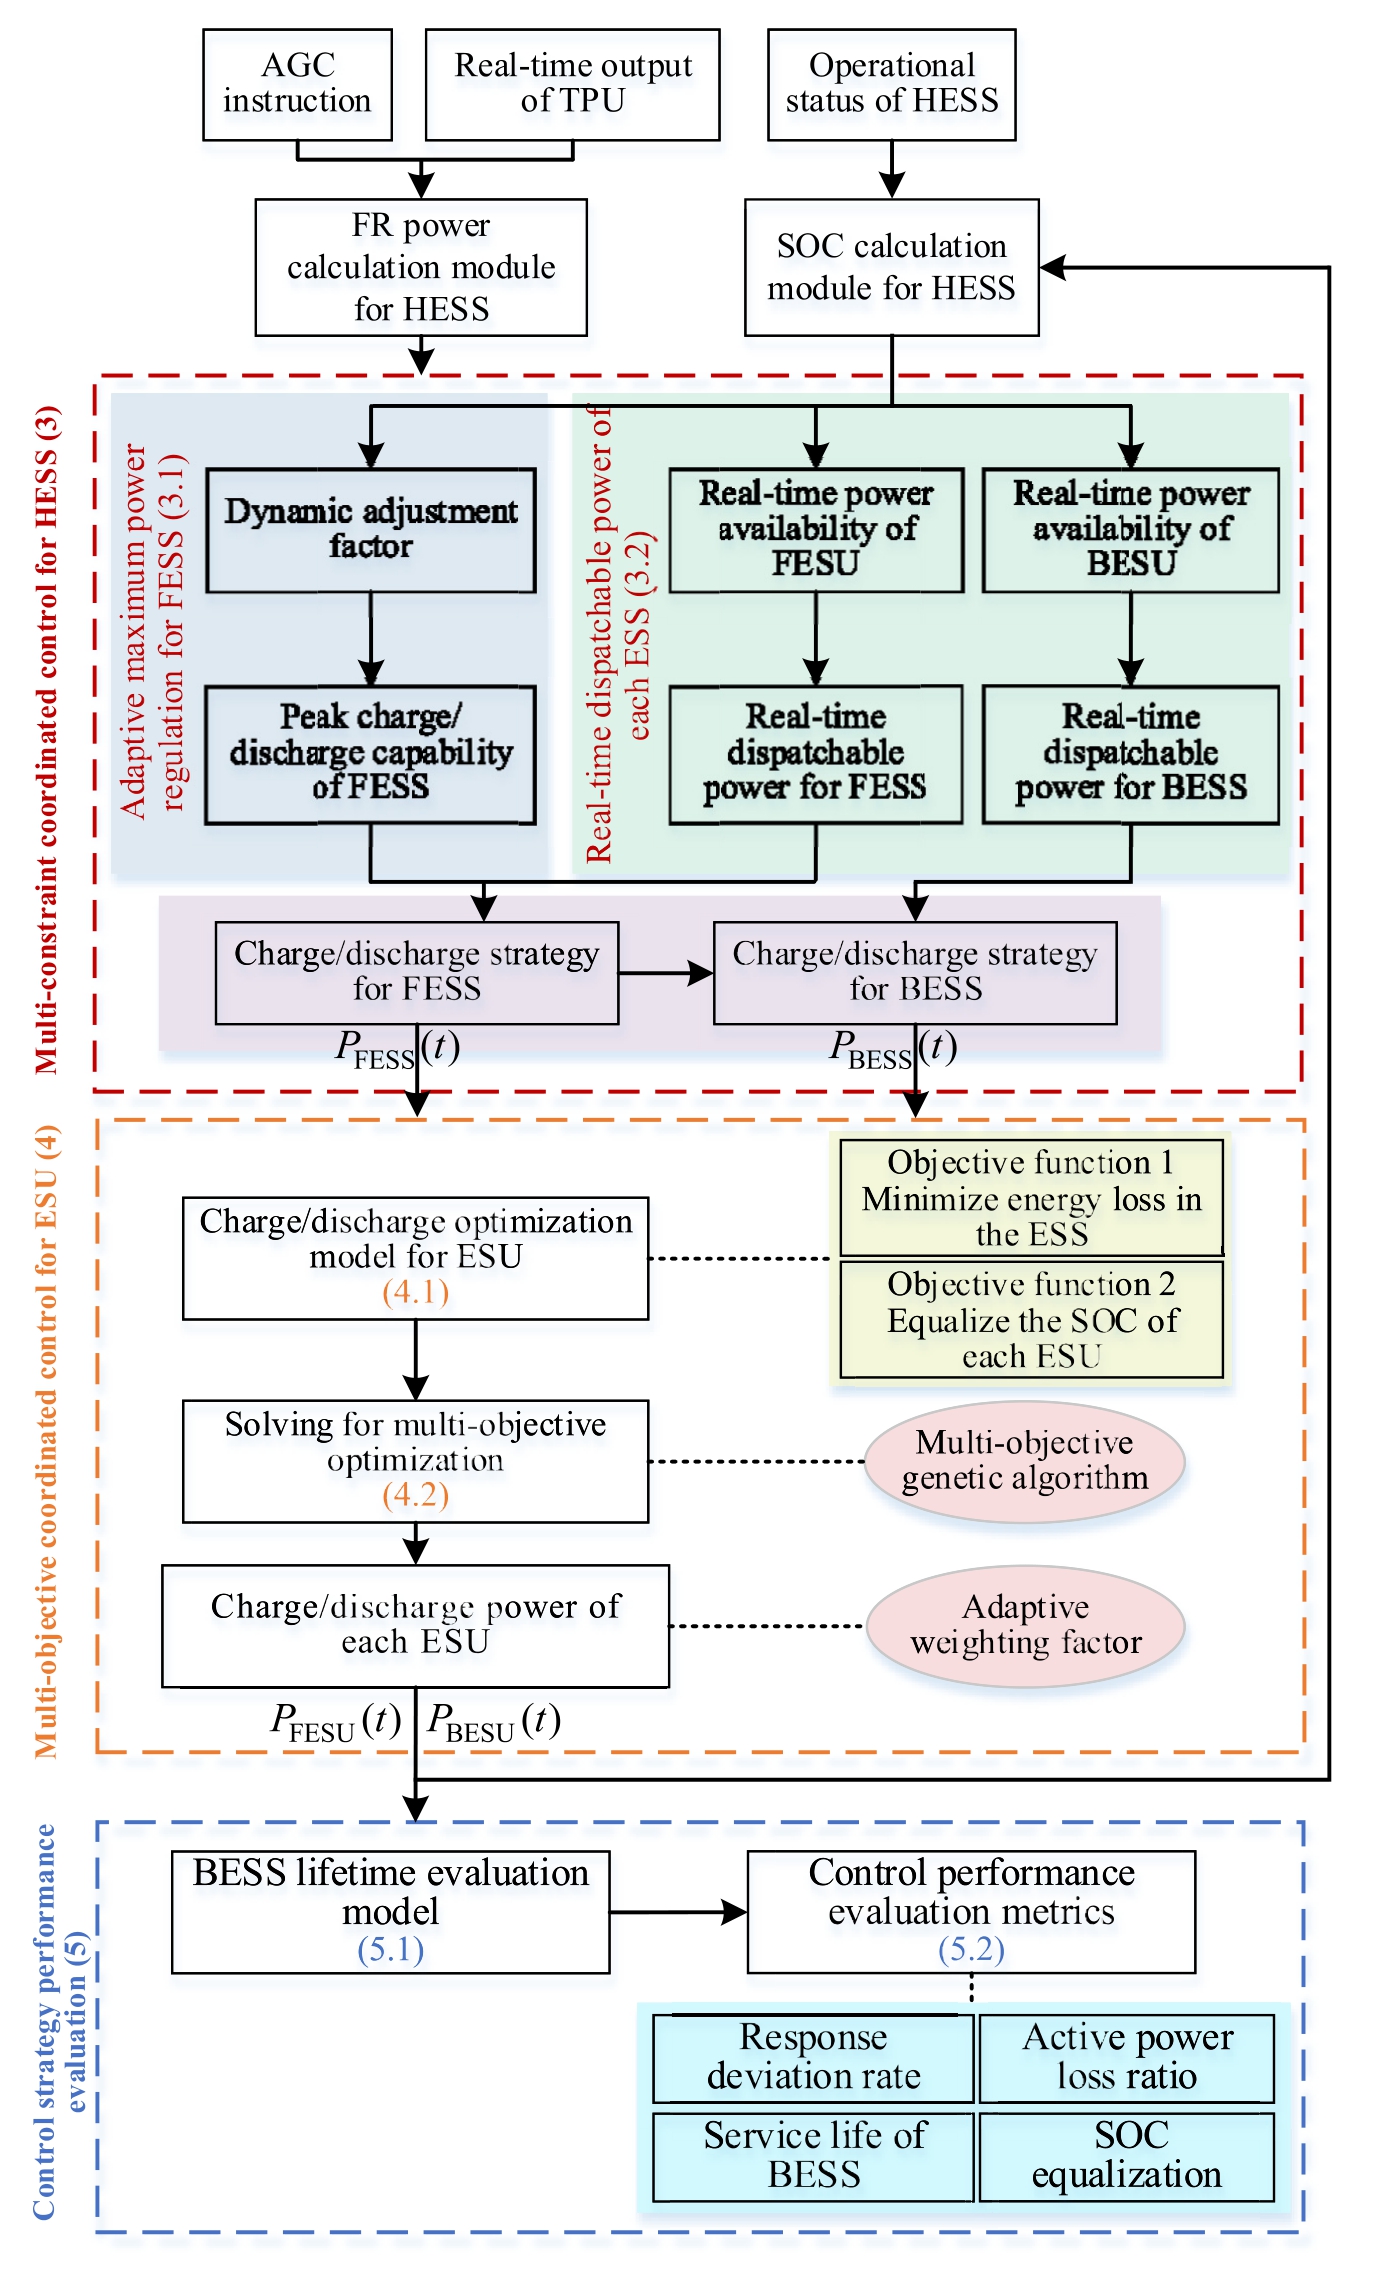
Fig. 2. Framework diagram of cooperative control strategy for HESS.
1) The coordinated control strategy of the HESS aims to balance the reduction of the lifetime losses in the BESS and enhance the continuous operation of the FESS. First, the maximum output dynamic adjustment factor is established based on the improved Sigmoid function to adaptively modify the peak charge/discharge capability of the FESS. Subsequently, we introduced the real-time dispatchable power constraint of each ESS. The real-time dispatchable power,along with the rated power,is then employed as the upper limit of the charge/discharge power of each ESS.Lastly,when the above constraints are satisfied, the FESS responds preferentially, whereas the BESS provides subsidiary support.
2) The coordinated control strategy of the ESU aims to reduce the energy loss of each ESS and improve the continuity of FR of each ESU. We established a multi-objective co-optimization model to minimize the system energy loss and achieve SOC balancing of multiple ESUs. Furthermore, we utilized a multi-objective genetic algorithm for model resolution. The magnitude of the FR power borne by each ESS and the degree of SOC consistency of each ESU are considered to construct the adaptive weight coefficients to determine the optimal solution from the Pareto front, In addition, this helps in determining the redistribution of the pre-allocated FR power of the ESS among the ESU.
2 Multi-constraint coordinated control for HESS
To prevent the saturation or depletion of the flywheel storage capacity, which affects the FR response capability,we introduced the FESS maximum output regulation coefficient to adaptively constrain the FESS maximum output.In addition, we introduced the real-time dispatchable power constraints of the ESS corres ponding to its realtime power.This helps in preventing each ESU from being unable to provide the pre-allocated FR power of each ESS due to insufficient capacity, causing unnecessary power shortages.
2.1 Adaptive maximum power regulation for FESS
When compared with the BESS, FESSs have exhibit energy density and small rated capacity. Therefore, the continuous charge/discharge of the FESS causes the SOC to frequently reach the upper and lower limits, which causes the FESS to lose its charge/discharge capabilities,thereby making it impossible for the FESS to participate in the FR or other scenarios. To address this problem,we established the maximum output dynamic adjustment factor based on the improved Sigmoid function based on the real-time feedback SOC of the FESS to adaptively adjust the peak charge/discharge capability of FESS.Essentially,when the SOC of FESS is greater than the high alert value of the SOC, we use the Sigmoid function to dynamically constrain the peak charge capability of the FESS. Otherwise, the peak charge capability represents the rated power. When the SOC of the FESS is less than the low alert value of the SOC, we correct the peak discharge capability of the FESS using the inverse Sigmoid function. Otherwise, the peak discharge capability represents the rated power.
The dynamic adjustment factor for the maximum output of the FESS is calculated as follows:
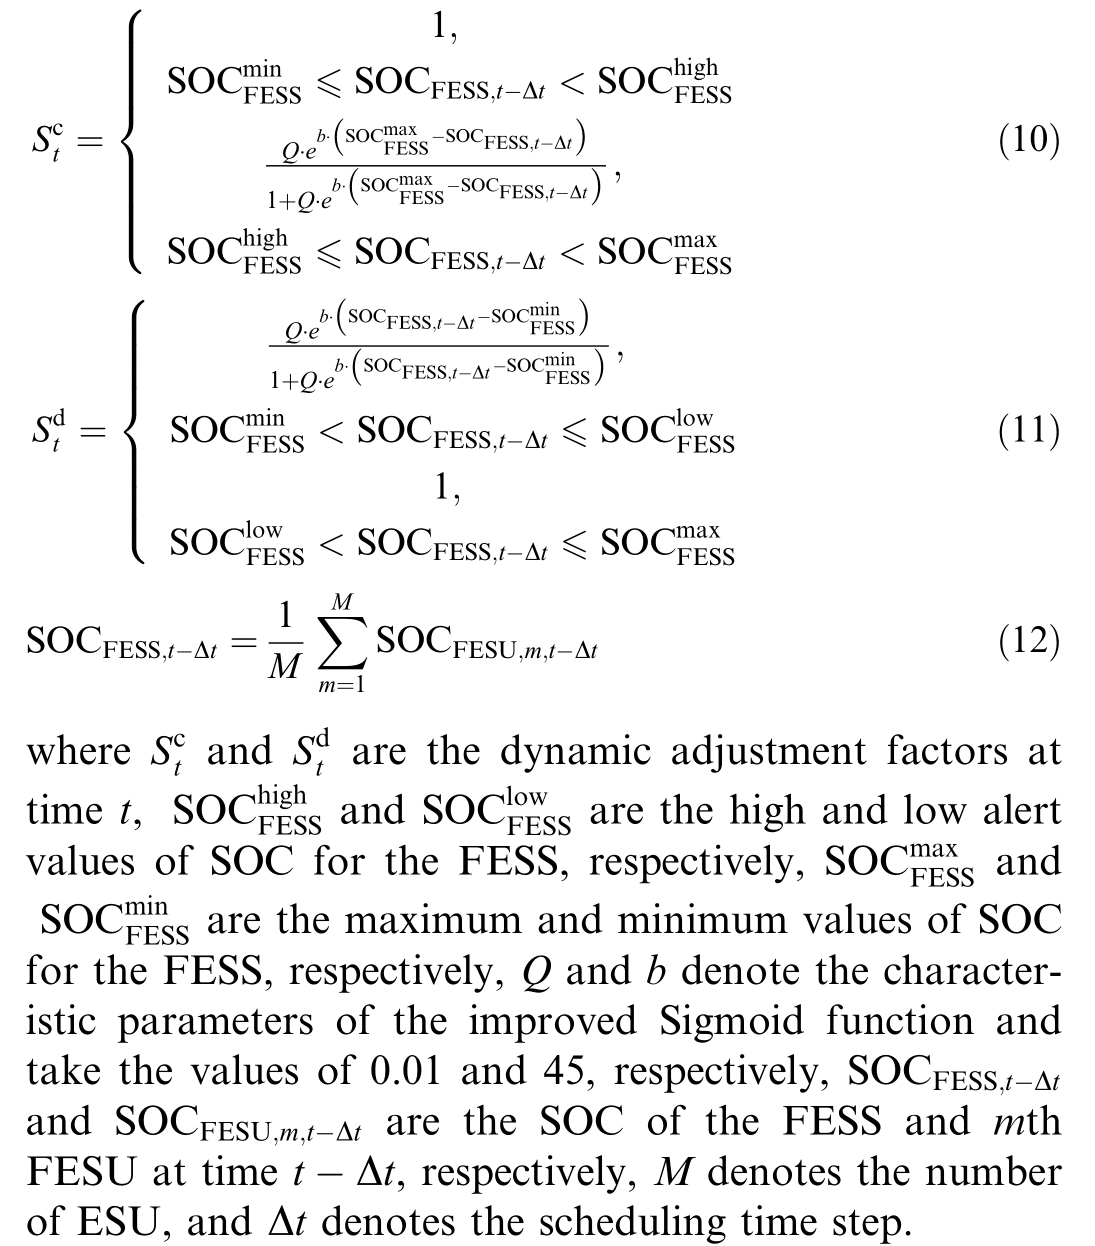
Fig. 3 depicts the relationship between the dynamic adjustment factor of maximum output and SOC of the FESS established based on the improved Sigmoid function.
The peak charge/discharge capability of the FESS corrected by the dynamic adjustment fact or for maximum output is expressed as follows:

where 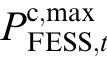 and
and 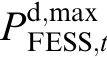 denote the peak charge/discharge capability of the FESS at time t, respectively, and
  denotes the rated power of the FESS.
2.2 HESS operation strategies with real-time dispatchable power
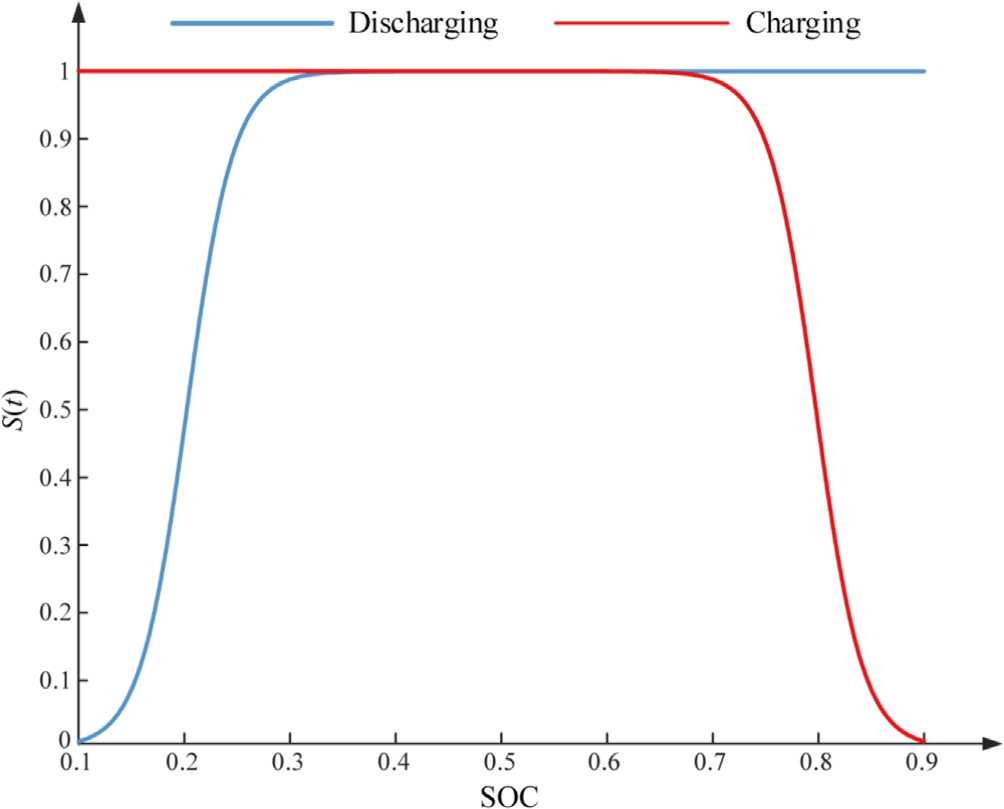
Fig. 3. Dynamic adjustment factor for FESS’s maximum output.
When the power in one of the ESU of the ESS is insufficient, the maximum dispatchable power of the ESS is less than its rated power. If the charge/discharge strategy of the HESS is only based on the rated power of the ESS as a constraint, the ESU cannot realize the full FR response due to the limited power support capacity under the working condition of insufficient available power, which further contributes to the FR effect. Therefore, we incorporate the real-ti me dispatchable power constraint of the ESS through the real-time power of the ESU. The following section uses FESS as an example to demonstrate the calculation of the real-time dispatchable power for various ESSs.
The real-time dispatchable power of the ESS is calculated as follows:
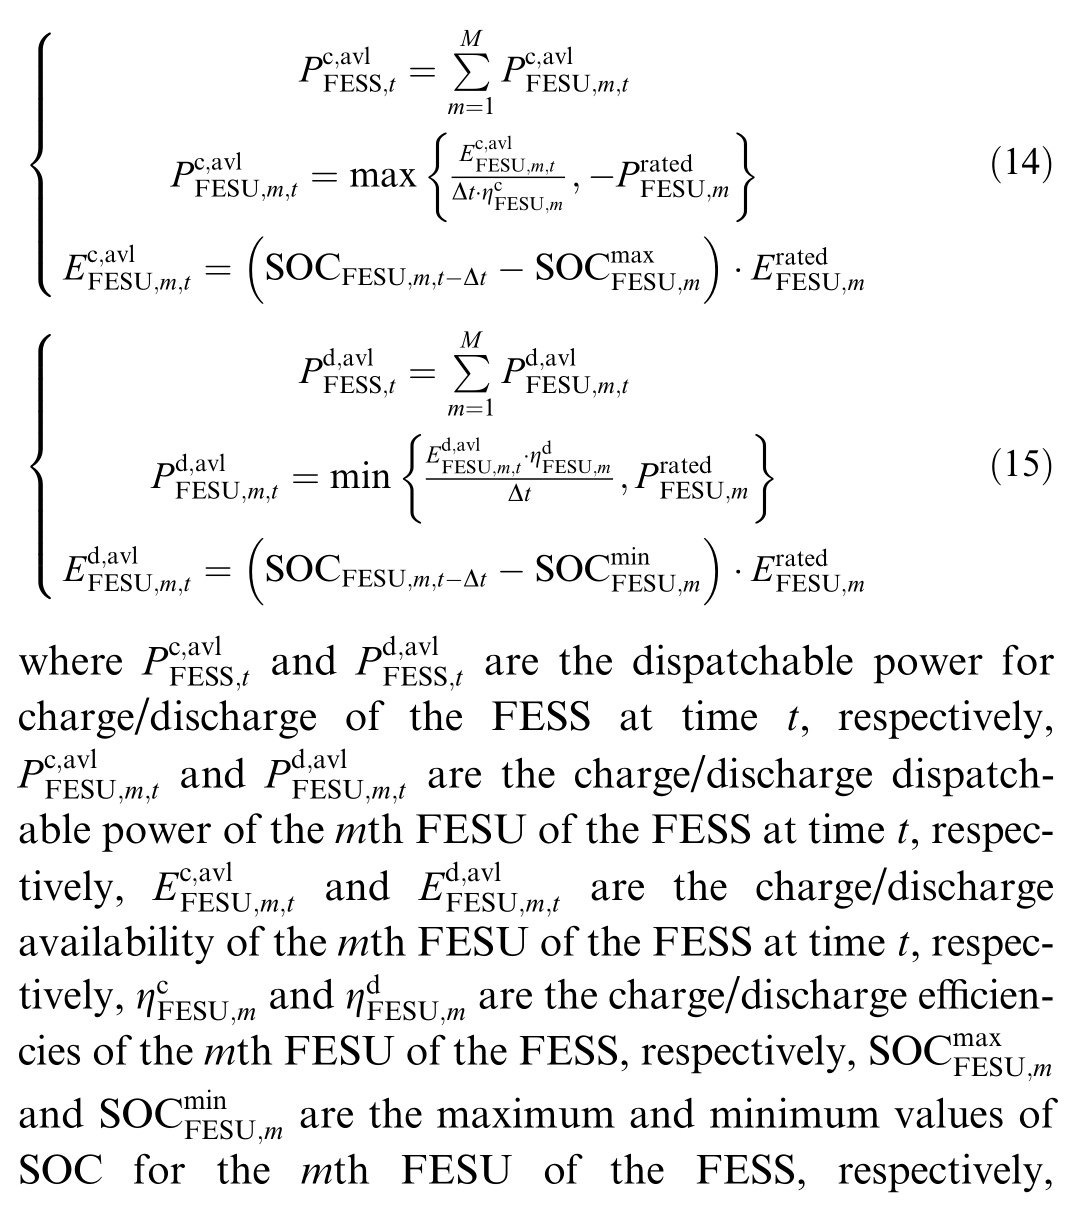
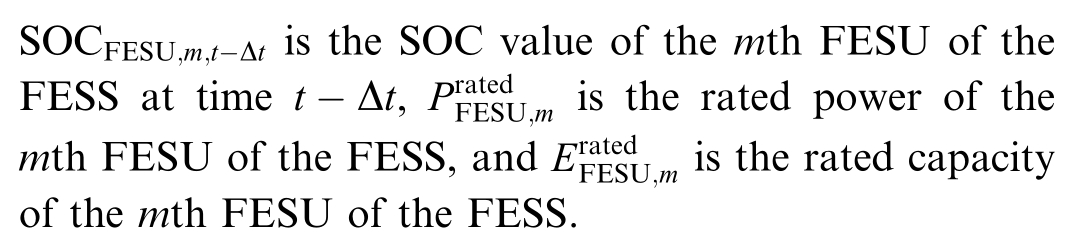
FESSs achieve millisecond-level response times, presenting exceptional power density and rapid throughput capabilities. Conver sely, BESS typically exhibit response times measured in seconds. Fig. 4 depicts the dynamic response characteristics of the FESS and BESS in response to step command signals. The initial response speed of the BESS is slightly slower than that of the FESS. However, it exhibits higher energy density and presents sustained,stable power output, making it well-suited for energy scheduling tasks spanning extended timeframes. Additionally, FESSs featu re a long cycle life, with their lifespan remaining virtually unaffected under frequent charge-discharge conditions. This characteristic effectively addresses the significant life degradation issues associated with battery energy storage during repeated charging and discharging cycles.
In this study, we propose a control strategy that prioritizes flywheel response with the battery supplemental response. When power commands requiring frequency regulation arise, FESSs respond first to smooth out highfrequency, abrupt power fluctuations and rapidly reduce the power deficit of the syst em. Given the relatively low energy density and limited sustained power supply capability of FESS, BESS responds to the subsequent gradual power components. This is expressed as follows:
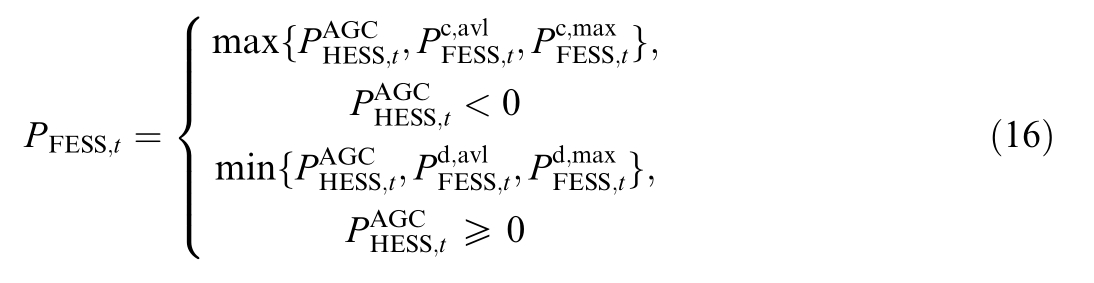
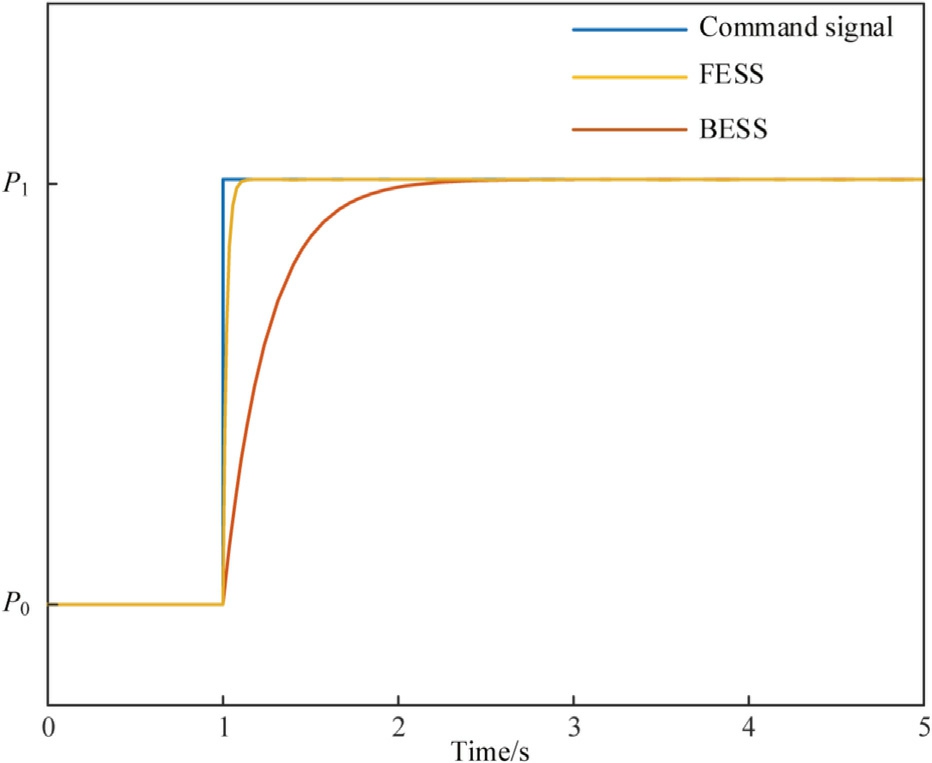
Fig. 4. Dynamic response characteristics of FESS and BESS.
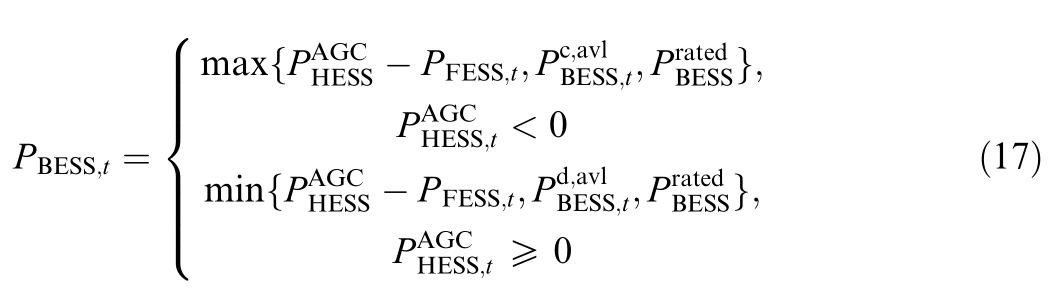
where PFE SS,t and PBESS,tare the charge/discharge power of the FESS and BESS at time t, respectively, a nd  denotes the rated power of the BESS.
3 Multi-objective coordinated contr ol for ESU
The coordinated control strategy of the ESU involves controlling the charge/discharge of different ESUs based on their SOC and charge/discharge efficiency within each ESS to respond to the charge/discharge power of the ESS. First, a multi-objective optimization model is established based on minimizing the energy loss in the ESS and balancing SOC. This model is solved using a multiobjective genetic algorithm. Subsequently, the magnitude of the FR power borne by each ESS and the degree of SOC consistency of each ESU are considered to construct the adaptive weight coefficients, which are used to determine the optimal solution from the Pareto front to determine the charge/discharge power of the ESU. The BESU is described below as an example because the optimization of the FESU and the BESU are identical.
3.1 Charge/discharge optimization model for ESU
3.1.1 Objective function
The charge/discharge efficiency of an ESU is less than 100% due to the internal resistance and chemical reactions during charging and discharging. Different types of ESU,along with inconsistent charge/discharge characteristics within the same type, cause inconsistent charge/discharge efficiencies, presenting different energy losses due to charge/discharge. The energy loss in an ESU is expressed as follows:
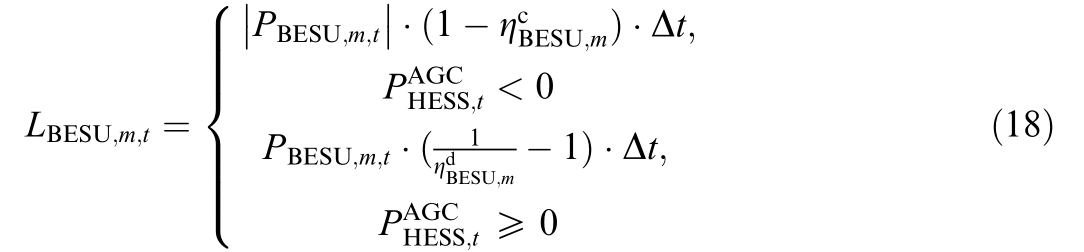
where LB ESU,m,tis the energy loss of the mth BESU at time t, PB ESU,m,tis the charge/discharge power of the mth BESU at time t, and 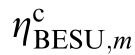 and
and 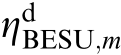 are the charge/discharge efficiencies of the mth BESU of the BESS, respectively.The objective of optimization involves minimizing the energy loss of the ESS. It is expressed as follows:

The bi-directional regulation capability of the ESU depends on the SOC of the ESU. If the energy loss of the ESU is the sole optimization objective, this may result in the frequent operation of the ESU with minimal energy loss. Concurrently, the ESU with substantial energy loss will be inactive, which presents an imbalance in the SOC of each ESS. This reduces the operational efficiency of the ESS. To maintain the SOC balance of each ESS, we introduced SOC balancing as an optimization objective.It is expressed as follows:

where SOCBESU,m,tis the SOC of the mth BESU at time t,and SOCBESU,ave,t—Δtis the average value of the SOC for all BESU at time t.The equations for each component of the objective function are
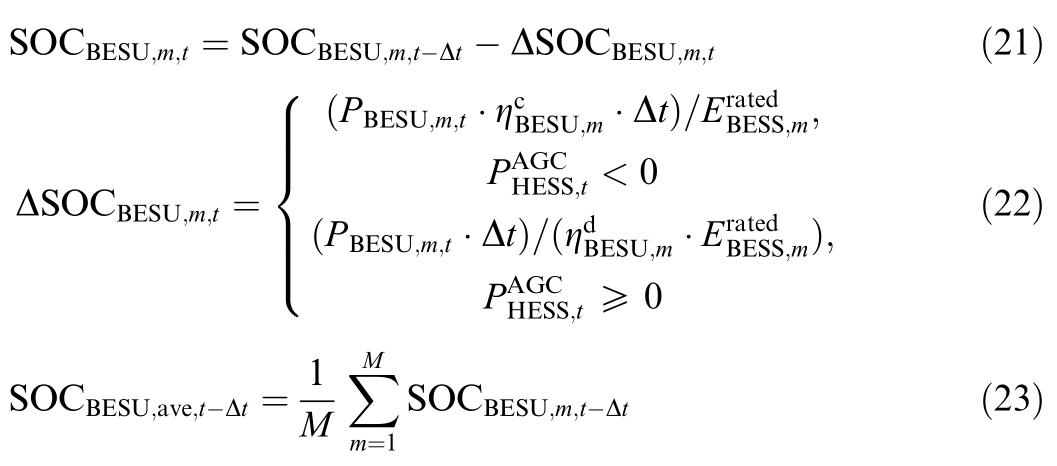
where ΔS OCBESU,m,tis the change in the SOC of the mth BESU at time t, and  is the rated capacity of the mth BESU.
3.1.2 Constraint conditions
1) Power balance constr aints

2) Charge/discharge power constraints for ESU
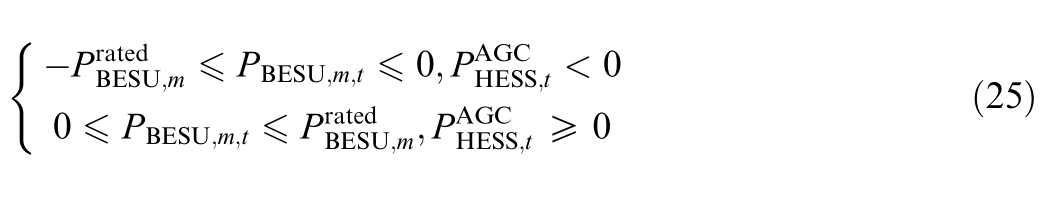
3) SOC constraints for ESU

3.2 Model s olving
The charge/discharge optimization model of the ESU belongs to the multi-objective optimization model. In this study, we adopted the multi-objective genetic algorithm to solve for the Pareto solution set. Subsequently, we employed an objective weighting method to achieve trade-offs between different objectives. It is expressed as follows:

where  is the normalized values of the Pareto solution sets for objective function i at time t, Fi,t is the Pareto solution set of objective function i at time t, F
 is the maximum value in the Pareto solution set of objective function i at time t, F
 is the minimum value in the Pareto solut ion set of objective function i at time t,and w 1,t and w2 ,tare the weight coefficients of objective functions 1 and 2 at time t,respectively. Their determination method is as follows.
To ensure that key performance characteristics remain unaffected during multi-objective optimization, we established adaptive weighting coefficients by comprehensively considering both the magnitude of the frequency response power handled by the ESS and the degree of SOC consistency of each ESU.
The quantity of energy dissipated by an ESS engaged in FR is based on the extent of FR power that it possesses.The magnitude of the FR power borne by the ESS directly corresponds to the extent of energy loss,necessitating careful control.The adaptive weights,w1,corresponding to the energy loss objective function are calculated as follows.
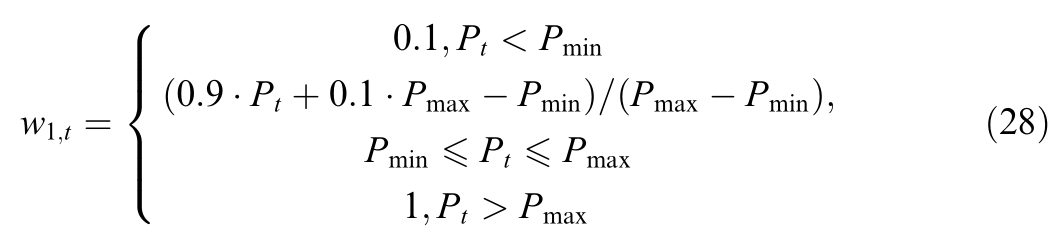
where P t is the FR power borne by the ESS at time t, and Pma x and Pmi nare the maximum and minimum setting values of FR power that indicate the importance attached to energy loss, respectively.
The value of adaptive weight w2 relies on the degree of consistency of the SOC of the ESU at the preceding scheduling moment. In the cases where the SOC consistency of each ESU at the preceding scheduling moment is observed to be deficient, greater emphasis must be placed on the process of SOC equalization. The adaptive weights,w2,corresponding to the SOC equalization objective function are calculated as follows:
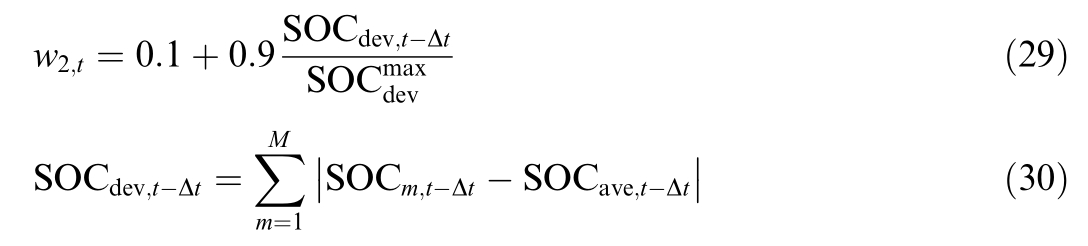
where SOCdev,t—Δtis the sum of the SOC of each ESU and the average value of the SOC of the ESU. The smaller its value, the closer the SOC of each ESU converges.SOCm,t—Δtis the SOC of the mth ESU at the previous schedu ling moment. SOCave,t—Δtis the average value of the SOC of the ESU at the preceding scheduling moment.SO is the theoretical maximum of the sum of the SOC of each ESU and the average value of the SOC of the ESU.
4 Control strategy performa nce evaluation
4.1 BESS lifetime evaluation model
The BESS cycle life is influenced by factors such as the depth of discharge, charge/discharge rates, and temperature. However, the battery life model established in this study is used to evaluate the effectiveness of the proposed strategy in extending the battery service life. This approach primarily addresses the energy storage chargi ng and discharging process, without focusing on the charging and discharging rates or the temperatures during these operations. Therefore, we exclusively focused on the effect of discharge depth on the BESS cycle life.
Based on the engineering test data presented in Table 1,the polynomial fitting method was employed to establish the correlation between cycle life and discharge depth of BESS. This relationshi p is expressed in the following equation, and the corresponding curve is presented in Fig. 5.

where Nm,DODdenotes the BESS cycle life at a depth of discharge of DOD.
The equivalent cycle life of the BESS is

where Nxis the equivalent cycle life at a discharge depth of x, Nm, 1 is the cycle life at a discharge depth of 1,and Nm,xis the cycle life at a discharge depth of x.
The total equivalent cycle life over the dispatch cycle is

where X denotes the set of discharge depths.
4.2 Control performance evaluation metrics
To effectively demonstrate the effectiveness of the approach, we designed four evaluation metrics: response deviation rate, service life of BESS,active power loss ratio,and degree of SOC equalization.
Table 1 Depth of discharge versus cycle life.
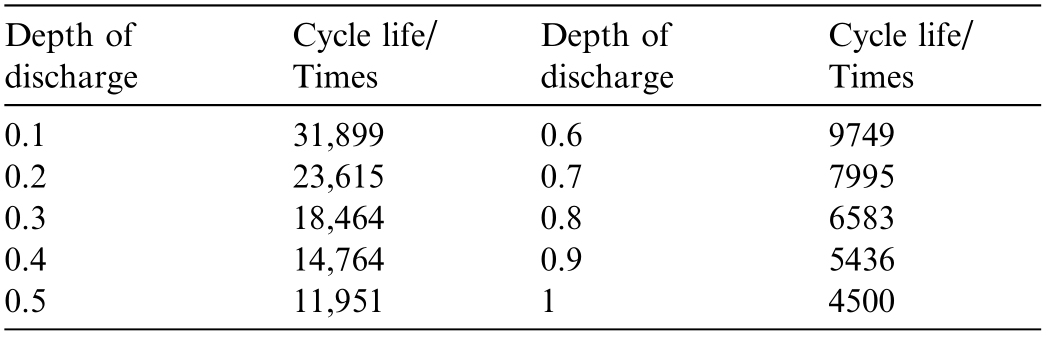
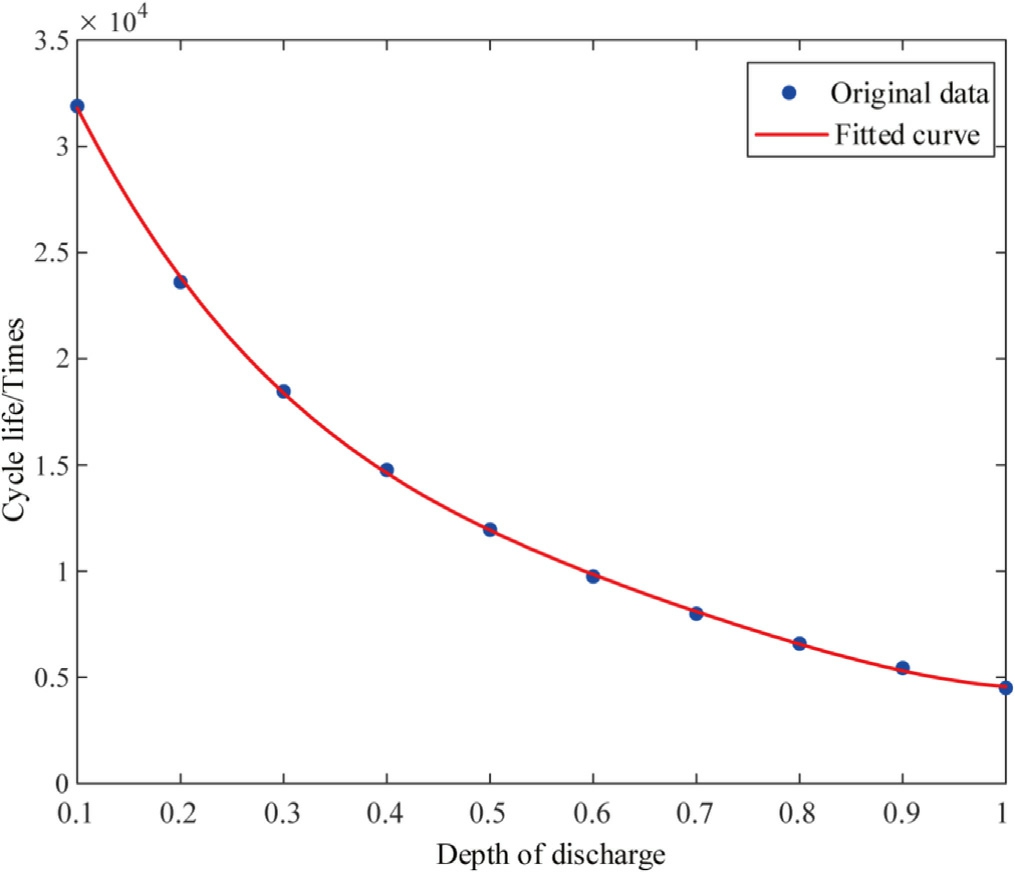
Fig. 5. Depth of discharge versus cycle life.
4.2.1 Response deviation rate
The response deviation rate indicates the extent of discrepancy between the FR output and AGC instruction of the HESS. The smaller the response deviation rate is,the smaller the deviation between the FR output and AGC instruction of the HESS, and the better the FR of the HESS is.

where PHESS,tdenotes the FR output of the HESS at time t,and T is the total scheduling time.
4.2.2 Service life of BESS
We evaluate the lifespan loss of ESSs based on their service life. The longer the service life of a BESS under a given approach,the lower the lifetime loss caused by using the BESS.

4.2.3 Active power loss ratio
This index is utilized to characterize the proportion of charge/discharge power accounted for by active power loss, which is caused by the charge/discharge effici ency in the ESU not reaching 100%. Essentially, it represents the power loss per unit of charge/discharge power.

where LF ESU,m,tis the energy loss of the mth FESU at time t, and PF ESU,m,tis the charge/discharge power of the mth FESU at time t.
4.2.4 Degree of SOC equalization
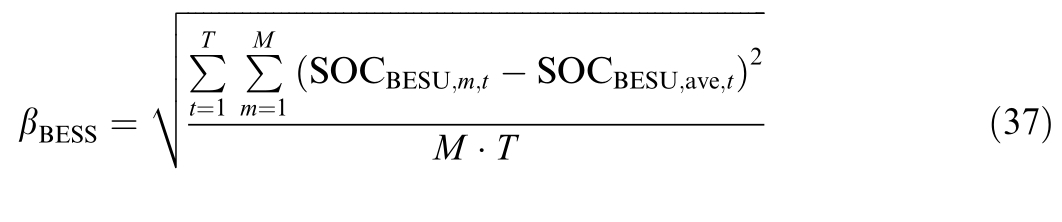
The SOC equalization degree of the ESS is used to characterize the proximity of a SOC value of each ESU in the ESS. The lower the SOC equalization degree of the ESS,the closer the SOC values of the ESU in the ESS.The calculation is given as follows (using the BESS as an example):
5 Case study
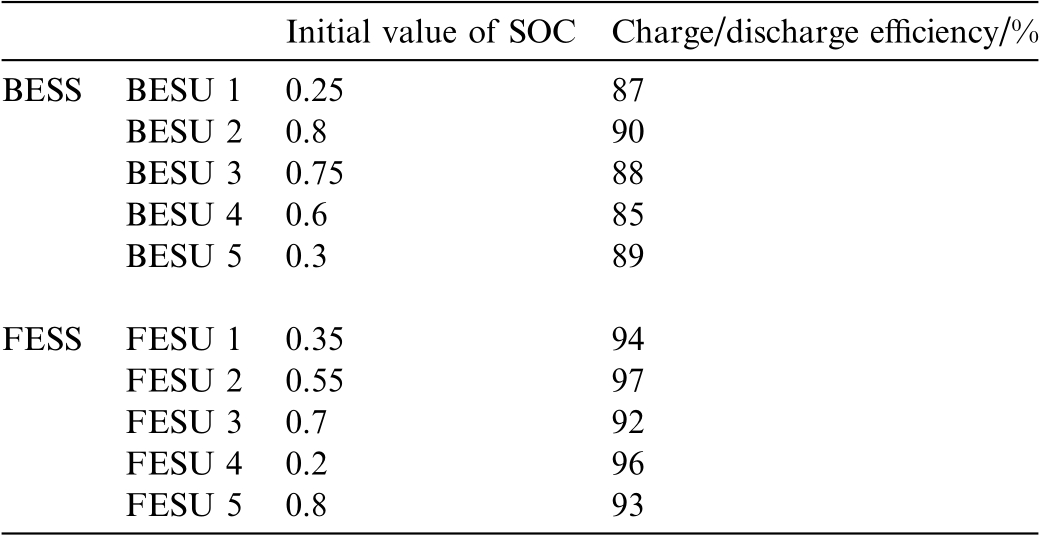
To demonstrate the effectiveness of the proposed strategy, the TPU-HESS configuration (Fig. 1) was simulated in MATLAB. The FESS comprises five units with an aggregate capacity of 5 MW/1.25 MWh, whereas the BESS integrates five units totaling 10 MW/10 MWh.Table 2 presents the technical specifications of the FESS and BESS. Table 3 presents the initial SOC values and charge/di scharge efficiency of each ESU.
To demonstrate the superiority of the proposed strategy, we compared the FR effect under two different strategies. The comparison strategies are presented below.
Strategy Ⅰ: The ESS configuration is identical to that described in this study. The HESS charge/discharge control involves decomposing the AGC signal into high and low-frequency components.Appendix A presents adetailed description of the specific decomposition method. The high-frequency component is then managed by the FESS, whereas the low-frequency component is managed by the BESS. Power distribution among the ESUs optimizes the consistency of the energy storage system’s SOC.
Table 2 Technical specification s of BESS/FESS.
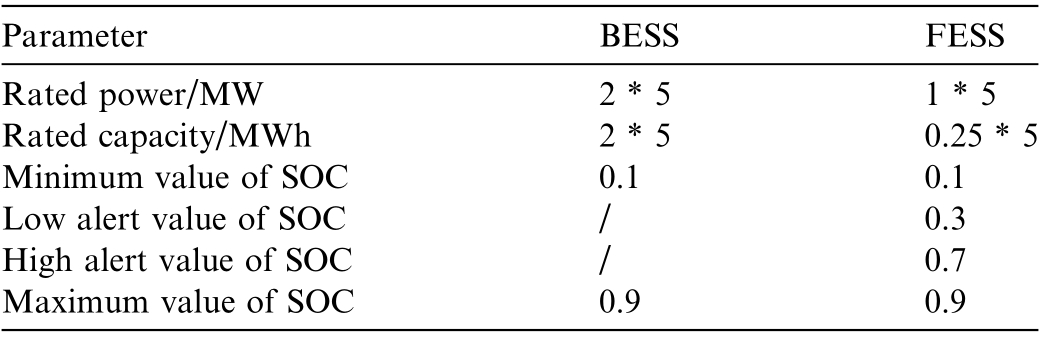
Table 3 Initial value of SOC and charge/discharge efficiency of each ESU.
Strategy Ⅱ: The ESS configuration is identical to that described in this study. The HESS charge/discharge control remains consistent with that presented in this study, but does not consider the adaptive adjustment of the maximum FESS output or the real-time dispatchable power of the ESS. The FR power allocation between the ESU is dynamically proportional to the SOC of the ESU.
5.1 Analysis of FR effect and BESS lifetime
Fig. 6 shows the response of the ESS to AGC commands under the three strategies. Strategy Ⅱ exhibits the worst performance in terms of following the AGC command, strategy I and the strategy proposed in this study exhibit comparable performance. To further quantify the assessment, we analyzed the response of the ESS to AGC commands alongside the response deficit power and response deviation rate of the ESS over the entire dispatch cycle. Table 4 presents the response deficit power and response deviation rate of the ESS under the three strategies.
Table 4 Response deficit power and response deviation rate of ESS under different strategies.
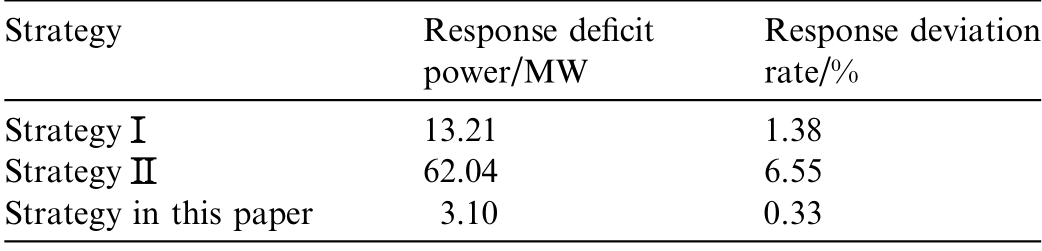
The proposed strategy presented in this study exhibits the smallest response deficit power and response deviation rate among the three strategies, at 3.10 MW and 0.33%respectively, as shown in Table 4. The response deficit power and response deviation rate of strategy Ⅰ are 12.21 MW and 1.38%, respectively. Conversely, the response deficit power and response deviation rate of strategy Ⅱ are much larger, at 62.04 MW and 6.55%, respectively. This demonstrates the superiority of the ESS in the proposed strategy in terms of its ability to follow AGC commands. We analyze the reasons for the results presented above based on the variation of SOC of each ESS. Fig. 7 depicts the SOC variation curves of each ESS under different strategies.
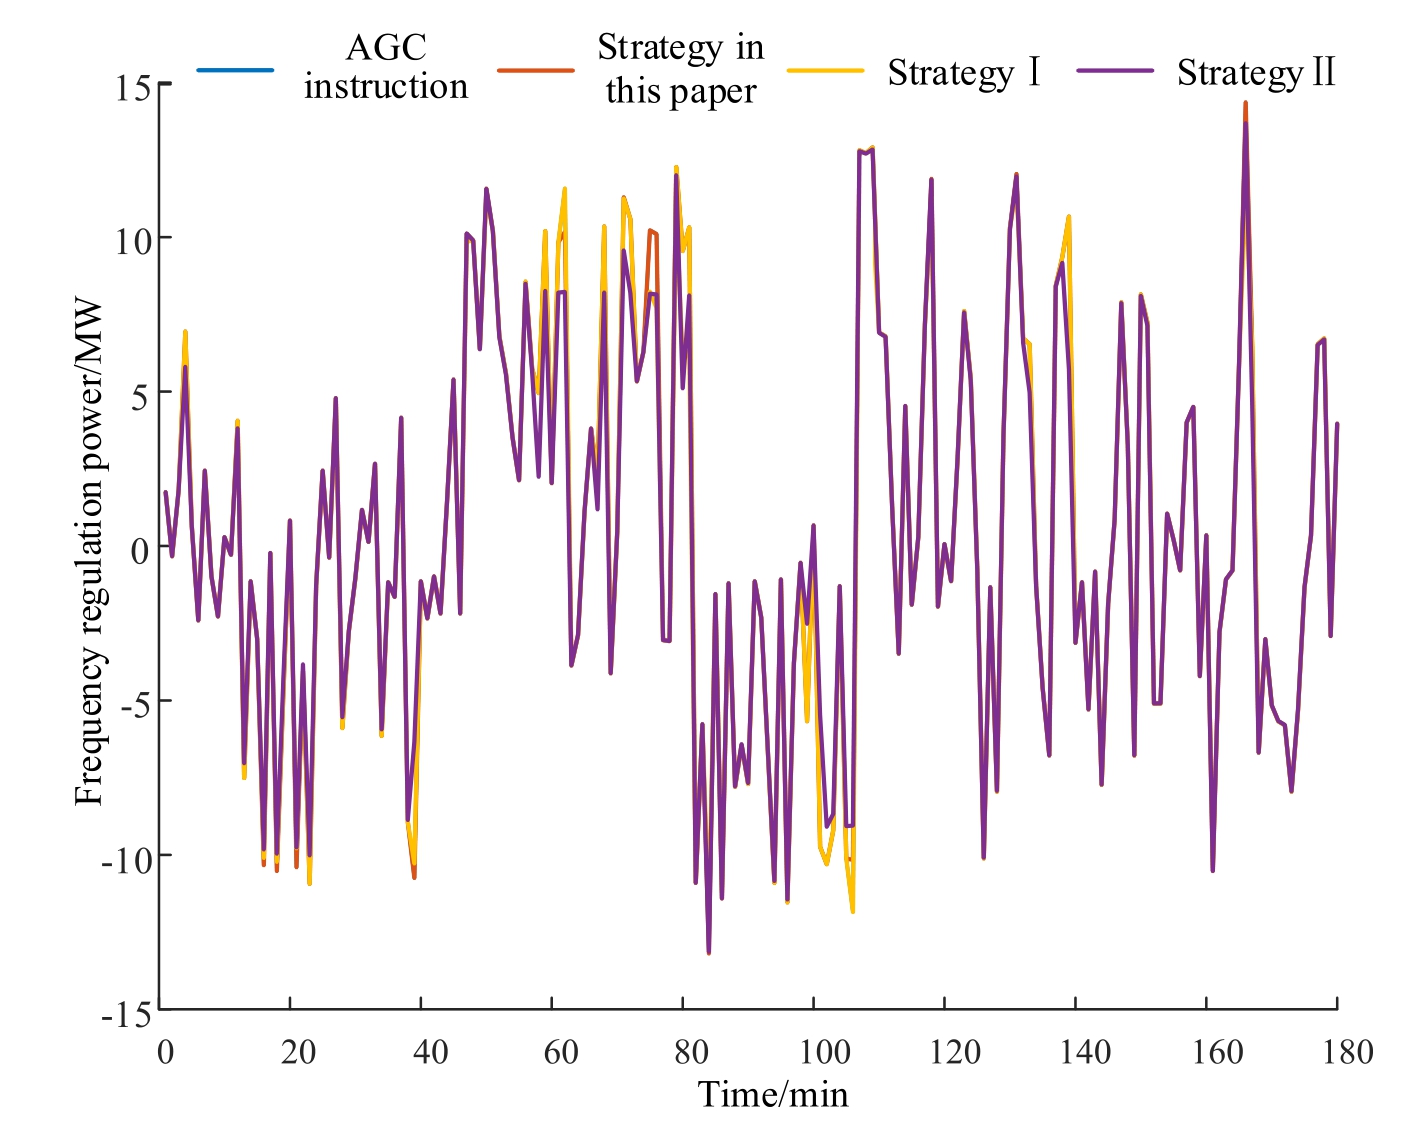
Fig. 6. Response of ESS to AGC commands under different strategies.
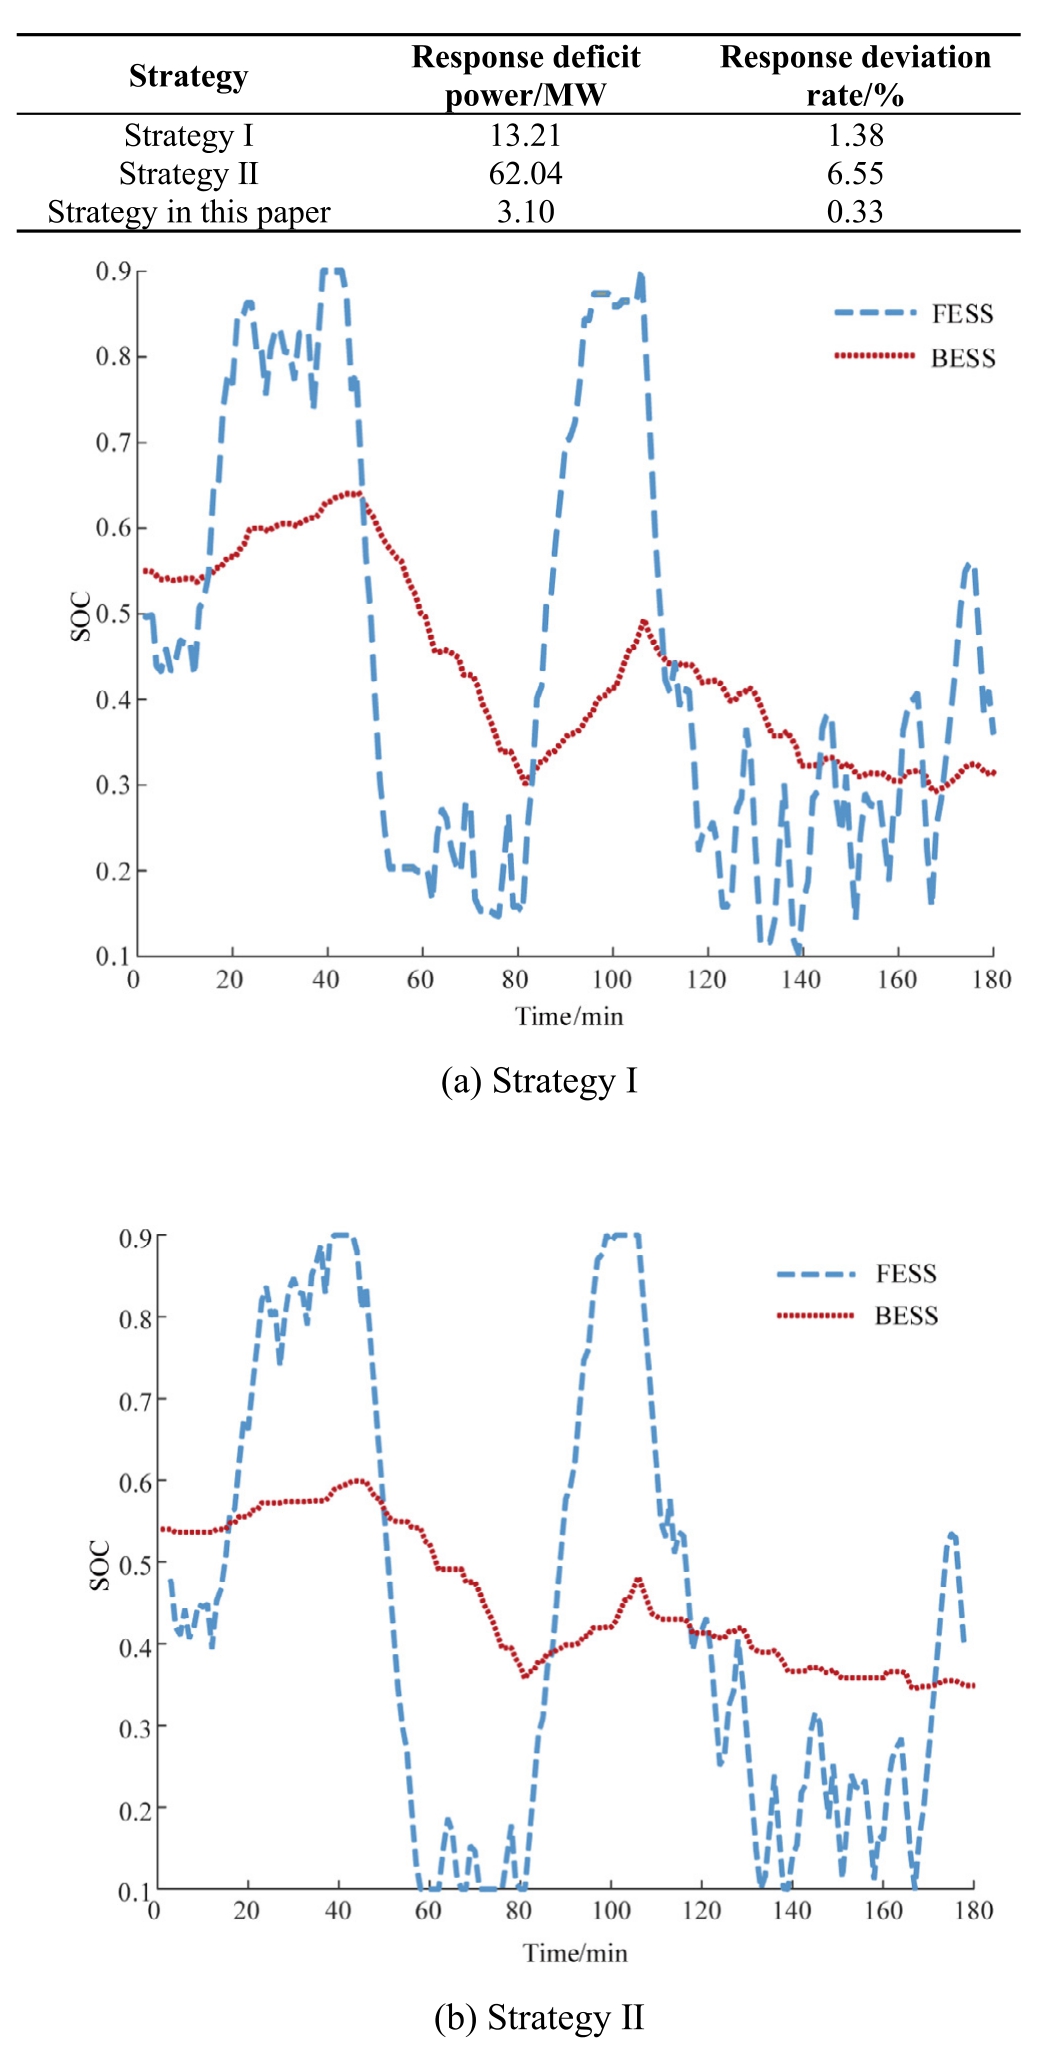
Fig. 7. SOC variation curves of ESS under different strategies.
The worst effect of the ESS following the AGC command in the strategy Ⅱ can be primarily attributed to two factors. First, it does not consider the adaptive adjustment of the maximum output of the FESS, indicating that the FESS SOC frequently reaches its upper and lower limits (see Fig. 6(b)). When the SOC frequently touches the limit value, the FESS is forced to withdraw from the charge/discharge process, and only the BESS responds to the AGC command, which reduces the effectiveness of the command tracking. Second, the actual available power of the ESS is not consistent with the AGC demand and cannot respond to the AGC demand owing to the lack of real-time dispatchable power constraints for the ESS in Strategy Ⅱ.The proposed strategy overcomes the limitations of Strategy Ⅱ,thereby avoiding the SOC of the FESS from frequently reaching the upper and lower limits (see Fig. 6(c)). This significantly reduces the response deviation rate and improves the sustainable operation capability of the FESS,which demonstrates the effectiveness of the proposed strategy.
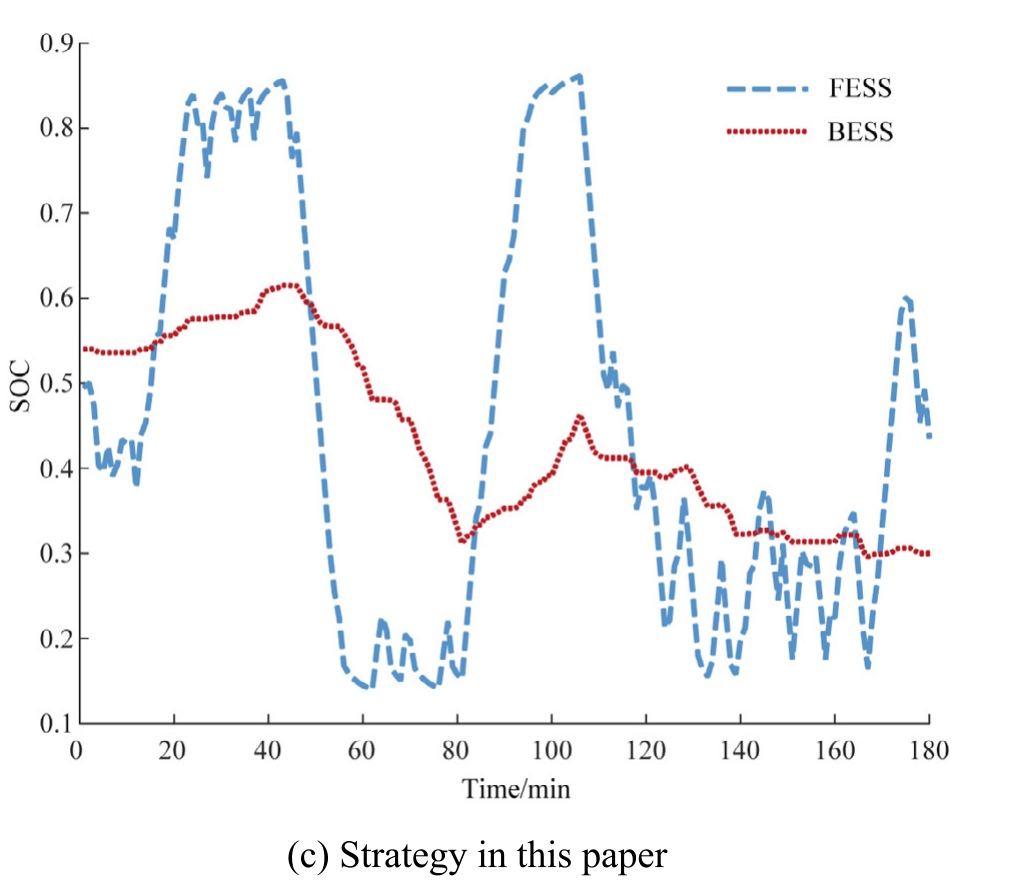
Fig 7. (continued)
Fig. 8 shows the comparative SOC curves of the BESS under different strategies.Table 5 presents the FR mileage of each BESS and its service life under different strategies.
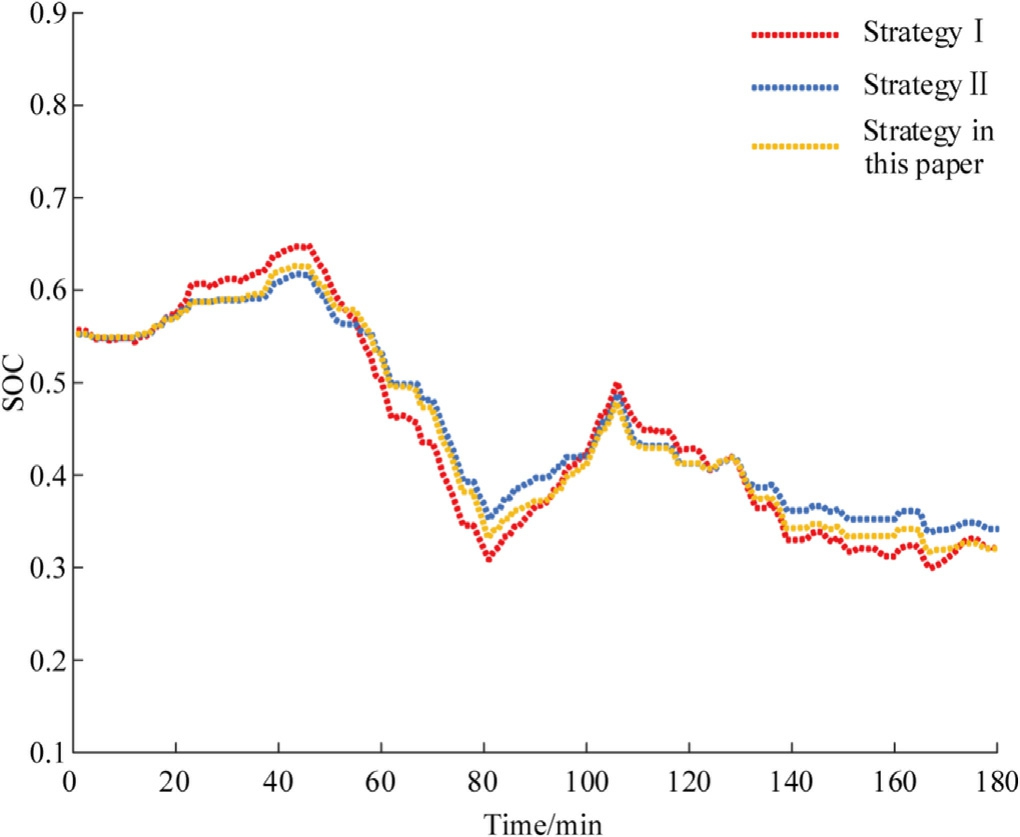
Fig. 8. Comparison of SOC curves of BESS with different strategies.
Table 5 FR mileage of each ESS and service life of BESS under different strategies.
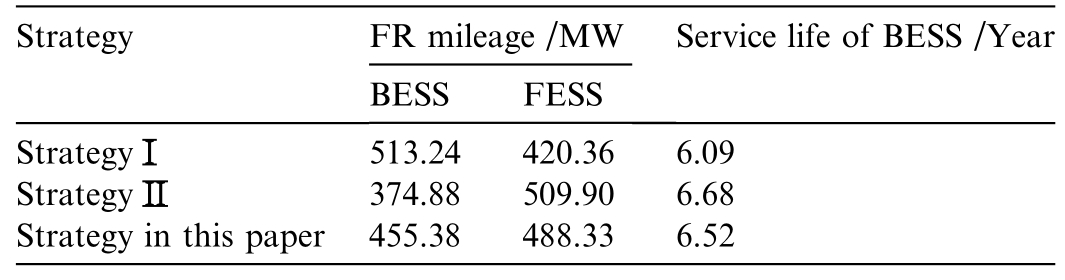
The BESS charge/discharge depth of strategy Ⅰ is slightly greater than that of Strategy Ⅱand the proposed strategy, as shown in Fig. 8. Furthermore, the charge/discharge depths of Strategy Ⅱ and the proposed strategy in this paper are found to be large ly equivalent. The battery service life of Strategy Ⅰis 6.09 years,as shown in Table 5.This is significantly lower than that of the proposed strategy and Strategy Ⅱ. Decomposing the AGC commands into high and low-frequency components and assigning them to the FESS and BESS, respectively, can significantly reduce the degradation of the BESS lifespan. However, it cannot effectively prolong the energy storage lifespan when compared with the proposed strategy and Strategy Ⅱ. This is because the FESS must continue to output power after responding to high-frequency components to assist the BESS in handling certain low-frequency components.The proposed strategy also uses sigmoid functions to constrain the maximum output of the FESS, thereby ensuring that its SOC remains in optimal condition. This enables the FESS to consistently share frequency regulation responsibilities with the BESS, thereby reducing its lifespan degradation. The BESS service life presented by the proposed strategy is slightly lesser than that of StrategyⅡ.The FR mileage of the BESS of Strategy Ⅱand the proposed strategy is 374.88 MW and 455.38 MW, respectively. Therefore, it is 21.47% higher than that of Strategy Ⅱ. The response deficit power and response deviation rate of Strategy Ⅱare considerably higher than those observed for the proposed strategy.Consequently,the service life of the enhanced BESS in Strategy Ⅱexhibits a tradeoffwith the FR effect.In summary,it can be observed that the comprehensive performance of this paper’s strategy is better than that of Strategies Ⅰand Ⅱ.
5.2 Analysis of energy loss and SOC equalization for each ESS
Table 6 presents the FR output and loss of the ESS under different strategies. The data demonstrate that the energy losses of Strategies Ⅰ and Ⅱ and the proposed strategy are 1.72 MWh, 1.32 MWh, and 1.36 MWh, respectively. The active power loss ratio is minimized for the proposed strategy at 8.65%, which is 29.62% and 3.35%lower than that of Strategies Ⅰand Ⅱ, respectively. The specific reasons for the results presented above are ana-lyzed below, along with the FR output of each ESU.The FR output of each ESU of the ESS under different strategies is shown in Fig. 9. Strategy Ⅰ does not consider the varying efficiencies of the ESU, and the allocation of the FR power of the ESU focuses on maintaining consistency in the SOC across all the storage units. Regardless of efficiency, the energy storage units with significant SOC deviation must contribute power, resul ting in maximum energy loss. The allocation of the FR power of the ESU in Strategy Ⅱis dynamically proportional to the SOC of the ESU. The FR output of each ESU depends on its own SOC state (see Fig. 9(b)). When the SOC state of the ESU with low charge/discharge efficiency is optimal,the more FR power it contains, the more energy loss it causes. The proposed strategy is optimized to achieve SOC equalization and minimum energy loss, which causes the ESU with high charge/discharge efficiency to bear more FR power and cause less energy loss. Therefore,the active power loss ratio is minimized in the proposed strategy. This demonstrates the superiority of the proposed strategy in reducing the energy losses.
Table 6 FR output and loss of ESS under different strategies.
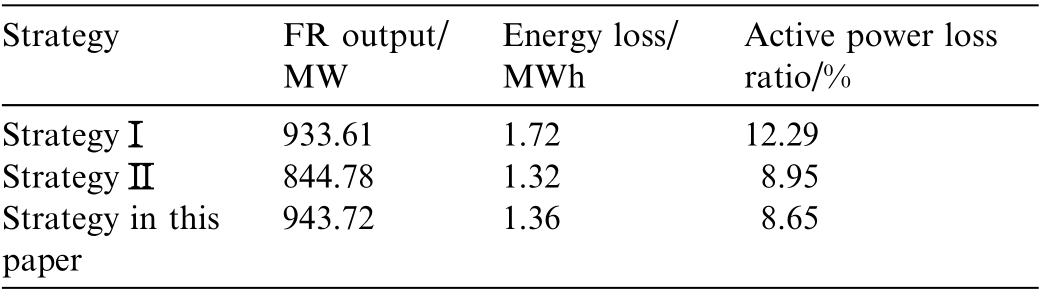
Table 7 presents the degree of SOC equalization of the ESS under different strategic conditions. Fig. 10 depicts the SOC variation curves of each ESU under different strategies. The degree of SOC equalization of the BESS under the pro posed strategy is 0.126, which is 8.03% less than that of Strategy Ⅱ,as shown in Table 7. The proposed strategy exhibits the lowest degree of SOC equalization of the FESS, which is 2.6% smaller than that of Strategy Ⅰand 15.56% smaller than that of Strategy Ⅱ. When combined with Fig. 10, it can be observed that the SOC of each BESU under the proposed strategy overlaps at 140 min,and the SOC of each FESU overlaps at 20 min. The overlap of the SOC of each ESU is significantly better than that of Strategy Ⅱ. The SOC overlap in the BESU of the proposed strategy is slightly worse than that of Strategy Ⅰ.However, it significantly outperforms Strategy Ⅰin reducing the energy losses within the energy storage system.This demonstrates the superiority of the proposed strategy.
5.3 The impact of communication delay on control strategy
In an ideal control system, we typically assume that the sensor measurements, controller computations, and actuator actions are completed instantaneously. However, communication latency is an unavoidable and critical factor in network-based control systems. To validate the effectiveness of the proposed strategy under communication delay conditions, we re-examined the communication delays under the aforementioned test case parameters and calculated the frequency deviation for different communication delay scenarios. Table 8 presents the frequency deviation under different communication delays.
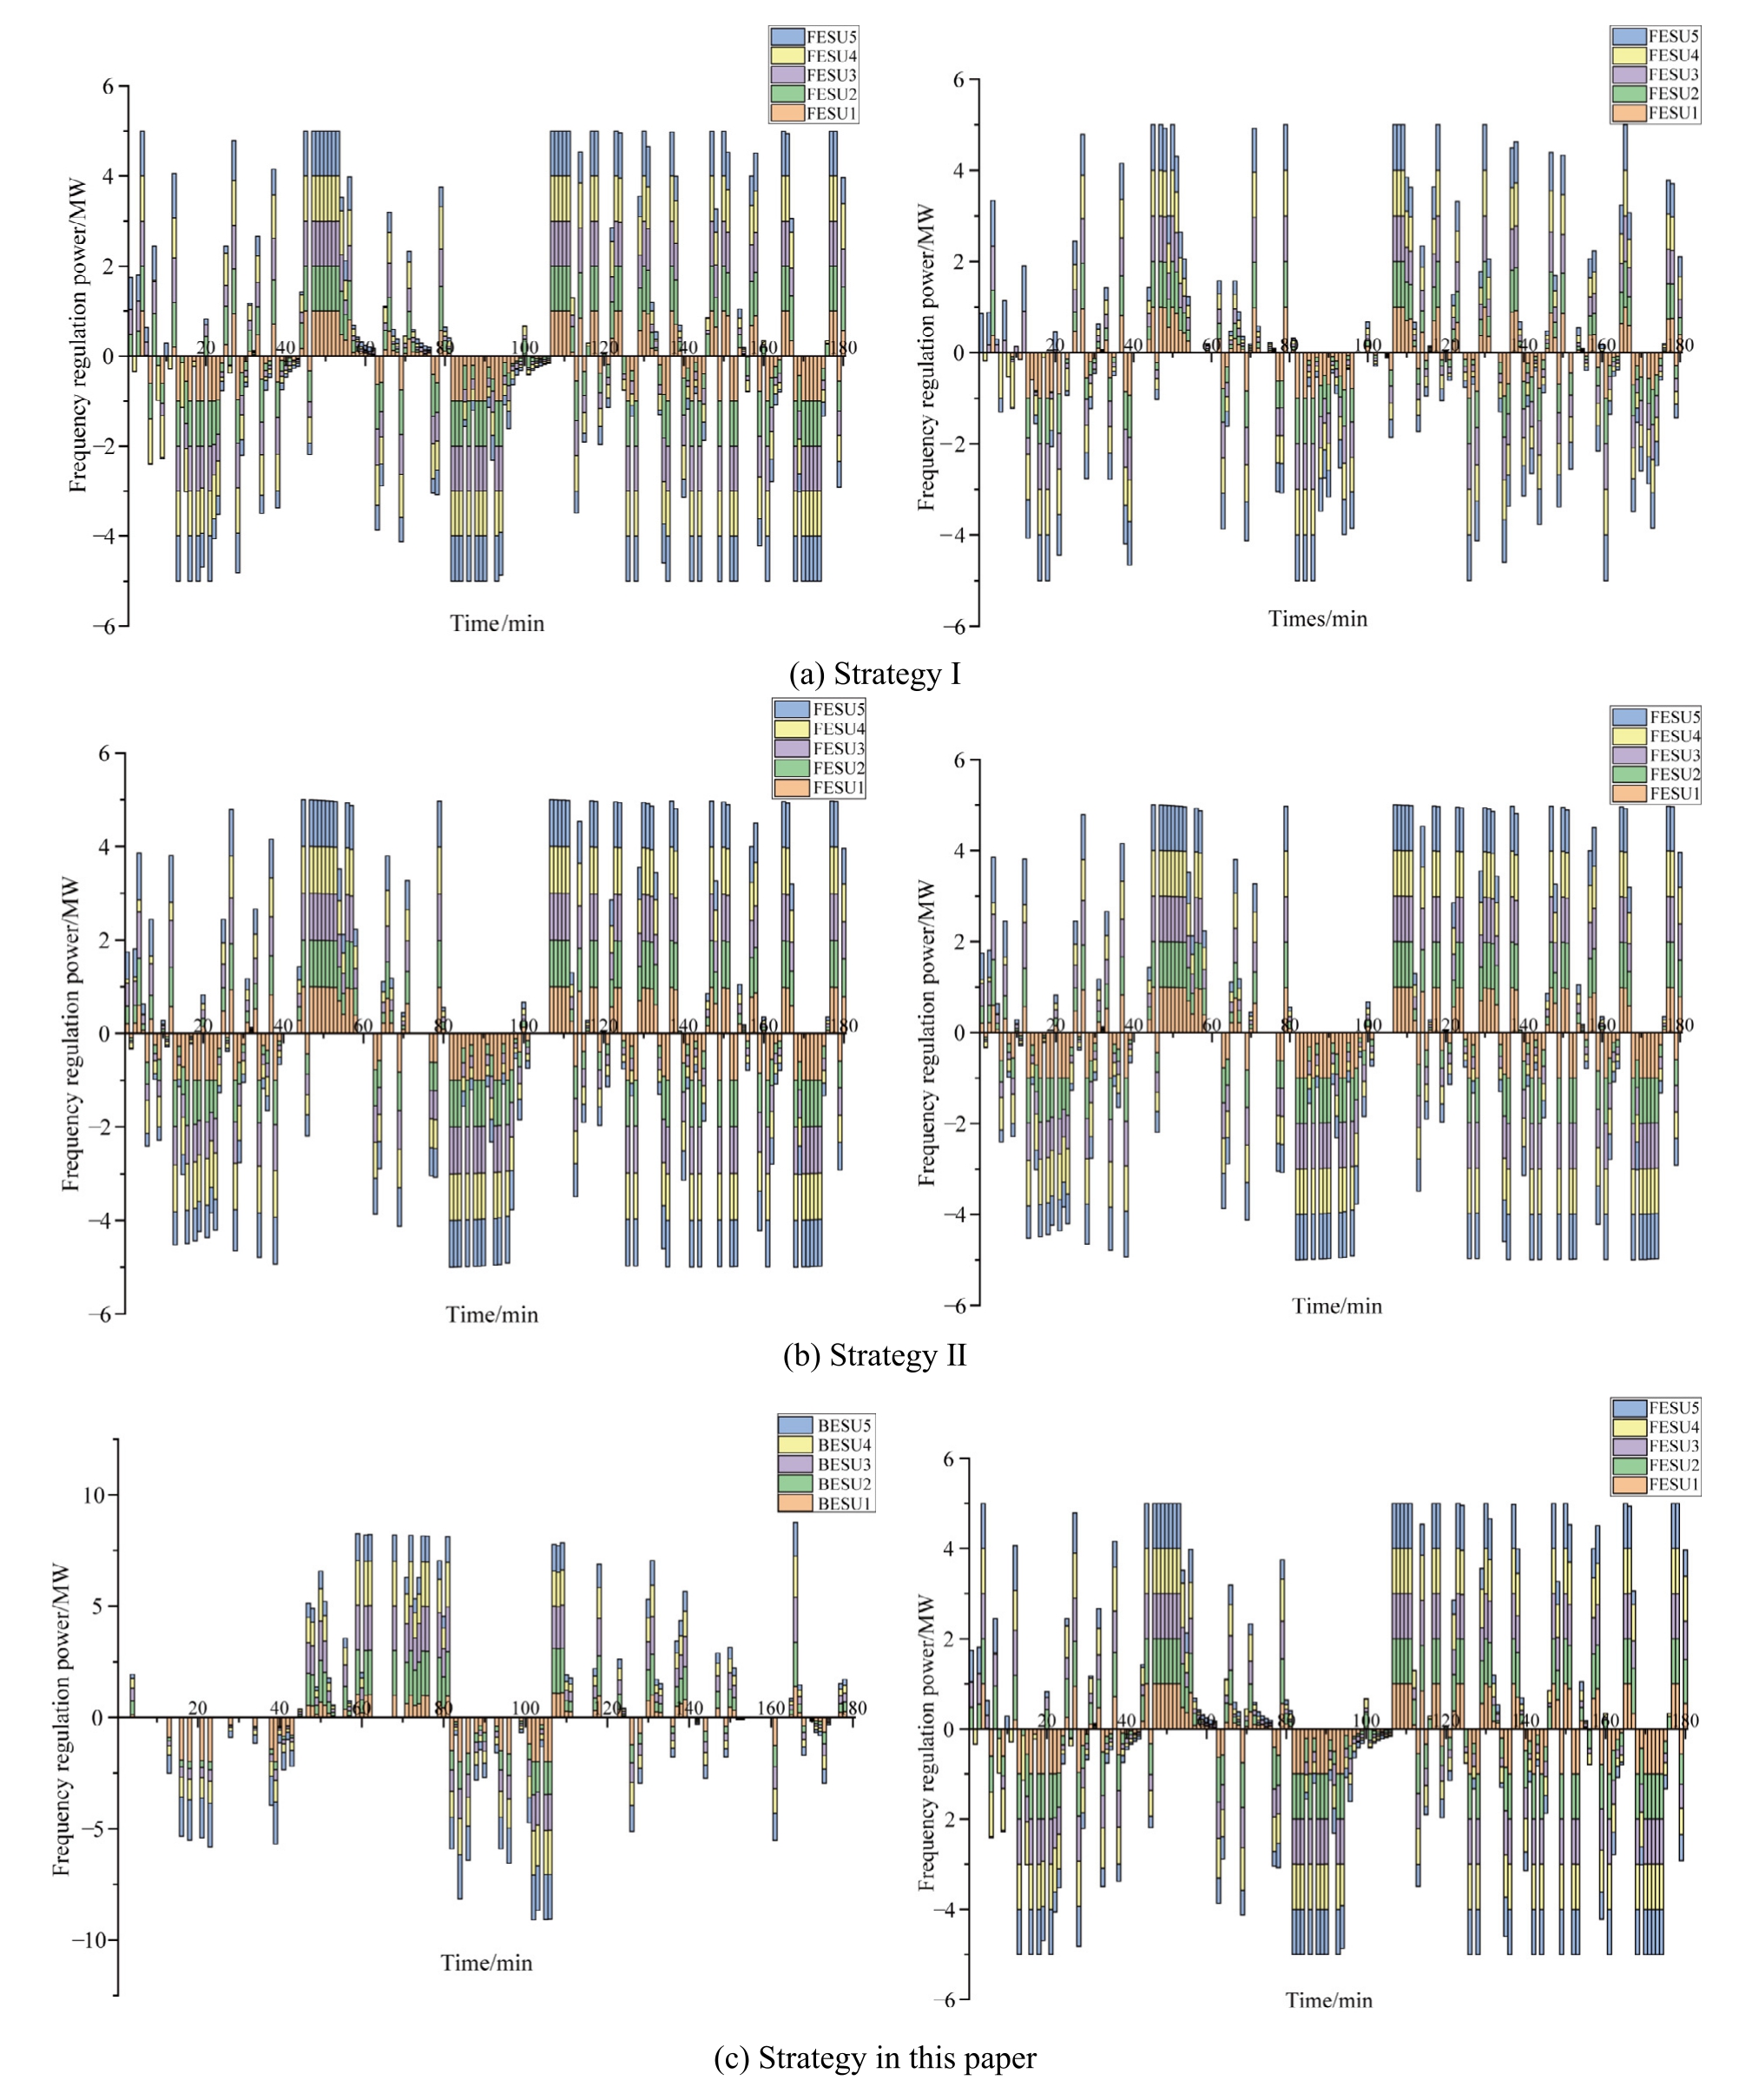
Fig. 9. FR output of each ESU under different strategies.
When the communication delay reaches 0.1 s, the control strategy maintains excellent performance, with the root mean square value of frequency deviation remaining nearly identical to the ideal scenario,as shown in Table 8.When compared with the ideal case with zero delay, the maximum frequency deviation increases by 28.6% when the communication delay reaches 0.5 s,and the root mean square value of frequency deviation increases by 24.3%.The results indicate that in HESSs analyzed in this study,the proposed strategy maintains excellent performance when communication delays do not exceed 0.1 s, with only minimal variations in the frequency deviation when com-pared with the no-delay scenario. This demonstrates the feasibility of the proposed strategy within a reasonable delay range. However, the performance decreases significantly when the delay increases further.
Table 7 Degree of SOC equalization of ESS under different strategies.
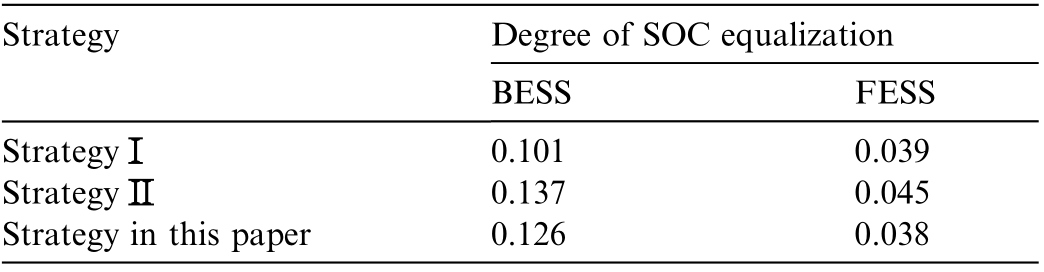
Table 8 Frequency deviation under different communication delays.
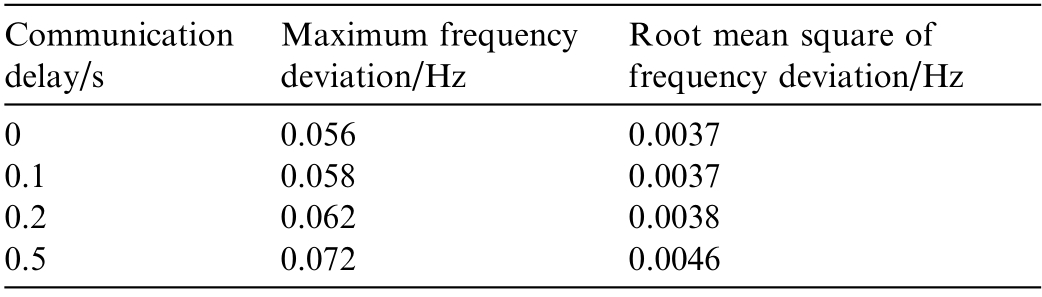
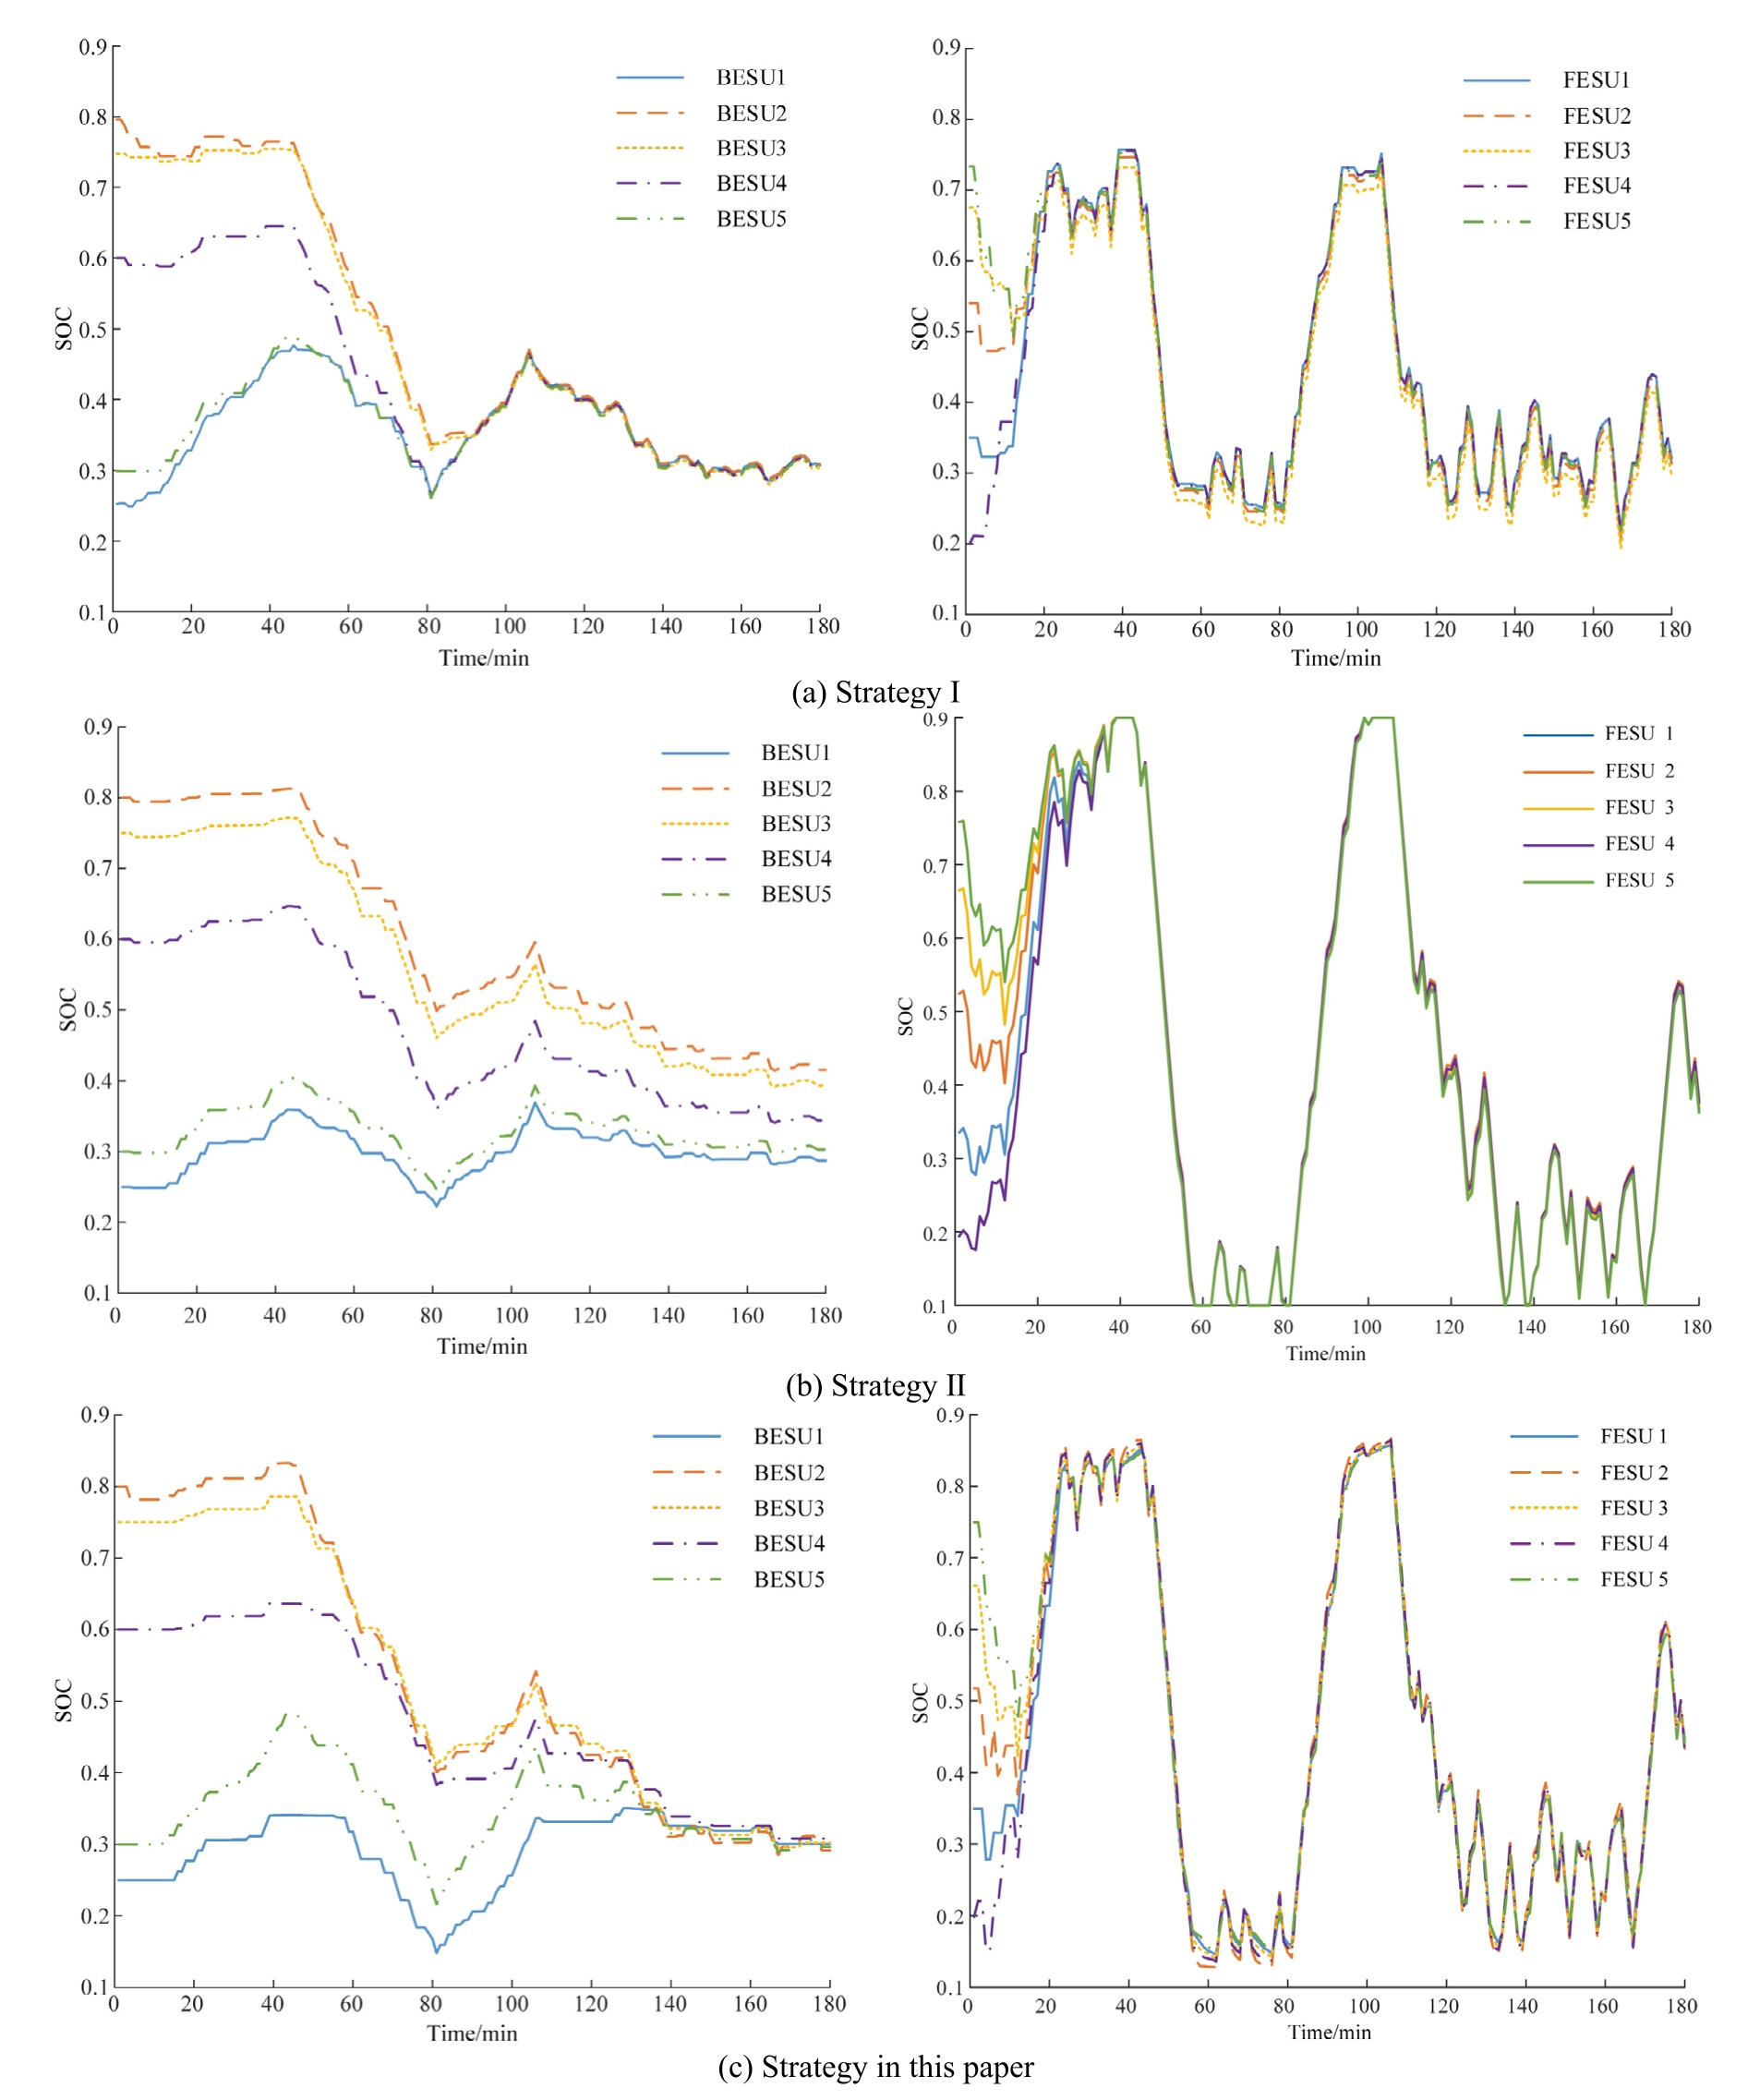
Fig. 10. Variation curve of SOC of each ESU under different strategies.
6 Conc lusions
This study presents a cooperative control strategy for the participation of HESSs in AGC FR, which was validated via simulation analysis.The major findings and conclusions are as follows:
1) The proposed strategy leverages the benefits of the long operational life of the FESS and high energy density of the BESS. The proposed model significantly reduces the response deficit power and response deviation rate.
2) The proposed HESS coordinated control strategy can prevent the FESS from frequently reaching the SOC limits due to the low energy density, which improves the sustainable operation capability of the FESS. Furthermore, the proposed stra tegy constrained the lifetime loss of the BESS, thereby exhibiting an enhancement of 7.1%in the BESS lifespan when compared with that of Strategy Ⅰ.
3) The coordinated control strategy of the proposed ESU significantly reduced the energy loss of the ESS while maintaining the SOC of the ESU. The proposed equalizes the SOC of the ESU,thereby preventing one or multiple ESUs from reaching the SOC limits beforehand, thereby enhancing the FR effect.
CRediT authorship contribution statement
Cuiping Li: Writing - original draft, Methodology,Conceptualization. Liang Zhang: Writing - original draft,Visualization, Software, Methodology, Conceptualization.Wenbo Si: Formal analysis, Conceptualization. Caiqi Jia:Methodology, Formal analysis. Xingxu Zhu: Software ,Formal analysis.Gangui Yan:Validation,Formal analysis.Junhui Li: Writing -review & editing, Methodology, Formal analysis, Conceptualization.
Declaration of competing interest
The authors declare that they have no known competing financial interests or personal relationships that could have appeared to influence the work reported in this paper.
Acknowledgments
The work is supported by the Key Projects of the National Natural Science Foundation of China (No.: 52337004).
Appendix A
The EEMD can effectively overcome the modal aliasing problem and adaptively decompose the original signal into a series of intrinsic mode functions from high frequencies to low frequencies and a residual signal by introducing white noise-assisted analysis. The algorithm flow of the EEMD is as follows:
1)Superimpose white noise signals with Gaussian feature distribution on the original AGC signal to generate a new time series.

where nm (t)is the noise signal added for the m time, and Xm (t)is a noisy AGC signal.
2) Perform EMD decomposition on signa l Xm(t)to obtain multiple intrinsic mode signals and their residual signals.

where I MFm,i(t)is the ith intrinsic mode signal during the mth EMD processing, and rm (t)is the decomposed residual signal.
3) Repeat processes 1) and 2) N1 times and add a different white noise signal n m(t)in each iteration.
4) Mean processing is performed on the intrinsic mode signals and residual signals during the N1 times repetition process to obtain the final EEMD decomposition result.
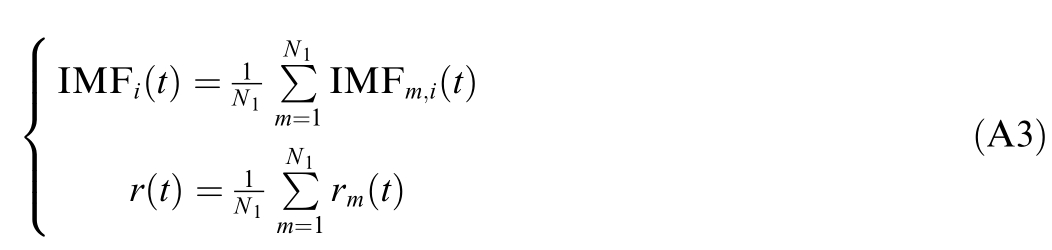
where IMFi(t)is the ith intrinsic mode signal decomposed via EEMD, and r(t )is the residual signal after the decomposition of EEMD.
The high-frequency signals transmitted by the flywheel energy storage are represented as follows:

The low-frequency signals transmitted by the battery energy storage are represented as follows:

where XL F(t)is the low-frequency signal of the original signal, XHF(t)is the high-frequency signal of the original signal, and k denotes the deco mposition boundary of high and low frequencies.
As the decomposed high-frequency components must match the rapid response capability and limited energy capacity of the flywheel, we determine parameter k to avoid the flywheel energy storage SOC from exceeding the limit. The specific content is as follows:
First, we calculate the high-frequency components obtained via decomposition under different k values.

where 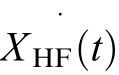 denotes a vector composed of highfrequency components at different k values.XHF,k(t)is the high-frequency component obtained by decomposition when the decomposition boundary parameter is k.
Subsequently, we calculate the root mean of the maximum power that the flywheel energy storage can handle and the high-frequency components obtained via decomposition.We select the k value corresponding to the smallest square mean root value.

where f(k)denotes the selection function for decomposing the boundary parameters. and  (t)is the maximum power that the flywheel energy storage can handle.
References
[1]J. Li, G. Mu, J. Zhang, et al., Dynamic economic evaluation of hundred megawatt-scale electrochemical energy storage for auxiliary peak shaving, Prot. Control Mod. Power Syst. 8 (2023)1-13.
[2]L. Liang, F. Hong, W. Ji, et al., Energy management system of large-scale flywheel energy storage array coordinated with thermal power unit in frequency regulation, Proc. CSEE 45 (2024) 2658-2670.
[3]X. Xie, N. Ma, W. Liu, et al., Functions of energy storage in renewable energy dominated power systems: review and prospect,Proc. CSEE 43 (2022) 158-168.
[4]P. Ren, J. Zheng, L. Qin, et al., Adaptive VSG control of flywheel energy storage array for frequency support in microgrids, Global Energy Interconnect. 7 (2024) 563-576.
[5]K. Li, Z. Huang, Y. Liu, et al., Dynamic optimal allocation of energy storage systems integrated within photovoltaic based on a dual timescale dynamics model, Global Energy Interconnect. 7(2024) 415-428.
[6]U. Akram, M. Nadarajah, R. Shah, et al., A review on rapid responsive energy storage technologies for frequency regulation in modern power systems, Renew. Sustain. Energy Rev. 120 (2020)109626.
[7]Y. Zhang, Y. Zhang, T. Wu, Integrated strategy for real-time wind power fluctuation mitigation and energy storage system control, Global Energy Interconnect. 7 (2024) 71-81.
[8]C. Li, W. Si, J. Li, et al., Two-Layer Optimization of frequency modulated power of thermal generation and multi-storage system based on ensemble empirical mode decomposition and multiobjective genetic algorithm, Trans. China Electrotech. Soc. 39(2024) 2017-2032.
[9]C. Li, X. Wang, J. Li, et al., Multi-constrained optimal control of energy storage combined thermal power participating in frequency regulation based on life model of energy storage,J.Storage Mater.73 (2023) 109050.
[10]R. Diao, Z. Hu, Y. Song, et al., Cooperation mode and operation strategy for the union of thermal generating unit and battery storage to improve AGC performance, IEEE Trans.Power Syst.38(2022) 5290-5301.
[11]H. Shu, W. Li, G. Wang, et al., Online collaborative estimation technology for SOC and SOH of frequency regulation of a leadcarbon battery in a power system with a high proportion of renewable energy, Prot. Control Mod. Power Syst.9(2024)52-64.
[12]H. Wu, Z. Xu, Y. Jia, Optimal hydrogen-battery energy storage system operation in microgrid with zero-carbon emission, Global Energy Interconnect. 7 (2024) 616-628.
[13]T. Zhang, X. Li, H. Li, et al., Simulation and application analysis of a hybrid energy storage station in a new power system, Global Energy Interconnect. 7 (2024) 553-562.
[14]D. Li, Z. Chen, B. Xu, et al.,Mechanism analysis and optimal dead zone parameter of wind-storage combined frequency regulation considering primary frequency regulation dead zone, Power Syst.Protect. Control 52 (2024) 38-47.
[15]Z. Song, M. Zhang, Y. Chi, et al., Research on the coordinated optimization of energy storage and renewable energy in off-grid microgrids under new electric power systems, Global Energy Interconnect. (2025).
[16]H. Wang, L. Qian, Hybrid energy storage power allocation strategy based on NGO-VMD, Electr. Power 57 (2024) 119-128.
[17]J. Li, C. Jia, X. Zhu, et al., Dual-layer model for capacity optimization of hybrid energy storage system to reduce thermal power frequency modulation loss, High Volt. Eng.49(2023)3965-3976.
[18]F. Zhang, Z. Hu, K. Meng, et al.,HESS sizing methodology for an existing thermal generator for the promotion of AGC response ability, IEEE Trans. Sustainable Energy 11 (2019) 608-617.
[19]G. Yan, Y. Li, Q. Shan, et al., Co-control strategy for hybrid storage-assisted thermal power unit frequency regulation based on ICEEMDAN decomposition, Power Syst. Technol. (2026) 1-12.
[20]M. Guo, J. Zheng, F. Mei, et al., Double-layer AGC frequency regulation control method considering operating economic cost and energy storage SOC consistency, Int. J. Electr. Power Energy Syst. 145 (2023) 108704.
[21]J. Li, Q. Song, Q. Guo, et al., Double-layer optimization strategy for grid-side multi-storage power station considering available capacity and frequency modulation cost, Autom. Electr. Power Syst. 49 (2025) 101-111.
[22]J. Li, T. Hou, G. Yan, et al., Two-layer optimization of frequency modulation power in multi-battery energy storage system considering frequency modulation cost and recovery of state of charge, Proc. CSEE 41 (2021) 8020-8033.
[23]Y. Zhu, J. Liu, D. Zeng, et al., Energy management s trategy and operation strategy of hybrid energy storage system to improve AGC performance of thermal power units, J. Storage M ater. 102(2024) 11419 1.
Received 25 July 2025; re删vis除ed 22 December 2025; accepted 24 December 2025
Peer review under the responsibility of Global Energy Interconnection Group Co. Ltd.
* Corres删ponding au除thor.
E-mail addresses: licuipingabc@163.com (C. Li), 13280595539@163.com (L. Zhang), 1599558180@qq.com (W. Si), jiacaiqi0600@163.com(C. Jia), neduzxx@163.com (X. Zhu), yangg@neepu.edu.cn (G. Yan),lijunhui@neepu.edu.cn (J. Li).
https://doi.org/10.1016/j.gloei.2025.12.007
2096-5117/© 2026 Global Energy Interconnection Group Co. Ltd. Publishing services by Elsevier B.V. on behalf of KeAi Communications Co. Ltd.This is an open access article under the CC BY-NC-ND license(http://creativecommons.org/licenses/by-nc-nd/4.0/).

Cuiping Li received the Master of Engineering degree in Power Electronics and Power Drives from Harbin Institute of Technology in 2007,and the Doctor of Engineering degree in Electrical Machinery and Electrical Apparatus from Harbin Institute of Technology in 2013. Since 2013, she has been engaged in research work in the field of Power System and Its Automation at the School of Electrical Engineering,Northeast Electric Power University, China. She is currently an Associate Professor and Master’s Supervisor at the School of Electrical Engineering, Northeast Electric Power University, and teaches courses including Electrical Machinery, Electrical Machine Control Technology, Electromechanical Drive Control, and Modern Electrical Machine Control Technology. Her main research interests include:the impact of electric vehicles on power systems, key technologies for grid-connected operation of new energy power generation, and the application of energy storage technologies.