
0 Intr oduction
This review paper focuses on the power generation methods used across the 91 stations, camps, and laboratories in Antarctica, where significant human activity occurs. These fa cilities adopt both conventional and non-conventional power generation methods. In the summer months, they can accommodate around 4000 people, but this capacity reduces to approximately 1000 during the winter[1].
Currently, these stations rely heavily on fossil fuels for power generation, living comfort, transportation, and other needs. However, the supply of fossil fuels to Antarctica is both expensive and dangerous, posing risks such as oil spills and fires, which threaten safety and present longterm environmental hazards.
The 2015 Paris Agreement set a global target to achieve net zero emissions by 2050, aiming to phase out fossil fuels and decarbonize energy systems worldwide. This shift is not only motivated by environmental concerns but also by the high cost and risks associated with fossil fuel use in Antarctica.A transition to renewable energy could benefit various Antarctic operations,including air cargo,fishing, tourism, and shipping.
This review provides data and insights into deploying renewable energy-based optimal power generation systems in Antarctic stations. It identifies the current literature on the subject and maps out renewable energy sources currently in use. By reviewing existing implementations, this paper highlights the lessons learned, challenges faced,and opportunities presented by renewable energy deployment in Antarctic facilities. According to the Antarctica Station Catalogue of 2017 by the Council of Managers of National Antarctic Programs (COMNAP-2017), there has been notable progress toward adopting renewable energy in the region [2].
The paper discusses the efficiency, cost-benefit analysis,required technologies, trade-offs, and the impact of extreme weather conditions on renewable energy operations in Antarctica. Despite the Protocol on Environmental Protection to the Antarctic Treaty, signed in 1991 and enacted in 1998, fossil fuels remain the primary source of electricity generation in Antarctica. This reliance is due to the stability, efficiency, and consistent energy supply that fossil fuel-based systems provide, independent of weather conditions. These systems are also easy to maintain, have long lifespans, and can be quickly backed up in case of failure. However, transporting fossil fuels to Antarctica is logistically challenging and costly,and poses significant environmental risks, including potential catastrophic oil spills that could disrupt the Antarctic ecosystem and harm both wildlife and human lives.
Given these challenges, there is a moral and environmental imperative to reduce reliance on hydrocarbons for power generation in Antarctica. Research and development into renewable energy systems are crucial for enhancing energy efficiency in the region. Advanced modeling,optimal planning, and the adoption of cutting-edge technologies such as high-insulation materials, intelligent building designs, and sophisticated monit oring systems,can provide viable renewable energy alternatives.The goal is to integrate these renewable solutions into existing energy systems to minimize fossil fuel consumption, aiming for up to a 12% renewable energy generation share in some Antarctic stations.
Several renewable energy sources, including solar, wind,hydrogen, and battery storage, offer promising alternatives to reduce fuel consumption and emissions in Antarctica.The continent is particularly rich in wind resources, which have been explored since the mid-1980s when wind turbine prototypes were first tested. For example, in 1991, the first vertical axis 10-meter diameter H-rotor turbine, ‘‘HMW-56” with three blades and a rated output of 20 kW at 9 m/s, was installed at the German Neumayer Station.This turbine could operate in extreme conditions, withstanding wind speeds up to 68 m/s and temperatures as low as ° C.
° C.
In 2003, the Australian Antarctic Division, in collaboration with a German turbine manufacturer, developed 300 kW wind turbines for the Australian Mawson Station,which now meet 96% of the station’s energy needs. Similarly, Princess Elisabeth Station has deployed nine wind turbines equipped with systems to protect the blades and reduce rotation speeds during strong winds or storms.Ross Island, New Zealand’s Scott Base, and McMurdo Station have collaborated to construct a wind farm comprising three turbines, each with a capacity of 0.33 MW,making the total capacity 1 MW. The first turbine of this wind farm became operational in 2009.
Solar energy has become increasingly prevalent for power generation in Antarctica over the past decade. During the Antarctic summer, sunlight is available, but solar irradiance remains relatively low, depending on cloud cover. When clouds are absent, the latitude of 60° S benefits from high insolation rates due to the combination of snow cover’s high albedo and the clear, moisture-free atmosphere. However, photovoltaic (PV) systems at higher latitudes can accumulate snow or ice, which must first be melted by solar energy, especially since snowfall can occur even in summer. To address this, vertical or dynamic installations are often used to maximize solar gain through the surrounding albedo rather than horizontal panel installations. Initially, solar energy in Antarctica was used primarily for melting ice and heating water, but as solar panels have become more efficient and affordable,they have been increasingly used for electricity production.The Wasa Station in Sweden utilizes solar energy for both heating and electricity generation,while Princess Elisabeth Station integrates thermal and PV panels to complement its wind turbine-based power system.
Beyond wind and solar, other renewable energy technologies are also being explored. For instance, robots and vehicles powered by solar energy, which reflect offthe snow, have been developed to reduce fuel consumption during the summer months. Although tidal energy offers another renewable option, the average tidal speeds around Antarctica are insufficient for large-scale electricity generation. Similarly, the limited solid waste available in Antarctica provides minimal potential for energy recovery. Consequently, hybrid energy systems that combine fos sil fuels with renewable sources like solar PV panels and wind turbines are commonly used [3–5]. In these systems, solar PVs and wind turbines often operate simultaneously, as low solar radiation usually coincides with high wind potential, and vice versa. Rooftop PV installations with battery storage are also employed to protect against harsh weather conditions such as snow, strong winds, and sandblasting.
Transitioning to 100% renewable energy-based power generation in Antarctica promises significant environmental and economic benefits but requires substantial capital investment for initial installation. For example, SANAE IV, a South African station powered entirely by renewable energy, is expected to have a lifespan of 25–30 years. At China’s Zhongshan Station in Antarctica, the combination of solar arrays and wind turbi nes meets all power requirements,saving approximately USD 1.43 million annually in fuel costs. The COMNAP’s Antarctic Station Catalogue 2017 provides a detailed overview of the energy generation mix, highlighting the use of both conventional and renewable energy sources.
Despite these advancements, the unpredictability of renewable energy availability remains a significant challenge. While powerful battery storage systems are being developed , the current technologies still fall short of providing the necessary backup for surplus power generation.
1 Literature revie w
1.1 Antarctic stations
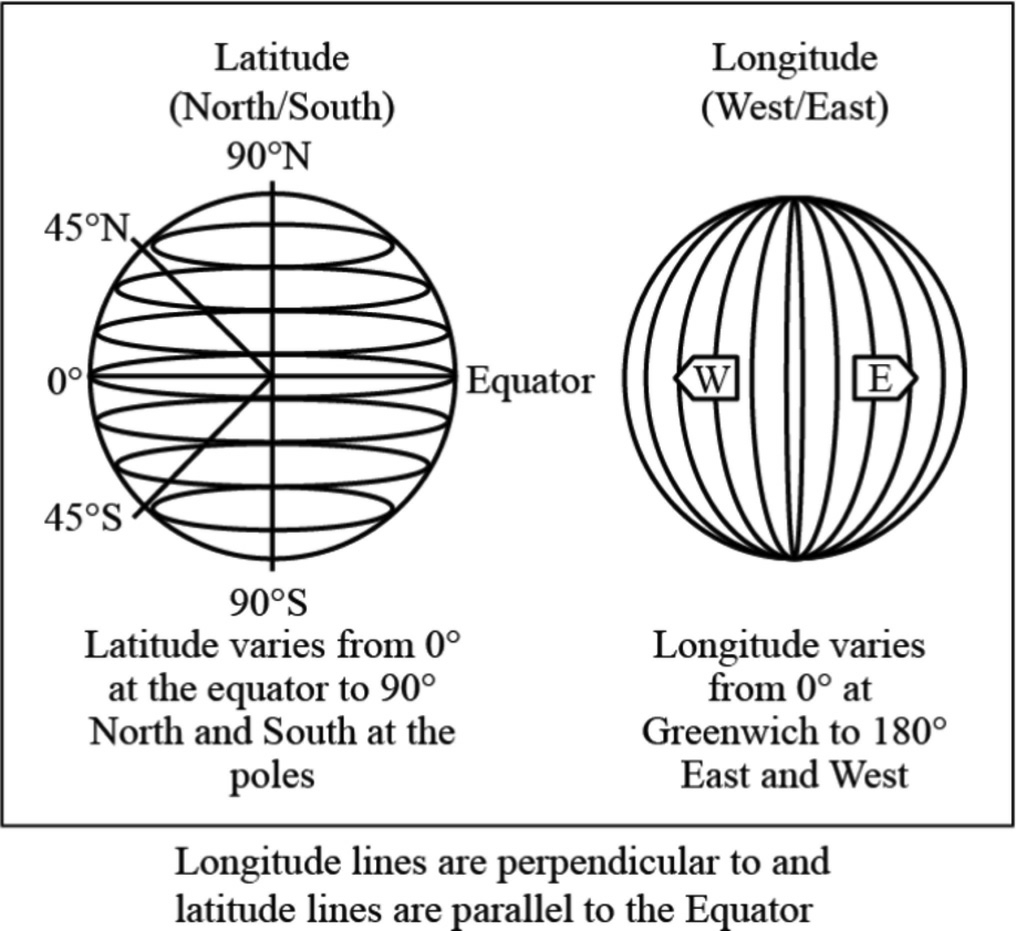
Fig. 1. Location of Horseshoe Island in Antarctic [8].
The continent Antarctica is the darkest, coldest and least populated of all the seven continents. The Antarctic covers a surface area of the land that is 50% large r than the United States; 13.8 million km2. 99% of Antarctica’s land is covered by glacial ice. Mean annual temperature is about 50° C, and Vostok station on the Antarctic plateau has recorded the lowest ever temperature in nature on earth, at 89.2° C. In the context of Antarctic Treaty System (ATS),a total of 28 countries governs Antarctica.It is a ‘‘natural reserve, devoted to peace and science”.
Our future work will focus on Horseshoe Island, where the Turkish Antarctic Research Station(TARS)is located.Fig. 1 shows the location of Horseshoe Island. The coordinates via GIS, have longitude and latitude to track any location on the earth. Longitude are vertically lines and latitude are horizontal lines on the earth. Latitude wise,Horseshoe Island is located at 67° degree  minutes
  seconds on South; and longitude wise, it is at 67° degree
 minutes and 39 seconds on West. The Horseshoe Island temperature usually ranges between 6 ° C and
 ° C in winter, with possible lows of
  ° C as per its coordinates. The weather data is collected for the specific region by given geographical spatial coordinates system with the help of Meteorological Weather Station of TARS.The weather data is also available for the solar irradiance,wind speed and temperature by surrounding nearby already established stations in the region. Additionally,there are databases available, such as NASA database[7], Scientific Committee on Antarctic Research (SCAR)-MET READER i.e. (Reference Antarctic Data for Environmental Research), BAS Antarctic Meteorological Database, Meteorological datase t of records of Antarctic Automatic Weather Stations (AntAWS) and several other sources.
1.2 Stations with renewable energy (RE) based power generation
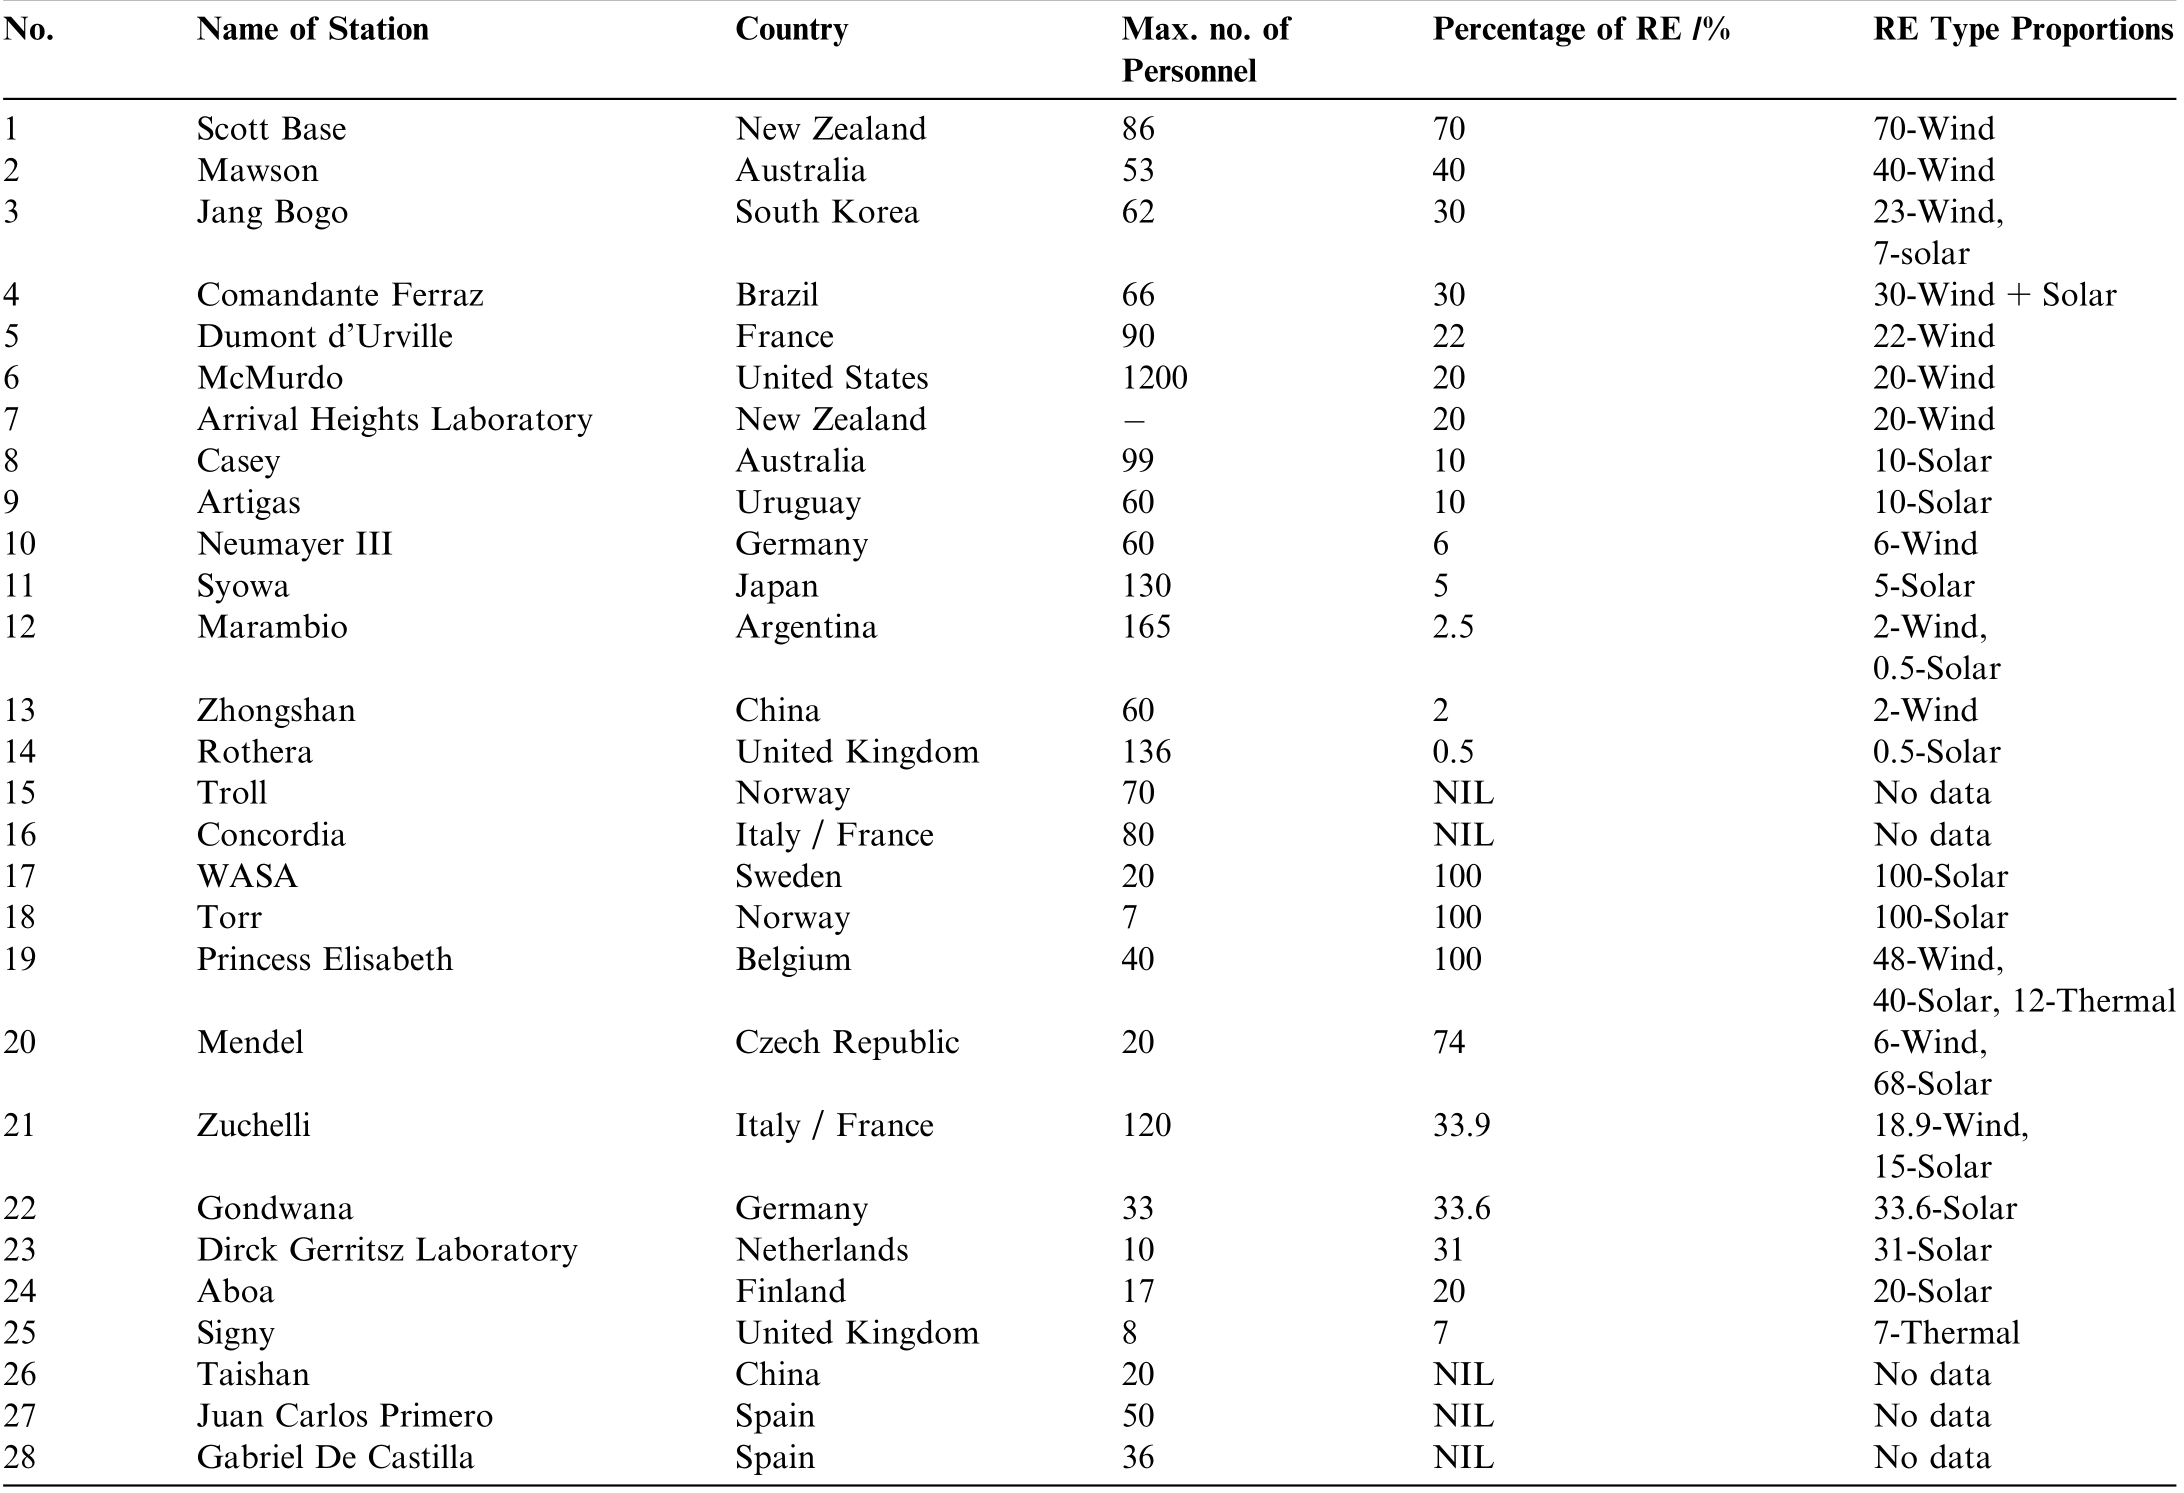
28 stations are using renewable energy sources, while 63 other stations are still using conventional energy resou rces,which account for 69.2% of total number of stations in Antarctica [9]. This number is significantly high, considering their potential contribution to environmental impact,especially air pollution. The stations at Antarctica that use renewable energy resources for power generation are listed in Table 1.
1.3 Challenges and opportunities for RE power generation in Antarctica
There are several challenges of RE in the region, such as availability of RE round the clock. The efficiency of RE is low, and the initial installation cost of RE such as photovoltaic (PV) panels, wind turbines, hydrogen energy and battery energy storage systems are high[11–14]. Additionally, RE sites requires a lot of space for inst allation, and their devices need recycling.
Moreover, there are logistic issues. It’s quite expensive and difficult to transport the RE installation devices, especially the hydrogen energy. The logistics of renewable projects in the global supply chain suffers from product shortages, stock outs, and transportation muddles. As a result, prices and lead time increases, leading to losses.Solar and wind energies are unpredictable [15]. Both causes volatility in power generation depending upon varying loads. Therefore, battery storage systems are required for backup power generation.
For RE’s, the initial installation cost i.e. capital cost is one of the major hurdles in their development. Although fossil fuels such as diesel, LNG, coal, gas etc. requires certain cost based on Net Present Value of fuel and market prices for per Megawatt production,wind and solar power plants also require a high investment.
In the harsh environment of Antarctica, extreme cold conditions cause the PV and wind turbines to freeze. It reduces the efficiency of power generation. Snow accumulation on the solar panels further reduces their output power efficiency. Additionally, solar irradiance is much lower as compared to normal scenarios. With unpredictable and drastically changing of wind speeds in the freezing environment, wind turbine output is constrained.RE based power generation also faces challenges in terms of RE sizing and placement, hybrid energy system management and installation cost etc. As a result, many stations continue to use conventional power generation techniques, relying on fuels that generate CO2, NOx and other pollutants, thereby contributing to the environmental pollution. One of the main challenges of restructured power systems is to maintain sufficient installed generation capacity to meet system demand in different load points of transmission network, both in the present and future.This paper refers to generation expansion planning (GEP)scheme in a pool market, ensuring secure operation of power system at various load points.Additionally,the reliability level of all load points is optimized based on the availability of the composite power system, i.e. generation and transmission level [16].
Dwelling on the opportunities that RE power generation offers, it can significantly reduce the pollution, as many stations still rely on fossil fuels for electricity generation. To address the climate change and global warming,there is a press ing need to adopt RE based power generation [17]. It reduces carbon emissions and air pollution from energy production while enhancing the reliability,security and resilience of the power grid. Additionally, it supports job creation through increased production and manufacturing of renewable energy technologies and in many cases lower energy costs after capital/installation cost of RE technologies.
Table 1 Antarctica stations using renewable energy for power generation [10].
Therefore, hybrid PV and wind turbine backed by battery energy storages are proposed for RE power generation; by combining wind gust and high speed of wind with solar energy. When employing optimal planning for RE power generation, the advanced optimization techniques such as Grey Wolf Optimizer is adopted [18,19].Monte Carlos simulations are used to forecast the weather patterns that are hard to predict, such as wind speed, temperature and solar irradiance for power output in the region. A sustained wind is defined as the average wind speed over two minutes, while sudden burst in wind speed is called the wind gusts, that typic ally lasts under 20 s. By combining all these techniques,a hybrid PV and wind turbine power generation with battery energy storage system is proposed. With advanced optimization techniques and optimal energy management,higher efficiency of electricity can be achieved [20–22].
PV, wind turbine and batteries storage RE are expected to replace the other energy resources in the near future.Considering solar PV, wind generation with batteries storage power have emerged as our necessary priority to preserve the environmental issues in the continent. Solar PV, batteries storage and wind generation are relatively cheap in capital installation cost whi le delivering greater power. They require less maintenance and produce less pollutants emissions. Additionally, a substantial funding support from the global partners helps to sustain the environment at Antarctic region,sufficing the United Nations’SDG for climate change.
Postponing reinforcements could reduce investment costs, but it also results in power interruption losses.Therefore, the benefits obtained from a good power system plan, results in lowering the energy costs. For decision makers, integrated Optimal Renewable Energy Planning is requir ed to assist the policymakers and investors, and to develop the power system design. Several ‘high-level’,transparent, and economy-wide scenarios for the system are extracted.
In line with the global policy of climate change, the goal is to reduce air pollut ion while increase the use of renewable energy for power generation [23,24]. Therefore, in our project, optimal power planning for design power generation of renewable energy is required and proposed.
While current implementations of renewable energy in Antarctic stations have demonstrated both success and limitations, they also highlight the need for site-specific solutions tailored to local environmental conditions and operational needs. In this context, the following section outlines the proposed future work focusing on the development of a renewable energy-based power system for the Turkish Antarctic Research Station (TARS) on Horseshoe Island.
2 Future work – RE based power generation in Horseshoe Island
In this project, collaboration with the TUBITAK Polar Research Institute, RE based microgrid power generation system is proposed. The focus of this study is Horseshoe Island, which currently has facilities for the Turkish Antarctic Research Station (TARS), including a weather monitoring station and a few camp buildings. The electricity supply is currently generated from diesel generators.Given its remote location, planned permanent facilities,and currently limited infrastructure that reli es heavily on diesel generators,the TARS on Horseshoe Island presents a particularly compelling case for renewable energy implementation.Its development phase offers a unique opportunity to design a microgrid from the ground up, allowing the integration of optimal, sustainable energy solutions tailored to Antarctic conditions.
Turkey has plans to construct a permanent base on Horseshoe Island, equipped with a RE based microgrid system, to accommodate approximately 50 people [25].The goal is to reduce the reliance on diesel generators for electricity supply, and consequently, to decrease CO2 emissions. However, power generation from RE, such as PV and wind turbine (WT), is highly dependent on environmental conditions. Due to the harsh environment in Antarctica, weather conditions can change dramatically with the seasons. It receives very little sunshine during the winter, and experience rapidly fluctuating wind speeds.These uncertainties have a significant impact on the planning of an RE microgrid system.Therefore,it is crucial to use an artificial intelligence method for optimal planning(appropriate location and size of RE), to minimize mismatch power between power sources and loads, and minimize power losses, while residual energy is injected into storage energy.
This section outlines the proposed methodology for designing a hybrid renewable energy (RE) system at the TARS on Horseshoe Island. The approach begins with the collection of weather data, including solar irradiance,temperature, wind speed, and wind direction, spanning multiple years to understand the site’s renewable energy potential. In parallel, expected energy demand at TARS is estimated based on future station infrastructure and load profiling. Using this in formation, the system design process involves appropriately sizing the main RE components: wind turbines, solar photovoltaic (PV) panels, and battery energy storage systems (BESS). A cost analysis is then conducted to account for procurement, installation,and logistics specific to the Antarctic environment.
To enhance the system’s reliability and efficiency, a machine learning model, Random Forest Regression(RFR) is employed to predict weather variability and its impact on energy generation. These predictions are used as inputs for the optimization process, where the Grey Wolf Optimization (GWO) algorithm is applied to determine the optimal sizing and placement of RE components within the microgrid. Finally, an Optimal Power Flow(OPF) analysis is performed to evaluate the techni cal performance of the system, including voltage stability, power losses, and energy balance under various scenarios. This integrated methodology ensures a robust, cost-effective,and environmentally sustainable energy solution tailored for the harsh conditions of Antarctica.
2.1 Expected future load profiling at Turkish Antarctic Research Station (TARS)
Expected future load profile is required to design the hybrid solar PV, wind turbine with battery storage system.The exp ected future load profile for 50 personnel at Turkish Antarctic Research Station is given in Table 2. Total power demand is 162.1 kW and total energy demand is 1404.4 kWh.
2.2 Weather data of Horseshoe Island
The wind speed, solar irradiance and temperature effects the generation supply of solar PV and wind turbines. Turkish Antarctic Research Station (TARS)recorded the uncertain weather data under harsh environment at Horseshoe Island for solar PV and wind turbines.The recorded data provided by Meteorological Monitoring Station (MET) station of TARS is for 4 years i-e 2020–2023 years.It contains hourly based wind speed,global solar irradiance, and temperature.
The solar irradiance, wind speed and temperatures for 2020, 2021, 2022 and 2023 are plotted and shown in Figs. 2–5.
From the figures of wind speed, solar irradiance and temperature of Horseshoe Island; maximum solar irradiance during various months annually is 900 Watt/m2 and minimum solar irradiance is 110 Watt/m2. Maximum wind speed recorded in a year is 8 m/s and minimum wind speed is 4 m/s. The maximum temperature recorded is 4 degrees Celsius and minimum 10 ° C. The figures also indicate that solar irradiance reaches its peak values during the Antarctic summer months, particularly from October to February, corresponding to extended daylight hours.Conversely, average wind speeds are higher during the winter months, between May and August, when solar input is limited. This seasonal complementarity highlights the advantage of adopting a hybrid PV–Wind system, as it ensures a more stable and continuous energy supply throughout the year, leveraging solar energy in summer and wind energy in winter.
Compared to established stations such as Princess Elisabeth Station and McMurdo Station, the TARS on Horseshoe Island experiences similarly challenging environmental conditions that impact energy system design. For example, while Princess Elisabeth benefits from high wind potential and extended summer sunlight, it also faces harsh katabatic winds and extremely low winter temperatures,requiring advanced hybrid energy and storage systems.McMurdo, on the other hand, has access to a more stable coastal wind regime but still depends partially on diesel backup systems. Horseshoe Island’s climate features moderately high wind speeds, seasonal solar availability, and significant variability in temperature and irradiance, a profile that aligns well with the energy challenges tackled by bothPrincess Elisabeth and McMurdo. These similarities reinforce the suitability of applying and adapting proven RE strategies at TARS while optimizing them for local conditions through advanced pl anning tools and machine learning techniques.
Table 2 Expected future load profile for TARS.
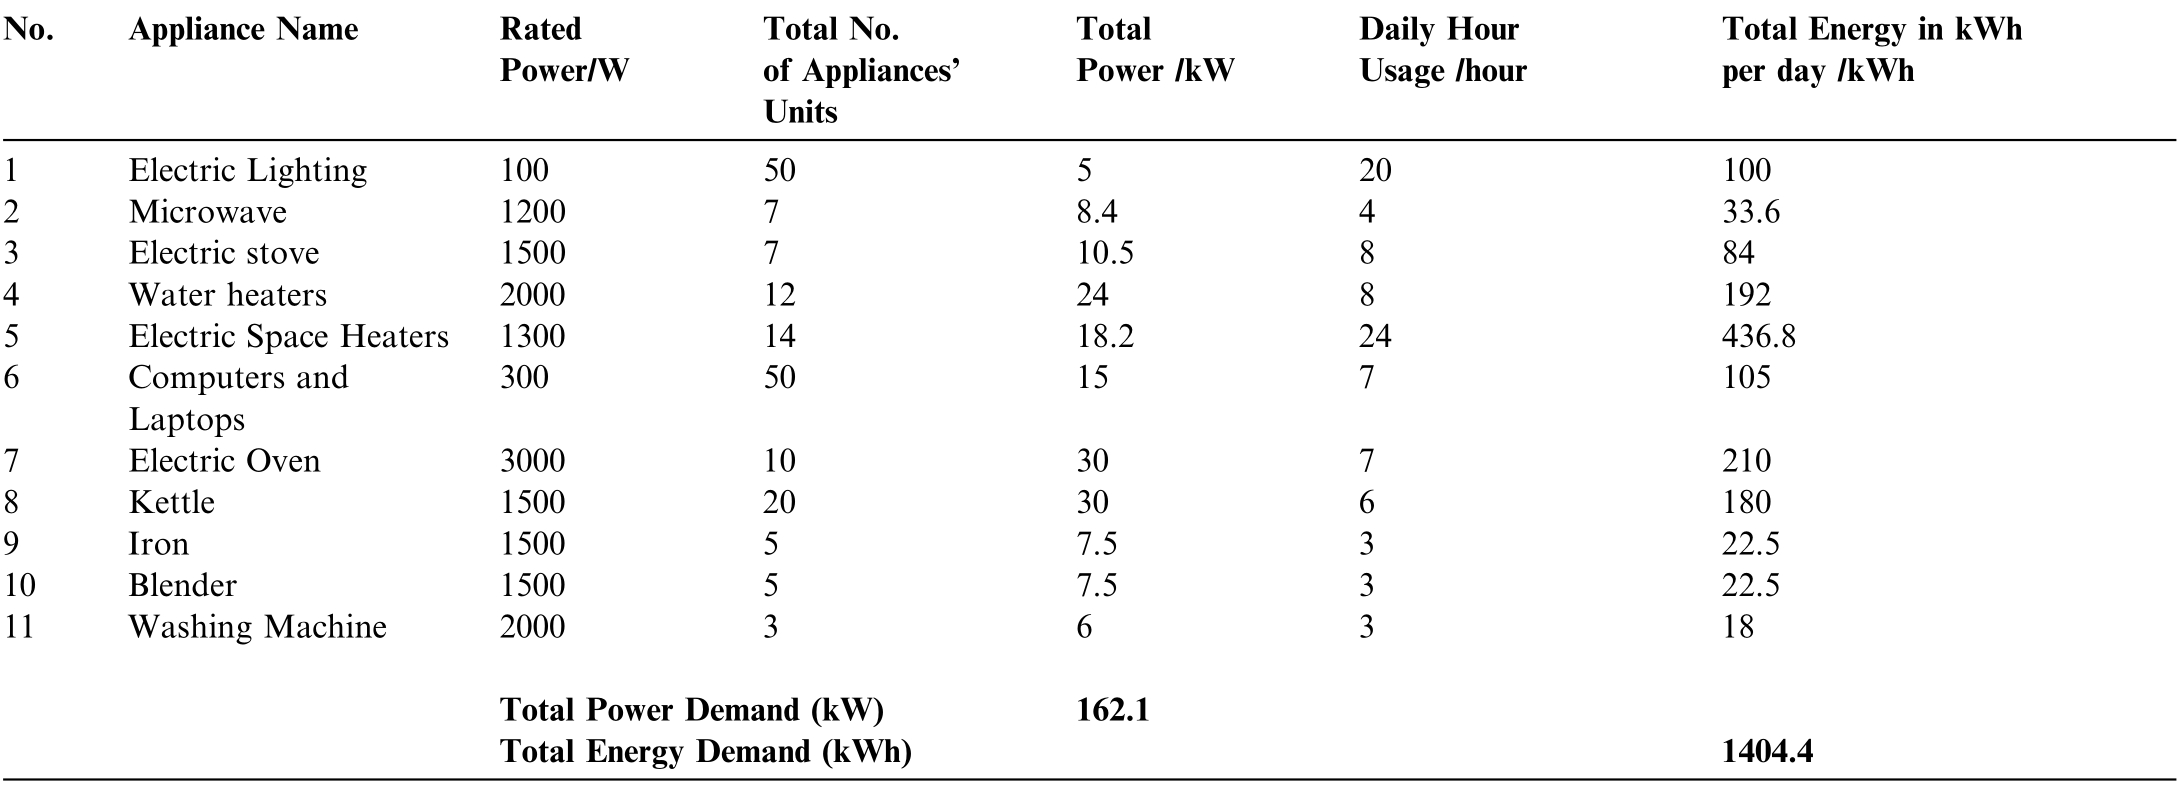
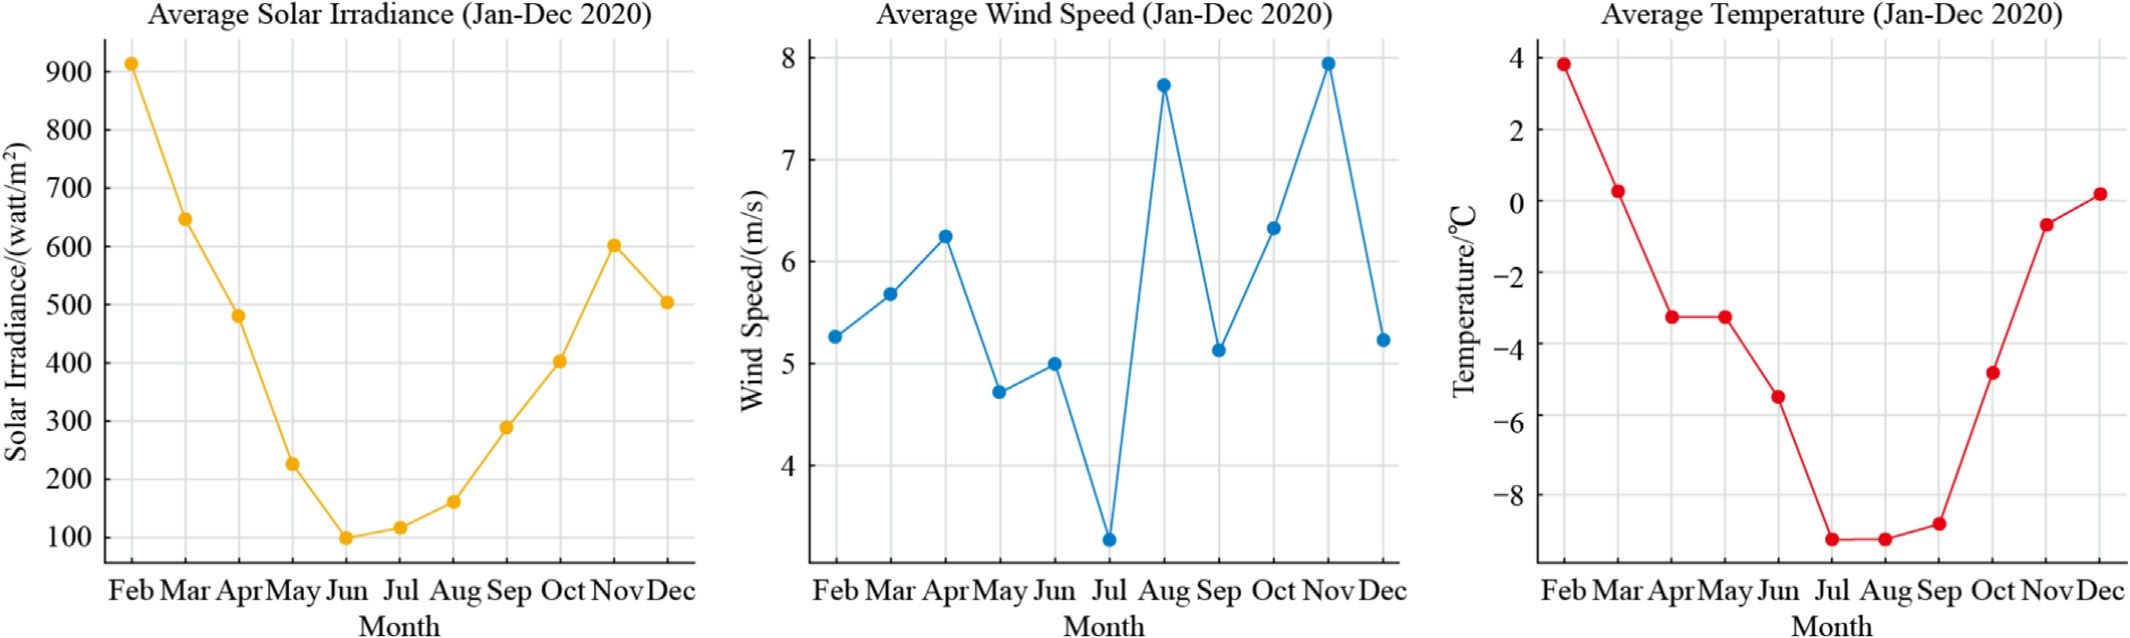
Fig. 2. TARS solar irradiance, wind speed and temperature- (Jan–Dec 2020).
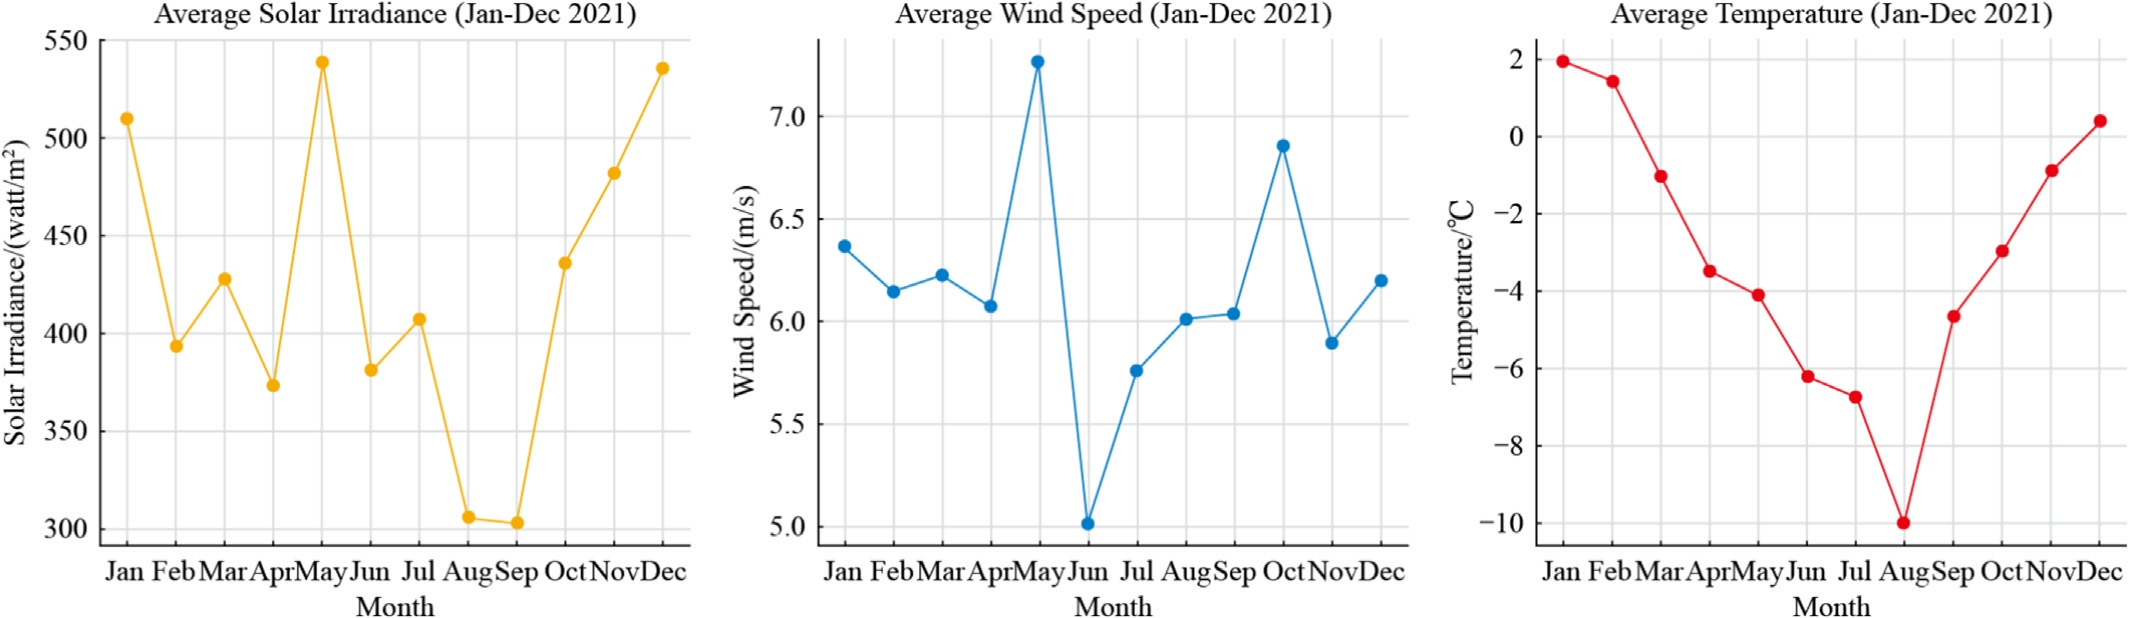
Fig. 3. TARS solar irradiance, wind speed and temperature- (Jan–Dec 2021).
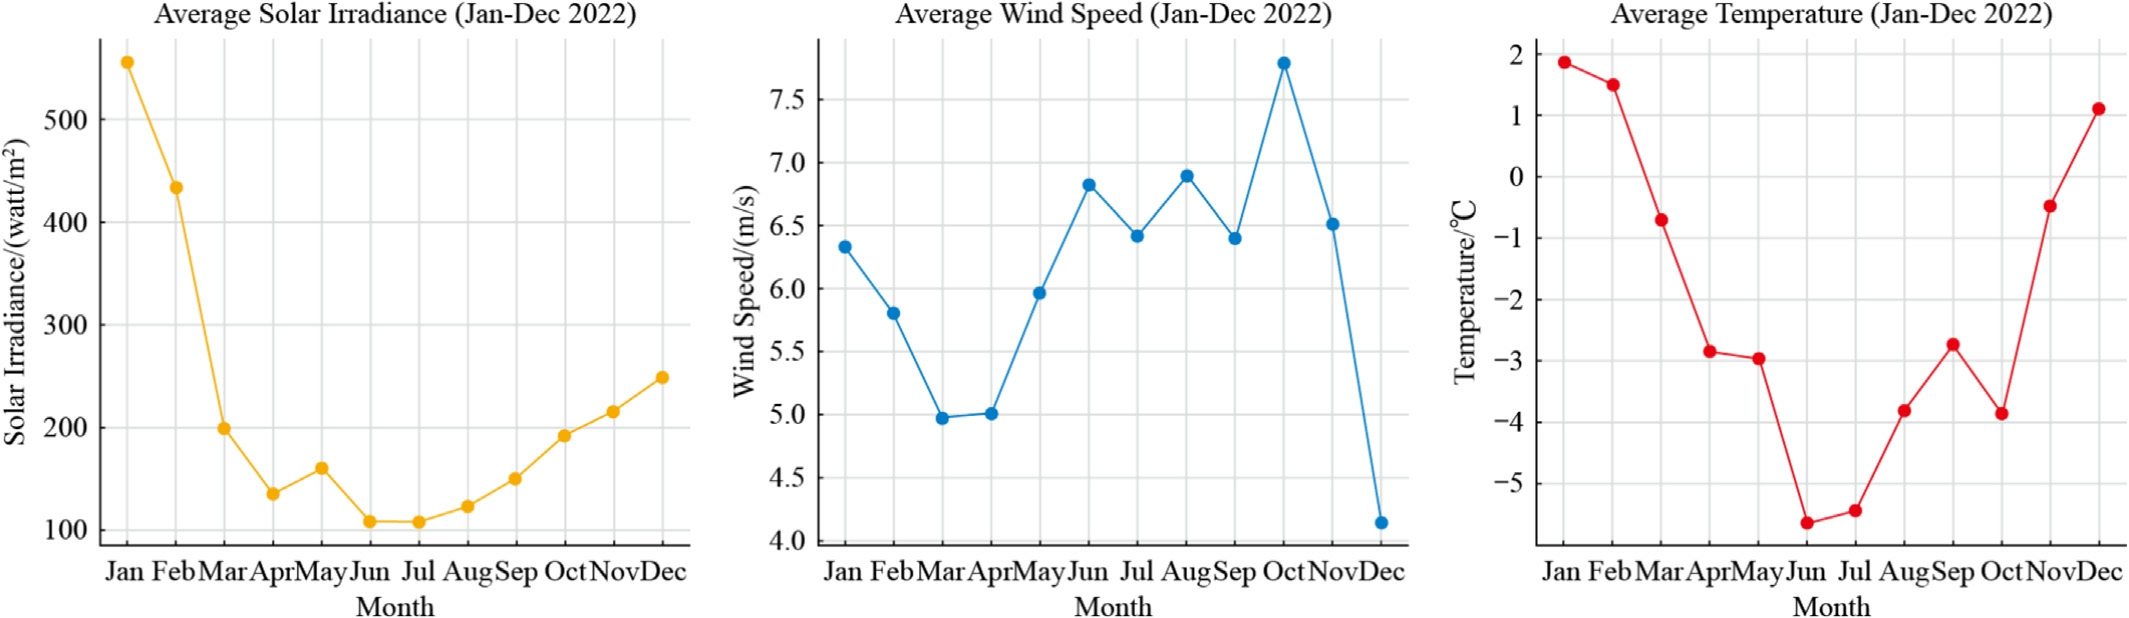
Fig. 4. TARS solar irradiance, wind speed and temperature- (Jan–Dec 2022).
Based on the weather patterns observed over the past four years, the next step involves translating this data into practical system design parameters. This includes the optimal sizing of wind turbines, solar PV, and battery energy storage to ensure a reliable power supply under local conditions.
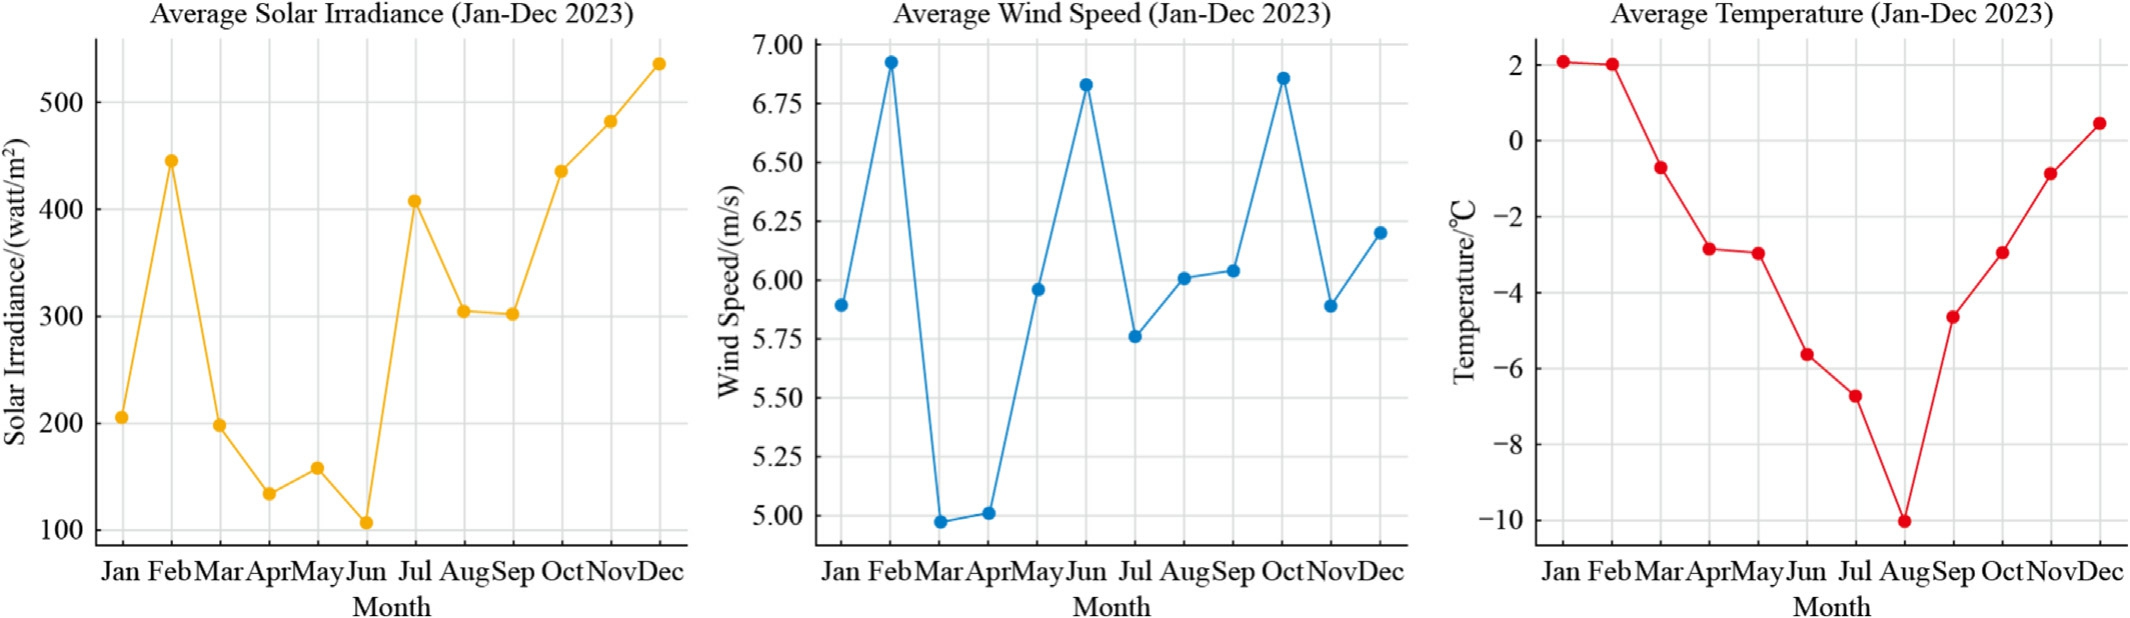
Fig. 5. TARS solar irradiance, wind speed and temperature- (Jan–Dec 2023).
2.3 Proposed renewable energy resources sizing and design
The use of conventional diesel fuel to achieve energy demand of 1404.4 kWh per day (162.1 kW of power demand), is quite costly. Diesel fuel costs at present time is 42 US $ /gallon. One gallon of diesel fuel generates 12 kWh in the harsh environment of Antarctica and contributes to carbon emissions and oil spill overs contaminating the coastal area.
Several research reviews provide insight of the hybrid renewable energy sizing and design [26–28]. The focus in this study is on renewable energy of wind, solar PVs and battery energy storage systems to meet the desired power demand of approx. 170 kW under harsh environments in Antarctic region [3,29–32]. It is required to, at least select and design double of the demanded power/energy in the Turkish Antarctic Research Station (TARS) as per the load profile. Because the efficiency of RE mostly depends upon weather conditions, which is uncertainty in the Horseshoe Island, thus, comprehens ive study is needed to increase the efficiency of the installed renewable energy hybrid system in the region. The solar PV output varies due to shorter daylight hours,lower insolation,snow cover and temperature [33]. The wind turbine faces ice formation, low wind speeds or mechanical issues. And the battery storage energy requires to be at least double of the output power of solar PV and wind turbines.
Therefore, based on this initial analysis, a hybrid energy system of PV-wind turbine backed by battery energy storage system of 560 kW (three time higher than power demand) is proposed. 300 kW of wind turbines, 60 kW of solar PV and 200 kWh of Li-Ion battery energy storage system with backup of 8 h daily. The wind, solar PV and battery storage hybrid energy power plant sizing and design could be achieved by appropriate selecting of wind turbines,solar PVs and batteries based on their characteristics and technical data.
2.3.1 Proposed wind plant sizing and design
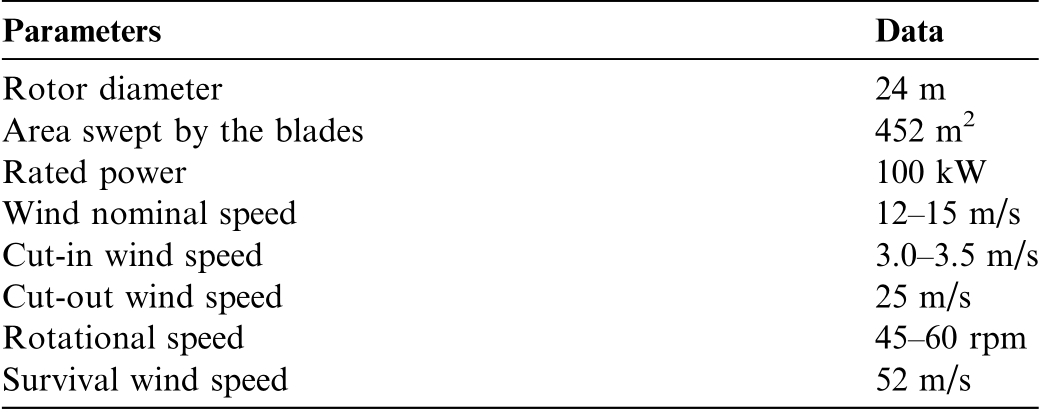
There are various wind turbines of output power capacity (50, 80, 100, 220, 250 etc. in kW). Depending on its technical data, quality, design, specification and characteristics, their price varies. Various wind turbine of companies such as the Northern Power Systems (NPS 100C 24 Arctic variant) with maximum output power of 100 kW are available and can be used. It operates under 46 to 50 ° C. The parameters are given in Table 3.
200 kW Wind Turbine ENERCON GmbH (Germany)with E-30 turbine can also be used, having 40 to 50 degrees Celsius operational temperature specifications.As per our calculations, either single 200 kW or three 100-kW wind turbines over 20 years of time span will save approximately 4 million US $ solely in hybrid energy system of PV, wind turbine and battery storage based microgrid. However, after GWO and HOMER modelled simulation, optimized configuration resul ts will be achieved to know the optimized cost, actual sizing and design. The expected installation cost of combined three wind turbines is expected 0.955 million US $ (each wind turbine is 0.477 million US$).The height of the wind turbine also effects the wind speed. At higher altitude the wind speed is increased.
2.3.2 Proposed solar PV sizing and design
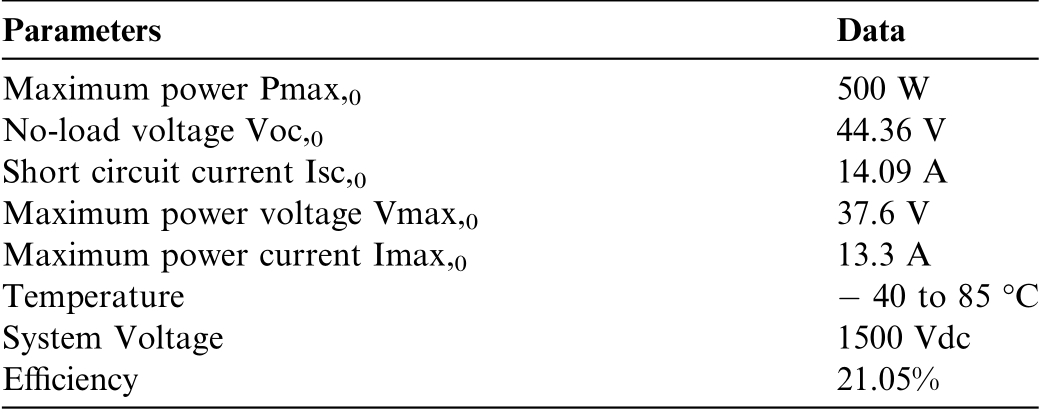
To achieve the daily energy demand of 1404.4 kWh(162.2 kW), 60 kW solar PV system is required in the region, to get at least 15–20 kW of power daily for 162.2 kW (1404.4 kWh) required power. However, after GWO and HOMER modelled simulation, optimized results will be achieved. Each solar PV panel of 500 W to be used resistant to temperature between 40 and 90 ° C.Annual global solar irradiance for solar PV panels is around 900 W/m2 in the month of Dec. – Jan. The monthly averaged cloud cover for the coordinates of Horseshoe Island for the months during which the solar irradiance isthe highest are between October-February. The maximum value of solar irradiance is 900 W/m2.The characteristics of solar PV cells panel are given in Table 4.
Table 3 Wind turbine technical data [34].
Total 120 solar panels of 500 W connected in parallel will be required to produce 15–20 kW daily for a 60 kW solar PV. Depending on the space required for solar panels at Horseshoe Island, the focus is to use less solar PV panels for the Turkish Antarctic Research Station.The solar panels connected in parallel matches the voltage of the battery bank.
2.3.3 Proposed battery sizing and design
Battery sizing and design in hybrid renewable energy system depends upon various factors such as energy demand, energy generation, battery depth of discharge,battery capacity, battery efficiency, system voltage and environm ental weather conditions. Proper sizing provides reliability, optimal performance and longevity of battery life span in integrating PV and wind turbines [36].
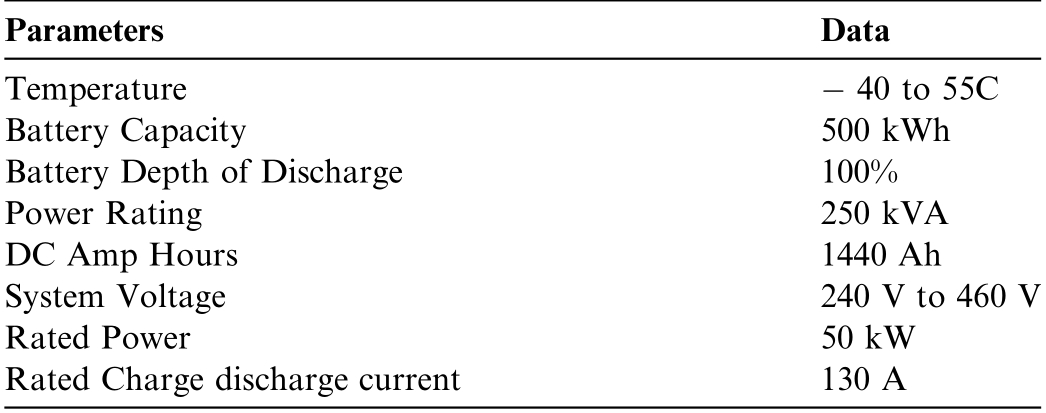
With 1404.4 kWh of energy demand, the battery energy storage capacity will be 200 kWh (each battery of 100 kWh). However, after GWO and HOMER modelled simulations, optimized results will be achieved to know the actual sizing and design configuration. Various batteries of different companies and capacities can be used to satisfy the energy requirement. For example, Megatron 50 of battery power rating between 50, 100, 150 and 200 kW - a BESS AC or DC coupled solar, wind for a microgrid can distribute the required energy of 1000 kWh per day with a backup energy storage time of 10 h.In batteries,the delivered energy cannot drop below the minimum State of Charge, which is equal to 20% of the batteries’ capacity[37]. The characteristics of the battery are given in Table 5.
Table 4 Characteristic data of a commercial PV cell in standard conditions [35].
Battery capacity is the amount of energy that a battery can store. During the time of high production of energy from wind and solar PV will be stored in the batteries and energy will be discharged during low production of power. Battery capacity required of 48 V, 200 Ah is equal to 9.8 kWh or around 9600 Watts (9.6 kW). Battery Dept of Discharge (DoD), is the percentage of the total battery capacity that can be discharged without damaging the battery. The higher dept of discharge allows more usable energy form the battery but it certainly reduces the lifespan of the battery. Therefore, one must select the battery depth of discharge with appropriate levels. Battery efficiency is the total percentage of the energy that it can be stored in the battery compared to the total energy discharged. The batteries with higher battery efficiencies are mostly required for the harsh environment to suffice the autonomy.Autonomy is the number of days that battery system provides the energy demand of the load without being recharged by PV and wind turbine. Therefore, longer autonomy with larger battery capacities is selected.System voltage is important parameter for battery sizing. Voltage of the battery should be compatible with the PV or wind system to ensure effective and efficient charging and discharging of the battery. Temperature can also affect the performance of the battery.
Both 60 kW solar PV and 300 kW wind turbines, are backed by 200 kW batteries energy storages system(BEES), integrated with Smart Energy Management via microgrid. BESS collects the energy from solar PV and wind turbine network. It stores the energy using battery storage technology. The batteries discharge to release the energy when required during peak demand load, power outages and grid balancing. BESS requires bidirectional converter. The DC power from the sources is converted to AC line voltage for the demand side load with the help of converter of approx.800 kW size.It allows the power to flow both ways to charge and discharge the battery.
2.4 Estimate costs of RE’s procurement, installation and shipment
Extracting the energy requirement of 1404.4 kWh per day (162.1 kW), for Turkish Antarctic Research Station’s expected load profile and on the basis of RE sizing anddesign; the installation cost of renewable energy (PV solar and wind turbine based microgrid using battery energy storage system) are evaluated. Table 6 shows the future expected cost estimates and system wide details breakdown. However, after GWO and HOMER modelled simulations, optimized results to be achieved. The results will yield the actual optimized power generation configuration,sizing and design of solar PV, wind turbines, ba ttery energy storage systems and converter.The assumed system components include wind turbines (300 kW), battery energy storage system (200 kW), solar PV (60 kW), and converter (800 kW).
Table 5 Characteristics data of Battery.
The use of conventional diesel fuel to achieve energy demand of 1404.1 kWh per day (162.1 kW of Power demand), will require 117 gallons of diesel fuel per day.Diesel fuel costs at present time is 42 US $ /gallon. One gallon of diesel fuel generates 12 kWh in the harsh weather region of Antarctica. It also contributes to carbon emissions and oil spill overs that contaminates the coastal area.There fore, annually, the consumers will require 123,760 gallons of diesel fuel to meet the energy demand of 505,476 kWh for 50–55 personnels at Turkish Antarctica Research Station (TARS). Also, it is extremely hard to transport the fuel to Antarctica, giving rise to the cost of electricity/energy generated per kWh [38]. The procurement, installation and shipment cost vary depending upon the wind turbine, solar PVs and batteries energy stora ge system’s technical data and quality. The estimated costs are given in above Table 7.
Net Present Cost:
The Net Present Cost is the present value of installation and operating the hybrid system over the lifetime expansion generation, also call ed life cycle cost. The optimized cost via Random Forest Regression embedded with Grey Wolf Optimization.

In the above equation, Cann totis the total annualized cost ($/year) that includes capital, annual operating and maintenance, replacement and fuel cost. CRF is capital recovery factor that is used to calculate the present value of a series of equal annual cash flows, i is the real interest rate (%) and N is the total project analysis or lifetime in number of years.
Levelized Cost of Energy:
The Levelized Cost of Energy is the average cost per kilo Watt hour (US $/kWh) of useful energy produced by hybrid PV,wind turbine and battery energy storage system. It is calculated by:

Cann,tot is the total annualized cost ($/year), Eprim,AC is the AC primary load served to the consumption point/demand (in kWh/year) and Eprim, DC is the DC primary load served by Renewable Energy sources (in kWh/year).
Renewable Fracti on:
In a hybrid wind-solar PV energy system, the Renewable Fraction shows the contribution of different sources.SolarPVfraction,fpv,windfraction, f wt,and BESS availabilityfraction,fbessare given by:
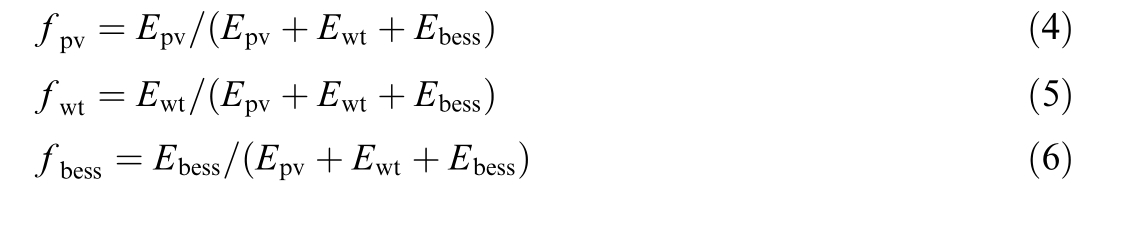
Table 6 Cost Estimates and System-W ide Details Breakdown.
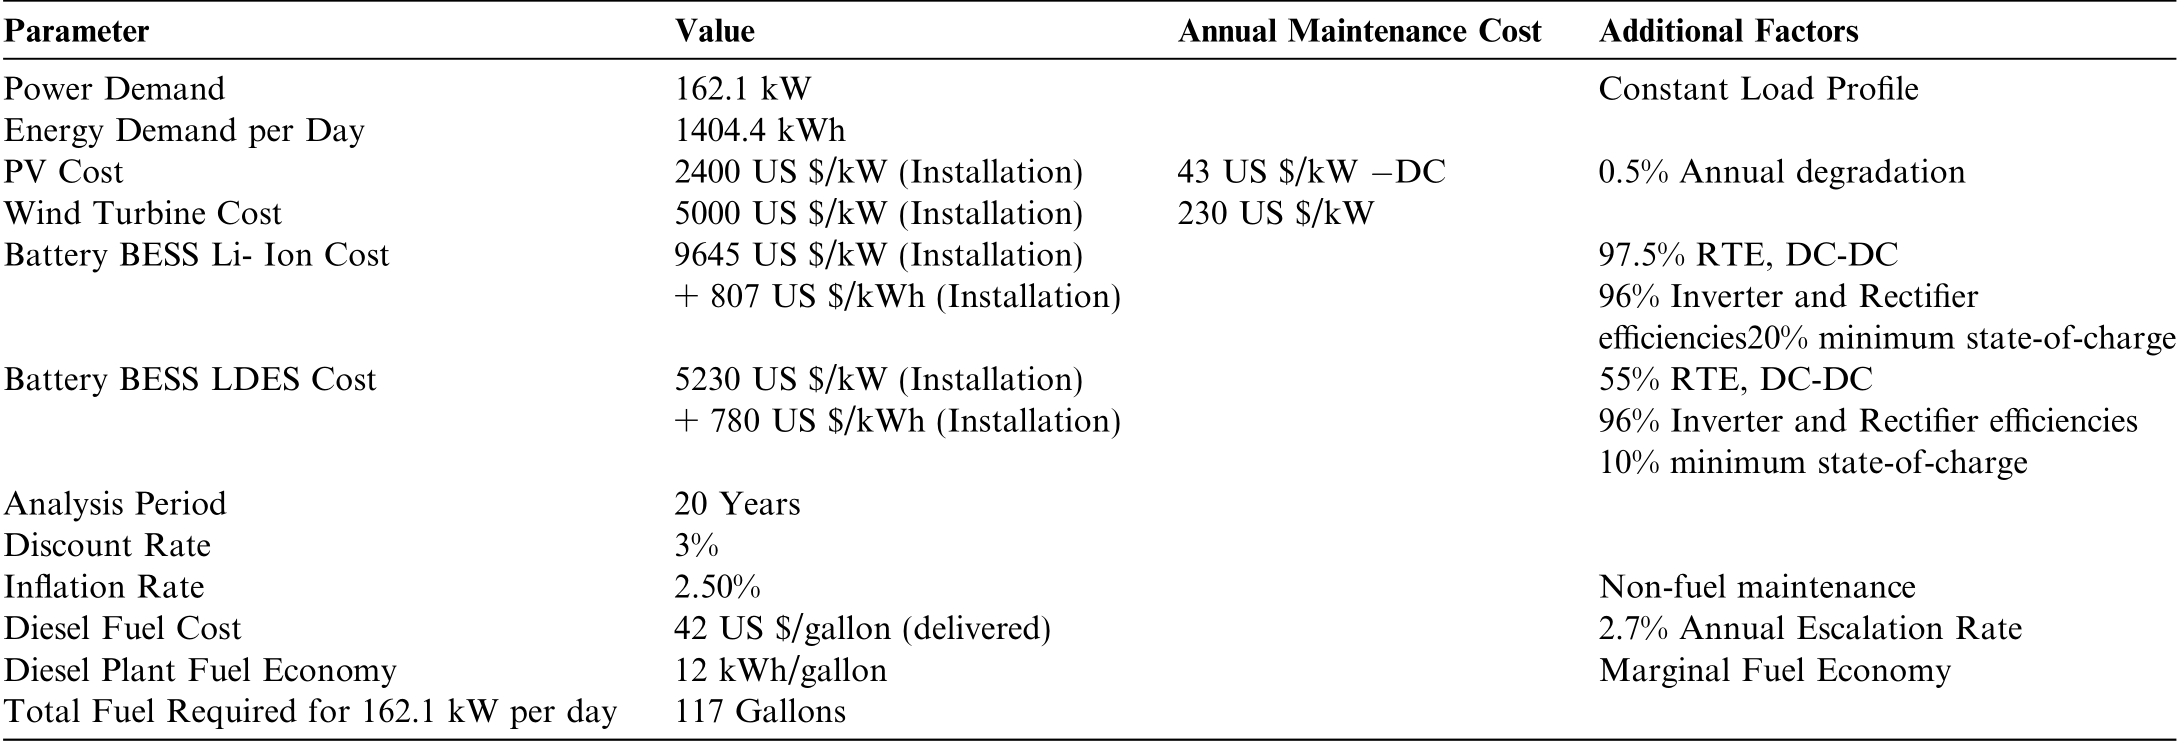
Table 7 Cost Estimates and System-W ide Details Breakdown.

Epv E wt and Ebessshow the electricity generated from PV, wind source and battery energy storage system.
To further enhance the reliability and efficiency of the proposed system, advanced computational tools are utilized. The following section provides an overview of the machine learning and optimization methods employed in this study.
2.5 Overview on Random Forest Regression-Grey Wolf Optimization
In this study, Random Forest Regression (RFR) is employed for predictive modeling due to its robustness in handling non-linear and complex weather datasets.RFR is particularly effective in environments like Antarctica, where weather variables such as solar irradiance and wind speed can fluctuate unpredictably. Its ensemblebased approach provides high accuracy and reduces overfitting, making it well-suited for capturing the uncertainties in renewable energy generation.
Meanwhile, Grey Wolf Optimization (GWO) is adopted as the optimization strategy for renewable energy system planning. Inspired by the leadership hierarchy and hunting behavior of grey wolves in nature, GWO is recognized for its strong global search capabilities and its ability to maintain a good balance between exploration (searching new areas) and exploitation (refining known good areas). This makes GWO highly effective in determining the optimal sizing and placement of renewable energy system components, especially in harsh and remote environments like Antarctica.
The integration of RFR and GWO allows for a datadriven, intelligent approach to designing a hybrid renewable energy system. First, RFR is used to develop predictive models for solar irradiance and wind speed based on historical weather data collected from Horseshoe Island. These predictions serve as input for the energy generation model.Then, GWO is applied to optimize the syst em configuration by minimizing power mismatch and losses, while also considering system efficiency and CO2 emission reductions.
This combined approach enables more accurate forecasting of renewable energy output and ensures that the system is both technically and econo mically efficient under the environmental constraints of the Turkish Antarctic Research Station.
2.6 Random Forest Regression-Grey Wolf Optimization for RE generation
This study proposes a multi-objective Grey Wolf Optimization (GWO) algorithm for optimal sizing and placement of solar PV, wind turbines, and battery energy storage systems (BESS). The aim is to minimize total system power losses, distributed generation (DG) cost, Levelized Cost of Energy, Net Present Cost, and Life Cycle Cost, including sensitivity analysis. Thus, this study will be simulating the optimal renewable energy generation based on microgrid under harsh environment using Random Forest Regression embedded GWO.
In this study, state-of-the-art RFR embedded GWO algorithm is proposed. This metaheuristic technique is applied to optimize solar PV, wind turbine, and battery st orage systems, as illustrated in Fig. 6. Meta heuristic techniques are bio inspired optimization techniques for single or multi objective complex non-linear problems [39]. RFR embedded GWO promises optimized generation planning for multiple objective functions as compared to other metaheuristic techniques b ased on fixed load and renewable energy [40]. There are several techniques and models of RFR for uncertain weather prediction. The results from RFR are then embedded GWO in various scenarios for RE power plants. Weather data for solar and wind energy collected from the TARS MET station is used to predict power generation through Monte Carlo simulations. This supports the development of an optimized energy management system for the microgrid. RFR on GWO gives the prediction of RE generation, sizing, levelized cost and load scheduling.It prioritizes the optimized states of the generation RE plants i-e PV,wind turbine and batteries effectively during the optimization connected to microgrid.
The research focuses on the development of RFR for solar PV and WT generation uncertainty based on collected data of solar radiation and wind speed in harsh environment. To formulate the predicted values, based on backward forward sweep load flow explains the effect of PV and WT generation uncertainty. To propose PVWTDG microgrid system that has optimal planning in term of allocation and sizing with high efficiency and low CO2 emissions using RFR embedded GWO optimization.Evaluation and comparison provide to find the best system with appropriate bus location and size of the PV and WT.
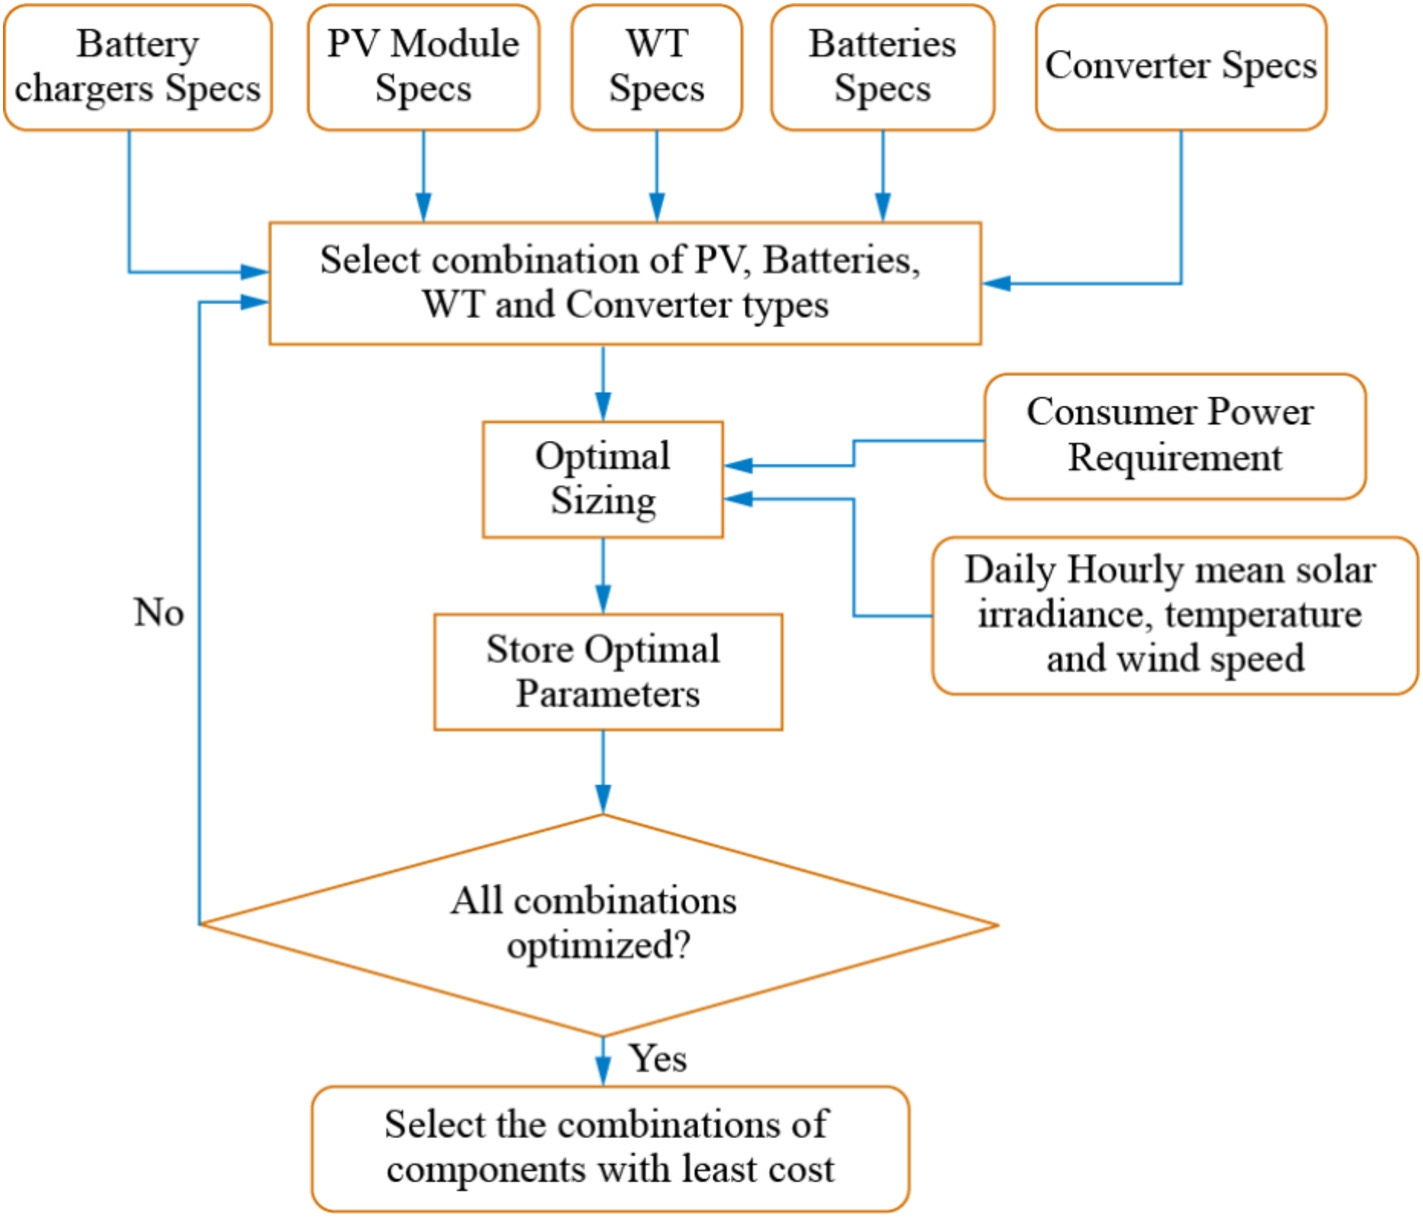
Fig. 6. Flowchart of Proposed Optimization Methodology.
2.7 Random Forest Regression for weather prediction of solar PV and wind turbine
In Random Forest Regression (RFR) for weather prediction, the TARS weather station collects the weather data i.e. solar irradiance, wind speed, temperature, humidity etc. Data collection of the power generation for wind turbines and solar PV is carried out. Further, data preprocessing performs handling of missing data entries, normalizes the data as per its scale and then adopts feature engineering to combine variables and create time-related features. It selects the features for the model, such as wind speed, solar irradiance, temperature etc; and eliminates other features. Data is split into training and testing sets.RFR model is proposed to define the number of trees in the forest (n-estimator), maximum depth of the trees, configure the hyperparameters. The model uses the training data to train itself and validates the data by cross validation techniques to avoid overfitting. The next phase is model evaluation and tuning; model evaluates on the test data like Root Mean Square Error, R2 score and Mean Absolute Error. And then the model fine tunes the hyper parameters e-g random search or grid search to improve the model efficiency and performance. The trained model predicts the output parameters of solar PV and wind turbine such as solar irradiance,wind speed and power generation. The RFR is to deploy for real time predictions.Continuously monitor and update the RFR model on the basis of future data availability[41,42]. The flow chart of RFR is shown in Fig. 7.
With the sizing and layout of the system components optimized, the final step is to evaluate how effectively power flows through the proposed micro grid. This is achieved through an optimal power flow analysis, which simulates real-world operational conditions.
2.8 Grey Wolf Optimization for optimal sizing and placement of power plant
GWO was chosen for this future research due to its effectiveness in handling optimization problems characterized by nonlinear, multidimensional, and constrained parameters, which are common in renewable energy system design. GWO is inspired by the natural leadership hierarchy and hunting behavior of grey wolves, providing a balance between exploration (globa l search) and exploitation (local search) of the solution space. This balance is crucial for achieving optimal siting and sizing of renewable energy resources under Antarctica’s unique and challenging environmental conditions.
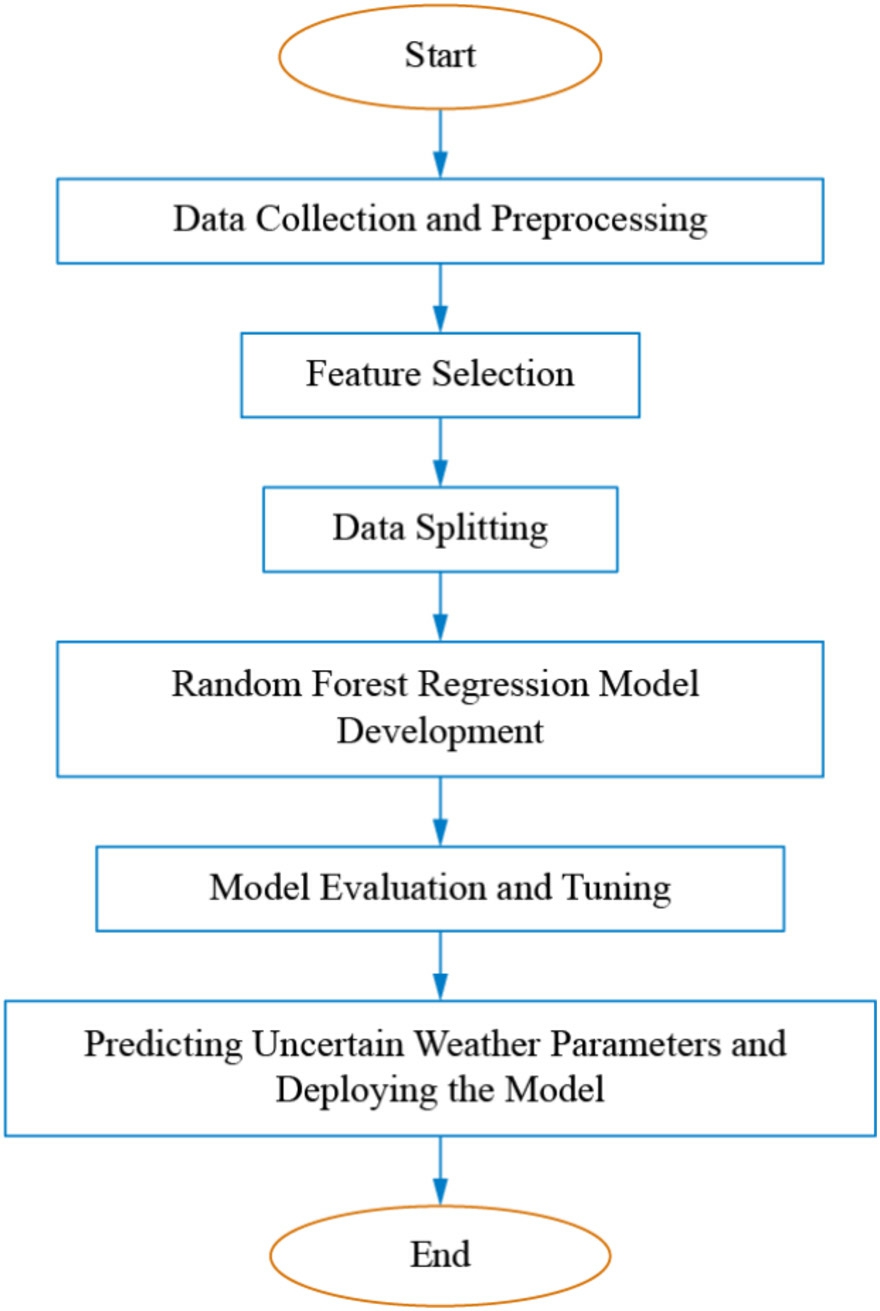
Fig. 7. Random Forest Regression flow chart for weather prediction of solar PV and wind turbines.
The GWO is proposed for optimal sizing and placement of the solar PV and WTs with batteries energy storage system for minimizing total system power losses, DG cost,levelized cost of energy($/kWh),net present value,and life cycle cost with sensitivity analysis. The process flowchar t of the GWO is shown in Fig. 8. In this algorithm, A and C represent coefficient vectors that influence the search process. The optimization process is guided by three ‘‘leading wolves” (α, β, and δ), which are responsible for detecting the optimal solution (analogous to prey in nature) and directing the search. The remaining search agents (other‘‘wolves”) adjust their positions based on the guidance of these leaders, gradually converging toward the best solution. Based on the GWO algorithm, the optimization framework is proposed to minimize the active power loss(APL) index under equality and inequality constraints.
2.9 Optimal power flow in TARS microgrid
After the optimal renewable energy generation planning for PV, wind turbine, and battery storage power plants,they will need to be integrated into the microgrid. A microgrid is a grou p of interconnected loads and distributed energy resources that acts as a single controllable entity with respect to the grid as shown in Fig. 9. It can connect and disconnect from the grid to operate in grid-connected or island mode. Microgrids can improve customer reliability and resilience to grid disturbances. A microgrid is a local energy system which incorporates three key components; generation, storage and demand; all within a bounded and controlled network. It may or may not be connected to the grid. Different end-users have a range of requirements from their energy supply systems. Microgrid as comprising Low-Voltage (LV)distribution systems with distributed energy resources (DERs) (wind turbines,photovoltaics (PV), etc.), storage devices (batteries, flywheels) energy storage system and flexible loads.
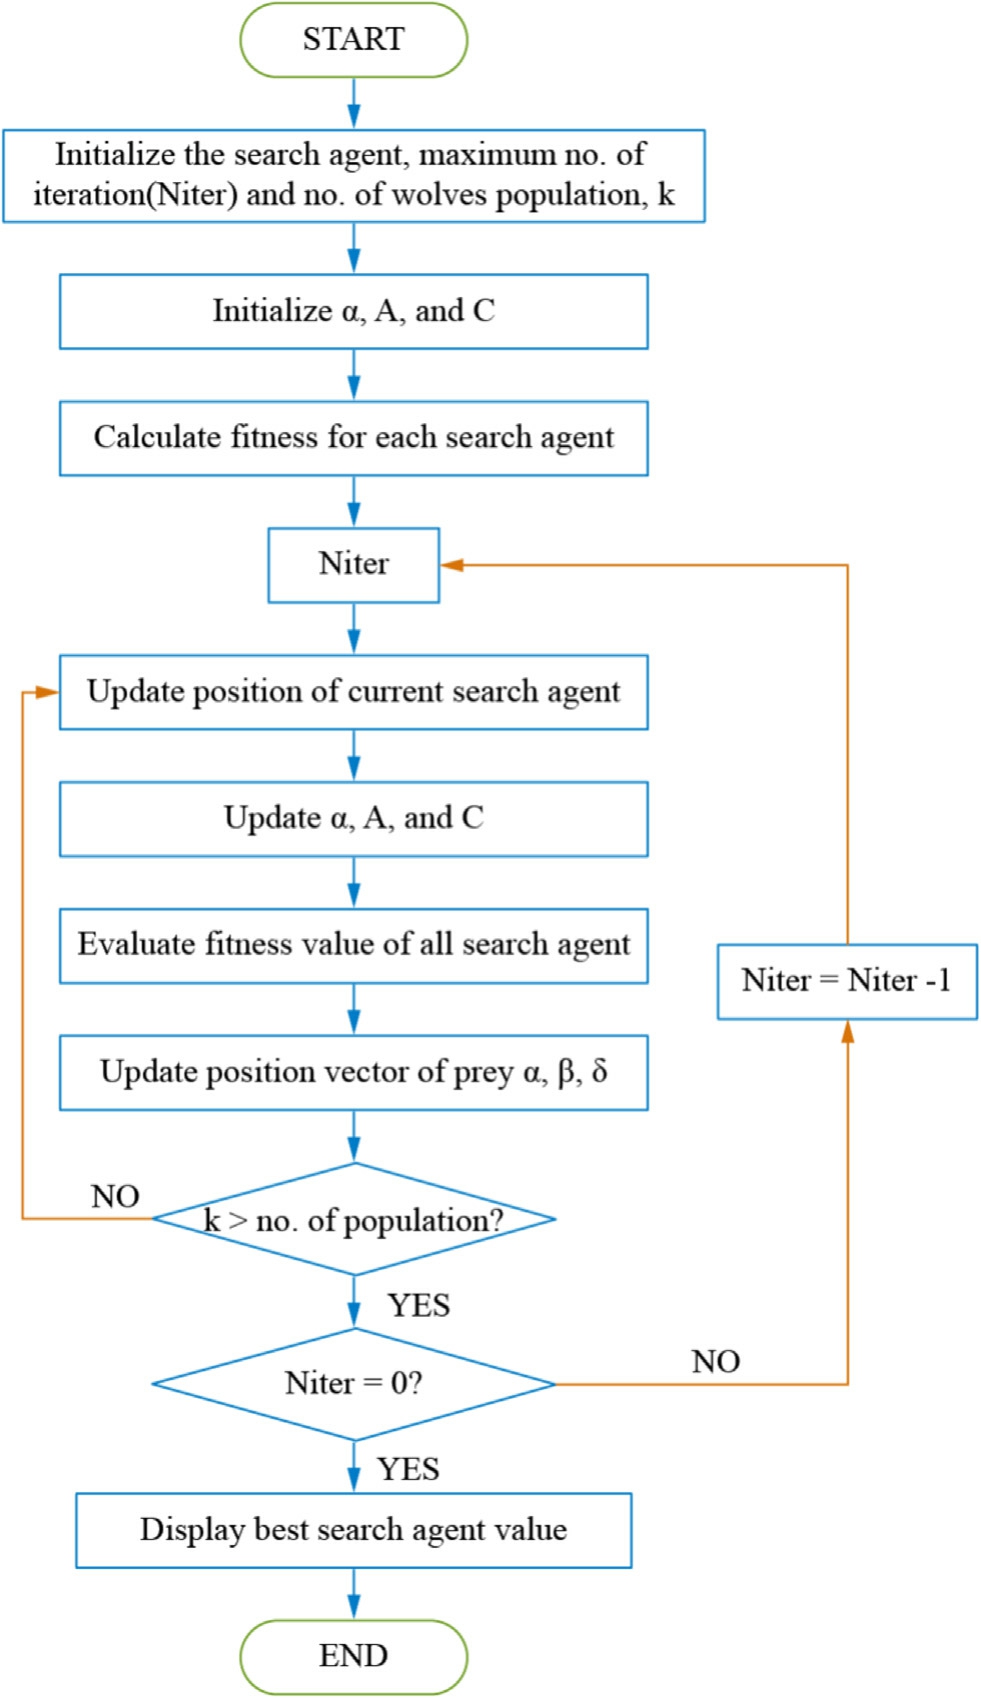
Fig. 8. Process Flow of GWO.
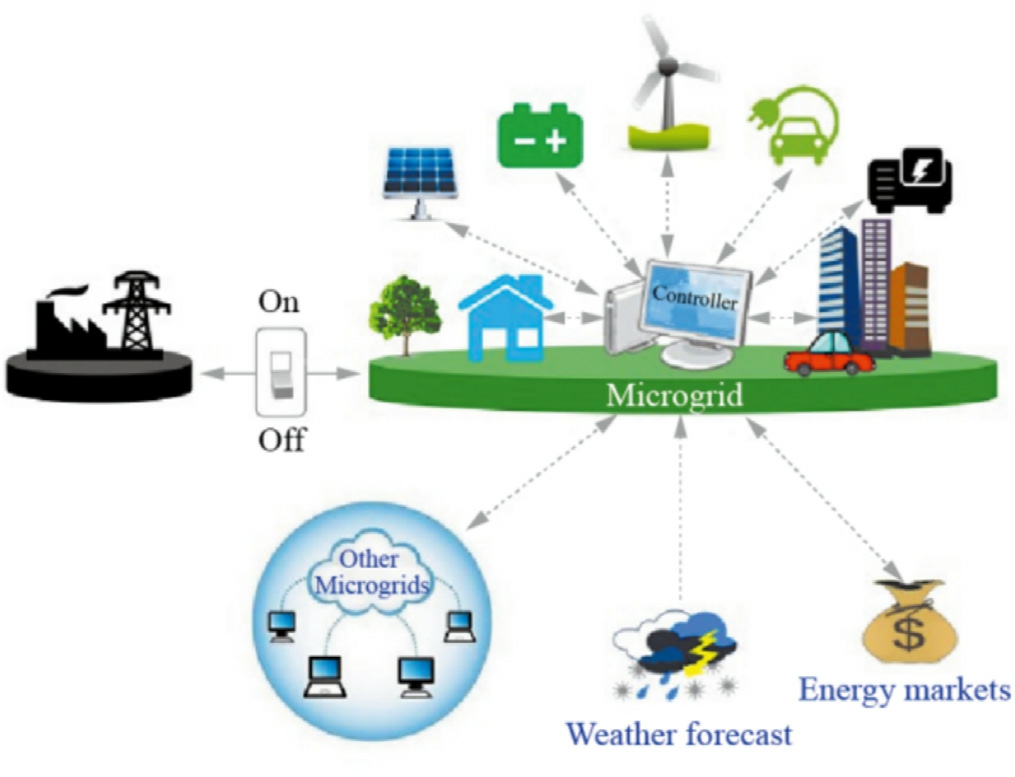
Fig. 9. Microgrid Energy Management System.
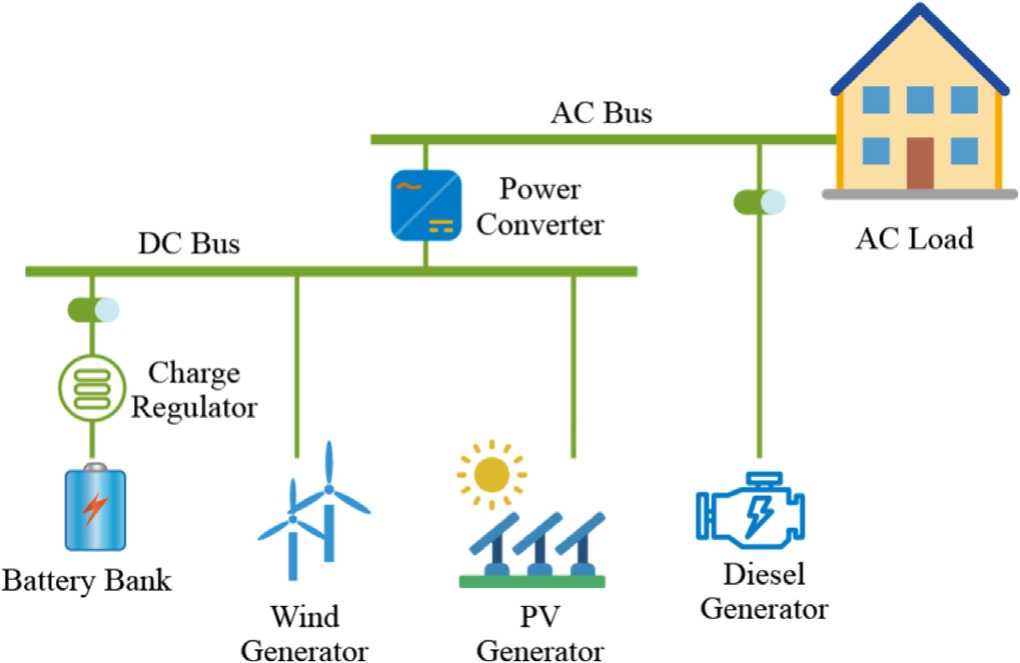
Fig. 10. Proposed DC and AC Bus System for TARS.
The proposed DC and AC bus system for TARS i s shown in Fig. 1 0. The system converting the DC voltages produced by wind turbine, solar PV and BESS to AC voltages (to provide to AC loads). Then those AC voltages are connected on t he AC Bus power lines via converter.
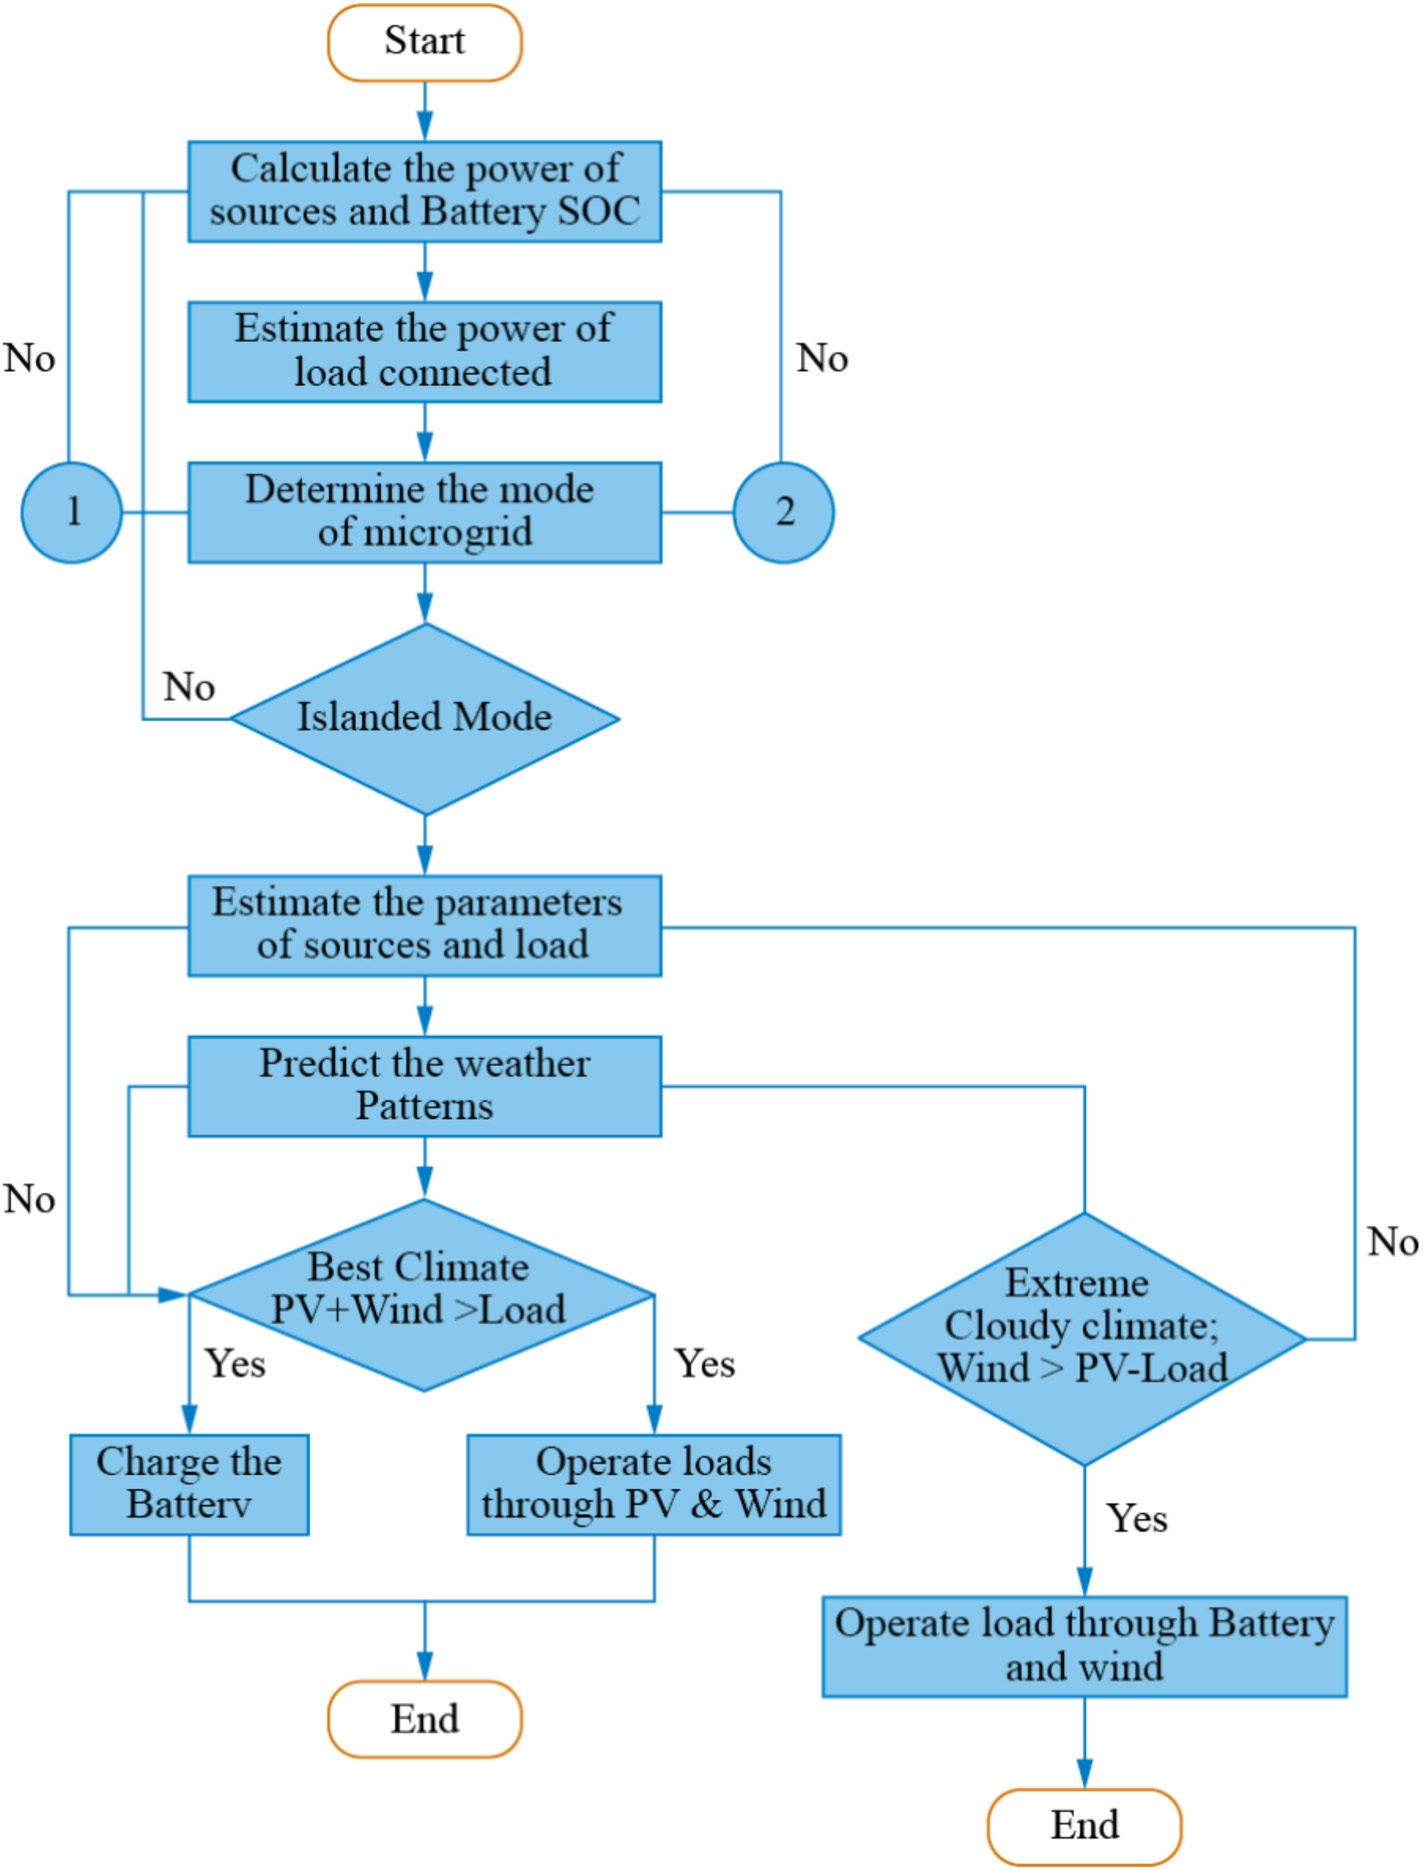
Fig. 11. Flowchart for Microgrid Operation and Control.
Renewable energy sources are of variable nature depending upon weather conditions. However, now they can complement each other and will improve the operation and reliability of the hybrid energy system. It extends the energy sustainability to the maximum possible limit with battery energy storage devices. The real time energy management problem with solar PV, wind turbine and battery energy storage will become a multi objective optimization problem. In power flow problem, certain controlled variables are adjusted to minimize an objective function while satisfying the physical and operating limits [43]. Monte Carlo Simulation is used for power flow analysis, predicting weather patterns of solar irradiance and wind speed,offering smar t energy management system. The hybrid PV and wind turbines backed by battery storages based on microgrid, when are combined with the meteorological data, varies the generation capacity for the fixed load based on wind speed and solar irradiance. Predicting the weather patterns will help the microgrid to operate, control and switch to optimal generation, energy management, reliability and reducing the losses as shown in Fig. 11.
The microgrid operation and control for PV, wind turbine and battery energy storage system estimate the power of load connected. Then it determines the mode of microgrid. In islanded mode, estimates the parameters of both,renewable energy sources and loads. After that it estimates the weather patterns for wind and solar PV. If the scenario is best climate i-e (PV and wind generation>Load)then it will charge the batteries and operate the loads through solar PV and wind turbines. If the weather predicts extreme winds i-e (Wind > PV and Load) then it will operate the load through batteries and wind.
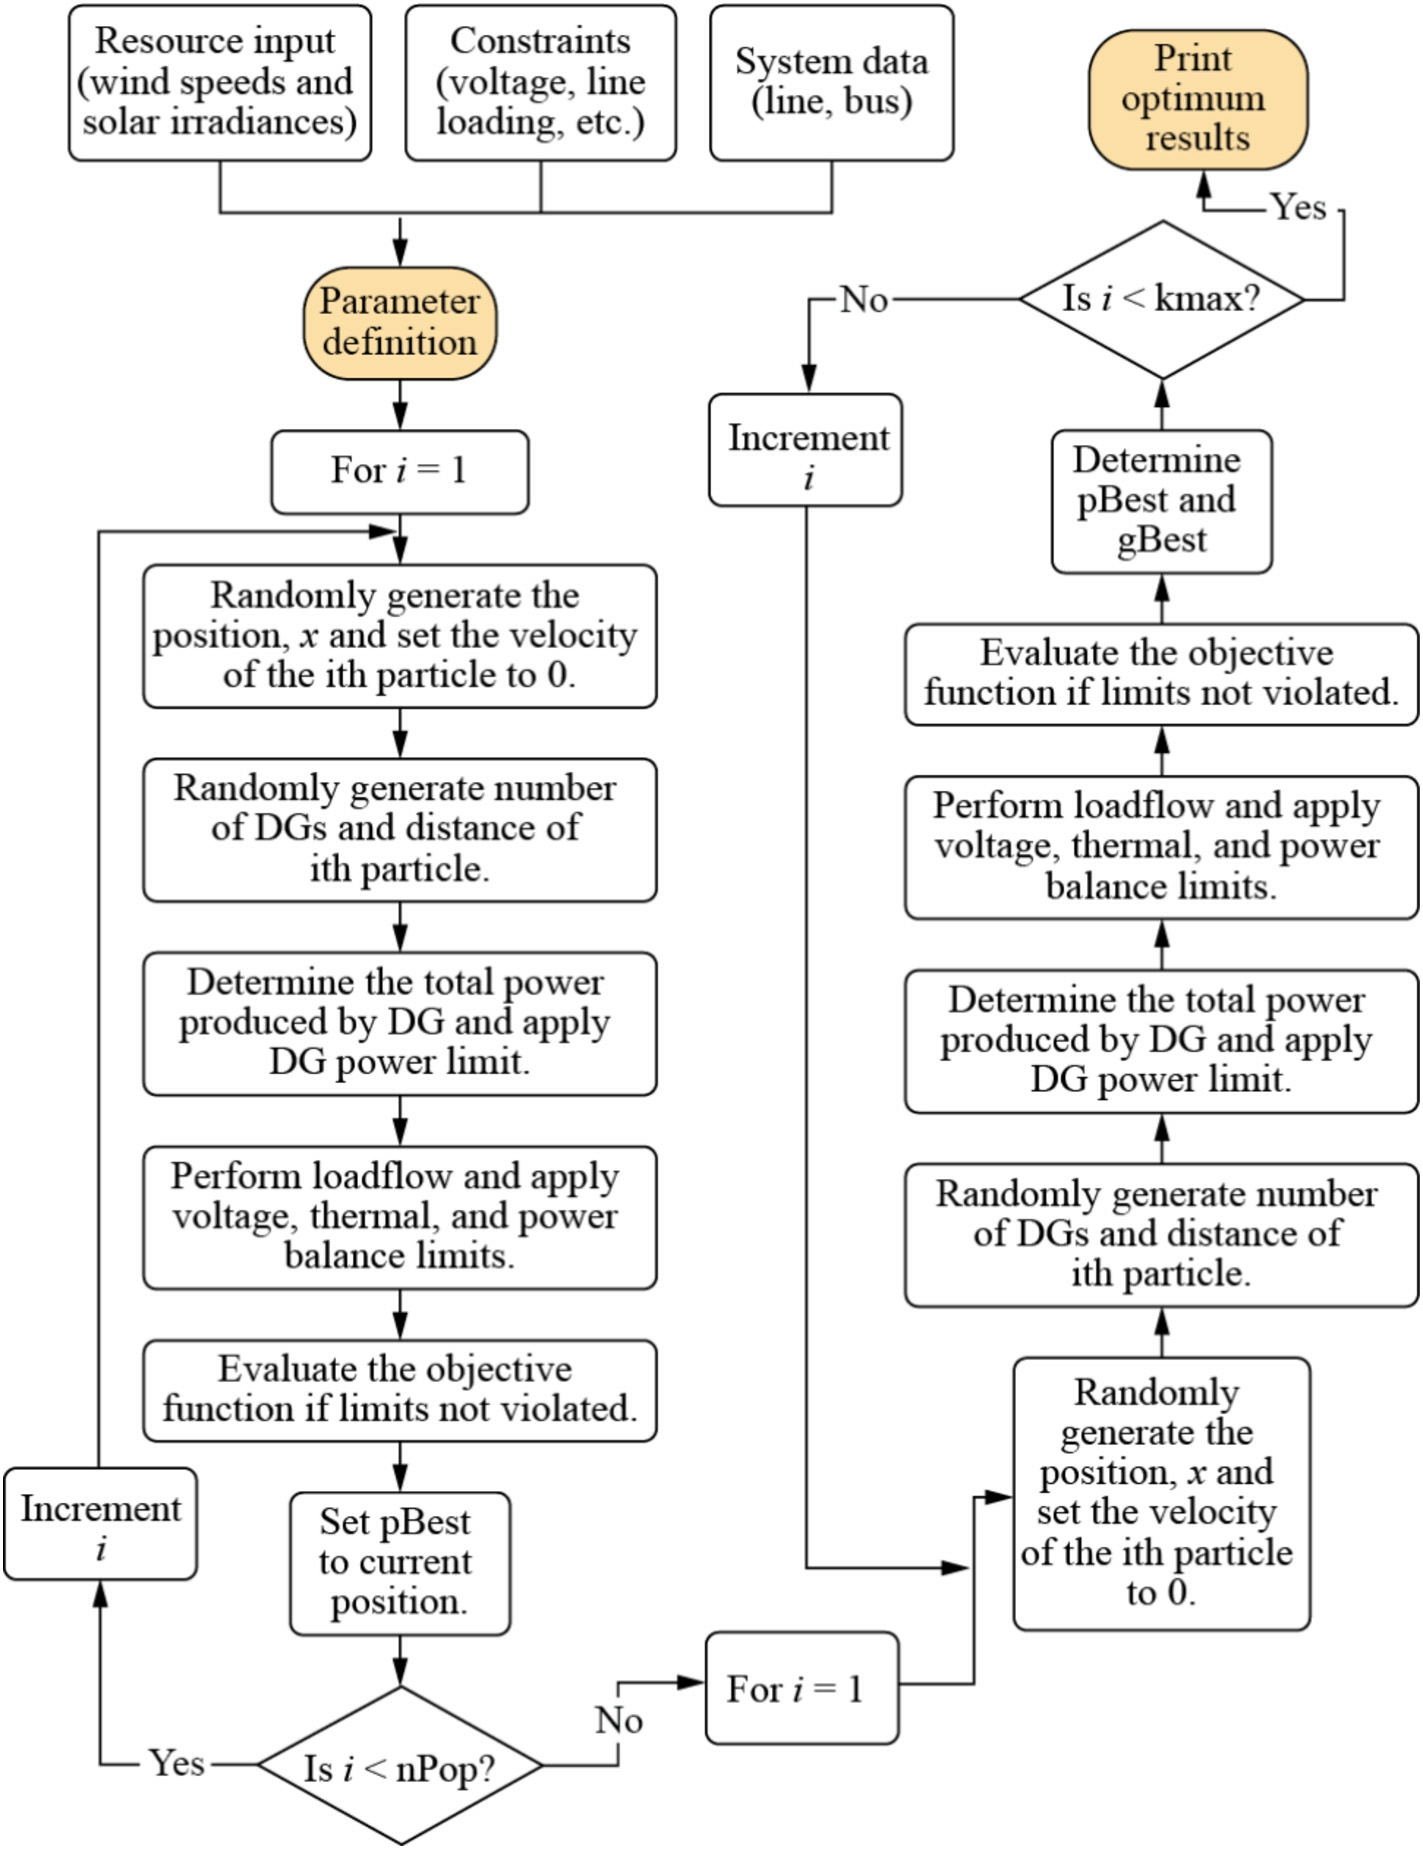
Fig. 12. Strategic Sizing for Power Line Losses [44].
Optimal power flow problem is formulated for optimal power flow to reduce the cost. It will maximize power generation from the available renewable energy resources’power generation will be maximized through optimal power flow problem formulation for optimal power flow and optimize the system for reducing the line losses. The system can be optimally functioned, for minimizing the losses along with maximizing the generation from power sources. Ther e are operational constraints related to real and reactive power balance. Security related constraints on limits of power generation, voltage magnitudes and SOC of battery. Most importantly, functional constraints of control variables on limits of reactive power, active and reactive line flows as shown in Fig. 12 [44].
3 Conc lusion
This study reviewed the current state of renewable energy (RE) power generation in Antarctica, focusing on technological advances and future work aimed at improving efficiency and reliability, particularly at the Turkish Antarctic Research Station (TARS) on Horseshoe Island.The findings reveal that while several Antarctic research stations have adopted hybrid RE systems, primarily wind and solar, many still depend on diesel generators due to environmental and logistical challenges. Extreme weather conditions, transportation constraints, and technological limitations remain key barriers to full RE integration.
The proposed future work addresses these challenges through a comprehensive methodology involving weather data collection, load estimation, system sizing and design,cost analysis, machine learning-based prediction, and system optimization. In particular, the integration of Random Forest Regression (RFR) and Grey Wolf Optimization (GWO) represents a novel approach in the Antarctic context.RFR is employed to model the complex and uncertain nature of solar irradiance and wind speed data,while GWO is used to determine optimal system configurations by minimizing energy losses and operational costs.
The novelty of this approach lies in the combined use of RFR and GWO for microgrid planning under harsh environmental conditions. Unlike conventional simulation tools such as HOMER and WASP-IV, which rely on scenario-based or deterministic inputs, the RFR–GWO framework offers a flexible, style="font-size: 1em; text-align: justify; text-indent: 2em; line-height: 1.8em; margin: 0.5em 0em;">The outcomes of this study offer a roadmap for the sustainable transformation of power systems in remote polar regions. By addressing energy uncertainty and optimizing RE system design, the research supports broader goals of environmental protection, operational resilience, and alignment with global carbon reduction targe ts. Future work will involve implementing the proposed framework at TARS, validating performance through simulation and field testing, and refining the model to accommodate additional variables and constraints.
CRediT authorship contribution statement
Muhammad Fahad Shinwari: Writing – original draft.Norhafidzah Mohd Saad: Methodology, Formal analysis.Erhan Arslan: Resources, Data curation. Burcu Ö zsoy:Project administration. Muhamad Zahim Sujod: Writing– review & editing, Conceptualization.
Declaration of competing interest
The authors declare the following financial interests/personal relationships which may be considered as potential competing interests: Muhamad Zahim Sujod reports financial support was provided by Sultan Mizan Antarctic Research Foundation. If there are other authors, they declare that they have no known competing financial interests or personal relationships that could have appeared to influence the work reported in this paper.
Acknowledgments
The project is funded by Universiti Malaysia Pahang Al-Sultan Abdullah (UMPSA) and Sultan Mizan Antarctic Research Foundation (Yayasan Penyelidikan Antartika Sultan Mizan-YPSAM) under grant number UIC240801. The project is also supported by TÜ BITAK-UPAG grant number 122N649. The authors would also like to thank the Faculty of Electrical & Electronics Engineering Technology, UMPSA for providing facilities to conduct this research and financial support throughout the process. Special thanks are also extended to the TÜBITAK Polar Research Institute and the General Directorate of State Meteorological Service for their invaluable support in providing baseline weather data that contributed significantly to this study.
References
[1]J.J. Lucci, M. Alegre, L. Vigna, Renewables in Antarctica: an assessment of progress to decarbonize the energy matrix of research facilities, Antarct. Sci. 34 (2022) 374–388, https://doi.org/10.1017/S095410202200030X.
[2]The Council of Managers of National Antarctic Programs(COMNAP) n.d.
[3] A.A. Khan, A.F. Minai, R.K. Pachauri, H. Malik, Optimal sizing,control, and management strategies for hybrid renewable energy systems: a comprehensive review, Energ. (Basel) 2022 (2022) 15,https://doi.org/10.3390/en15176249.
[4]A.Q. Al-Shetwi, M.Z. Sujod, Modeling and dynamics study of large scale PV system connected Malaysian grid under different fault conditions, in: International Conference on Advances in Electrical, Electronic and Systems Engineering (ICAEES), 2016,pp. 488–494, https://doi.org/10.1109/ICAEES.2016.7888094.
[5]A.Q. Al-Shetwi, M.Z. Sujod, Harmonic distortion and voltage imbalance study of photovoltaic power plant connected to the Malaysian grid, J. Telecommun. Electron. Comput. Eng. 10 (1–2)(2018) 1–6.
[7]Langley Research Center of NASA Surface Meteorolo gy and Solar Energy Dataset n.d.https://power.larc.nasa.gov/ (accessed August 15, 2024).
[8]Y.B.O. Sinan, Sea ice examination for ice class ships visiting horseshoe Island, Antarctica, using MODIS in 2000–2022, Trans.Maritime Sci. (2024).
[9]M. De Witt, C. Chung, J. Lee, Mapping renewable energy among antarctic research stations,Sustainability(Switzerland)2024(2024)16, https://doi.org/10.3390/su16010426.
[10]L. Vigna, Renewable Energy in Antarctic Stations [Internet].Tableau Public; [cited 2025 Aug 5]. (2024). Available from:https://public.tableau.com/app/profile/leandro.vigna/viz/RenewableEnergyinAntarcticStations/TrackerPublic.
[11]M. Henryson, SM. Renewable Power for the Swedish Antarctic Station WASA. 2004.
[12]J.R. Olivier, T.M. Harms, D.J. Esterhuyse, Technical and economic evaluation of the utilization of solar energy at South Africa’s SANAE IV base in Antarctica, Renew. Energy 33 (2008)1073–1084, https://doi.org/10.1016/j.renene.2007.05.044.
[13]H.W. Teetz, T.M. Harms, T.W. von Backstro¨m, Assessment of the wind power potential at SANAE IV base, Antarctica: a technical and economic feasibility study, Renew. Energy 28 (2003) 2037–2061, https://doi.org/10.1016/S0960-1481(03)00076-4.
[14]J. Wang, Y. Dou, G. Zuo, B. Fan, Y. Xing, Improving proton exchange membrane fuel cell operational reliability through cabinbased fuzzy control in coastal standalone observation systems in Antarctica, J Mar Sci Eng. 13 (1) (2025) 112, https://doi.org/10.3390/jmse13010112.
[15]A. Guichard, BC, LD, Analysis of the Potential for Wind and Solar Energy Systems in Antarctica. 1997.
[16]M.F.N.A. Shinwari, HH, Optimization model using WASP-IV for Pakistan’s power plants generatio n expansion plan,IOSR J.Electr.Electron. Eng. 3 (2012) 39–49.
[17]J. Wang, Y. Dou, G. Zuo, M. Lan, X. Chang, B. Yang, et al.,Application and effect analysis of renewable energy in a small standalone automatic observation system deployed in the polar regions, AIP Adv. 2022 (2022) 12, https://doi.org/10.1063/5.0128256.
[18]Sami Kahla YSMSMB, Maximum Power Point Tracking of Wind Energy Conversion System Using Multi-objective grey wolf optimization of Fuzzy-Sliding Mode Controller, International Journal of Renewable Energy Research 2017. https://doi.org/10.20508/ijrer.v7i2.6125.g7073.
[19]G. Narasimhan, A. Victor, Grey wolf optimized stacked ensemble machine learning based model for enhanced efficiency and reliability of predicting early heart disease, Automatika 65 (2024)749–762, https://doi.org/10.1080/00051144.2024.2317098.
[20]L. Zhang, Y. Dou, Study of wind-solar complementary power system in zhongshan station of antarctic. IOP Conf Ser Mater Sci Eng,vol.631,Institute of Physics Publishing,2019.https://doi.org/10.1088/1757-899X/631/4/042016.
[21]M.Z. Sujod, I. Erlich, Harmonics and common mode voltage in a DFIG with two-level and three-level NPC converter using standard PWM techniques, Proc. IECON Ind. Electron. Conf. 2013 (2013)1650–1655, https://doi.org/10.1109/IECON.2013.6699380.
[22]A.Q. Al-Shetwi, M.Z. Sujod, Modeling and simulation of photovoltaic module with enhanced perturb and observe MPPT algorithm using MATLAB/Simulink, ARPN J. Eng. Appl. Sci. 11(20) (2016) 12033–12038.
[23]C. Boccaletti, P. Di Felice, E. Santini, Integration of renewable power systems in an Antarctic research station, Renew. Energy 62(2014) 582–591, https://doi.org/10.1016/j.renene.2013.08.021.
[24]T. Tin, B.K. Sovacool, D. Blake, P. Magill, S. El Naggar, S.Lidstrom, et al., Energy efficiency and renewable energy under extreme conditions: case studies from Antarctica, Renew. Energy 35 (2010) 1715–1723, https://doi.org/10.1016/j.renene.2009.10.020.
[25]G. Varetto, Turkey plans its own Antarctic station [Internet]. 2021[cited 2025 Aug 5]. 2025, Available from: https://www.waponline.it/turkey-plans-its-own-antarctic-station/.
[26]T.M. De Christo, J.F. Fardin, D.S.L. Simonetti, L.F. Encarnac¸a˜o,C.E. De Alvarez, Design and analysis of hybrid energy systems:the Brazilian Antarctic Station case,Renew.Energy 88(2016)236–246,https://doi.org/10.1016/j.renene.2015.11.014.
[27]E. Koutroulis, D. Kolokotsa, A. Potirakis, K. Kalaitzakis,Methodology for optimal sizing of stand-alon e photovoltaic/wind-generator systems using genetic algorithms, Sol. Energy 80(2006) 1072–1088, https://doi.org/10.1016/j.solener.2005.11.002.
[28]R. Luna-Rubio, M. Trejo-Perea, D. Vargas-Vázquez, G.J. Rı´os-Moreno, Optimal sizing of renewable hybrids energy systems: a review of methodologies,Sol.Energy 86(2012)1077–1088,https://doi.org/10.1016/j.solener.2011.10.016.
[29]N.M. Saad, M.Z. Sujod, M.F. Abas, M.H. Sulaiman, M. Rashid,Optimal placement and sizing of distributed generation based on MVMO-SH, in: 5th IET International Conference on Clean Energy and Technology. Institution of Engineering and Technology, 2018. p. 24 (6 pp.). https://doi.org/10.1049/cp.2018.1317.
[30]N.M. Saad, M.Z. Sujod, M.I.M. Ridzuan, M.F. Abas,Optimization for distributed generation planning in radial distribution network using MVMO-SH, in: 2019 IEEE 10th Control and System Graduate Research Colloquium (ICSGRC),IEEE, 2019. pp. 115–120. https://doi.org/10.1109/ICSGRC.2019.8837082.
[31]R. Pegado, Z. N˜ aupari, Y. Molina, C. Castillo, Radial distribution network reconfiguration for power losses reduction based on improved selective BPSO, Electr. Pow. Syst. Res. 169 (2019) 206–213, https://doi.org/10.1016/j.epsr.2018.12.030.
[32]M. Aun, K. Lakkala, R. Sanchez, E. Asmi, F. Nollas, O.Meinander, et al., Solar UV radiation measurements in Marambio, Antarctica, during years 2017-2019, Atmos. Chem.Phys. 20 (2020) 6037–6054, https://doi.org/10.5194/acp-20-6037-2020.
[33]E. Arslan, F.A. Ku¨c¸u¨k, C¸. Bic¸er, B. Ö zsoy, Determining energy,exergy and enviroeconomic analysis of stand-alone photovoltaic panel under harsh environment condition: Antarctica Horseshoe-Island cases, Renew. Energy 226 (2024), https://doi.org/10.1016/j.renene.2024.120440 120440.
[34]Chris Connor, Case Study NPS 100C-24 Arctic (2 units)Deadhorse, AK. Northern Power Systems (2024).
[35]P.V. Solar, panel Datasheet, (2025). SunGoldPower SG500WM.https://sungoldpower.com/products/500w-mono-black-perc-solarpanel.
[36]T. Dragicˇevic´, H. Pandzˇic´, D. Sˇkrlec, I. Kuzle, J.M. Guerrero, D.S.Kirschen, Capacity optimization of renewable energy sources and battery storage in an autonomous telecommunication facility,IEEE Trans. Sustain. Energy 5 (2014) 1367–1378, https://doi.org/10.1109/TSTE.2014.2316480.
[37]L. Al-Ghussain, R. Samu, O. Taylan, M. Fahrioglu, Sizing renewable energy systems with energy storage systems in microgrids for maximum cost-efficient utilization of renewable energy resources, Sustain. Cities Soc. 2020 (2020) 55, https://doi.org/10.1016/j.scs.2020.102059.
[38]N. Calder-Steele, PCAS 15 (2013) Critical Literature Review(ANTA602) Electricity in Isolation: the progress of power generation in Antarctica. n.d.
[39]A. Jafar-Nowdeh, M. Babanezhad, S. Arabi-Nowdeh, A.Naderipour, H. Kamyab, Z. Abdul-Malek, et al., Meta-heuristic matrix moth–flame algorithm for optimal reconfigu ration of distribution networks and placement of solar and wind renewable sources considering reliability,Environ.Technol.Innov.20(2020),https://doi.org/10.1016/j.eti.2020.101118 101118.
[40]J. Radosavljevic, N. Arsic, M. Milovanovic, A. Ktena, Optimal placement and sizing of renewable distributed generation using hybrid metaheuristic algorithm, J. Mod Power Syst. Clean Energy(2020) 499–510. 10.35833/MPCE.2019.000259.
[41]B. Chauhan, R. Tabassum, S. Tomar, A. Pal, Analysis for the prediction of solar and wind generatio n in India using ARIMA,linear regression and random forest algorithms, Wind Eng. 47(2023) 251–265, https://doi.org/10.1177/0309524X221126742.
[42]B. Babar, L.T. Luppino, T. Bostro¨m, S.N. Anfinsen, Random forest regression for improved mapping of solar irradiance at high latitudes, Sol. Energy 198 (2020) 81–92, https://doi.org/10.1016/j.solener.2020.01.034.
[43]M.J. Laly, E.P. Cheriyan, A.T. Mathew, Particle swarm optimization based optimal power flow management of power grid with renewable energy sources and storage, in: 2016 Biennial International Conference on Power and Energy Systems: Towards Sustainable Energy(PESTSE),IEEE,2016,p.1–6.https://doi.org/10.1109/PESTSE.2016.7516472.
[44]T. Wanjekeche, A.A. Ndapuka, L.N. Mukena, Strategic sizing and placement of distributed generation in radial distributed networks using multiobjective PSO, J. Energy 2023 (2023) 1–14, https://doi.org/10.1155/2023/6678491.
Received 13 February 2025;revised 6 August 2025; accepted 13 October 2025
Peer review under the responsibility of Global Energy Interconnection Gro up Co. Ltd.
* Corresponding author.
E-mail addresses: engrmuhammadfahad7@gmail.com (M.F. Shinwari), norhafidzah@umpsa.edu.my (N.M. Saad), erhan.arslan@tubitak.gov.tr(E. Arslan), burcu.ozsoy@tubitak.gov.tr (B. Özsoy), zahim@umpsa.edu.my (M.Z. Sujod).
https://doi.org/10.1016/j.gloei.2025.10.007
2096-5117/© 2025 Global Energy Interconnection Group Co. Ltd. Publishing services by Elsevier B.V. on behalf of KeAi Communications Co. Ltd.
This is an open access article under the CC BY-NC-ND license(http://creativecommons.org/licenses/by-nc-nd/4.0/).
Further Reading
[6]M. Snels, F. Colao, F. Cairo, I. Shuli, A. Scoccione, M. De Muro,M. Pitts, L. Poole, L. Di Liberto, Quasi-coincident observations of polar stratospher ic clouds by ground-based lidar and CALIOP at Concordia (Dome C, Antarctica) from 2014 to 2018, Atmos.Chem.Phys.21(3)(2021)2165–2178,https://doi.org/10.5194/acp-21-2165-2021.

Muhammad FahadShinwari received Bachelor of Science in Electronics Engineering degree at Comsat University, Pakistan, 2010, and Master of Science in Electronics Engineering (Power and Energy) degree at International Islamic University, Islamabad, Pakistan, 2014. He was working as academic staff at Numl University and UET Lahore-ICEMS from 2010 until 2016.Currently, he is working towards PhD degree at Universiti Malaysia Pahang Al-Sultan Abdullah, Pahang, Malaysia. His research interests include optimization strategize, power system management, renewable energy and energy efficiency.