
0 Intr oduction
1) Background and motivati on
The increasing penetration of distributed generation(DG) has introduced significant volatili ty and uncertainty into modern distribution networks. Conventional radial distribution structures are inadequate for accommodating such bidirectional and stochastic power flows, exacerbating issues such as voltage deviation, line congestion, and limited hosting capacity [1]. Soft open points (SOPs),enabled by flexible power electronic interfaces, have emerged as a promising solution[2]. By dynamically regulating power exchange between feeders, SOPs enhance controllability, improve network resilience, and facilitate the reliable integration of high shares of renewable energy sources.
Beyond conventional battery-based storage, the largescale integration of renewable energy increasingly relies on sector-coupling technologies such as power-to-gas(P2G) and power-to-heat [3]. These conversion technologies facilitate the interaction between electricity and other energy carriers, driving the advancement of multi-energy systems. Such systems are characterized by the coordinated operation of electricity, heat, and gas networks,enabling the shared use of flexibility resources, enhancing overall efficiency,and mitigating carbon emissions[4]. This study aims to investigate a multi-level multi-energy system based on an energy storage-integrated multi-terminal SOP.
2) Literature review
A growing body of research investigates the evolution ofdistribution systems, ranging from passive distribution system, active distribution system, to flexible distribution systems. In the early stages, distribution systems were traditionally designed as passive networks [2], characterized byunidirectional power flow from the upstream transmission grid to downstream consumers. With the increa sing integration of DG, the concept of the active distribution system emerged [1], where bidirectional power flows,power dispatch, and demand-side management became key research topics. Although active distribution systems enhance operational flexibility and DG hos ting capacity,their reliance on traditional switching devices limits inter-feeder power exchanges and coordinated optimization.
To overcome these limitations, power electronic-based SOPs have emerged as controllable substitutes for mechanical tie switches in distribution systems. SOPs offer flexible load-transfer and voltage support among feeders,gradually shaping the concept of the flexible distribution system. In distribution system, SOP is in general positioned at normally open points, which could provide several advantages, including load-transfer capability,voltage regulation, three-phase balancing, and renewable energy integration [5]. The optimal placement and sizing ofSOPs has attracted significant research interest. For instance, the optimal placement and sizing of SOPs and remote-controlled switches were developed in [6] to improve the system resilience. A two-stage multi-scenario optimization method for SOP placement and sizing was proposed in[7] to minimize power losses and active power curtailment of DGs in distribution systems. Moreover,based on a single multi-stage elastic mechanical model and particle swarm algorithm, a bi-level optimal siting and sizing method for SOPs was developed in [8] to achieve maximum resilience.
The evolution of SOPs has primarily proceeded along two pathways, namely, energy storage-integrated SOPs and multi-terminal SOPs. The energy storage-integrated SOP combines SOPs with energy storage systems to enable feeder power storage and dispatching,thereby better meeting the flexibility requirements of active distribution network operation. A two-stage distributionally robust coordinated planning model of DGs and energy storageintegrated SOPs was proposed in [9], while a multi-stage expansion planning model considering tie-line reconstruction was developed in [10]. The multi-terminal SOP structure can reduce the number of passive components and switching devices, making the SOP compact in structure,low in cost, and small in size. A dynamic restoration framework was proposed in[11] based on a reconfigurable converter-formed multi-terminal SOP, and joint optimization of location and topology for multi-terminal SOPs was proposed in [12] to minimize system losses and voltage deviation.
Although extensive studies have been conducted on SOPs and energy storage-integrated SOP planning, the concept of energy storage-integrated multi-terminal SOPs has not yet been explored. Furthermore, most existing distribution system studies are limited to single-voltage-level systems, which fail to capture the realistic characteristics ofmulti-voltage distribution networks. Energy storageintegrated multi-terminal SOPs can interconnect multiple voltage levels, thereby enabling cross-level load transfer and voltage support. However, to the best of our knowledge, the coordinated configuration of energy storageintegrated multi-terminal SOPs within multi-voltage distribution systems have not yet been investigated.
Recently, the scope of end-use energy demand has expanded beyond electricity consumption alone. Driven byhigh penetration of renewable energy sources and the increasing heating requirements at the demand side, the distribution system is progress ively evolving into an integrated electricity–heat multi-energy system [13]. The optimal energy flow across electrical and thermal systems is thoroughly investigated in [14], employing both decomposed and integrated electricity-hydraulic-thermal computational methodologies. The integrated modeling framework is further expanded in [15] to accommodate high-penetrated intermittent renewable energy sources in multi-period operations. By considering energy storage within heat pipelines, a dynamic ener gy flow was introduced in [16] to exploit the network potential. In [17], a novel multi-timescale matching method was proposed in continuous space to get rid of resolution constraints,avoiding discretization issues while deriving an explicit formulation for thermal dynamics. SOPs have also been incorporated into multi-energy system [18]. In [19], SOP was first introduced into the coordinated recovery process ofelectricity–heat multi-energy systems, where an adaptive alternating direction method of multipliers was developed tosolve the SOP-enabled coordin ated reconfiguration problem. In [20], a co-optimization method was proposed for the configuration of SOPs and hydrogen-based distributed multi-energy stations. As energy consumption patterns can vary in both timing and intensity, demand response programs are implemented in multi-energy systems to adjust flexible multi-energy loads. Based on price-maker [21] and price-taker [22] strategies, shiftable,transferable, and curtailable electrical demand response programs are implemented. With the diversificationof end-user behaviors, the operational performance of the system can be enhanced through synergies among different energy carriers. Consequently, conventional electrical demand response programs have evolved into multienergy demand response schemes,which have received significant attention from researches. Diverse demand-side resources, including electric heating, heat pumps, and other flexible thermal loads are scheduled in [23,24] to enable more granular and coordinated managementof both electricity and heat consumption.
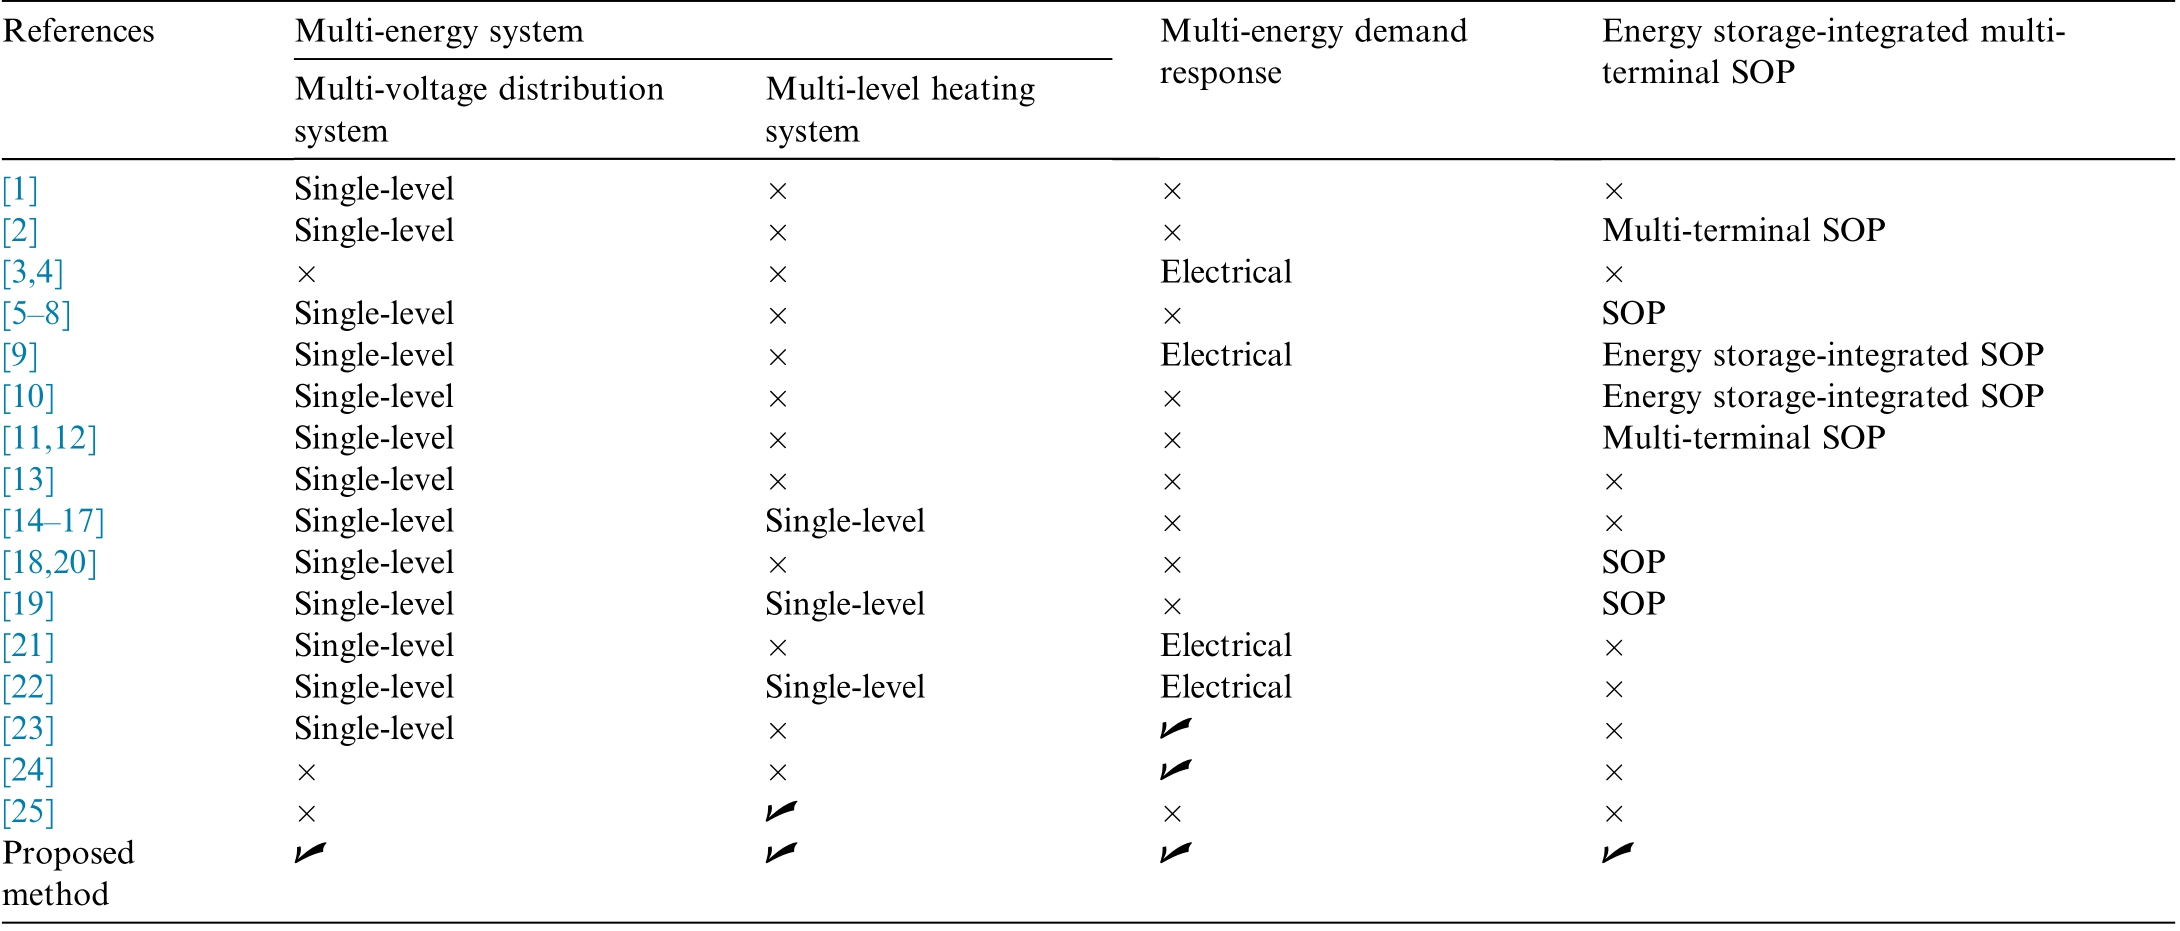
Extensive research has been conducted on electricity–heat multi-energy systems using various steady-state and dynamic models, as well as advanced algorithms. A few recent studies have incorporated SOPs into multi-energy systems to enhance operational flexibility. However, the role of energy storage-integrated multi-terminal SOPs in such systems remains largely unexplored. Moreover, existing research on integrated energy systems typically consider only single-level heating networks, which cannot capture the complexity of real-world systems. In contrast,multi-level heating networks can satisfy diverse temperature requirements through hierarchical heating layers and distributed heat sources, thereby enabling optimized dispatch via inter-layer heat exchange and improving overall energy efficiency [25]. Nevertheless, the coordinated operation of multi-voltage distribution systems and multilevel thermal networks based on energy storageintegrated multi-terminal SOP configurations has not yet been investigated (Table 1).
3)Contributions
In this manuscript, a coordinated operation strategy for a multi-level multi-energy system on an energy storageintegrated multi-term inal SOP configuration is proposed.The main contributions of the study are as follows:
a)Previous studies on multi-energy systems have primarily focused on single-level distribution systems[11] or single-level heating systems[17], thereby oversimplifying the potential for flexible interconnection.This paper proposes the coordinated operation ofa multi-level multi-energy system, encompassing both multi-voltage distribution systems and multi-level heating systems. Such integration facilitates better load balancing across the system, reduces overloading risks, and improves overall reliability.
b) In contrast to existing resear ch that mainly considers dual-terminal SOPs [11], this study is the first to investigate energy storage-integrated multi-terminal SOPs within a multi-energy system.. A coordinated configuration model of energy storage-integrated multi-terminal SOPs is developed for the multi-level multi-energy system, with the objective to minimize combined planning and operation costs.
c)Rather than focusing solely on electrical demand response [21], this work envisions an IoT-enabled multi-energy demand response mechanism based on time-of-use (TOU) pricing, which is categorized into transferable (TL), curtailable (CL), and substitute(SL) types to reflect distinct sensitivities to tariff signals. A contractual mechanism is introduced between energy suppliers and users, enabling consumers to predefine flexible load periods and response types while negotiating compensation and interaction time slots. This approach enhances flexibility and costeffectiveness while maintaining scalability for realworld power systems.
d)The proposed energy storage-integrated multiterminal SOP configuration model is inherently nonconvex due to nonlinear voltage and current constraints. To address this challenge, a mixedintege r linear programming (MILP) relaxationis developed, significantly improving computational efficiency while maintaining modeling accuracy.
1 Multi-level multi-energy system with energy storageintegrated multi-terminal SOP
1.1 System structure
Fig. 1 illustrates the energy storage-integrated multiterminal SOP within a multi-voltage distribution system and a multi-level heating system. Nodes and lines corresponding to different voltage or temperature levels are represented in distinct colors. The SOP, as a power electronic device, is positioned at regular open points of the distribution system to provide load transfer capability and voltage regulation for nearby loads. The combined heat and power (CHP) unit serves as the main generation source in the multi-level energy system, reinforcing the coupling between the electrical and thermal subsystems.Two heating stations (HSs) are deployed in the multilevel heating network, each equipped with a small-scale CHP unit.The heating boiler(HB)functions as an energy conversion unit,while IoT-enabled electrical and thermal demand response schemes are incorporated to enhance overall energy utilization. In this framework, the numbering convention for the multi-level multi-energy system is as follows: distribution nodes are labeled sequentially from 1 to 33, while heating nodes are numbered from 34 to 45.
The coordinated operation of a multi-level multi-energy system offers several advantages over conventional singlevoltage or single-level configurations:
Table 1 Comparison of the proposed approach with existing studies.
1)Enhanced sectoral synergy: Renewable electricity can beused to power heat pumps or electric boilers,while excess heat can be stored or converted back into electricity (e.g., via thermal energy storage or organic Rankine cycles).
2) Improved operational flexibility: The system demonstrates a highly adaptable structure capable of responding effectively to dynamic variations in demand, supply, and environmental conditions.
3) Increased system resilience: Electricity and heat networks can support each other during outages or emergencies (e.g., utilizing stored heat to generate electricity or electricity to sustain heating).
4)Economic efficiency optimization: Cross-sector synergies are exploited to maximize cost-effectiveness(e.g., reusing waste heat from power generation for heating).
By leveraging the synergies between electricity and thermal subsystems, the proposed multi-level multi-energy systems provide a more robust,sustainable,and future-proof energy solution.
1.2Multi-voltage distribution system with energy storageintegrated multi-terminal SOP
1.2.1 Multi-voltage distribution system
This study focuses on a practical multi-voltage distribution system. A subset of nodes is extracted from an actual real-world distribution network[26] to establish a 33-node multi-voltage distribution system. The nodes are grouped according to their respective voltage levels, enabling accurate modelin g of operational characteristics and hierarchical relationships within the system.
The distribution system is divided into three voltage levels, high voltage (HV), medium voltage (MV), and low voltage (LV). The classification is determined by the voltage values at the individual nodes, which directly affect the operational characteristics and constraints. Within this framework, the voltage-level index set is defined as G= {HV, MV, LV}, where HV: This category includes nodes operating at high voltage, typically used for longdistance transmission or major distribution points supplying large areas.
MV: Nodes in this category operate at medium voltage,generally responsible for stepping down high-voltage power from transmission lines for regional distribution.
LV: These nodes operate at low voltage, delivering electricity directly to end-user s, such as residential or small commercial consumers.
Segmenting the system into these three voltage levels allows for more accurate representation of the distinct operational characteristics and constraints associated with each level. The HV subsystem emphasizes efficient longdistance power transfer, the MV subsystem ensures reliable regional distribution, and the LV subsystem provides stable end-user supply.
Differentiation among voltage levels plays a crucial role inthe design and optimization of distribution systems.Interactions between HV, MV, and LV levels must be carefully coordinated to ensure reliability, minimize power losses, and maintain system stability. Voltage levels also influence power flow, fault detection, protection schemes,and voltage regulation, each requiring specialized modeling and control strategies.
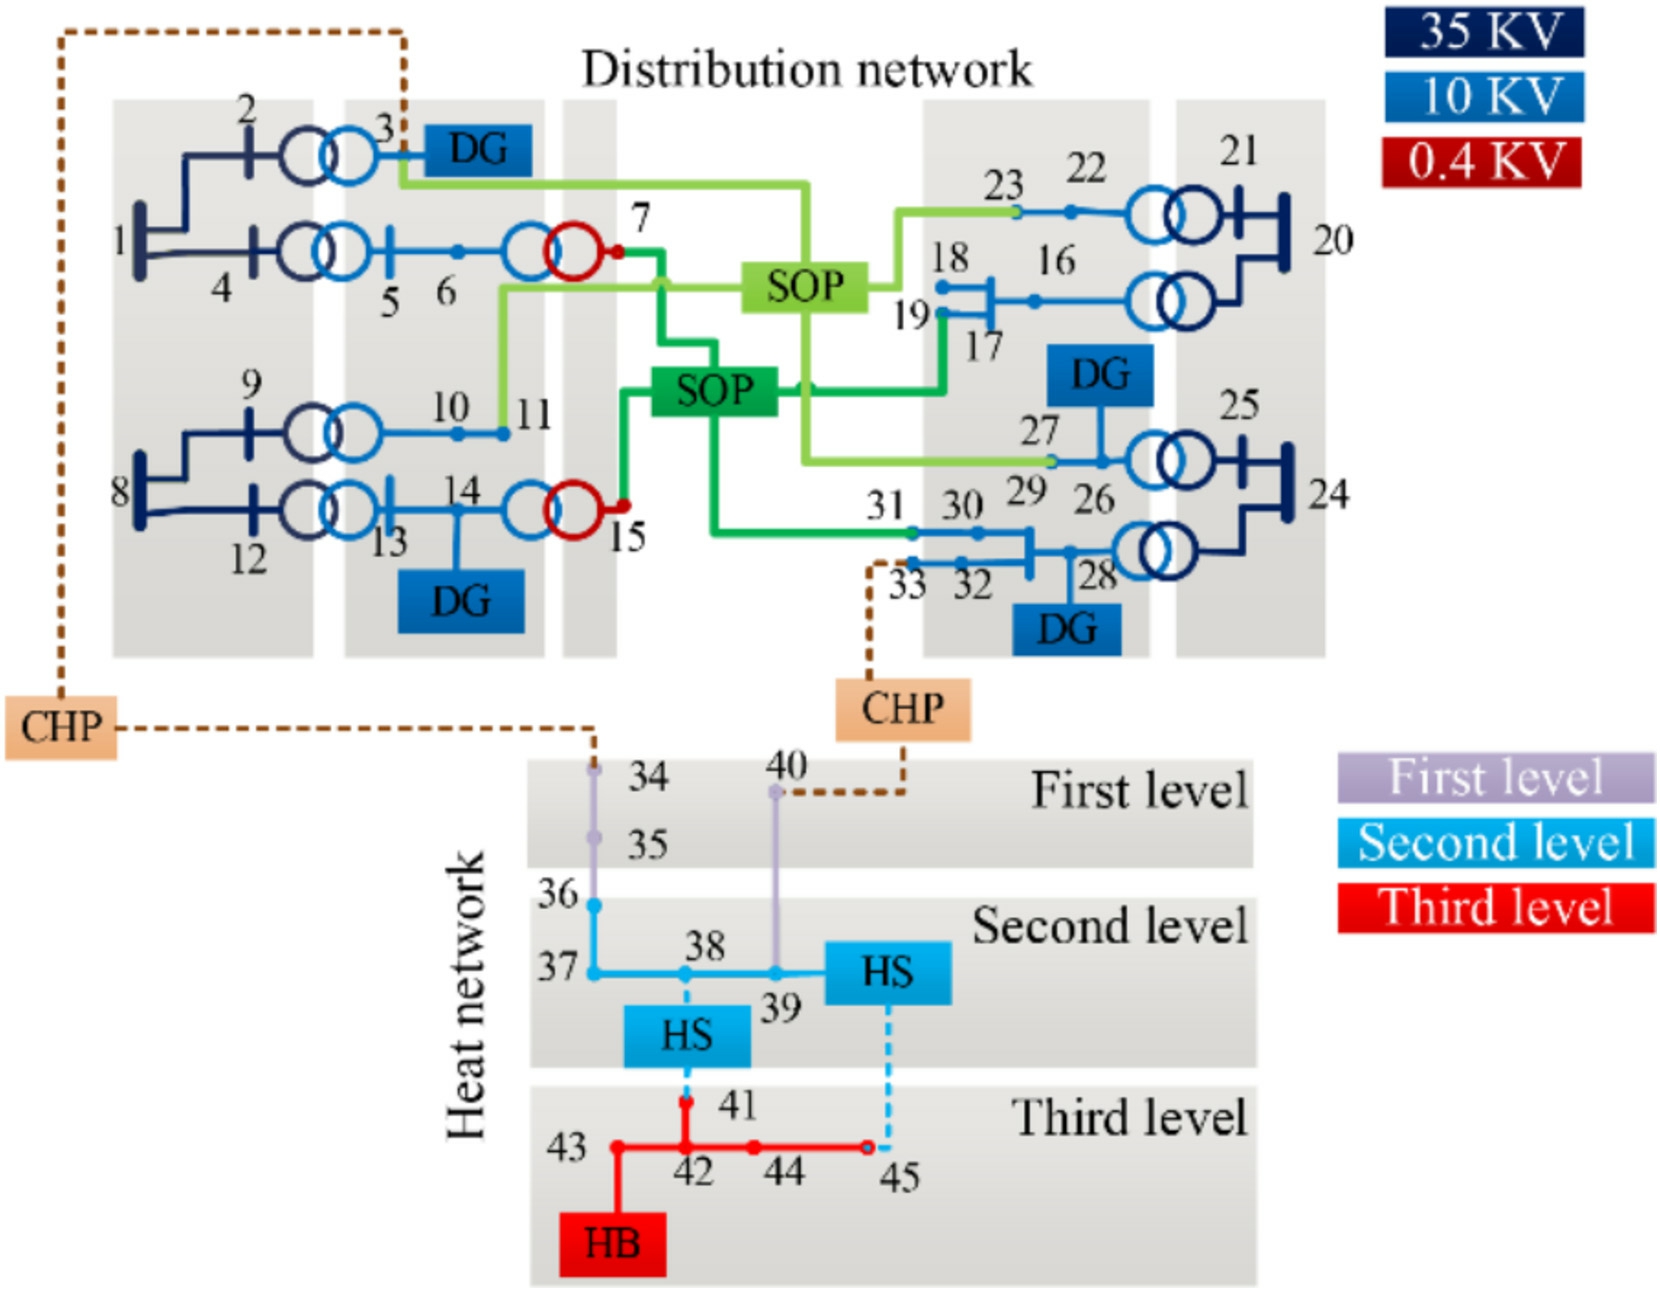
Fig. 1. Structure of the multi-level multi-energy system.
In summary, by constructing a multi-voltage 33-node distribution system and categorizing nodes according to voltage levels, this study investigates the operational, control, and optimization challenges in modern distribution networks integrating high, medium, and low voltage infrastructures. This classificat ion enhances understanding of how different parts of the grid interact to maintaina stable, efficient, and resilient power distribution system.

Constraints (1) and (2) indicate that the node voltage,line current, and transformer load factor of each voltage level subsystem must remain within safe operating ranges.
Transformers are used to interconnect nodes of different voltage levels, functioning as voltage conversion interfaces. With increasing DG integration, transformers at each voltage level must satisfy the following operating conditions to maintain safe load rates: 1) For 220 kV and above, the grid must not experience reverse power flow;2)For 110 kV and below,the maximum allowable reverse power flow is restricted based on local load characteristics, DG penetration, and power supply security requirements.

Constrai nt (3) specifies that the active power transmitted through the transformer is limited by its capacity and the permissible range of load rates.
The Distflow model [6] is adopted to describe the steady-state be havior of the distribution system.
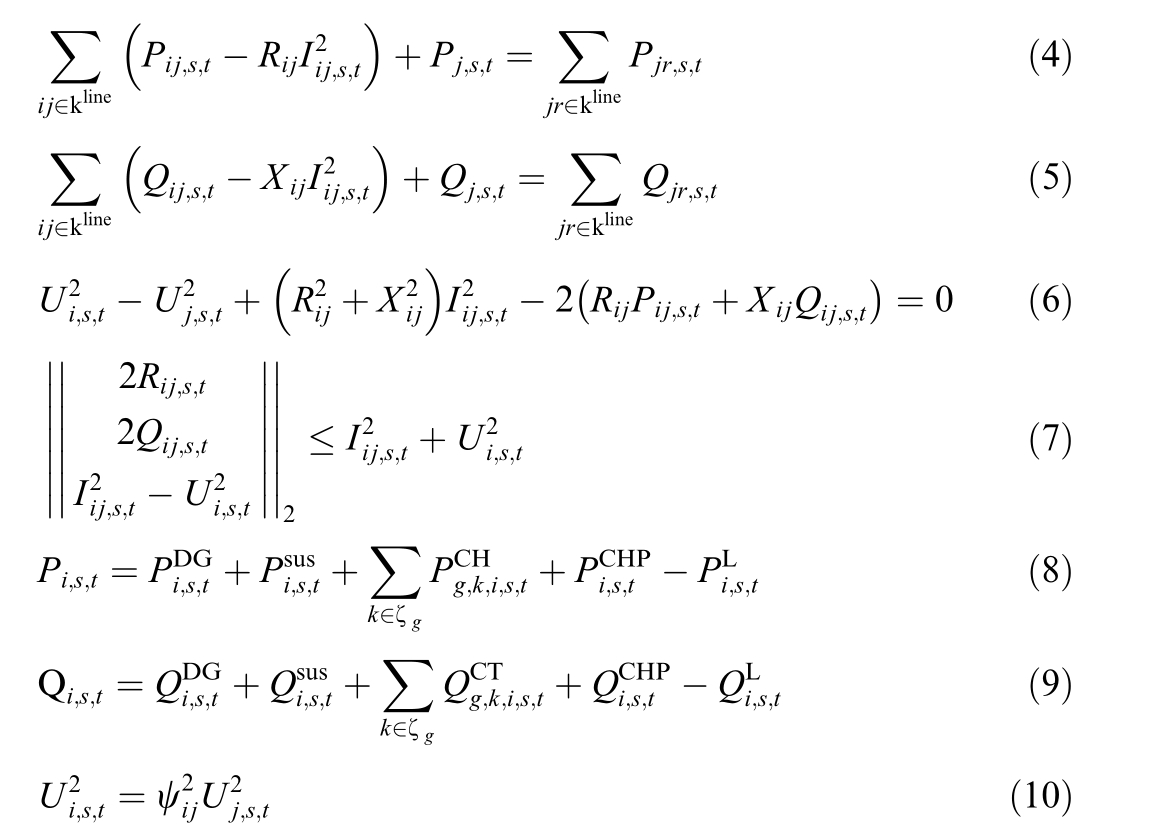
Constrai nts(4) and ( 5)enforce the power balance at bus i. Constraints (6) enforce the nodal voltage consistency between busses. Constraints(7) defines the relaxed branch power flow relationship.Constraints(8) and(9)represents injected power considering SOP, DG, and CHP contributions. Constraints (10) maintains the voltage relationship between adjacent nodes of different voltage levels.
1.2.2 Energy storage-integrated multi-terminal SOP
Fig. 2 illustrates the schematic of an energy storageintegrated three-terminal SOP. Each of its three ports connects to a distinct AC feeder, interfacing with a shared energy storage unit that provides flexible active and reactive power support. During operation, the SOP regulates power flow by adjusting the output of each port to control active and reactive power exchange among feeders. The integrated energy storage acts as a dynamic buffer, ensuring stable and balanced operation across connected feeders. Compared with a dual-terminal SOP, integrating energy storage devices into a multi-terminal SOP offers several advantages, including greater flexibility, improved power flow control, and enhanced utilization efficiency of DG.
The operational efficiency of energy storage-integrated three-terminal SOP is generally high, although some losses occurs during power conversion. These losses mainly arise from conduction and switching processes in the AC-DC and DC-DC converters. SOP efficiency varies with output power[27], typically, within 20–100% of the rated load, the efficiency remains above 95%. However, under light load conditions, static power consumption from control circuits and auxiliary components becomes more pronounced,resulting in a slight decline in overall efficiency.
Each terminal interfaces with an AC feeder, and all are linked to a shared energy storage system that enables coordinated power exchange and stability enhancement. The optimization variables of the energy storage-integrated multi-terminal SOP consist of the active-and reactive power of the AC-DC converters and the active power of the DC-DC converter. Accordingly, its operational model and constraints are formulated as follows:
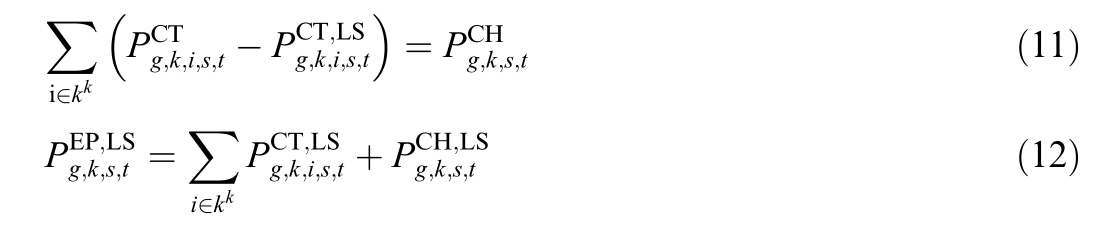
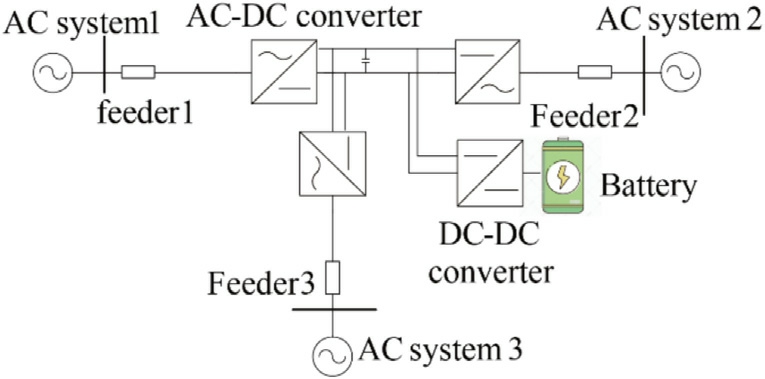
Fig. 2. Configuration of the energy storage-integrated multi-terminal SOP.
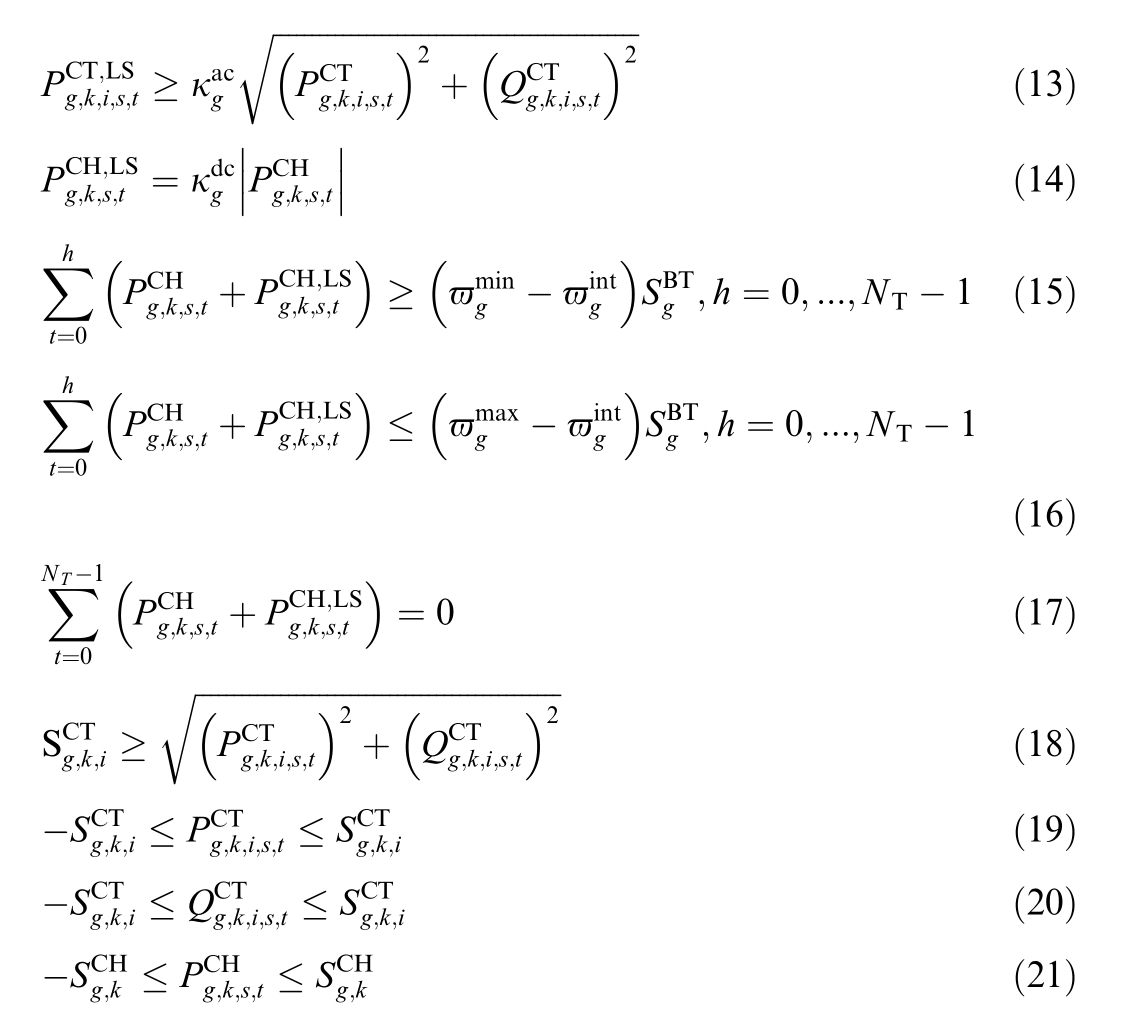
Constraints(11) enforce the power balance between the SOP ports and the DC–DC convert er,accounting for conversion losses. Constraints (12) defines total SOP losses as the sum of AC–DC and DC–DC losses. Constraints (13)links AC–DC losses to injected active and reactive power,while constraints (14) specifies the DC–DC loss model.Constraints(15)–(16) couples the DC–DC converters with the battery storage system. Constraints (17) ensures that the injected power and losses of the DC–DC converter sum to zero.Constraints(18)–(20) bound the AC–DC converter outputs within their rated limits. Constraints (21)restricts the DC–DC injected power accordi ng to its capacity.
The investment cost of the SOP includes site development, equipment procurement, and line construction across different voltage levels. Equipment primarily comprises converters and battery energy storage systems.
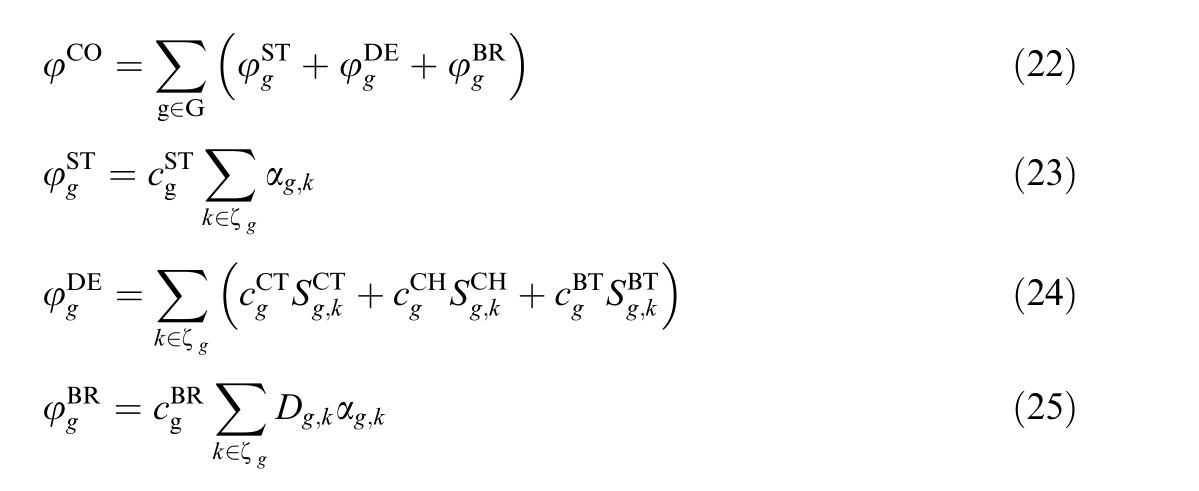
Constraints(22) defines the total investment cost of the SOP, while constraints (23)–(25) represents the cost components of site development, equipment procurement,and line construction, across different voltage levels.
In the planning model, the SOP is permitted to establish aflexible interconnection structure, which may include an energy storage system.
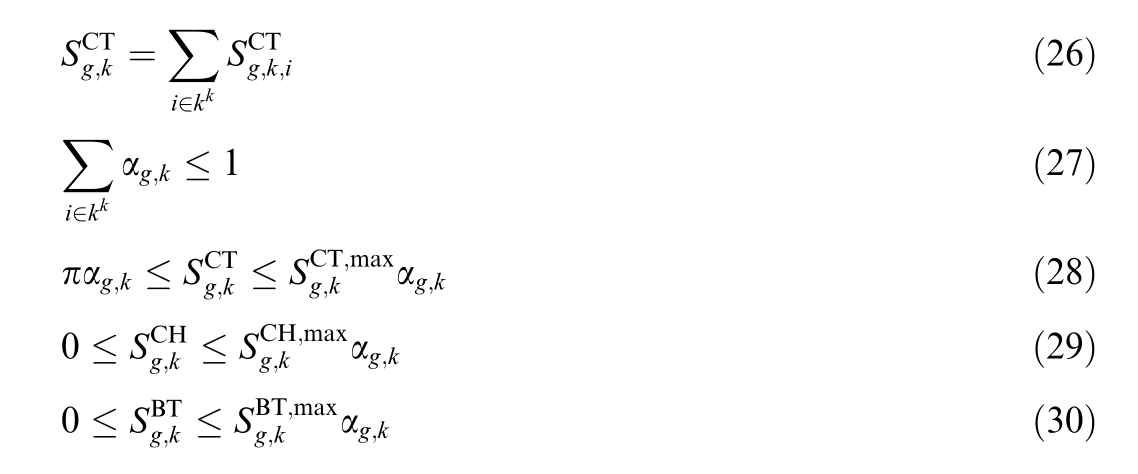
Constraints (26) ensures that the installed capacityof the AC–DC converter at each SOP port equals the total installed AC–DC capacity across all ports. Constraints(27) limits SOP installation to a maximum of one node within the flexible access node set.Constraints(28) bounds the AC–DC installation capacity of the SOP. Constraints(29) and (30) impose upper limits on converters and battery energy storage capacities.
1.3 Multi-level heating system
The multi-level heating system consists of three interconnected layers, each serving a distinct function in the overall thermal energy supply network. The components and roles of each level are described as follows:
1) First level heating system
The first-level heating system serves as the backboneof the entire heating network. It connects large-scale CHP units—the primary heat sources—to the distribution system. Designed to serve extensive areas, this level transports thermal energy generat ed by CHP units to major districts or regions with high heating demand. Operating at high temperatures and flow rates,the first level network ensures efficient, long-distance heat transfer.
It guarantees a stable and reliable thermal supply while establishing the foundation for subsequent distribution.Typically, this level incorporates high-capacity pipelines and large heat exchangers engineered for bulk heat transmission. As a critical component, it supports the heating requirements of urban districts and industrial zones, providing a stable and continuous energy supply.The thermal energy delivered at this stage is subsequently transferred to the second and third level systems for localized distribution.
2) Second level hea ting system
The second-level heating system serves as the key intermediary between the first- and third-level systems, ensuring efficient heat transfer and distribution. This system interfaces with multiple heat exchange stations, which act as hubs for regulating heat flow. These stations adjust the temperature of the incoming thermal energy—typically lowering it to levels suitable for downstream distribution.
Covering a medium-sized area, the second-level network bridges large-scale primary heat sources and localized demands in urban or suburban zones. In addition to distributing heat, it performs temperature optimization and energy balancing, improving overall network effi-ciency before supplying the third-level system.
The second-level also provides operational flexibility,by accommodating variations in heating demand due to changes in outdoor temperature or seasonal conditions.Through dynamic adjustment of heat flow and temperature, in the second-level network maintains overall system balance and reliability.
3)Third levelheating system
The third-level heating system represents the final stage of the heating network, directly serving end users suchas residential buildings, small commercial facilities, and institutional consumers. This level typically consists of compact components such as boilers, pumps, and local heat exchangers.Its primary function is to fine-tune the temperature of heat received from the second-level system to meet user specific requirements.
Due to its localized scope, the third-level system enables precise and responsive heat control. It adapts to the diverse needs of individual buildings, streets, or blocks,ensuring comfort and energy efficiency.
Because of its proximity to consumers, the third-level system requires continuous monitoring and maintenance to promptly respond to rapid changes in heat demand—such as those caused by sudden temperature drops during winter. Furthermore, this level offers opportunities for incorporating advanced energy-saving technologies, such as smart thermostats, intelligent heat meters, and demand-responsive controls. These technologies empower end users to manage consumption efficiently and contribute to improved overall system performance. Fig.3 illustrates the architecture of a three-level heating system.
The hierarchical configuration enables systematic and efficient heat distribution across diverse regions and user groups. By structuring the network into dist inct levels,the system achieves optimization for both large-scale heat transport and localized temperature adjustments. Fig.3 illustrates the architecture of a three-level heating system.In this study, a 12-node heating system is developed a nd divided into three hierarchical levels according to heating coverage.

Constraints (31) ensures that the thermal power transmitted through each pipeline remains within its maximum thermal capacity.
Modeling the detailed operation of a multi-level heating system poses significant challenges, as it constitutesa mixed-integer nonlinear programming (MINLP) problem.To address this com plexity, an energy f low model is adopted to decouple thermal power from both mass f low rate and tem perature. This modeling approach is wellsuited for fast load restoration and offers an effective balance between com putational efficiency and solution accuracy when analyzing or restructuring multi-level heating systems.
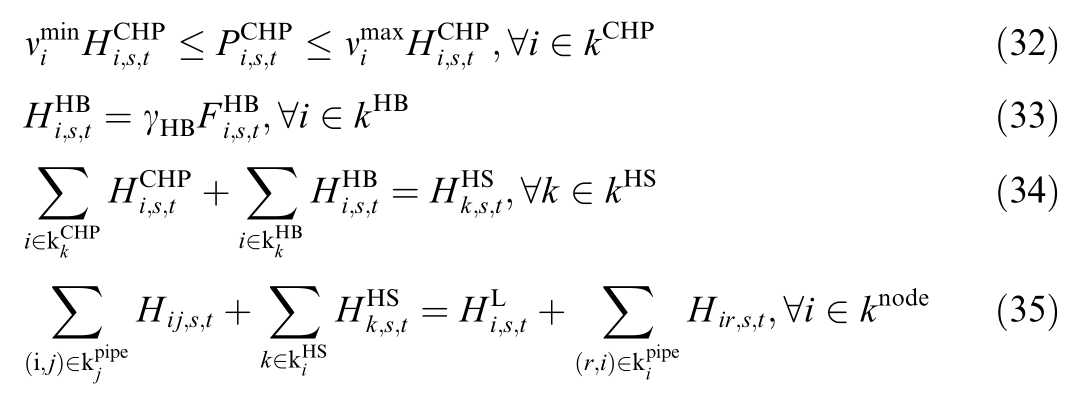
Constraints (32)–(33) describes the multi-energy generation relationships of the CH P unit and the HB. Constraints (34) states that the total heat output comprises the contributions from both the CHP and HB units.Constraints (35) represents the overall heat supp ly–demand balance w ithin the heating system.

Constraints (36) and (37) def ines the thermal power output lim its of the CHP and HB, ensuring that both units operate w ithin their rated capacities.
2Coordinated energy storage-integrated multi-ter m inal SO P conf iguration
2.1 Objective function
A coordinated, energy storage-integrated, multiterm inal SOP conf iguration for a m ulti-voltage distribution system and a multi-level heating system is established.The objective is to m inim ize the total annualized cost,which comprises capital recovery and operating costs.
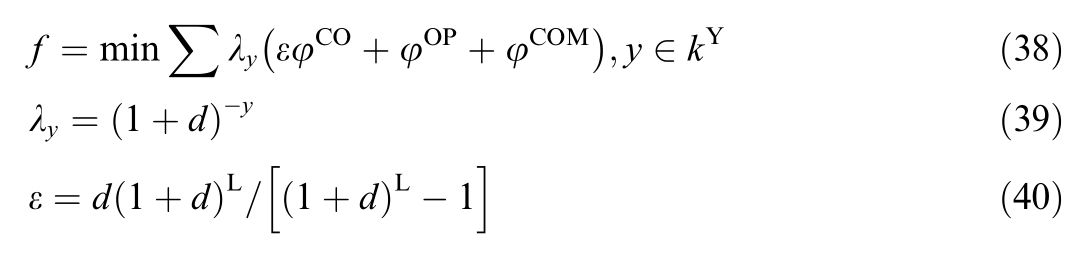
Constraints (38) calculates the total annualized cost of the SOP conf iguration for the multi-voltage distribution and multi-level heating system s.Constraints(39) com putes the present value coefficient, enab ling the conversion of lifecycle costs to an average annual cost in the base year byaccounting for the annual interest rate and project duration. Constraint (40) evaluates the capital recovery coefficient, which spreads construction costs evenly over the system life cycle; by considering the annual interest rate and the recovery period, this coefficient yields the annualized investment cost. Using the basic annual present value, the total cost functi on f can then be sim p lif ied and expressed as follows.
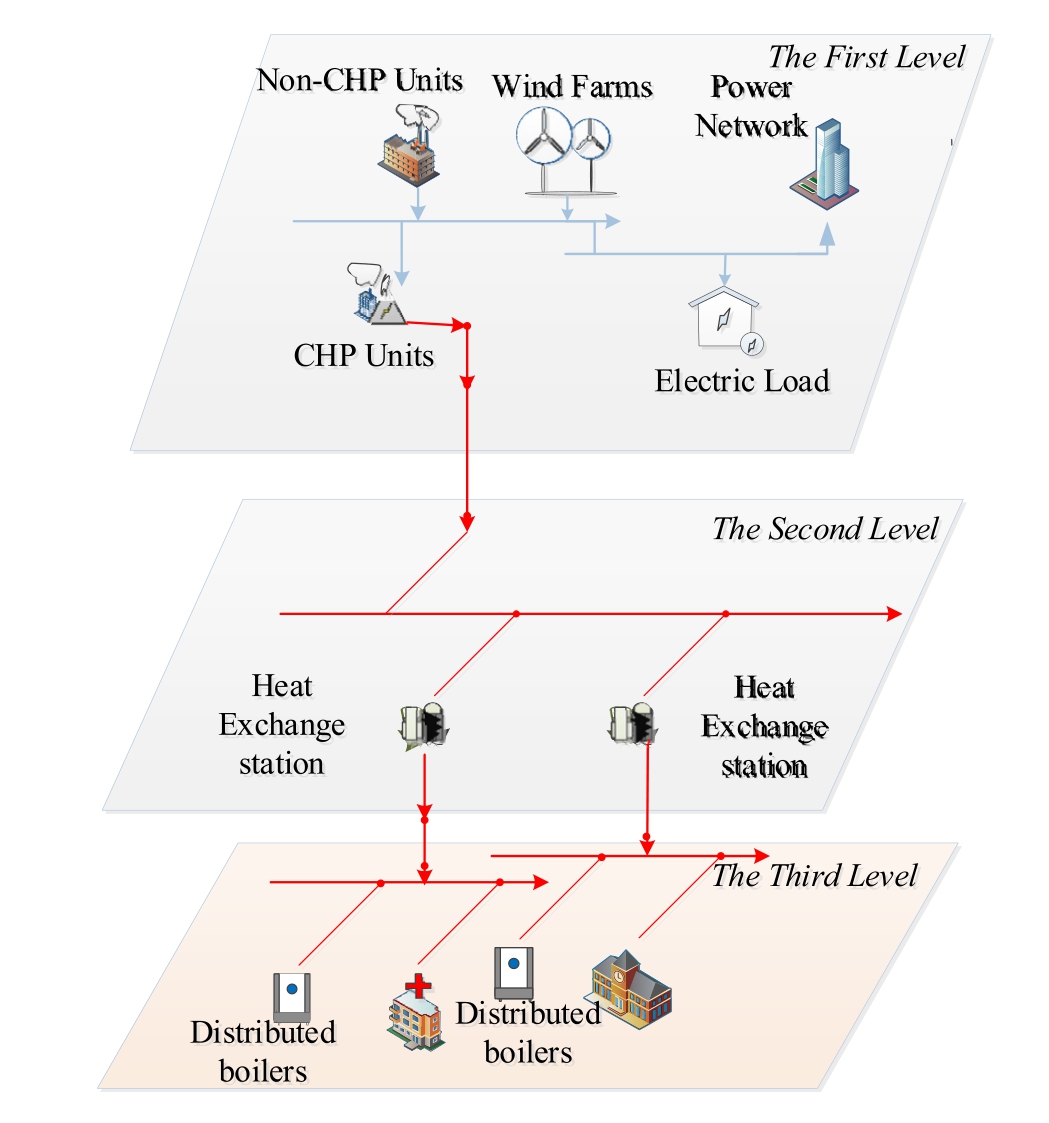
Fig. 3. A rchitecture of the three-level heating system.

The operating cost includes electrical and gas procurement costs, syste m loss costs, and voltage/current overlimit penalties:
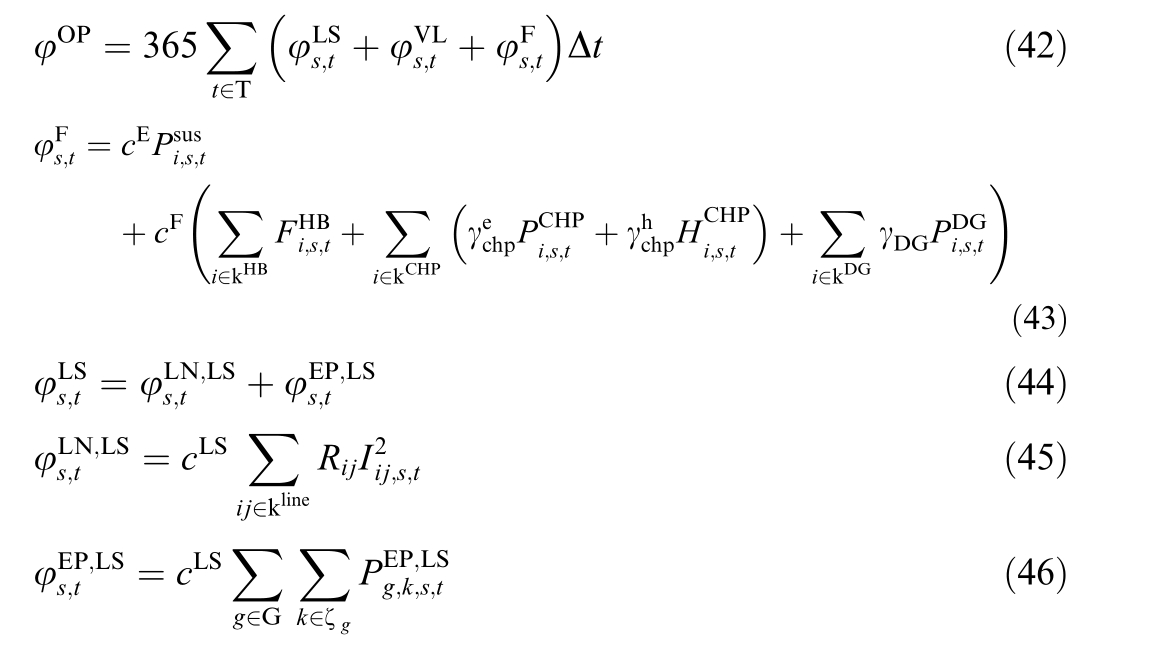
Constraints (42) calculates the annualized operating cost. Constraint (43) represents the total energy consum ption cost of the system. Constraints (44) decom poses the total loss cost of distribution system into line loss cost and SOP loss cost. Constraints (45) and (46) compute the line loss cost and the SOP loss cost.

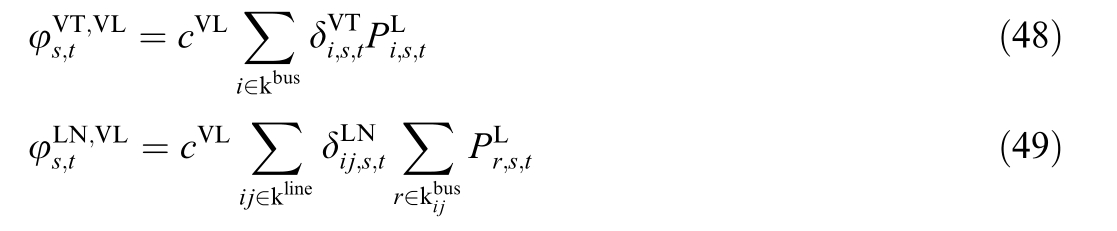
Constraint (47) decomposes the total over-limit loss cost of the distribution system into voltage over-limit cost and the current over-limit cost, respectively. Constraints(48) and (49) calculate the voltage over-limit cost and the current over-limit cost, respectively.
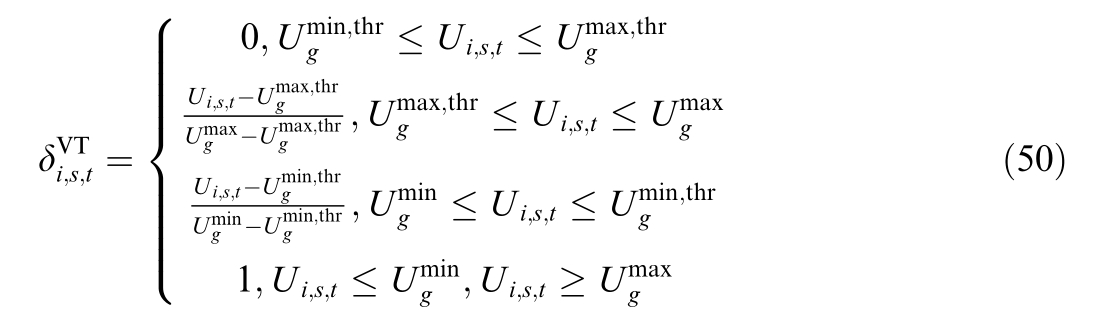
The voltage over-limit penalty is illustrated in Fig.4.When the voltage lies within the optimization range, the penalty coefficient is 0. If the voltage falls outside the safe range, the coefficient equals 1. For voltages that are within the safe range but outside the optimization range,the penalty coefficient varies linearly with the voltage.The specific formula is given as follows.
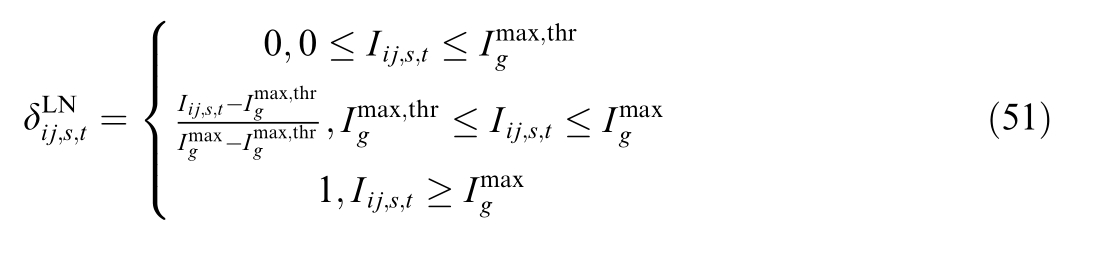
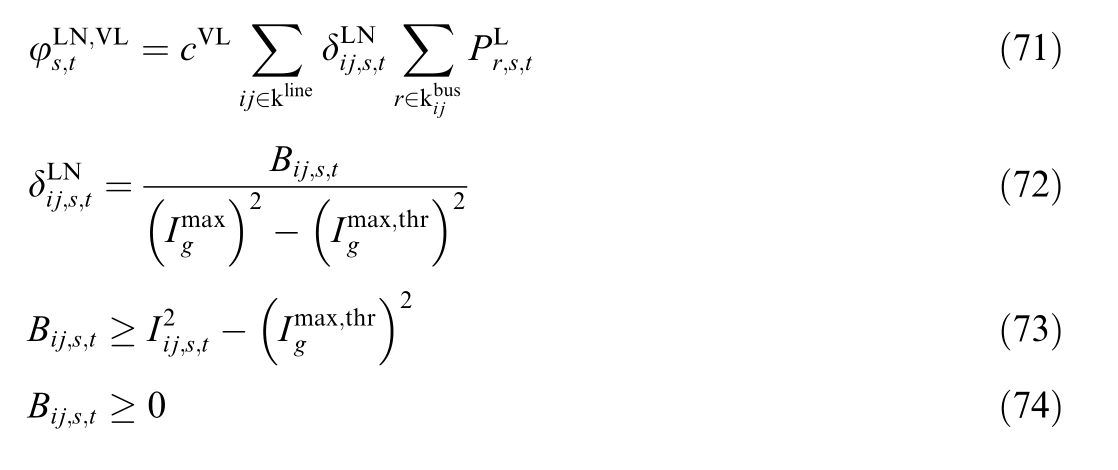
The current over-limit penalty is defined analogously to the voltage over-limit pena lty.The specific calculation formula is given as follows:
2.2 Other constraints
1) CHP and DG constraints
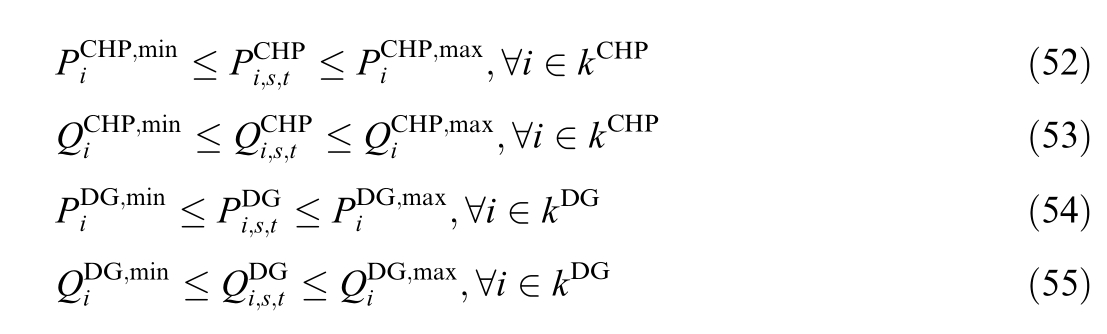
Constraints (52) and (53) enforce the CHP active and reactive power output limits. Constraints (54) and(55) enforce the DG active and react ive power output limits.
2) Multi-energy demand response constraints
By integrating smart devices, sensors, and communication networks, demand response leverages IoT technology to optimize energy consumption. The most common form of demand response is TOU pricing,whose tariffstructure and time period divisions are relatively fixed and change only at long intervals, making its practical implementation straight forward. In this study, TOU pricing is selectedas the representative model for electric load demand response.
Different load types respond differently to the same tariff signal. To account for this, electric loads are categorized into three types: TL, CL, and SL. Load managementis implemented via contractual arrangements between the energy supplier and the user[28]. Under this scheme, users provide advance information about the time periods and types of flexible power consumption for each time slot.Both parties then negotiate the reimbursement rate for each load category and the specific time slots eligible for interaction. Based on its production and dispatch capability,the energy provider dynamically adjusts the user’s flexible demand within each timeframe, and the useris compensated according to participation in demand adjustment.
CL model: CL consumption is curtailable. During peak pricing periods, specific non-essential loads—suchas HVAC systems and other appliances—are curtailed,reducing users’energy costs.The demand response behavior is described using a price–demand elasticity matrix,represented in(56), where each element denotes the elasticity coefficients for a particular load.

Constraints (56) specify each element of the price elasticity demand matrix. After demand response, the load reduction for each element is given by the following equation:en

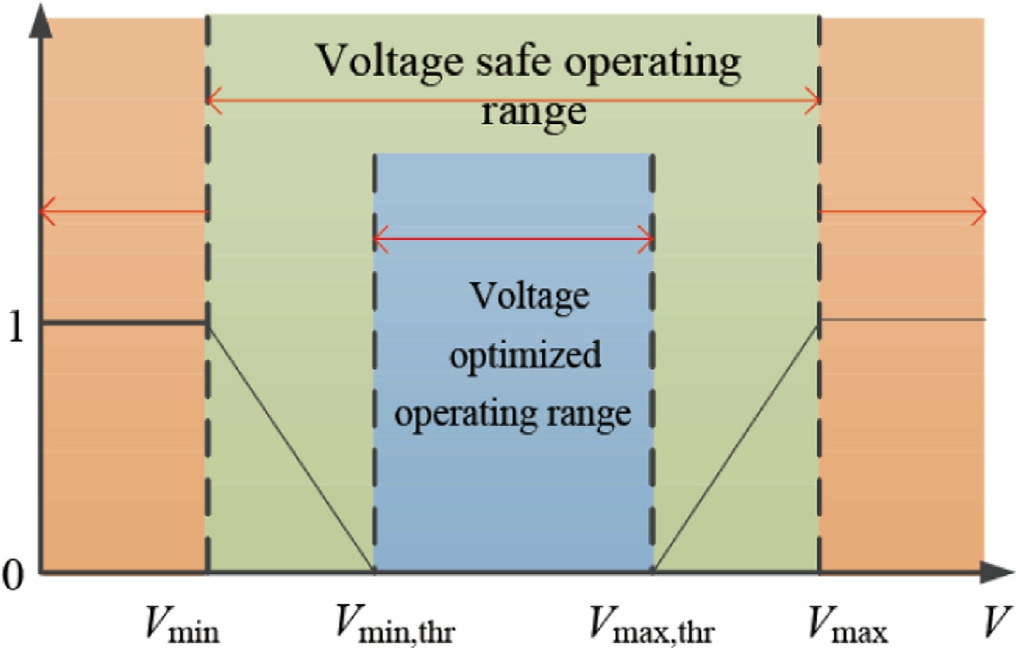
Fig. 4. Penalty coefficient for voltage deviation.
Under the terms of the signed agreement, the user istitled to the financial compensation:

TL model: TL loads are time-shiftable. While the total energy consumption is approximately constant, the timing ofconsumption can be shifted according to price signals.For example, scheduling washing machines or electric vehicle charging during low -price periods. The price–demand elasticity matrix is again used to model demand response behavior, and the change in transferable load resulting from demand response is expressed as follows:

where each element of the TL price elasticity demand matrix is the same as the corresponding element in the CLprice elasticity demand matrix.

Constraints (60) ensures that users receive the agreed fin ancial compensation based on the signed contract.
SL model: SL refers to loads that can be supplied either electrically of directly by thermal energy, such as heating loads that operate during low-price periods and heatconsuming pr ocesses that preferentially use thermal energy during high-price periods. The electric to thermal conversion rate is defined by the following equation:

Constraints (61) defines the conversion rate from electri c load to thermal load and can be calculated as follows:

Constraints (63) ensures that user receive the agreed fin ancial compensat ion per the contract.

Constraints (64) expresses the quantitative relationship among load power, reducible load power, transfera ble load power and replaceable load power.

Constraints (65) calculates the user comp ensation cost.
2.3 Linearization
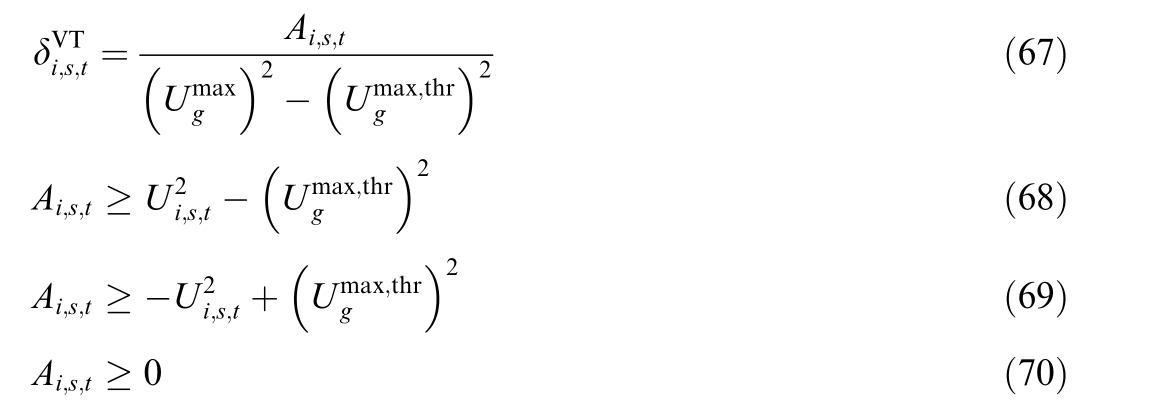
Assuming that the differences between the voltage optimization range and the upper-lower bounds of the safe operating voltage range are equal, the voltage violation penalty cost can be linearized as follows (Fig. 5):

Similarly, the current violation penalty cost can be linea rized as follows:
2.4 Problem formulation and solving
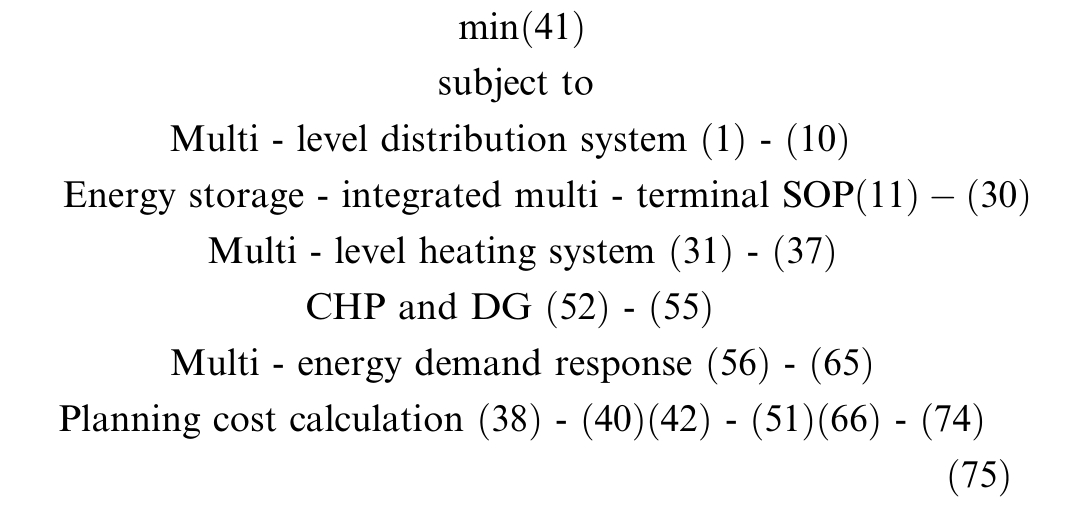
After the above linearization, a MILP model (75) can beformulated and solved using commercially available solvers with acceptable computation efficiency.
The coordinated operation of the multi-level multienergy system, based on the energy storage-integrated multi-terminal SOP configuration,was implemented using the YALMIP toolbox [6] in MATLAB. The simulations were performed on a system with a 3.1-GHz Intel Core i5-10500 CPU and 8 GB RAM. It can be easily and solved with the MILP solver GUROBI within a few minutes,depending on system scale. Fig. 6 illustrates the modeling and solving process for the proposed multi-level multienergy system.
In this study, the coupling relationship between electrical and thermal energy is established through the CHP.However, the multi-level multi-energy system may not be managed by a single operator, and full information sharing among operators is often impractic al. In such cases,hierarchical regulation algorithms [15], such as the twolayer method or the alternating direction method of multipliers can be developed to decentralize the original multilevel system into multiple network-level subproblems.These subproblems can then iteratively coordinate the decisions of individual operators with limited information exchange. This aspect is beyond the scope of the present work and will be explored in future studies.
3 Case study
3.1 Base data
The effectiveness of the proposed method is evaluat ed using a real multi-level multi-energy system. As illustrated in Fig. 7, the test case is developed based on a regional distribution system[26] in Zhengding, Hebei Province, China,which comprises a multi-level distribution network with voltage levels of 35–10-0.4 kV and a multi-level heating system. The planning horizon spans 20 years, with an annual interest rate of 0.1 and an annual load growth rate of 2%.
The multi-voltage distribution system is designed according to the regional distribution system in Zhengding[26]. The maximum installed capacity for a single SOP converter is 30 MVA, and the loss coefficient of the SOP inverter is 0.02 [26]. The battery energy storage capacity is 30 MWh, with an operating safety range of [0.1, 0.9].The safe operating voltage range for each voltage levelis 0.3–0.5, 7.5–12.5, and 26.25–43.75 kV, respectively. The load factor is set to 60%, and the line model parameters are derived from actual system data. The 35, 10, and 0.4 kV voltage level distribution systems adopt LGJ-120,JKLGYJ-240, and YJV22-3*185 lines, respectively.
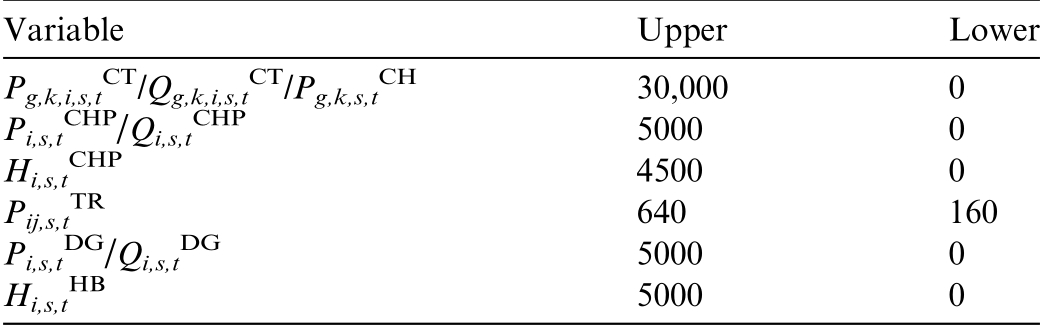
The multi-level heating system is modeled based on[19],and the district heating network design standard (CJJ34–2016) [29]. Two CHP units, located at nodes 3–34 and 33–40, establish the couplings between the two networks.According to contract [28], the unit power compensation prices for CL, TL, and SL are 0.3 yuan/kW, 0.1 yuan/kW, and 0.03 yuan/kW, respectively. These values are benchmarked against a comprehensive energy park ina city in Hebei Province, China. Other relevant parameters obtained from [6,15], and [26] are summarized in Tables 2 and 3.
To verify the effectiveness of the energy storageintegrated multi-terminal SOP scheme, three different scenarios are examined:
1) Scheme 1: Single-voltage distribution system and multi-stage heating system ba sed on a multiterminal SOP configuration.
2) Scheme 2: Multi-voltage distribution system and multi-level heating system based on a doubleterminal SOP configuration.
3) Scheme 3: Multi-voltage distribution system and multi-level heating system based on a multiterminal SOP configuration.
3.2 Configuration cost analysis
Because the spatial scale of the high-voltage distribution system is significantly larger than the medium - and low-voltage systems, the SOP configuration planning primarily focuses on the medium- and low-voltage levels.Fig. 8 shows the structure of the multi-voltage distribution system and the multi-level heating system under schemes 1–3, while the planning costs for each scheme are summarized in Table 4. In scheme 1, the four-terminal SOPis connected to nodes 7–15–19–31 and 3–11–23–27, whereas in scheme 2,the double-terminal SOP connects nodes 7–19 and 11–23.
In comparison with schemes 1 and 2, scheme 3 demonstrates significant advantages in terms of system losses,voltage deviations, and current overloading:
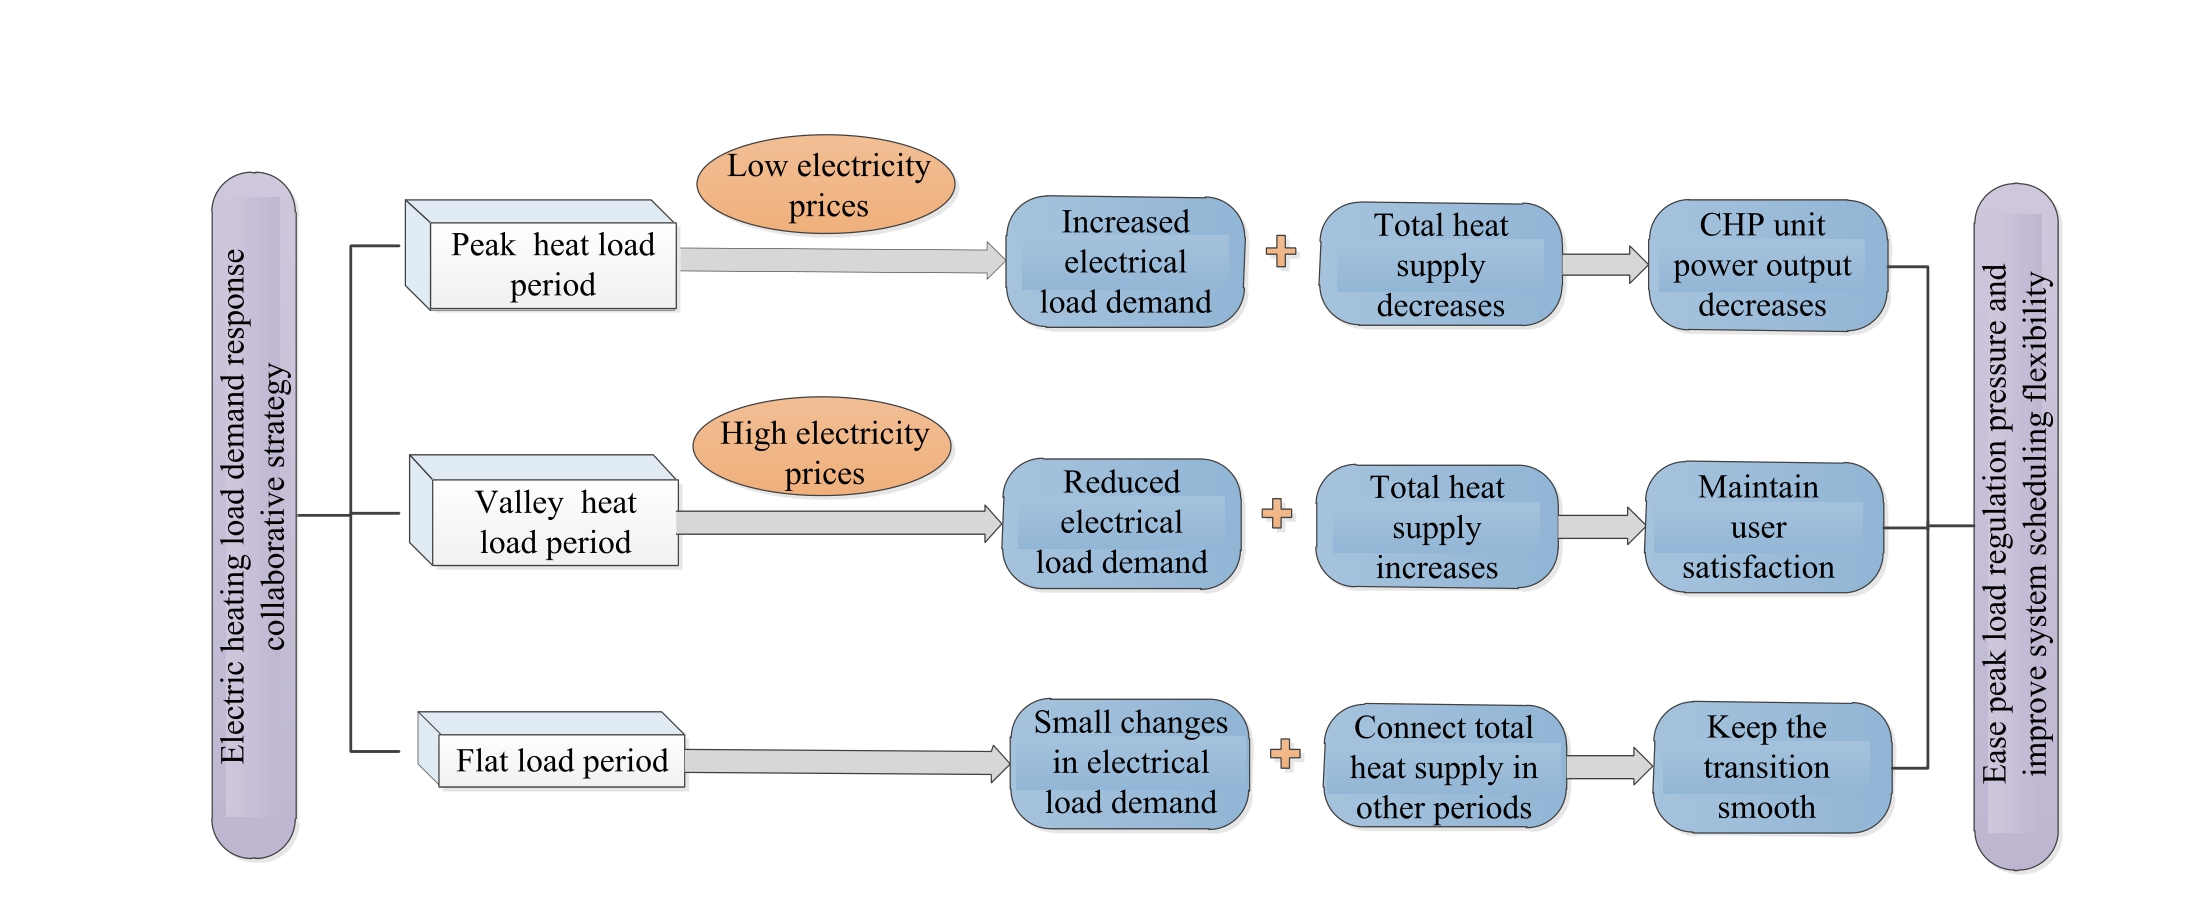
Fig. 5. Electrical and therma l demand response.
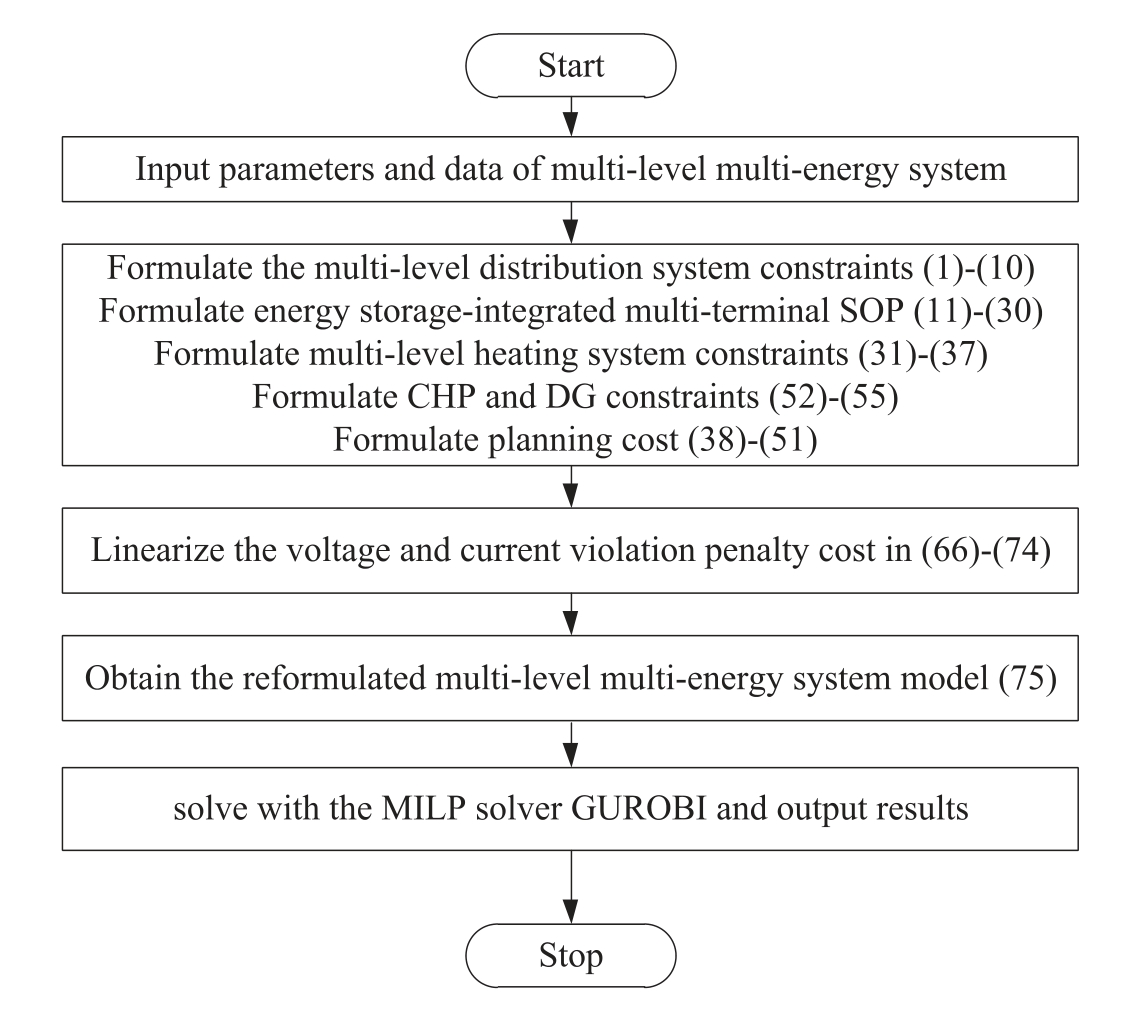
Fig. 6. Flowchart of the modeling and solving process.
1)Scheme 1, similar to Scheme 3, adopts a multiterminal SOP configuration, resulting in only minor difference s in SOP configuration costs. However,scheme 1 utilizes a low-voltage distribution network,which inherently operates with higher line currents than that of scheme 3. Consequently, its system power losses are substantially higher, increa sing operational costs and leading to a 21.48% reduction in total cost for scheme 3.
2)Although the two-terminal SOP in scheme 2 entails a lower configuration cost, it suffers from limited operational flexibility. With only two connection nodes,the system’s voltage support capability are restricted.This limitation hinders multi-node power flow coordination, increasing the likelihood of overloads on certain lines and busses, and thereby compromising system stability and security. In contrast, the multiterminal SOP in scheme 3, despite its higher initial cost, effectively mitigates localized overloads and reduce losses and constraint violation costs. As a result, scheme 3 achieves an overall cost reduction of5.17% compared with scheme 2, confirming the economic superiority of the multi-terminal SOP configuration.
3.3 System operation analysis
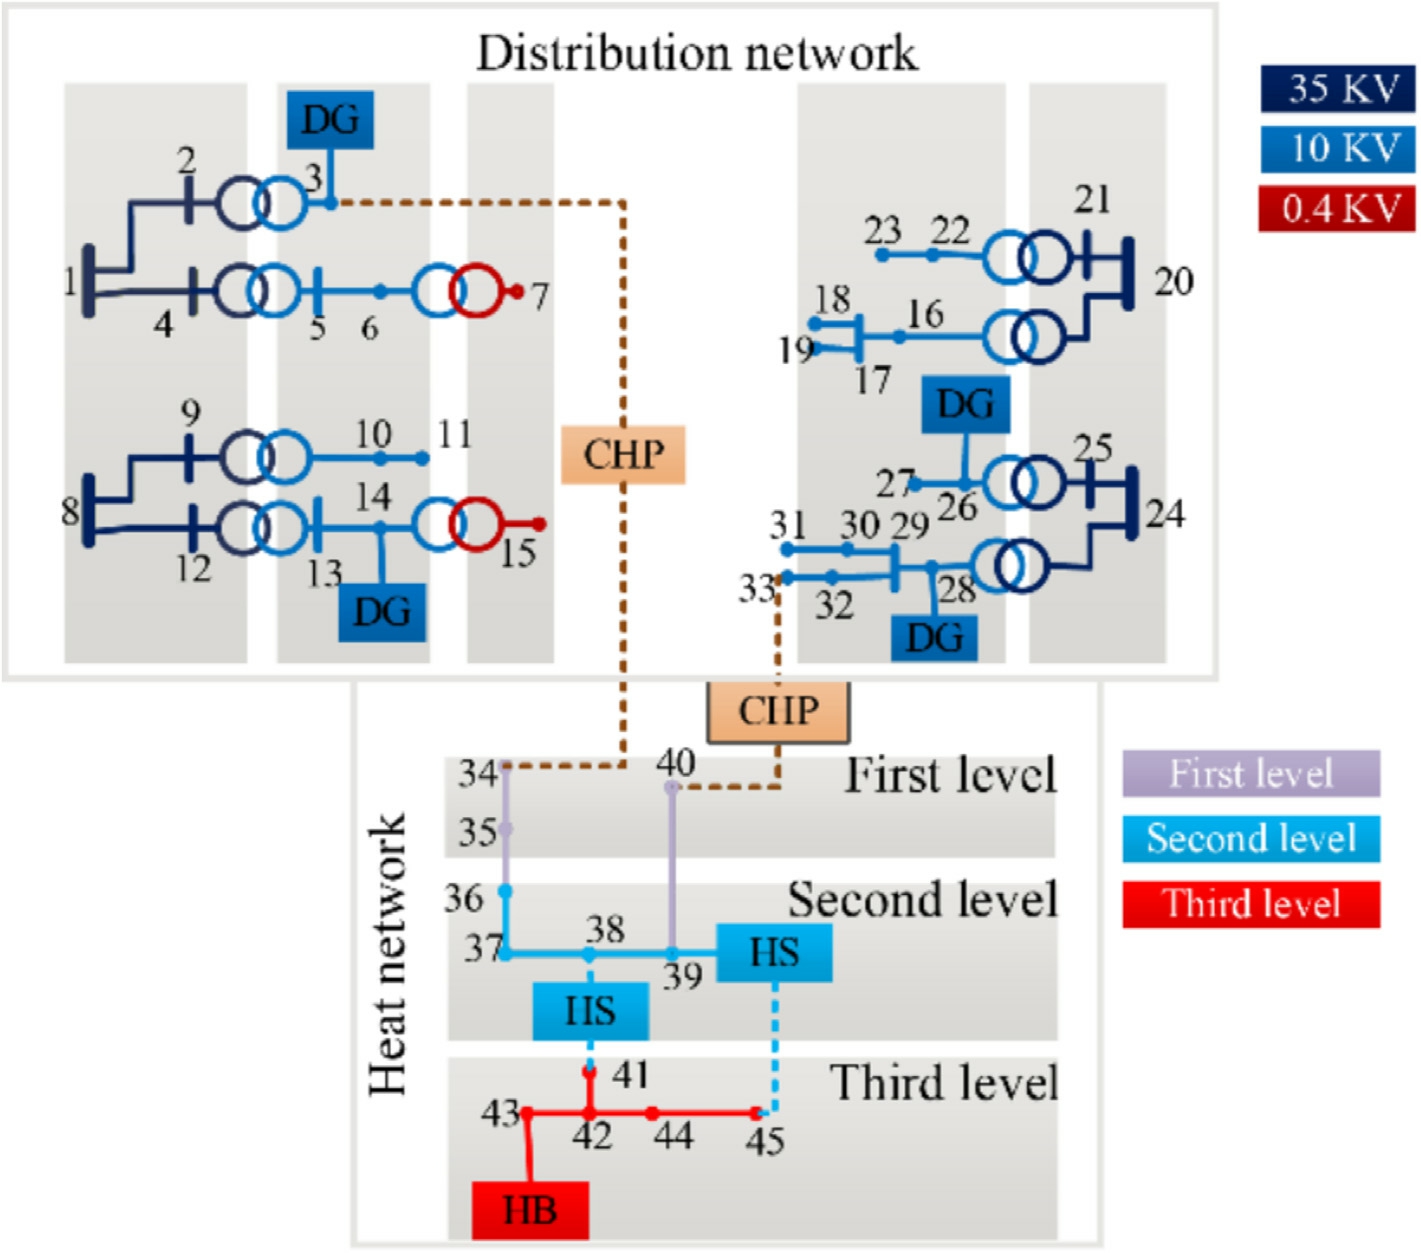
Fig. 7. Multi-level multi-energ y system topology.
Table 2 Price parameters associated with the planning.
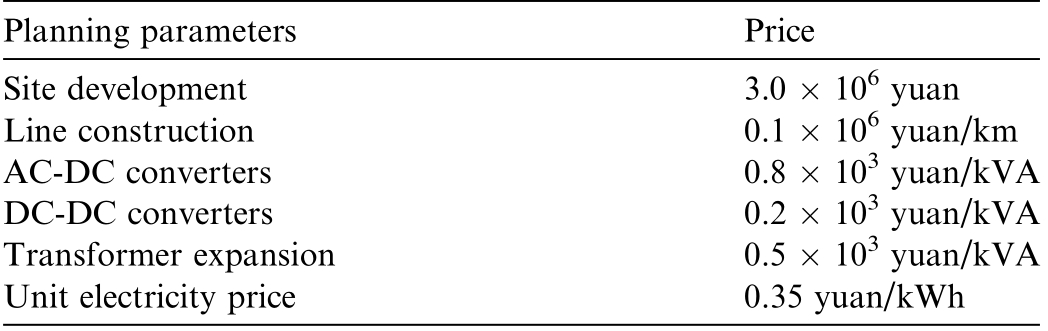
Table 3 Upper and lower limits of optimization variables.
In this study, the nominal voltages for the three voltage levels in the distribution system are 110, 35, and 0.4 kV.The low-voltage distribution network directly supplies end-user equipment, whereas the medium- and highvoltage networks primarily handle transmission and distribution. To better capture the impact of voltage deviations,a higher voltage tolerance is adopted than in previous studies. Due to the existence of multiple voltage levels,the raw voltage data of the distribution system exhibit significant fluctuations across different nodes,making it diffi-cult to intuitively identify the rate of change. To address this issue, the per-unit (p.u.) system is employed for data normalization and comparison. Fig. 9 depicts the nodal voltage profile of the distribution system. However, such visualizations are not optimal for comparing multiple scheme. Ther efore, to enhance clarity, average values across various dimensions are extracted to simplify the comparison. Fig. 10 presents the temporal variationof the average nodal voltage under each scheme, highlighting their respective effectiveness in mitigating voltage fluctuations. Fig. 11 further shows the average voltage distribution of individual nodes for each scheme, demonstrati ng their ability to regulate voltage profiles within the system.
Although scheme 1 coordinates node voltages through multi-terminal SOPs, it cannot effectively suppress voltage fluctuations, resulting in overvoltage or undervoltageat certain moments. Com pared with scheme 1, scheme2 employs a multi-voltage level distribution system, which exhibits smaller voltage fluctuates over time.
However, due to the limited coordination ability of the two-terminal SOPs, it cannot effectively regulate the voltage across all nodes, leading to large voltage differences between nodes. In contrast, scheme 3 integrates an energy storage system with the multi-voltage level distribution system through a multi-terminal SOP, significantly enhancing the stability and flexibility of node voltage regulation. Consequently, voltage fluctuations are effectively reduced.As shown in Figs. 10 and 11, the voltage fluctuations over time in scheme 3 are smaller than those in schemes 1 and 2.
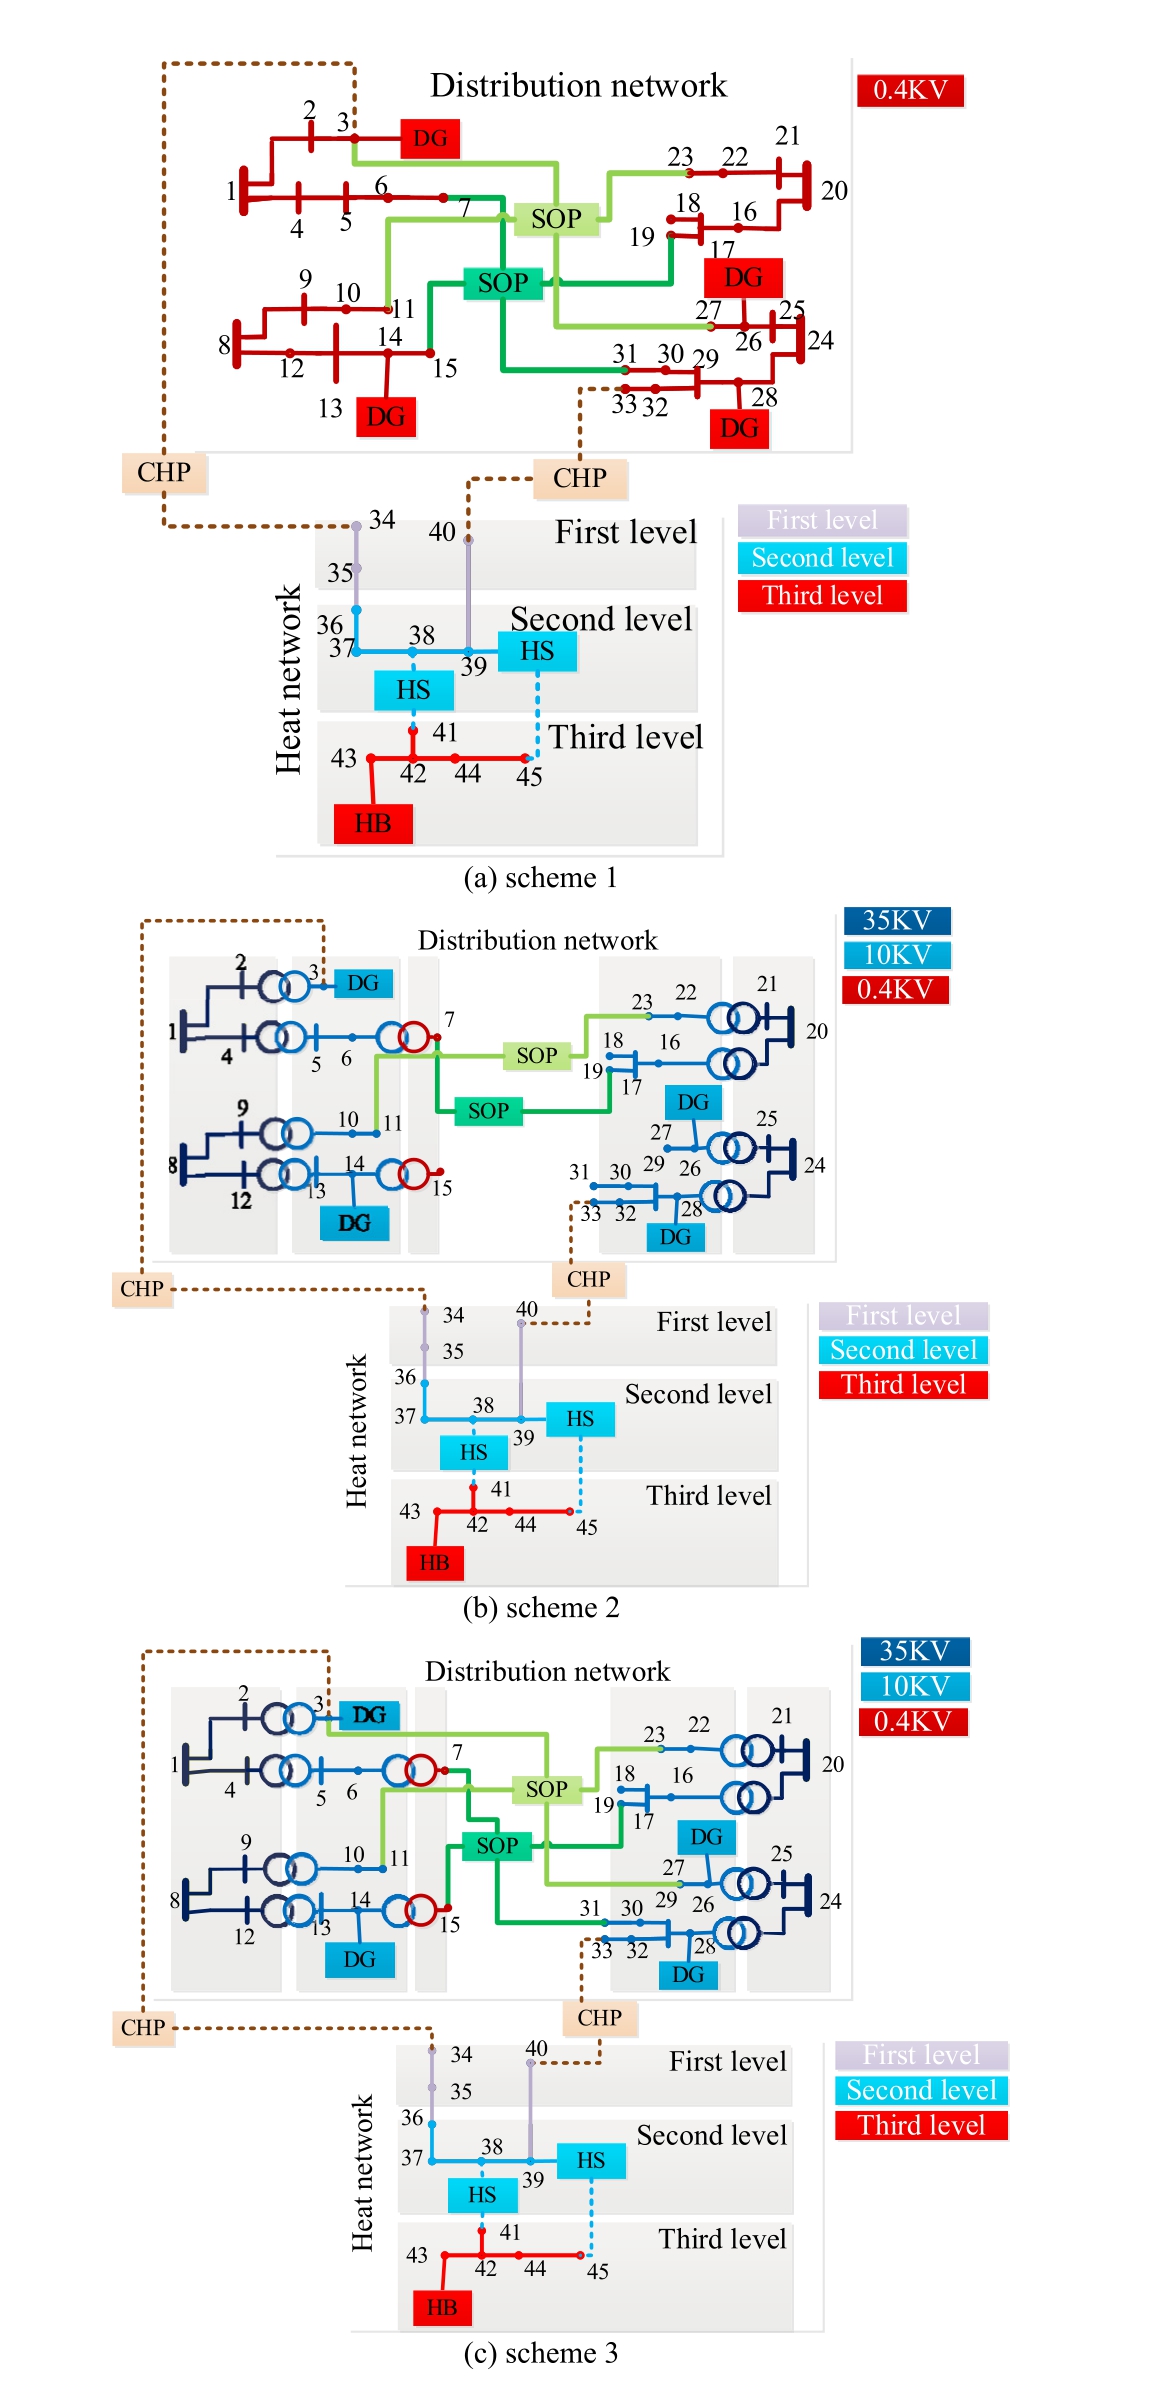
Fig. 8. Topologies of the multi-level multi-energ y system under different schemes.
Figs. 12 and 13 present the average distribution line current for each scheme. The simulation results show tha tthe normalized current in scheme 1 is significantly higher than in schemes 2 and 3 because the single-voltage distribution system operate s at a low voltage level, resulting in larger current magnitudes. Compared with scheme 1,scheme 2 exhibits a smaller total line current. However,the limited coordination capability of its two-terminal SOPs causes serious overloading on certain lines. Similarly, scheme 3 coordinates the multi-voltage distribution system using the multi-terminal SOP, which enhances current regulation flexibility and prevents excessive grid currents. Compared with scheme 2, the multi-terminal SOP inscheme 3 improves line coordination, ensuring a more uniform current distribution.As a result,the current difference between lines in scheme 3 is smaller than in scheme 2.
Table 4 Sy stem costs of multi-level multi-energy system under different schemes.

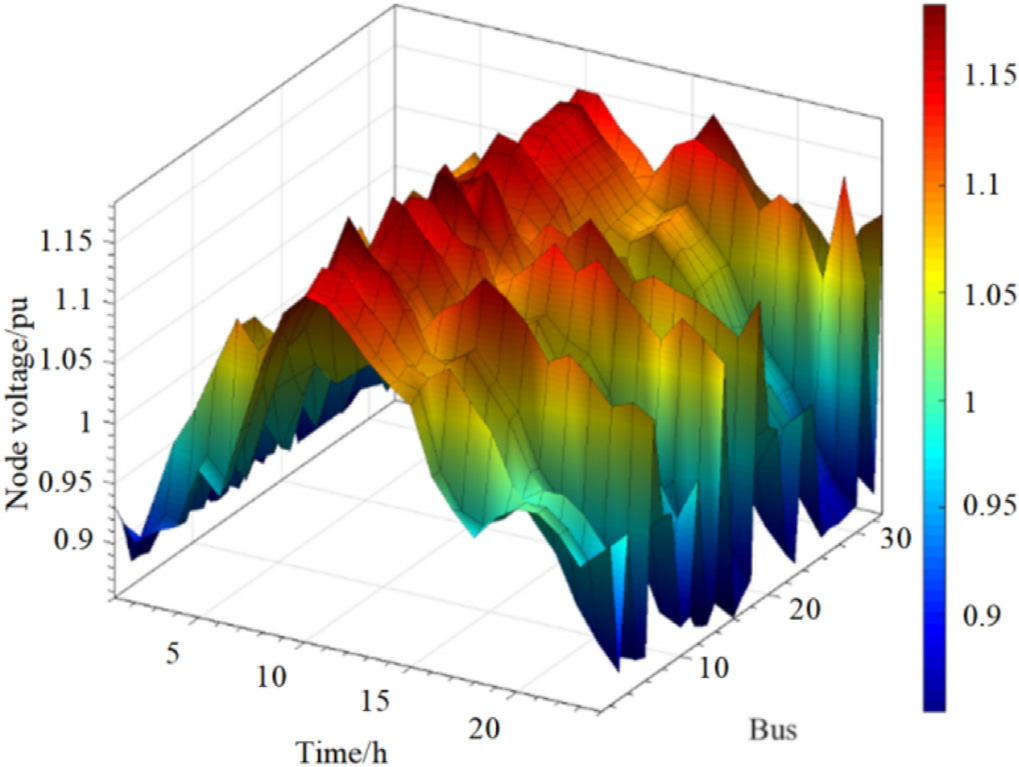
Fig. 9. Voltage profiles of all nodes in the distribution system.
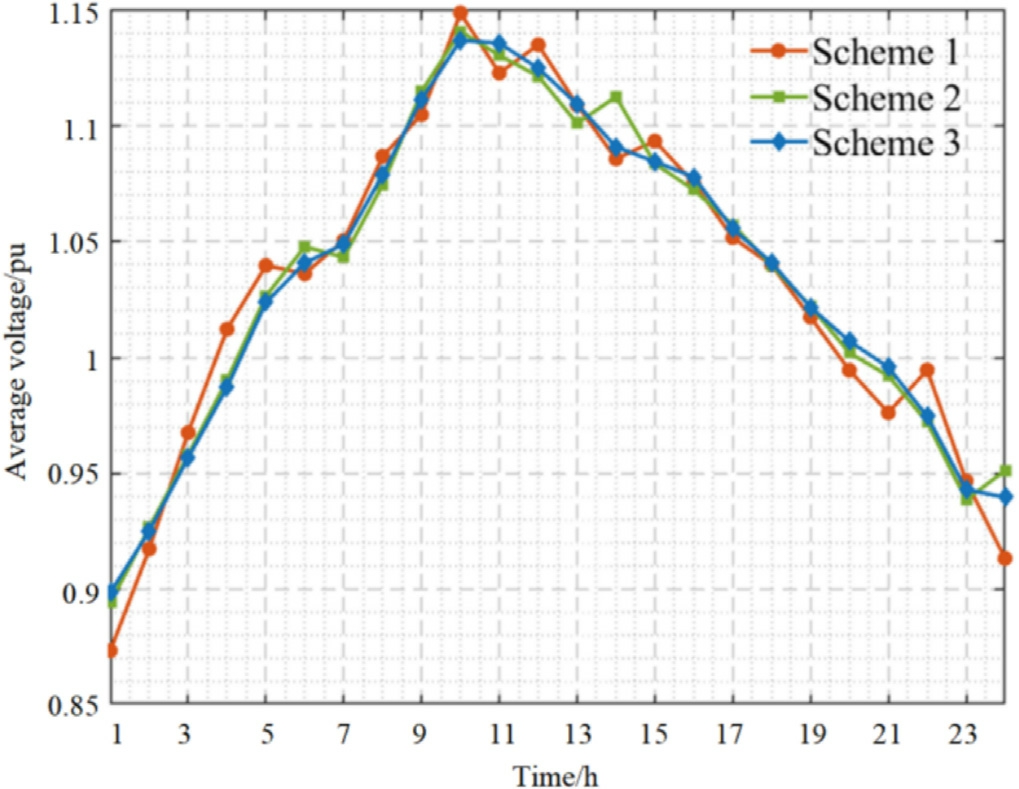
Fig. 10. Average voltage of the distribution system under different schemes.
3.4 Emergency operation analysis
To verify system reliability under extreme conditions,this study simulates the system’s behavior in response to aDG disconnection. The corresponding emergency schematic is presented in Fig. 14. Time-domain simulations are conducted to evaluate overall system robustness via key performance indicators, includi ng voltage stability and power recovery rate under fault conditions.
This manuscript quantitatively assesses the regulation capabilities of different schemes under extreme conditions from two perspectives: fault-point characteristics and system-wide response. For local fault points, the analysis compares the node voltage deviation ratio (i.e., the percentage deviation of node voltage under fault conditions relative to the normal condition) and the node load supply rate (i.e., the ratio of power supplied under fault conditions to that under normal conditions) across the three schemes.The simulation results of the node voltage deviation ratio and node load supply rate are presented in Figs. 14–16.
Before the DG disconnection, the node voltages in all three schemes exhibit no significant deviation compared with normal operating conditions. At the moment of DG disconnection, the voltage deviation ratios for all schemes increase sharply, but their subsequent responses differ considerably. When the DG is disconnected, the voltage deviation ratio in scheme 3 rises to only about 8.5%,substantially lower than the peak values observed in schemes 1 and 2. Furthermore, the deviation in scheme 3 decreases much more rapidly, stabilizing around 2.5%and maintaining the lowest deviation thereafter. These results indicate that, owing to the integration of the multi-voltage-level distribution network and the multiterminal SOP, scheme 3 demonstrates superior performance in both peak voltage deviation suppression and rapid recovery to steady-state operation.
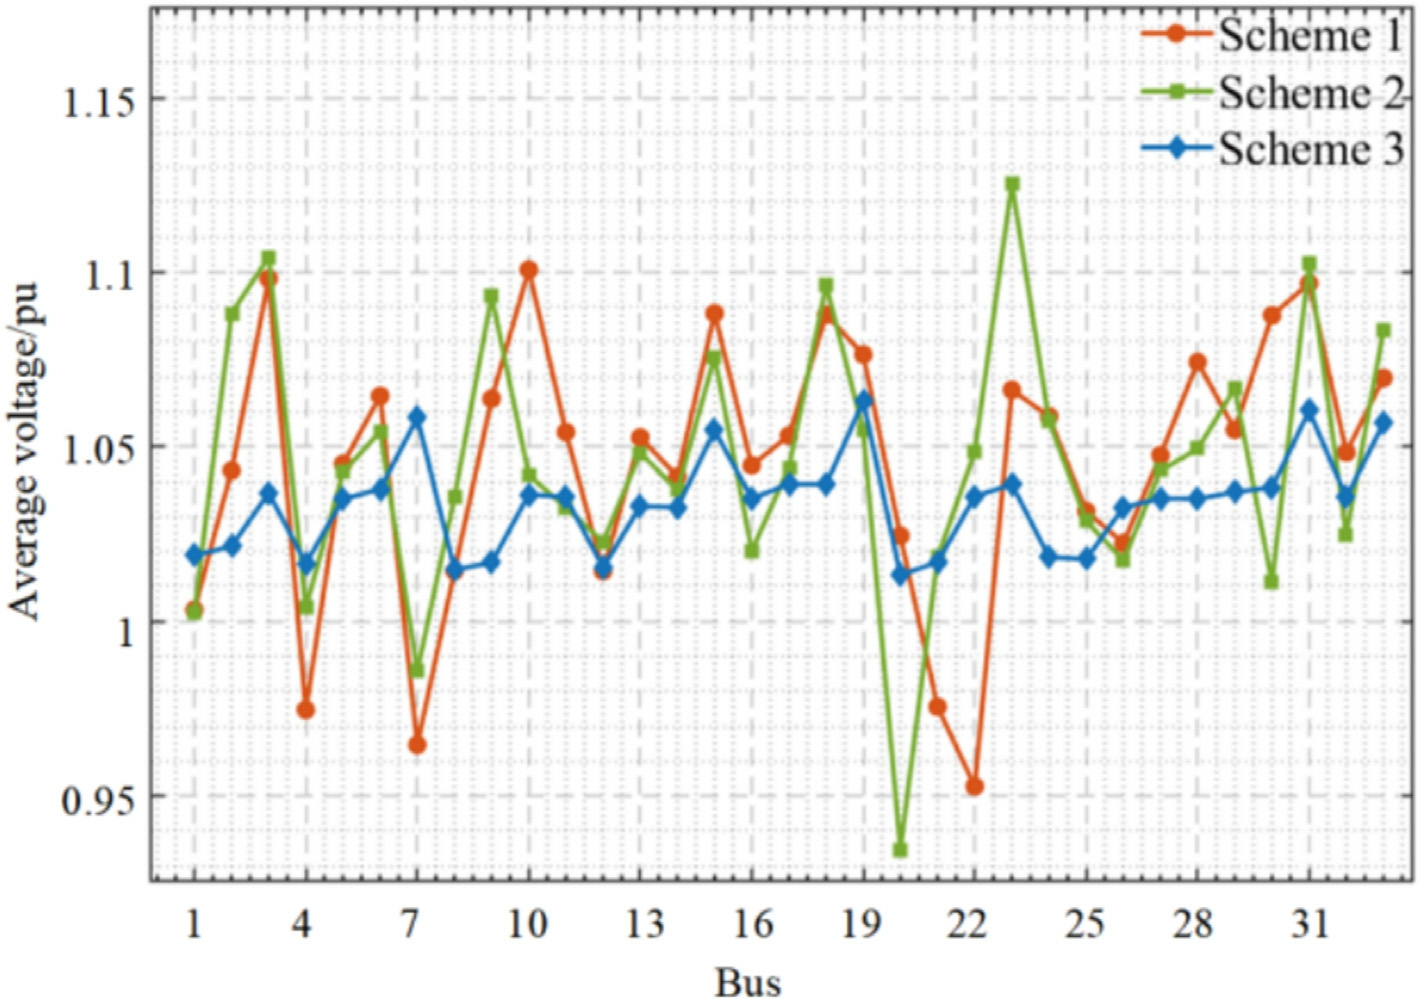
Fig. 11. Average voltage of each node under different planning schemes.
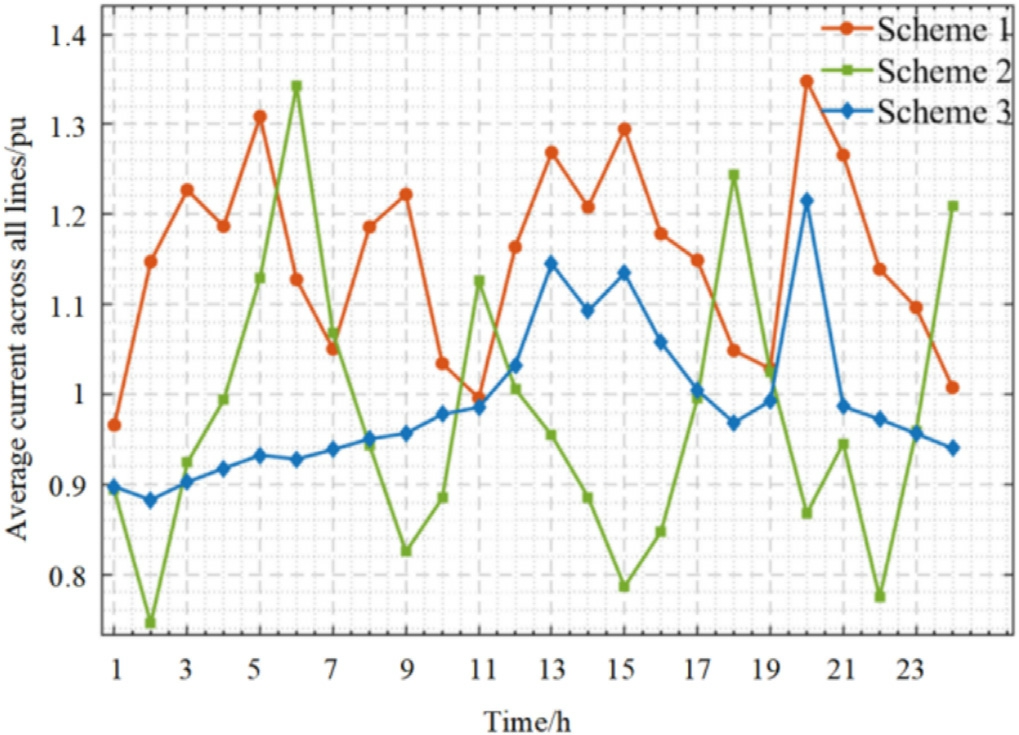
Fig. 12. Average current of distribut ion lines under different schemes.
Similarly, before DG disconnection, the load power supply rates across all three schemes show no significant difference from normal operation. Around the DG disconnection event, all schemes experience a sharp decline, followed by distinct recovery behaviors. When the DG goes off-grid,scheme 3 undergoes the smallest reduction in load power supply rate and exhibits a notably faster recovery.It rapidly returns to approximately 82% and remains stable at a high level, maintaining the highest load power supply rate among the three schemes over time. This behavior confirms that, through the coordinated operation of the multi-voltage-level distribution system and the multiterminal SOP,scheme 3 ensures more reliable and effective load power supply under fault conditions.
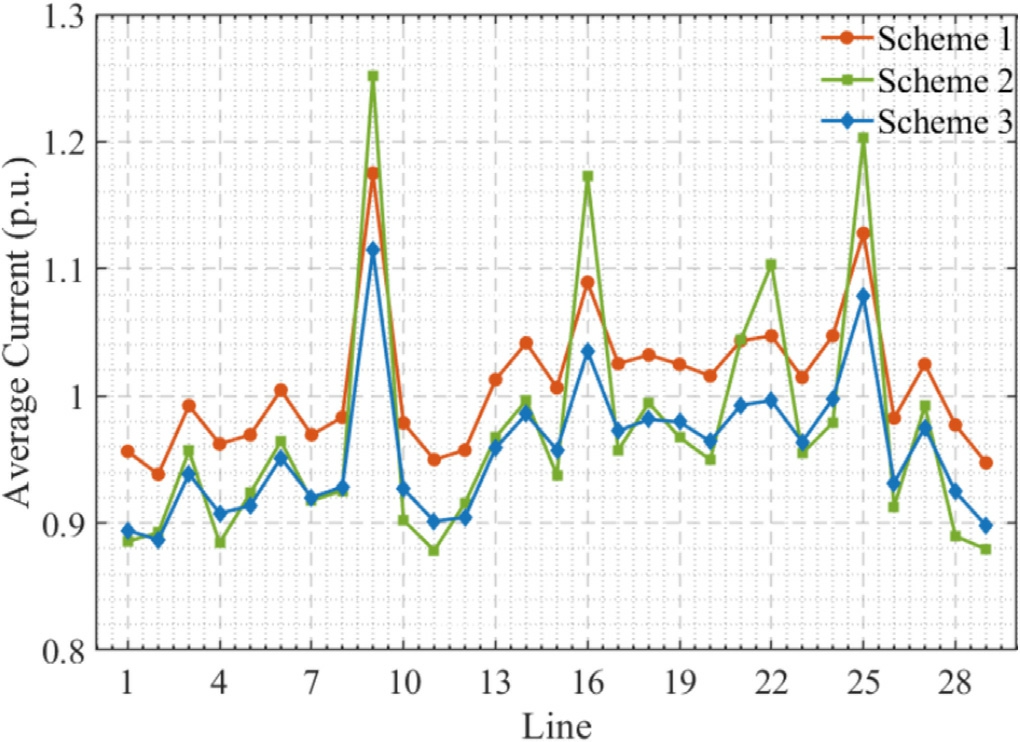
Fig. 13. Average distribution line current under different schemes.
To further assess the overall system recovery capability,the anti-disturbance performance is evaluated from four aspects: recovery time to stability, post fault node voltage deviation, power recovery rate, and fluctuations in heat network supply. The simulation results of the multidimen sional evaluation under all three schemes are shown in Fig. 1 7.
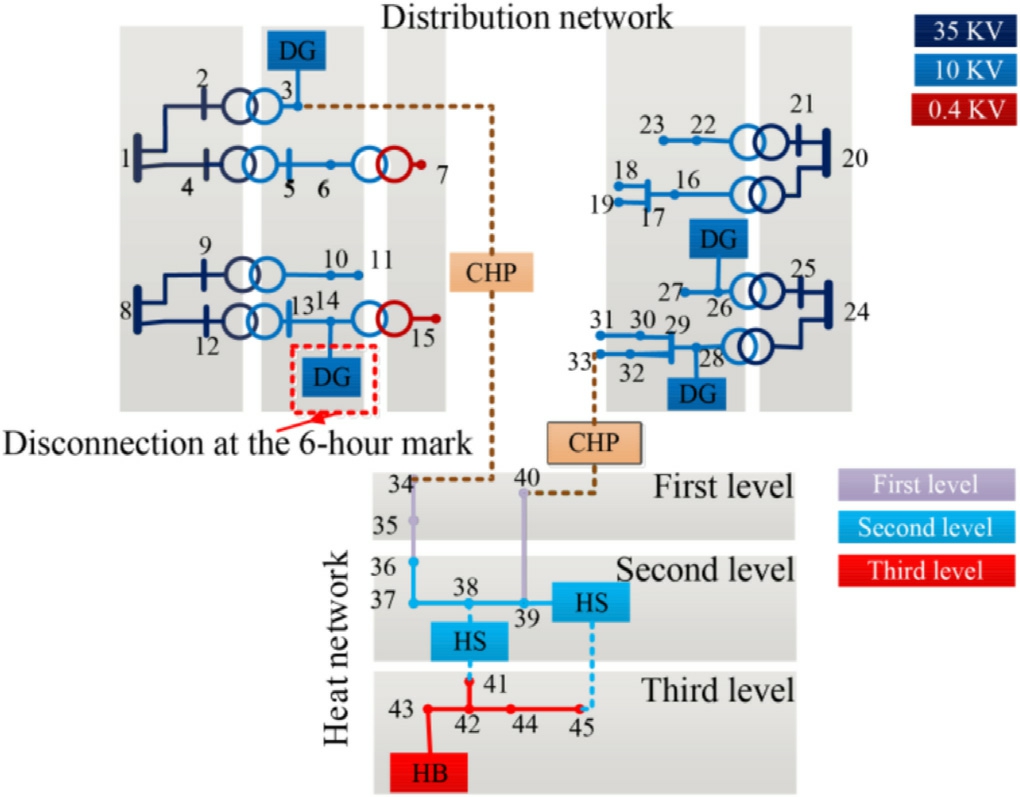
Fig. 14. Emergency operation schematic under DG disconnection.
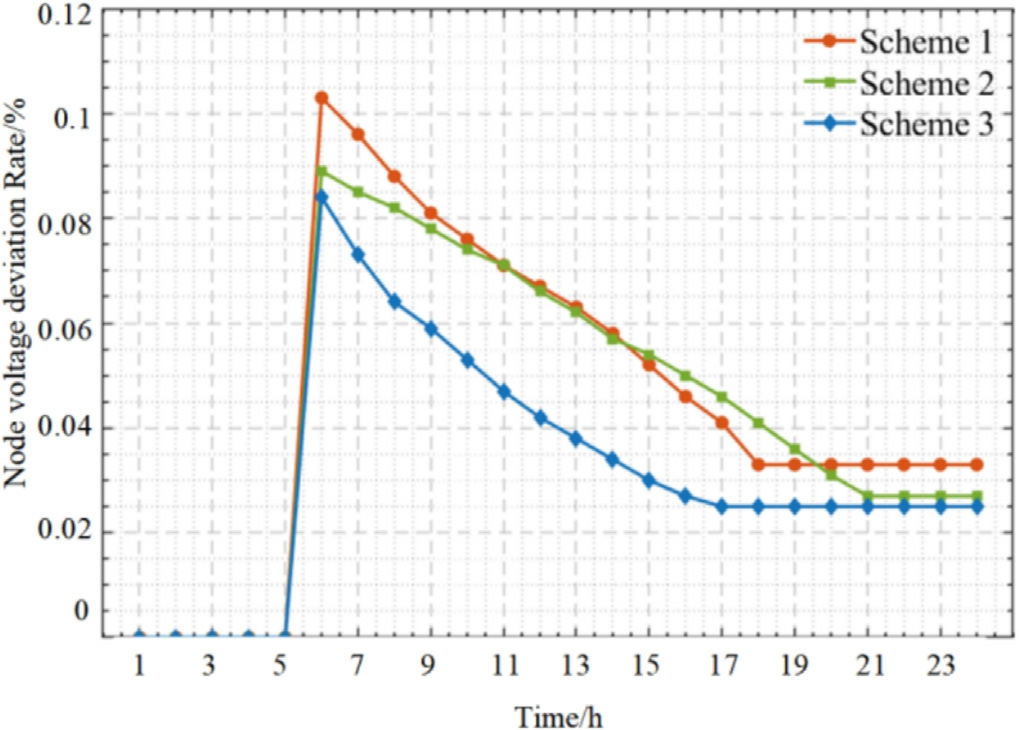
Fig. 15. Node voltage deviation ratios under different schemes.
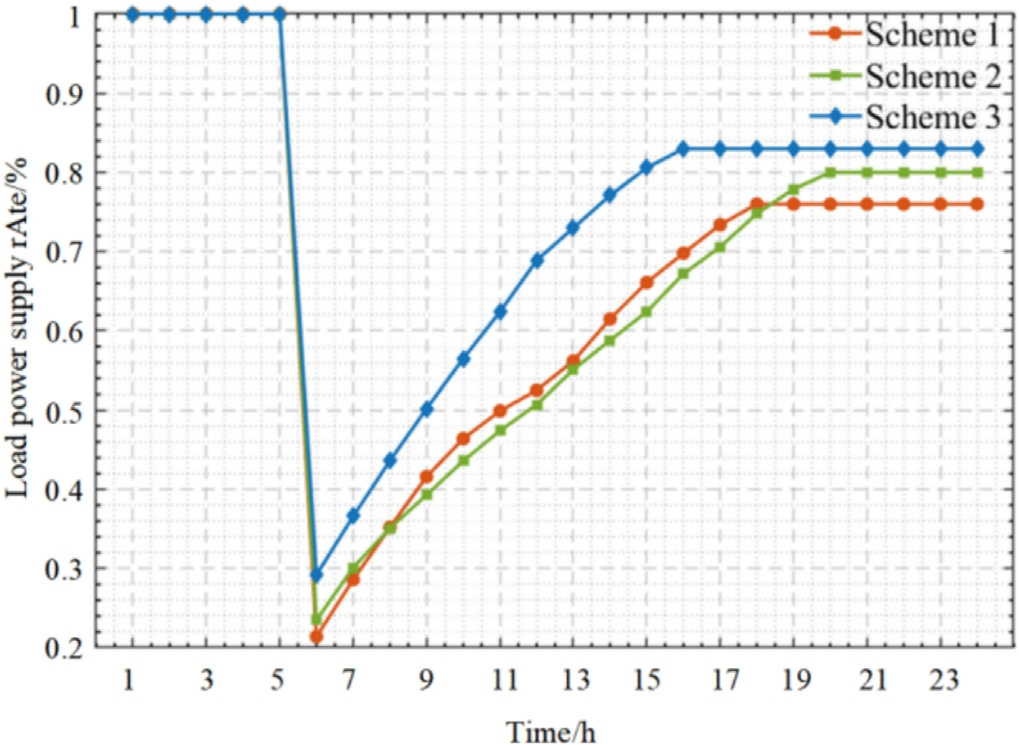
Fig. 16. Node load power supply rates under different schemes.
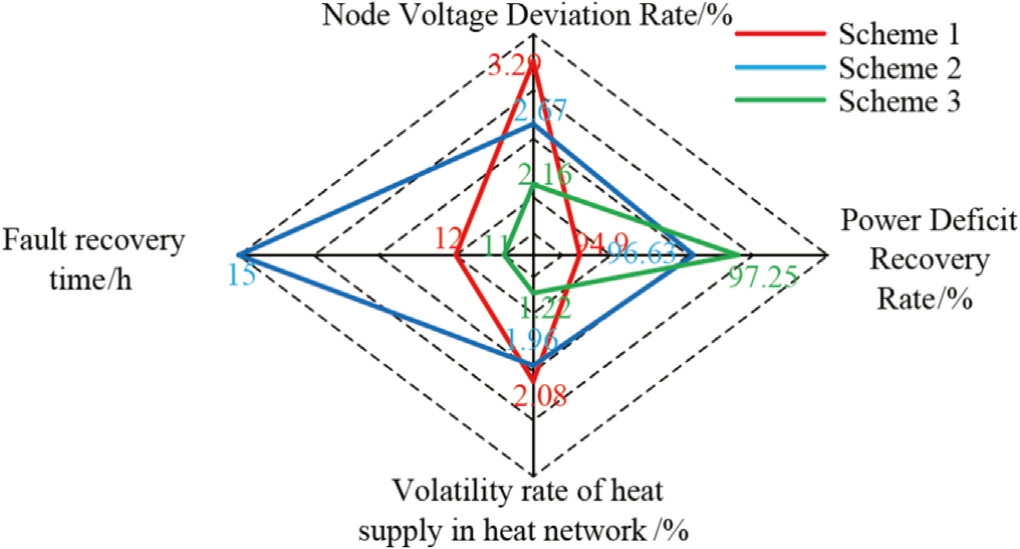
Fig. 17. Multi-dimensional evaluation of system anti-disturban ce performance under different schemes.
As illustrated in Fig. 17, scheme 3 clearly outperforms the other two schemes across all evaluation indicators. In terms of recovery speed, both schemes 1 and 3 achieve faster responses than scheme 2, owing to the efficient regulation capability provided by the multi-terminal SOPs.Moreover, scheme 3 exhibits superior recovery efficiency during contingencies, as the multi-voltage-level distribution network enables multi-level interconnection through the coordinated operation of multi-terminal SOPs.
4 Conc lusions
This paper proposes a coordinated operation strategy for a multi-level multi-energy system based on an energy storage-integrated multi-terminal SOP configuration. By coordinating power flow among the multi-voltage distribution system and the mu lti-level heating system, the proposed approach achieves optimal energy distribution,effectively minimizing transmission losses and enhancing system reliability. Numerical simulations validate the following key findings:
1)Compared with the low-voltage distribution system,the multi-voltage distribution system significantly reduced the average line current, thereby mitigating line overload. The use of multi-terminal SOP effectively optimizes the resource allocation within the distribution system.
2)The implementation of a multi-voltage distribution system not only enhances system safety and operational stability but also reduces the total system cost by21.48%.
3)The adoption of the multi-terminal SOP configuration further increases system flexibility, optimizes power flow distribution, and reduces the total cost by5.17%.
Further research will focus on incorporating AI-driven distributed control methods, such as multi-agent deep reinforcement learning, to enable adaptive, style="font-size: 1em; text-align: justify; text-indent: 2em; line-height: 1.8em; margin: 0.5em 0em;">CRediT authorship contribution statement
Feng Bi: Writing – review & editing, Writing – original draft, Visualization, Validation, Software, Resources,Data curation. Da Xu: Writing – review & editing, Writing– original draft, Supervision, Resour ces, Methodology,Conceptualization. Ziyi Bai: Writing – review & editing,Supervision, Methodology, Conceptualization. Dongjie Shi:Writing–review&editing,Resources,Data curation.
Declaration of competing interest
The authors declare the following financial interests/personal relationships which may be considered as potential competing interests: Dongjie Shi is currently employed by Wuhan Power Supply Company of State Grid Hubei Electric Power Co., Ltd. The other authors declare that they have no known competing financial interests or personal relationships that could have appeared to influence the work reported in this paper.
Acknowledgments
The authors gratefully acknowledge the support of the National Natural Science Foundation of China under Grant 62203413 and 62503156.
Appendix A
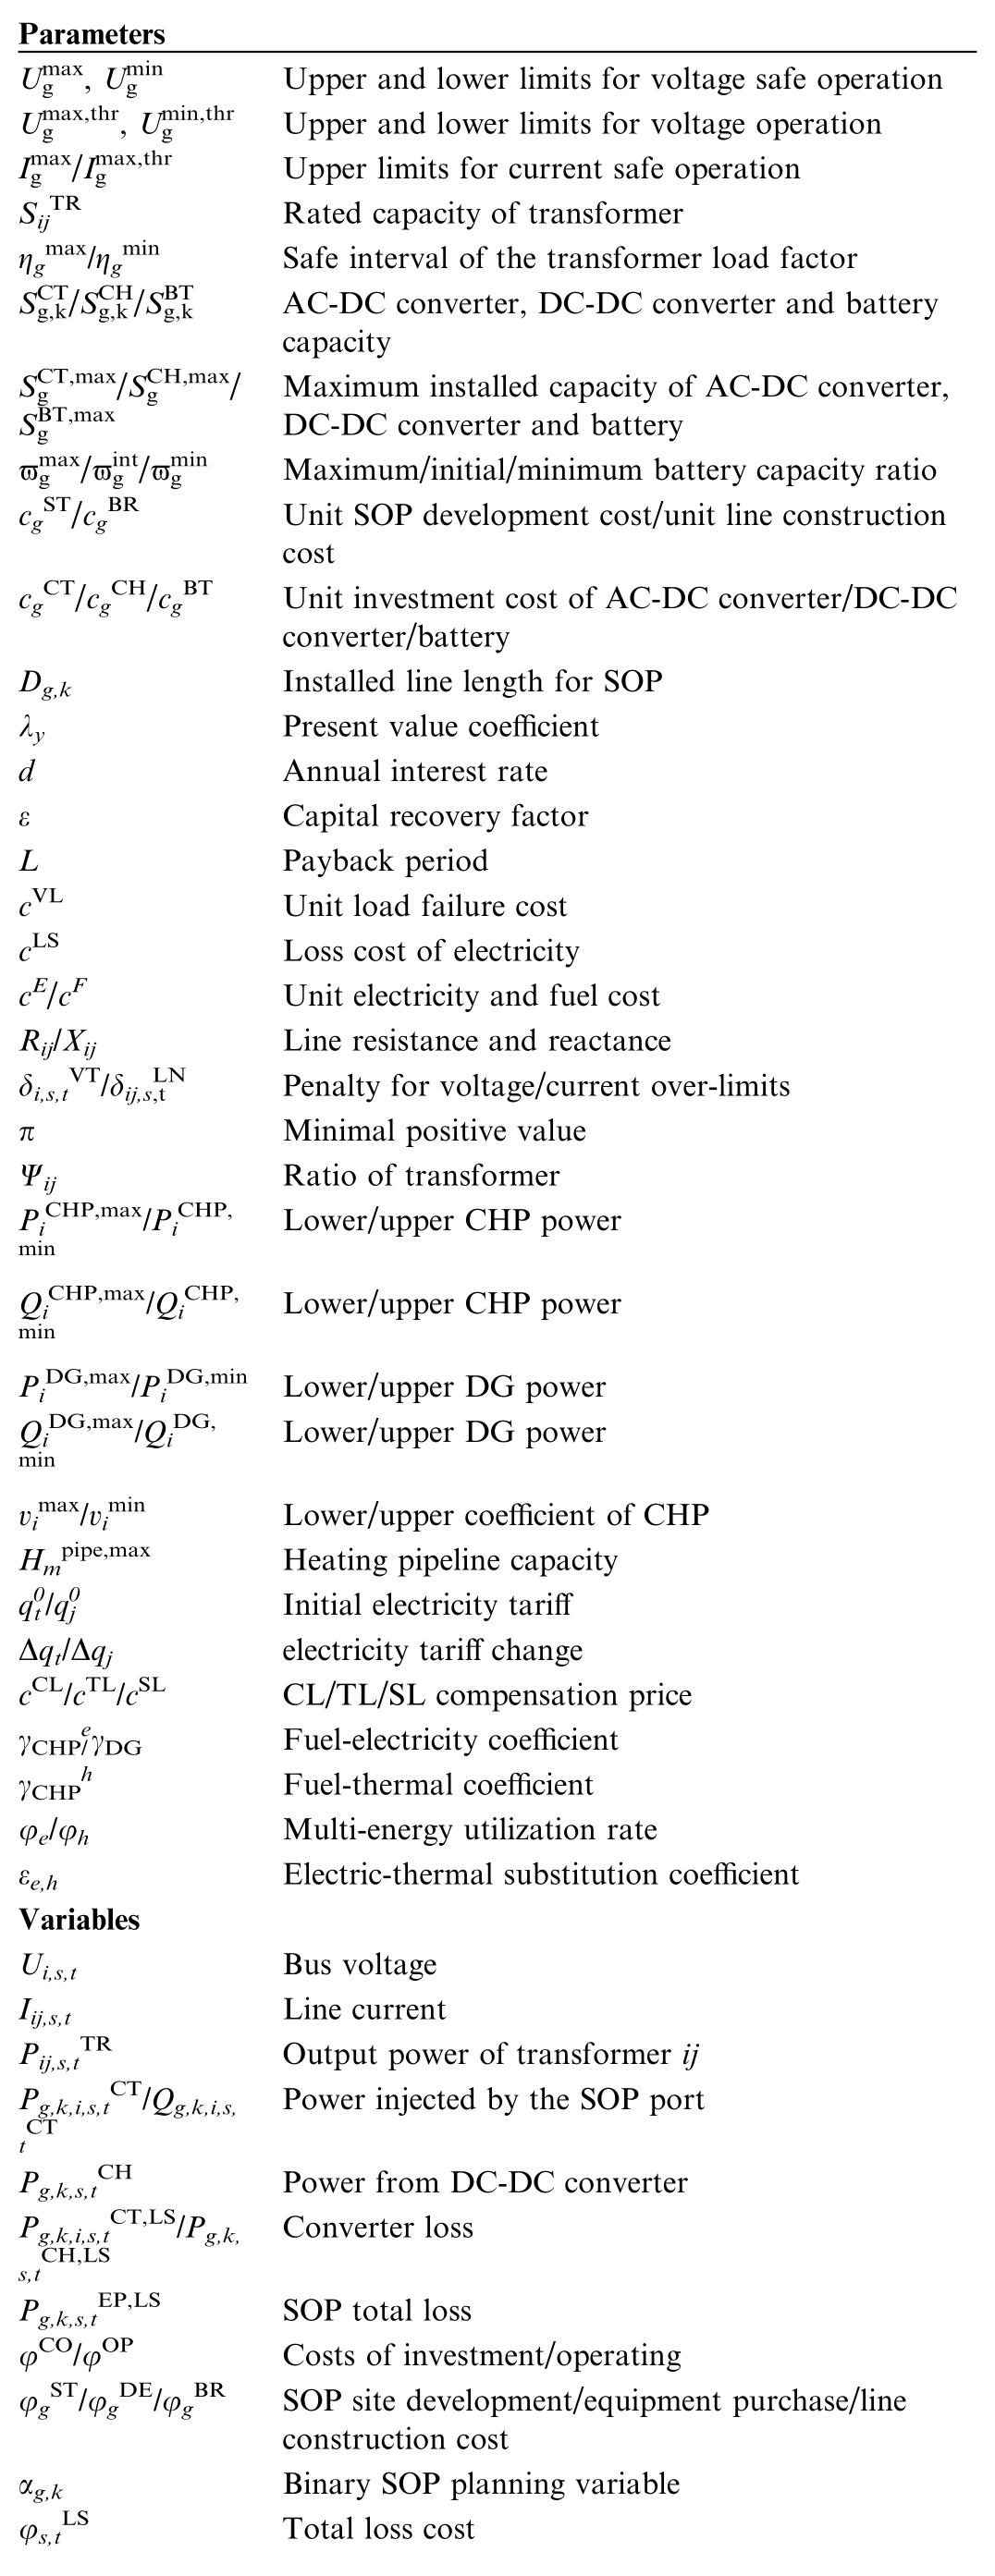
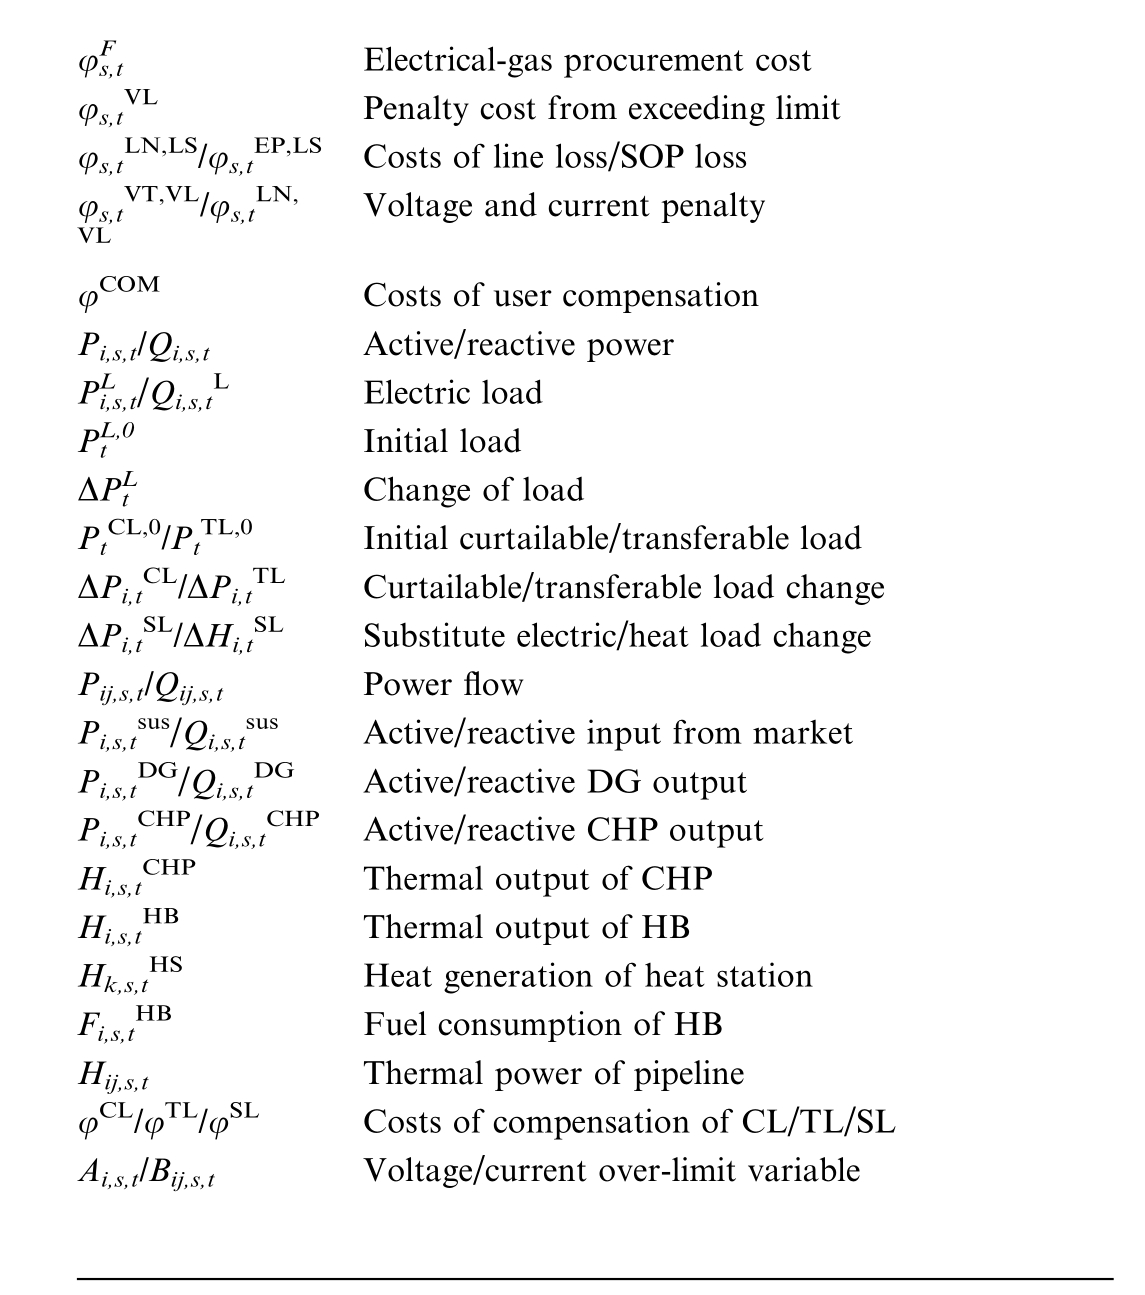
Table A1 Nomenclature.
References
[1]Z. Bai, D. Xu, B. Zhou, X. Yang, H. Yang, J. Liu, Computing optimal resilience-oriented operation of distribution systems considering heterogenous consumer-side microgrids, IEEE Trans.Cons. Electr. (2024), https://doi.org/10.1109/TCE.2024.3474769.
[2]Z. Huang, D. Xu, X. Yang, H. Yang, Z. Bai, D. Shi, Resilient planning of multi-type remote-controlled switches and soft open points in distribution systems under thunderstorm disasters,Cyber-Phys. Energy Syst. (2025).
[3]D. Xu, S. Xiang, Z. Bai, J. Wei, M. Gao, Optimal multi-energy portfolio towards zero carbon data center buildings in the presence ofproactive demand response programs, Appl. Energy 350 (2023)121806.
[4]J. Wang, X. Jin, H. Jia, et al., Electricity-hydrogen-heat coupled sharing for multi-energy buildings: a game theoretic approach,Appl. Energy 398 (2025) 126350.
[5]X. Yang, Z. Song, J. Wen, L. Ding, M. Zhang, Q. Wu, S. Cheng,Network-constrained transactive control for multi-microgridsbased distribution networks with soft open points, IEEE Trans.Sustain. Energy 14 (2023) 1769–1783.
[6]X. Yang, Z. Zhou, Y. Zhang, J. Liu, J. Wen, Q. Wu, S.-J. Cheng,Resilience-oriented co-deployment of remote-contr olled switches and soft open points in distribution networks, IEEE Trans.Power Syst. 38 (2022) 1350–1365.
[7]M.A. Saaklayen, M.N.S.K. Shabbir, X. Liang, et al., A two-stage multi-scenario optimization method for placement and sizing of soft open points in distribution networks, IEEE Trans. Ind. Appl.59(3) (2023) 2877–2891.
[8]Q. Qin, B. Han, G. Li, K. Wang, J. Xu, L. Luo, Capacity allocations of SOPs considering distribution network resilience through elastic models, Int. Electr. Power Energy Syst. 134 (2022)107371.
[9]Z. Huang, Y. Xu, L. Chen, et al., Coordinated planning method considering flexible resources of active distribution network and soft open point integrated with energy storage system, IET Gener.Transm. Distrib. 17 (23) (2023) 5273–5285.
[10]P. Li, J. Ji, S. Chen, et al., Multi-stage expansion planning of energy storage integrated soft open points considering tie-line reconstruction, Prot. Control Mod. Power Syst. 7 (1) (2022) 45.
[11]X. Yang, Z. Li, L. Ding, et al., Reconfigurable converter-formed soft open point-assiste d dynamic restoration for distribution systems with cold-load pickup, IEEE Trans. Sustain. Energy(2025), https://doi.org/10.1109/TSTE.2025.3532911.
[12]H. Zhou, G. Xiong, X. Fu, et al., Joint optimization of location and topology of multi-terminal soft open point in distribution networks, Int. Electr. Power Energy Syst. 169 (2025) 110721.
[13]D. Xu, A. Hu, C.S. Lam, X. Yang,X.Jin,Cooperative planning of multi-energy system and carbon capture, utilization and storage,IEEE Trans. Sustain. Energy 15 (4) (2024) 2718–2732.
[14]X. Liu, J. Wu, N. Jenkins, A.Bagdanavicius,Combined analysis of electricity and heat networks, Appl.Energy 162(2016) 1238–1250.
[15]D. Xu, Q. Wu, B. Zhou, C. Li, L.Bai,S.Huang,Distributed multienergy operation of coupled electricity, heating, and natural gas networks, IEEE Trans. Sustain. Energy 11 (4) (2019) 2457–2469.
[16]C. Wang, S. Chen, J. Zhao, et al., Coordinated scheduling of integrated electricity, heat, and hydrogen systems considering energy storage in heat and hydrogen pipelines, J Energy Storage 85(2024) 111034.
[17]S. Zhang, G. Pan, B. Li, et al., Multi-timescale security evaluation and regulation of integrated electricity and heating system, IEEE Trans. Smart Grid 16 (2) (2025) 1088–1099.
[18]X. Wang, X. Li, X. Li, et al., Soft open points based load restoration for the urban integrated energy system under extreme weather events, IET Energy Syst. Integr. 4 (3) (2022) 335–350.
[19]K. Wang, Y. Xue, Y. Zhou, Z. Li, X. Chang, H. Sun, Distributed coordinated reconfiguration with soft open points for resilienceoriented restoration in integrated electric and heating systems,Appl. Energy 365 (2024) 123207.
[20]S. Wang, F. Luo, C. Wang, et al., Collaborative configuration optimization of soft open points and hydrogen-ba sed distributed multi-energy stations considering spatiotemporal coordination and complementarity,J.Mod Power Syst.Clean Energy(2025),https://doi.org/10.35833/MPCE.2024.001279.
[21]W. Yao, C. Wang, M. Yang, et al., A tri-layer decision-making framework for IES considering the interaction of integrated demand response and multi-energy market clearing, Appl. Energy 342 (2023) 121196.
[22]Y. Wang, P. Dong, M. Xu, et al., Research on collaborative operation optimization of multi-energy stations in regional integrated energy system considering joint demand response, Int.Electr. Power Energy Syst. 155 (2024) 109507.
[23]Z. Yang, L. Cheng, H. Min, et al., Distributionally robust optimization-based scheduling for a hydrogen-coupled integrated energy system considering carbon trading and demand response,Global Energy Interconnect. 8 (2) (2025) 175–187.
[24]D. Xu, F. Zhong, Z. Bai, et al., Real-time multi-energy demand response for high-renewable buildings, Energ. Build. 281 (2023)112764.
[25]H. Lund, P.A. Østergaard, P. Sorknæs, et al., District heating in clean energy systems, Nat. Rev. Clean Technol. (2025) 1–15.
[26]C. Wang, R. Wang, H. Ji, P. Yang, L. Zhao,G.Song,J.Wu,P.Li,Coordinated allocation of SOP in multi-voltage distribution network, Proc. CSEE 44 (17) (2024) 6831–6843.
[27]M. Deakin, Multiplexing power converters for cost-effective and flexible soft open points, IEEE Trans. Smart Grid 15 (1) (2023)260–271.
[28]Y. Wang, Y. Li, Y. Zhang, et al., Optimized op eration of integrated energy systems accounting for synergistic elect ricity and heat demand response under heat load flexibilit y, Appl.Therm. Eng. 243 (2024) 122640.
[29]K. Wang, Y. Xue, Q. Guo, et al., A coordinated reconfiguration strategy for multi-stage resilience enhancement in integrated power distribution and heating networks, IEEE Trans. Smart Grid 14(4)(2022) 2709–2722.
Received 3 August 2025;revised 23 September 2025; accepted 28 September 2025
*Corresponding author
at: School of Automation, China Universit y of Geosciences, Wuhan 430074, PR China.
E-mail addresses: 1202421754bf@cug.edu.cn (F. Bi), xuda@cug.edu.cn (D. Xu), baiziyi@hbut.edu.cn (Z. Bai), 624614865@qq.com (D. Shi).
https://doi.org/10.1016/j.gloei.2025.09.002
2096-5117/© 2025 Global Energy Interconnection Group Co. Ltd. Publishing services by Elsevier B.V. on behalf of KeAi Communications Co. Ltd.This is an open access article under the CC BY-NC-ND license(http://creativecommons.org/licenses/by-nc-nd/4.0/).

Feng Bi received the B.Eng. degree in Electrical Engineering and Automation from University of Jinan in 2024. He is currently pursuing the M.S. degree at China University of Geosciences, Wuhan. His main research interests focus on the operation and planning of distribution systems.