
0 Intr oduction
Establishing a grid dominated by renewable energy is an inevitable requirement for advancing the clean energy transition and the low-carbon restructuring of power systems [1]. The large-scale integration of variable renewable energy generation reduces g rid inertia and frequency regulation capabilities [2,3], while also exacerbating three critical operational chall enges: increased frequency deviation magnitudes, inter-area power flow fluctuations, and escalations in Area Control Error[4]. Of particular significance is that the dynamic coupling of bidirectional supply–demand uncertainties further amplifies these challenges: On the supply side, the output of wind and photovoltaic systems is subject to meteorological volatility, leading to inherent fluctuations in their power generation. On the demand side, coupled scenarios—such as unordered electric vehicle charging and self-consumption of distributed photovoltaic—result in increased prediction errors for both the supply and demand sides,ultimately undermining the operational paradigm of traditional rigid power balance, which relies on ‘‘deterministic power supplies tracking deterministic loads”. This poses significant challenges to the secure and stable operation of power systems [5].
In modern power systems characterized by significant renewable energy penetration, the growing uncertainty in generation and declining availability of frequency regulation resources demand proactive attention to frequency stability. To harmonize frequency security with dispatch optimization, embedding dynamic frequency constraints into optimization scheduling models becomes imperative.Early effo rts by Restrepo et al. pioneered the integration of frequency regulation constraints into unit commitment(UC) models, yet their approach focused solely on quasisteady-state conditions, neglecting transient dynamics at frequency nadirs [6]. Subsequent work by Chang et al.introduced nadir frequency constraints and reserve allocation in UC, though their reliance on historical data for post-disturbance regulation introduced statistical biases[7]. Notably, Chavez et al. formulated an optimal power flow model with governor rate constraints to enhance primary frequency regulation adequacy during nondispatchable generator integration,albeit overlooking load damping effects [8]. Wen et al. advanced this paradigm by incorporating battery energy storage (BES)-enabled dynamic frequency support into UC models, addressing real-time frequency deviations [9]. Ahmadi et al. further developed a multi-machine frequency response model with analytical nadir constraints, enab ling high renewable penetration through piecewise linearization of nonlinear dynamics [10]. Addressing inertia challenges, Teng et al.designed a stochastic UC framework with inertiadependent fast frequency response requirements for wind-dominated grids [11]. Paturet et al. investigated low-inertia UC problems by embedding frequency stability constraints into stochastic optimization[12], while Sokoler et al. introduced reserve planning models for isolated systems to maintain frequency thresholds during contingencies [13].
Table 1 compares current uncertain optimization methods. Traditional approaches struggle to adapt to the uncertainties and dynamic characteristics of high-renewable power systems. The traditional economic dispatch based on the rigid power balance assumption treats supply and load as deterministic variables and enforces static balance between power supply and load. Yet under bidirectional uncertainties, this assum ption fails to capture the dynamic fluctuations of supply and load,which will directly exacerbate frequency security risks. While robust optimization ensures security in extreme scenarios, its conservatism often leads to economic inefficiencies [14–16]. Stochastic programming, relying on predefined probability distributions, faces limited adaptability due to the dynamic evolution of source-load distributions in practice [17,18]. In contrast, the proposed model transcends distributional assumptions via the Wasserstein dist ance,enabling precise quantification of source-load probabilistic deviations.Moreover, by incorporating dynamic frequency response models into constraints, it better caters to the complex operational demands of high-renewable power systems compared to existing methods. In response, this paper introduces the concept of probability measure. This concept is currently mostly used in financial and economic fields.For example,under the assumption that asset prices follow geometric Brownian motion, Anderson et al. [19]and Hansen and Sargent[20] used relative entropy to characterize uncertainties in mean returns. Liu et al. [21] proposed a new measurement method to overcome the limitations of equivalence between probability distributions and study uncertainties in volatility. However, no current research has applied probability measures to the field of power system scheduling. Therefore, this paper attempts to find a measurement index with fewer restrictions on model probability distributions to quantify differences between different probability models, thereby more comprehensively characterizing uncertainties.
In light of this, this study develops an optimized operational framework incorporating frequency stability constraints and stochastic supply–demand equilibrium analysis, specifically addressing power systems with high penetration of renewable energy and power electronic devices, as shown in Fig. 1. The innovations include:
1)Formulation of a hybrid frequency regulation framework synergizing renewable generation with battery storage systems, where multi-machine dynamic responses are converted into equivalent singlemachine representations. Frequency security thresholds are quantified through inverse Laplace transformations, enabling the conversion of transient frequency limits into operational power boundaries via piecewise linearization techniques.
2)Development of probabilistic supply–demand equilibrium equations incorporating wind and load forecast uncertainties, with Wasserstein distance measurements quantifying distributional discrepancies between generation availability and consumption patterns.
3)Implement preventive frequency constraints in dayahead scheduling, creating a multi-criteria optimization architecture that balances stochastic power matching, operational economics, and renew able curtailment penalties. The proposed framework is resolved through objective-oriented programming and validated via numerical simulations.
The remainder of this paper is organized as f ollows:Section 1 develops a hybrid frequency regulation framework integrating wind farms and battery energy s torage(BES). Section 2 presents a probabilistic power balance equation for the source-load relationship based on the Wasserstein metric. Section 3 proposes a multi-objectiveoptimization dispatch model that integrates frequency security constraints wi th a probabilistic power balance model.Section 4 conducts a case study,and Section 5 presents the conclusi ons.
Table 1 Comparison of uncertain ty-aware dispatch methods.
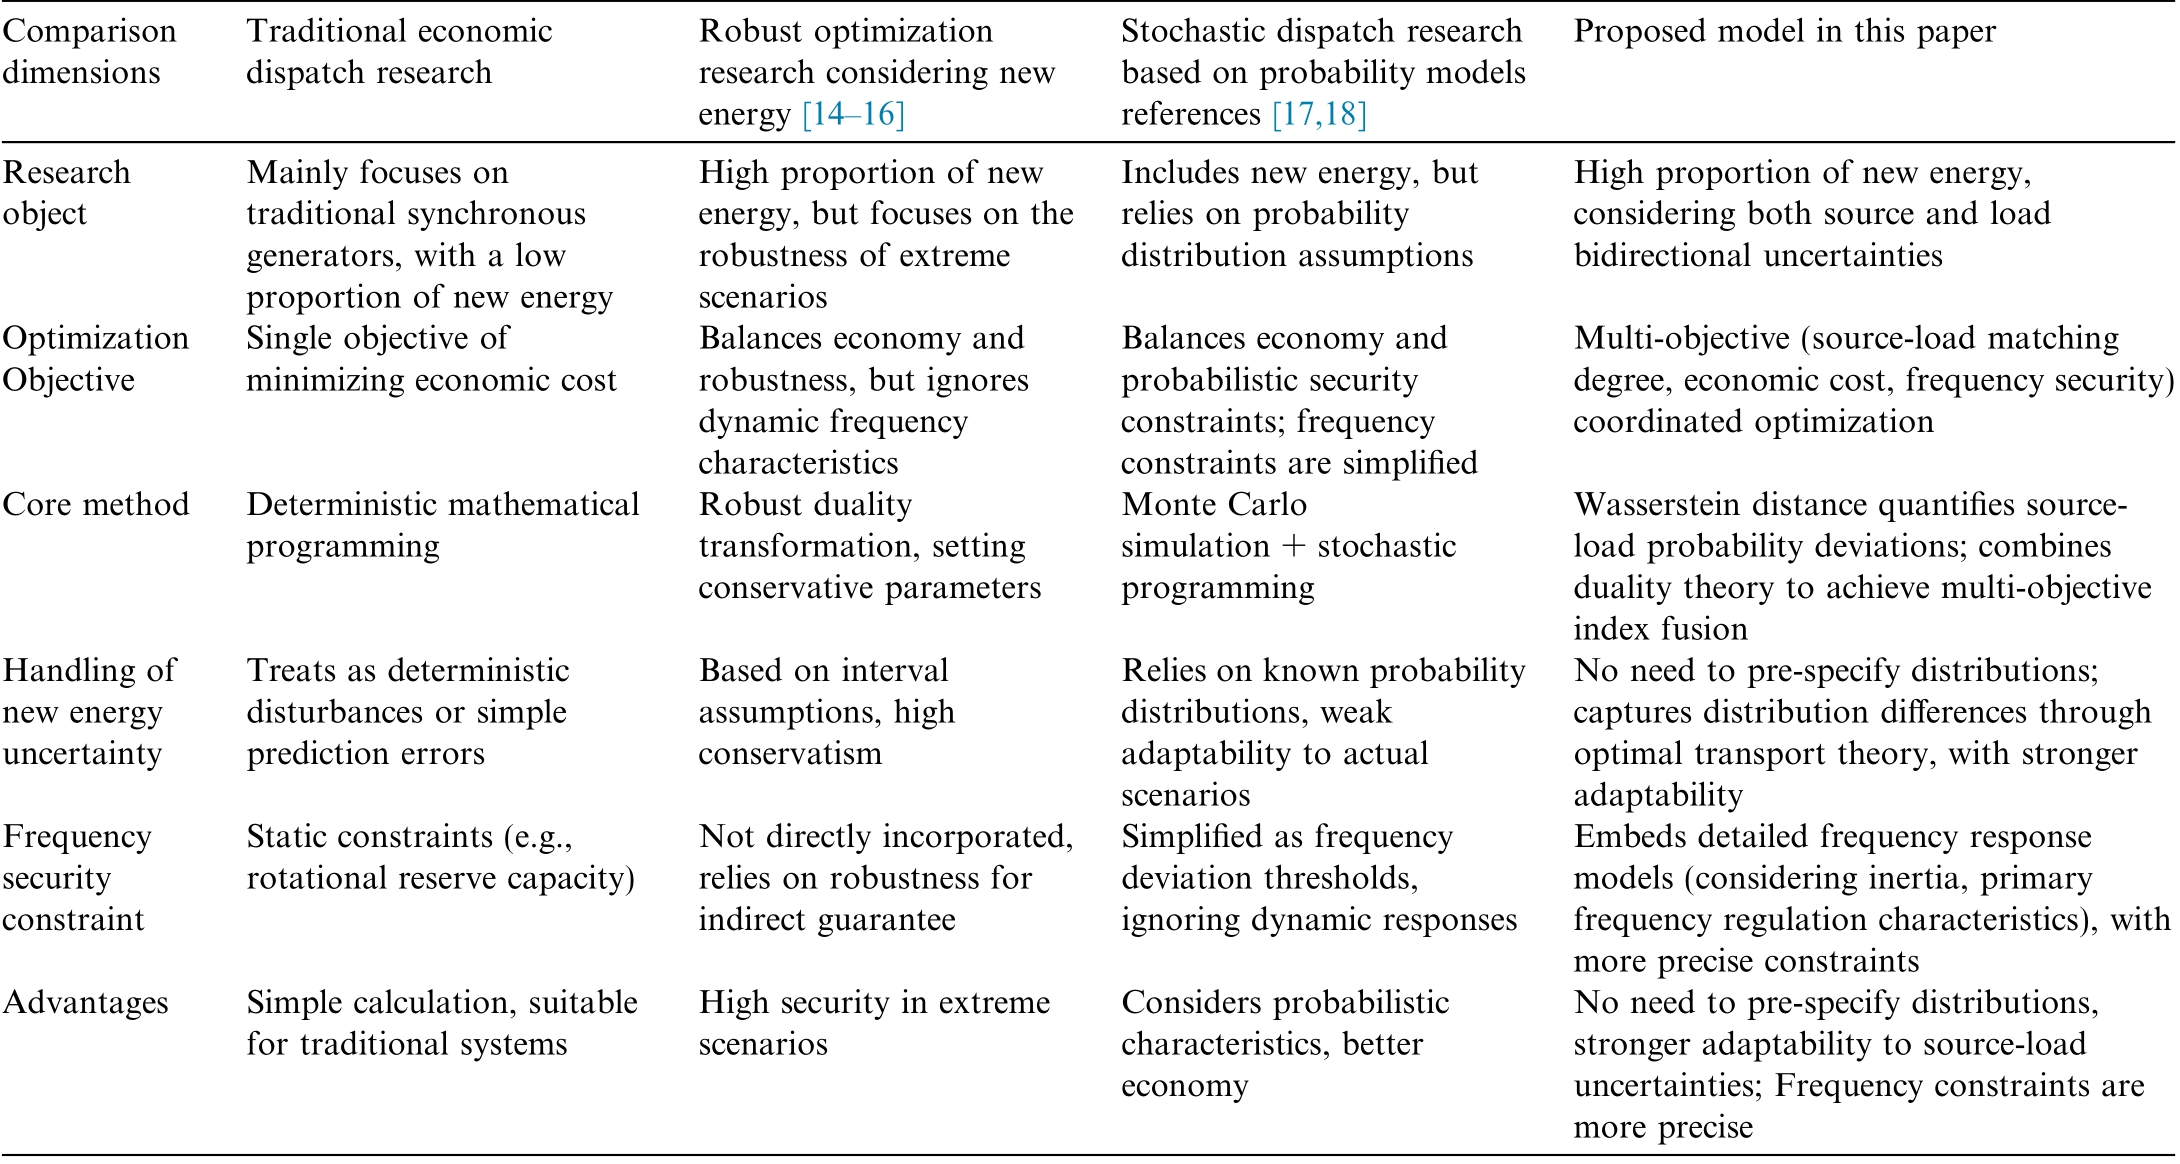
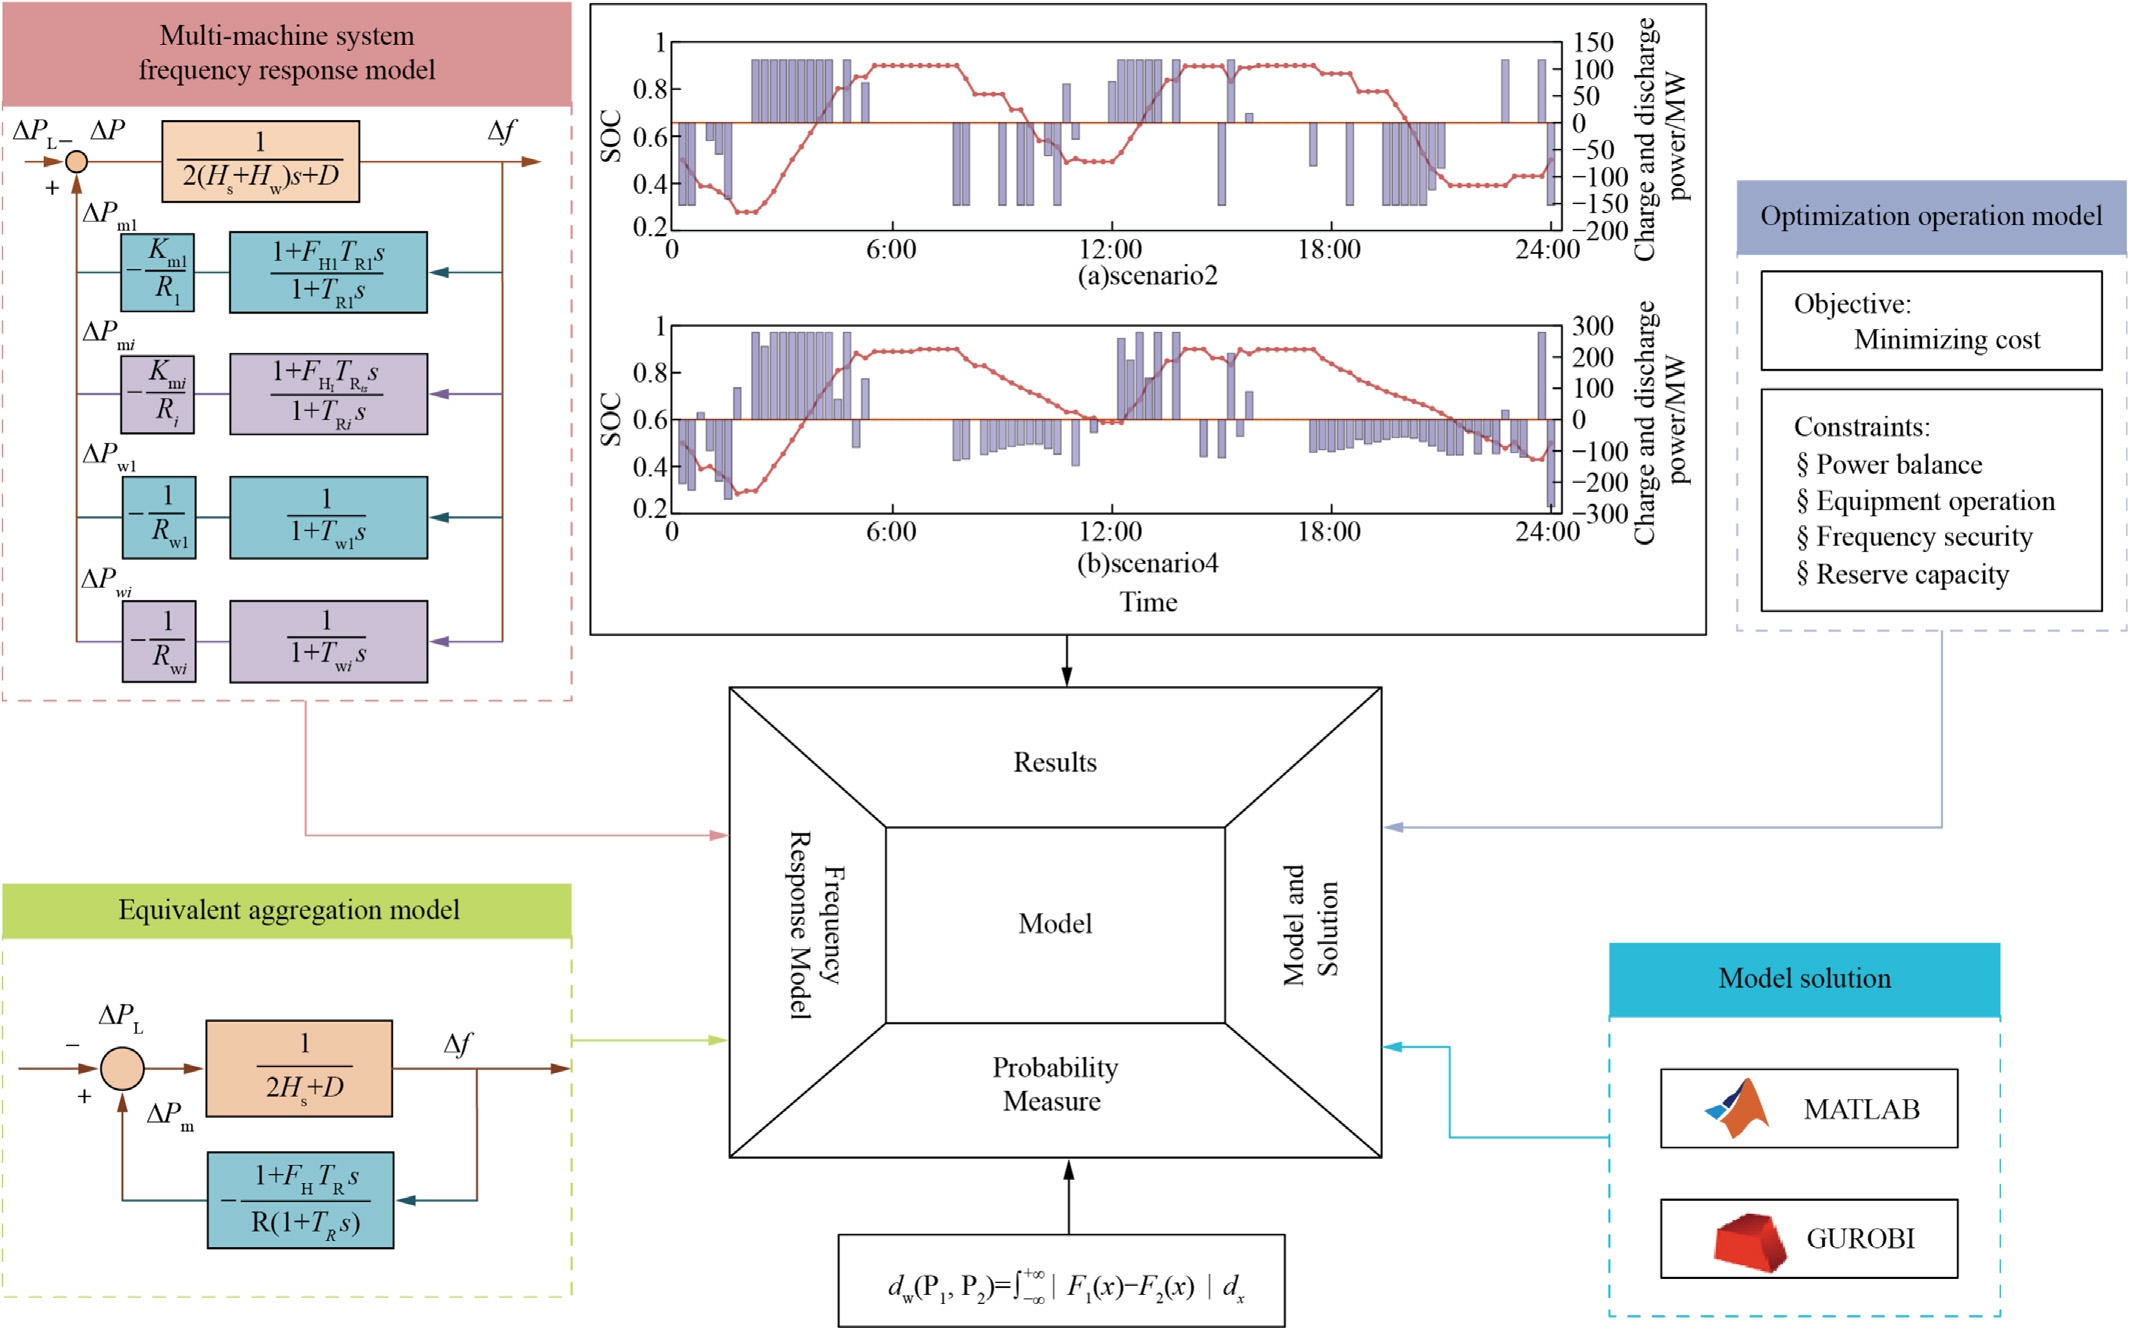
Fig. 1. Graphical abstract.
1 Power system frequency response model
In conventional power systems, frequency regulation is primarily achieved through synchronous generator operations. The increasing capacity of renewable energy, however, has substantially reduced the operational dominance of conventional synchronous infrastructure.To preserve grid frequency stability, the grid integration of renewable energy plants must adopt grid-forming power electronics control architectures,while BES serve as essential devices for dynamic frequency regulation support.This paper consequently develops dynamic frequency regulation frameworks encompassing both generation units and BES configurations.
1.1 Frequency response model of generator
1.1.1 Synchronous generation units
Using a conventional generation system as a representative case and adopting the center-of-inertia framework, the transient frequency characteristics of synchronou s generators can be mathematically formulated through the electromechanical swing equation:

where, H sis the inertia time constant of the power syst em;D is the load damping factor;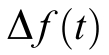 denotes the frequency deviation;
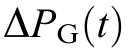 is the primary frequency modulation output of the synchronous unit; ΔPLrepresents the power imbalance of the system. All system parameters in this study are normalized using per-unit systems, establishing the reference power as the current load and configuring the nominal frequency at 50 Hz.
1.1.2 Renewable energy generator sets
Based on the grid-forming control strategy, the renewable energy unit can simulate the frequency regulation of synchronous generators, thereby providing necessary inertia support for the power system. Taking the wind turbi ne as an example, its response characteristics while employing the droop control strategy to participate in system frequency regulation are presented in (2):

where, Rwis the droop control coefficient of the wind turbine; Tw is the time constant of the inverter;ΔPw is the primary frequency control power of the wind turbine.
1.1.3 Frequency response characteristics of multi-machine systems
Considering the participation of conventional synchronous generators and wind turbines in the system frequency regulation process, the frequency response model of the multi-machine system is illustrated in Fig. 2.
In Fig. 2, Kmiis the gain coefficient of the ith synchronous unit; FHiis the work proportional coefficient of the high-pressure cylinder of the ith synchronous unit;Ri is the droop coefficient of the ith synchronous unit; and TRiis the reheater time constant of the ith synchronous unit.
As illustrated in Fig. 2, the dynamic response characteristics of the system under frequency regulation involving multiple generator units can be modeled as:

where, H wis the inertia time constant of the wind turbines;ΔPw is the output of the wind turbines. ΔPLis 10% of the load in the corresponding time period.
1.2 Frequency response model of BES
The transient response characteristics of BES synergize with the frequency response model of the multi-machine system, providing mechanistic support for the dynamic constraints in the subsequent probabilistic power balance model. The variation processes of power imbalance and energy storage power during BES participation in system frequency response are shown in Fig. 3 and Fig. 4,respectively.
When the system experiences a power disturbance ΔPL at time t1,the energy storage immediately ramps up its output to the maxi mum power,reducing the power imbalance to ΔPL At time t2,after passing through the deadband, the synchronous units initiate primary frequency regulation, eliminating the remaining imbalance in the quasi-steady state phase. Throughout this process, the energy storage continues to output at full power. After the system stabilizes via inertia and primary frequency regulation, the energy storage power gradually decreases to zero until the automatic generation control(AGC)system is fully activated. The power that BES can provide when the system is disturbed is as described in (5).

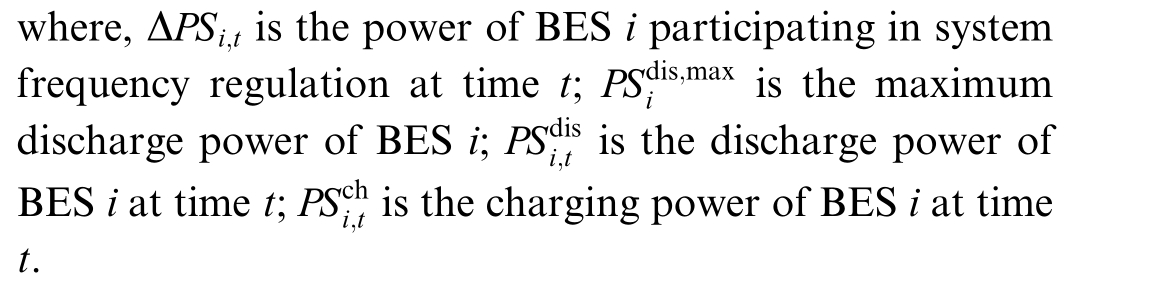
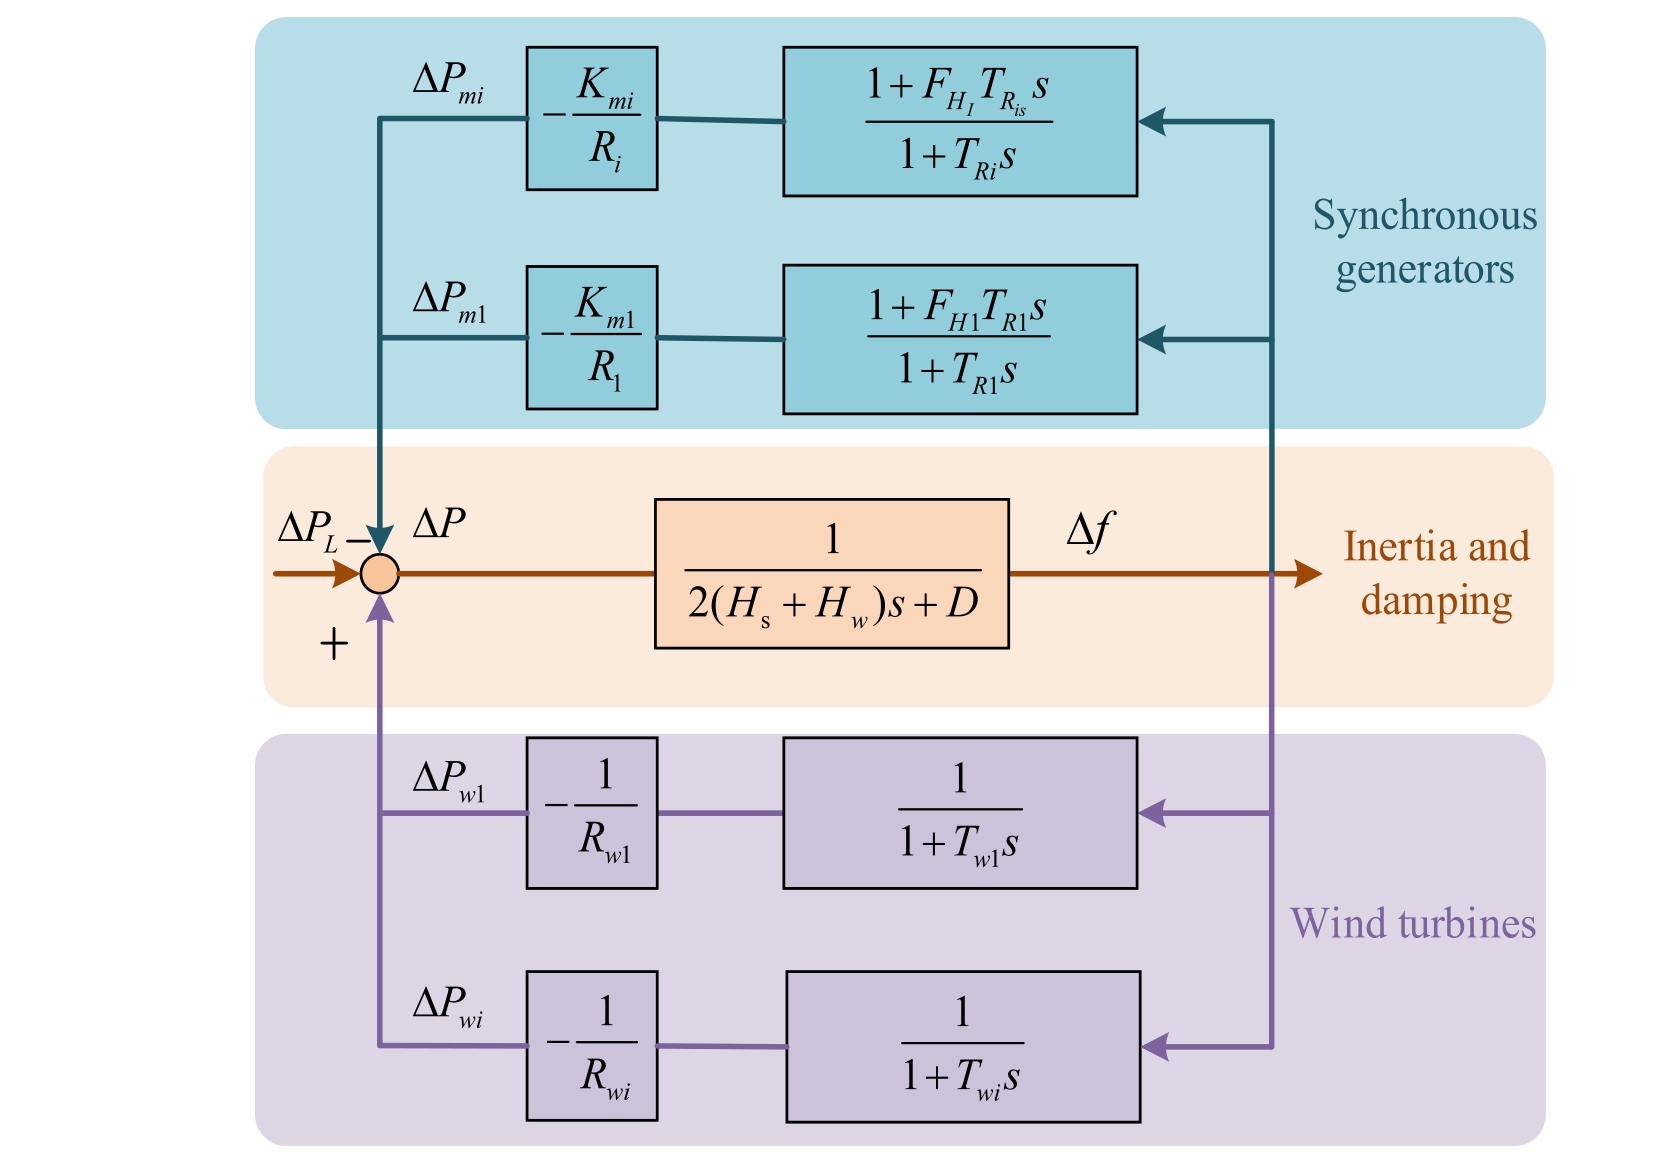
Fig. 2. Multi-machine system frequency response model.
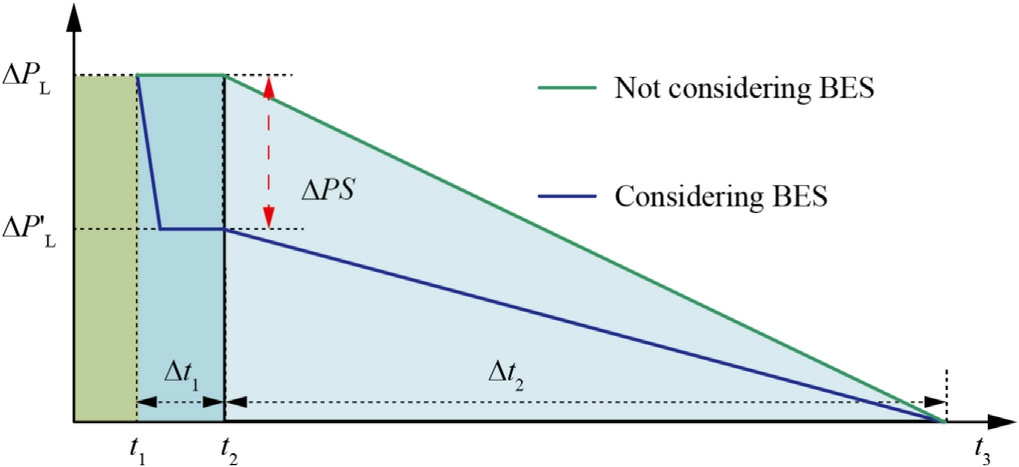
Fig. 3. Unbalanced power curve.
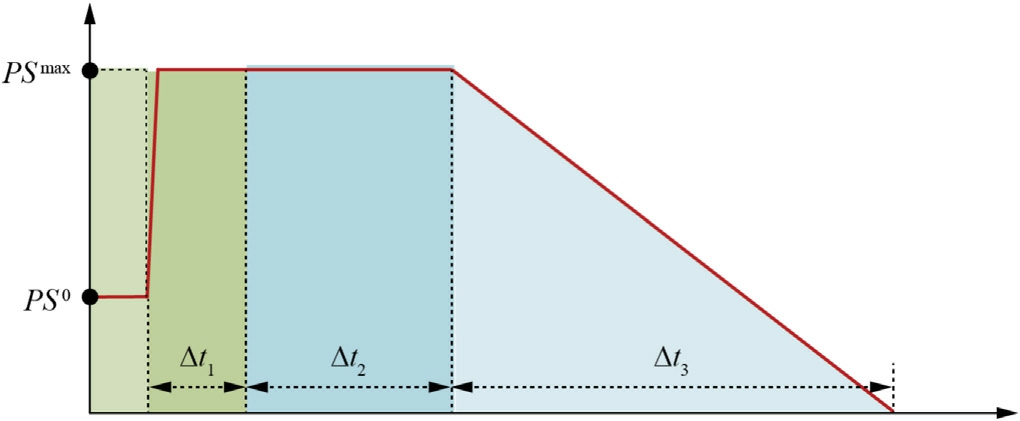
Fig. 4. BES power curve.
In Fig. 4, during the period from the inertial response phase to the completion of secondary frequency control,the total energy consumed by the BES system while participating in system frequency regulation can be expressed by(6). When system-integrated BES deployment attains adequate capacity thresholds, the BES power injection matches or surpasses grid imbalance requirements,enabling the BES to fully offset the system’s power imbalance,as demonstrated in(7). At this point, the BES is capable of completely compensating for the system’s power imbalance, reducing it to zero. Consequently, the system frequency can be considered unchanged before and after the disturbance. The energy contributed by the BES for system frequency regulation at this stage is presented in(8).
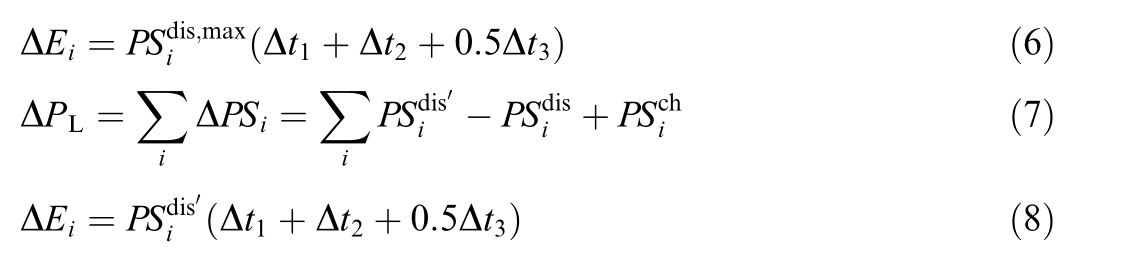
where, 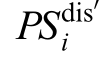 is the discharge power of BES i after disturbance.
1.3 Frequency security constraints
Frequency security constraints are the essential boundaries that define the feasible domain for the safe and stable operation of power systems. These constraints primarily include the frequency minimum point constraint and the system’s minimum inertia constraint. The system’s minimum inertia constraint can be derived from the rate of change of frequency (RoCoF) defined in (9), as demonstrated in (10).


To obtain the analytical expression for the frequency nadir, we first need to apply the Laplace transform to (3)to obtain its representation in the Laplace domain. Subsequently, we perform the inverse Laplace transform to acquire the frequency change expression in the time domain. However, since this expression represents a high-order transfer function, obtaining a direct analytical expression for frequency change becomes challenging. By utilizing the equivalent aggregation model illustrated in Fig. 5, as proposed in [22], the expression for frequency deviation in the time domain can be derived as follows:

where, themathematical interpretations of ωn, ζ, ωr, αand φare illustratedin [22].
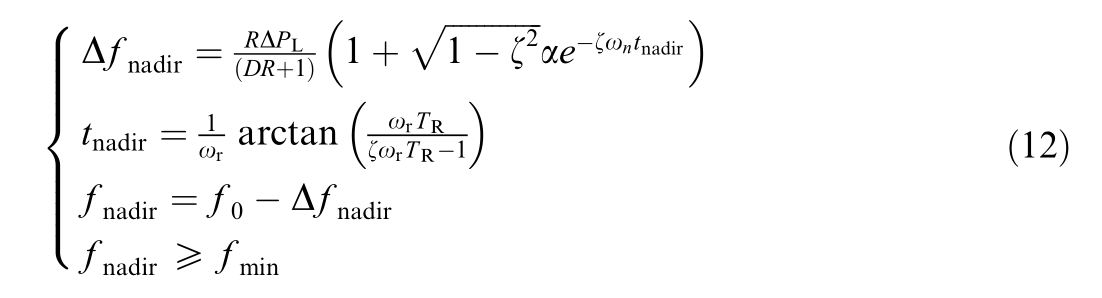
where, fnadir and tnadirrepresent the frequency nadir point and its corresponding time respectively; fmin is the frequency na dir threshold.
At the frequency nadir instant, the temporal derivative of the frequency deviation is zero. By taking the first derivative of (11) with respect to time, we can determine the time and frequency values at which the frequency nadir point occurs.
2 Source-and-load probabilistic power balance equation for frequency security
From the source of frequency change, in the ‘‘source follows load” mode, the frequency variations in traditional power systems are primarily caused by imbalances resulting from load disturbances. In renewable-dominant power grids with high variable energy penetration, the inherent variability of large-scale renewable generation clusters amplifies source-load coordination challenges, creating destabilizing effects on frequency regulation mechanisms.Consequently, it is essential to conduct in-depth research on a new power balance methodology that is appropriate for systems with a high proportion of renewable energy and to achieve source control regarding frequency stability by minimizing these imbalances.
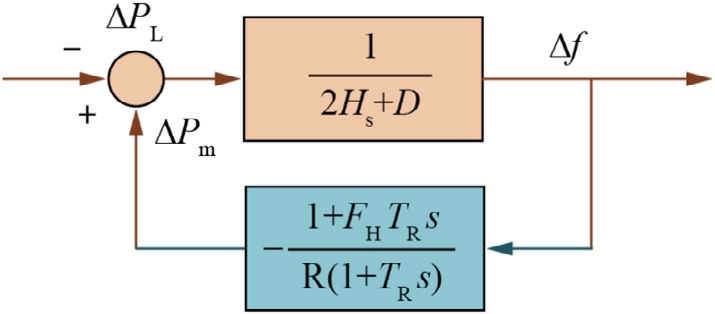
Fig. 5. Equivalent aggregation model.
This section addresses the uncertainties introduced by wind power and load forecasting errors through a probabilistic power balance approach, utilizing the Wasserstein metric to quantify the statistical differences in probabilities between the power generat ed on the source side and the power demanded on the load side. This provides a novel perspective for addressing the frequency security of the power system.
2.1 Concept and form of source-load probabilistic power balance
To ensure the balance of power supply and demand within the power system, forecasts for renewable energy generation and load requirements are essential during the scheduling phase. The discrepancy between predicted and realized power quantities is referred to as the forecast error. Prior to acquiring actual data for wind power and load, the forecast error is treated as an uncertain variable.The supply–demand equilibrium equation accounting for the forecast error is as follows:

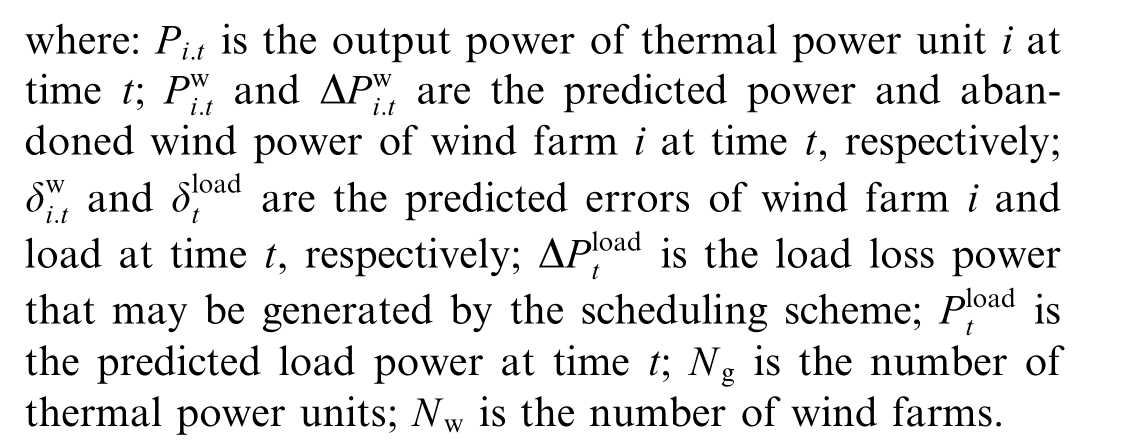
In the context of uncertain scheduling decisions, a common approach is to address this uncertainty by referencing a model. The discrepancies in probability models can be interpreted in two ways: either as different manifestations of the same random variable (or process) under varying models or as distinctions between different random variables (or processes) within the same probability space.Therefore, based on a careful consideration of prediction errors, the variables on both sides of (13) can be represented as two probability models. If the discrepancy between these two probability models is sufficiently small and the power generated on the supply side can meet the demand, optimal scheduling with a probabilistic balance can be achieved.To mathematically quantify and describe this problem, (13) is reformulated as an inequality constraint, as shown in (14):

where: d Wrepresents the measure of the difference between the two probability measures, P1is the power of the supply side, P2 is the power of the load side, P1 and P2are their corresponding probability measur es respectively.
2.2 Power balance probability measurement based on Wasserstein distance
To measure the matching degree of source-load power involving uncertainties, a probability measure index is required to quantify differences between probability models, with its accuracy depending on the selection of the metric. This paper determines three metric selection criteria in conjunction with [23]: First, computational simplicity—the Wasserstein metric has a clear relationship with the space diameter, effectively measuring weak convergence in bounded spaces and avoiding the complex calculations of metrics like Discrepancy and Lévy metrics.Second, universality—the Wasserstein metric does not require specific mathematical relationships between probability measures, imposing looser constraints than relative entropy (which requires the same domain), thus adapting to various distribution scenarios. Third,comprehensiveness—unlike the Kolmogorov metric (focusing on distribution extrema) or the Engineer metric(emphasizing mean differences), the Wasserstein metric comprehensively measures the overall deviation of probability distributions through the coupling representation of random variable distances [24]. In summary, the Wasserstein distance is chosen as the metric to quantify differences between probability measures.
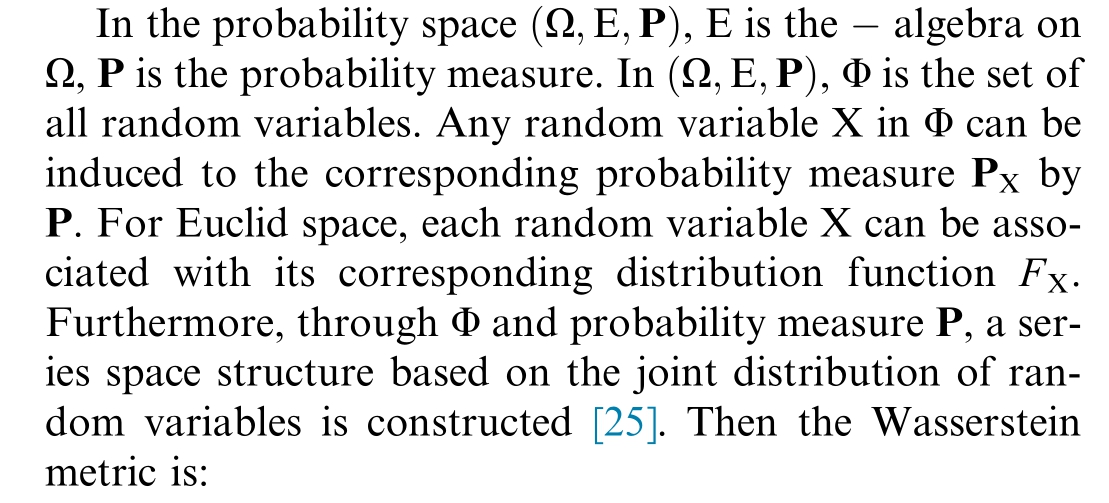

where: dW is the probability measure of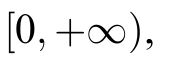 where a larger value indicates a higher probability of source-load power imbalance. The detailed procedure is provided in Appendix A.
3 Dispatch model for renewable energy power systems based on probabilistic pow er balance under dynamic frequency security
Fig. 6 shows the model established in this paper. The system incorporates conventional thermal power units,wind power units, and cogeneration units on the power supply side. Additionally, to enhance operational flexibility and better integrate wind power, the heat storage unit is installed on the cogeneration unit side, and an electric boiler is placed at a key node of the secondary heat pipe network. This configuration effectively utilizes surplus wind power to generate heat and facilitates electricthermal coupling, thereby improving energy utilization efficiency and the capacity for wind power absorption.
3.1 Objective function
The objective function mainly includes two components. The first component is the probabilistic power balance measurement between the source and load. The second component is the total cost of the system, which includes the unit fuel cost, start-up and shutdown costs,scheduling risk costs, and penalties for wind curtailment.The specific objective function is expressed as follows:
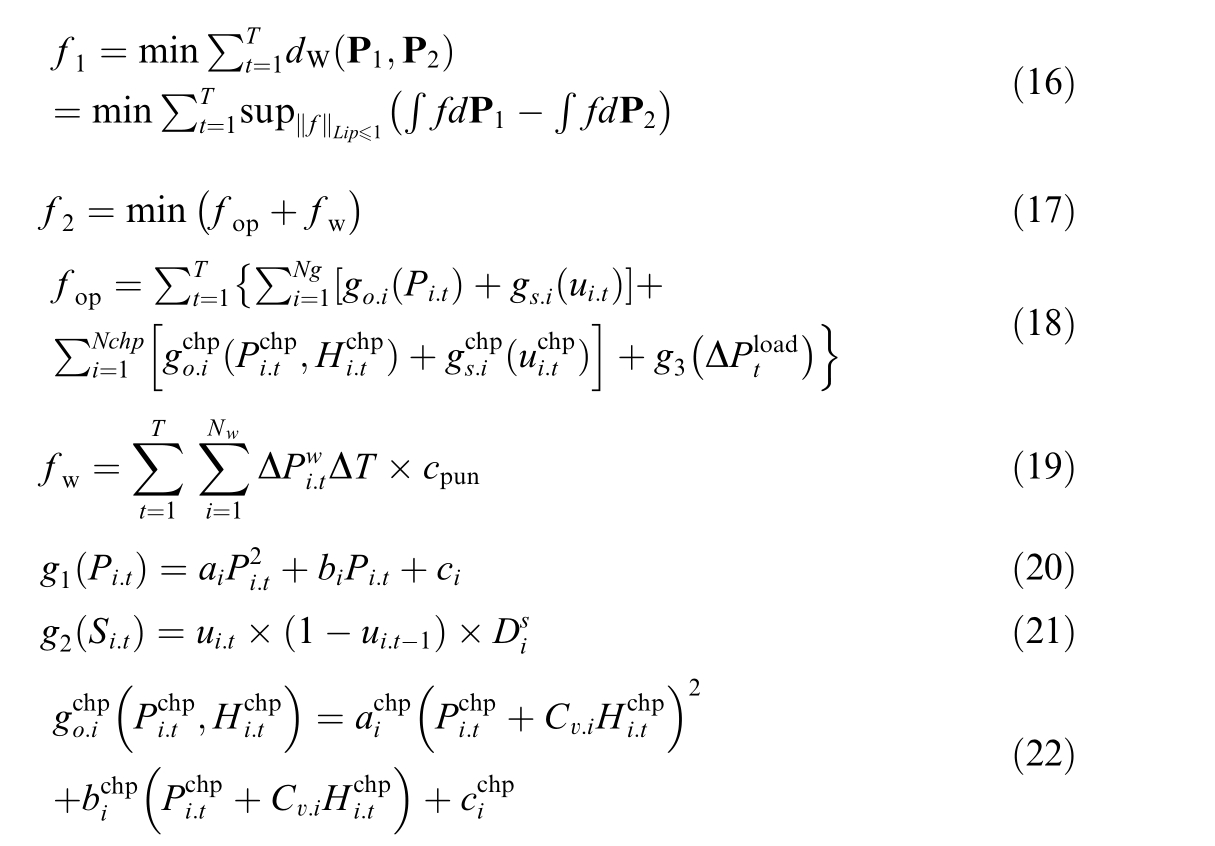
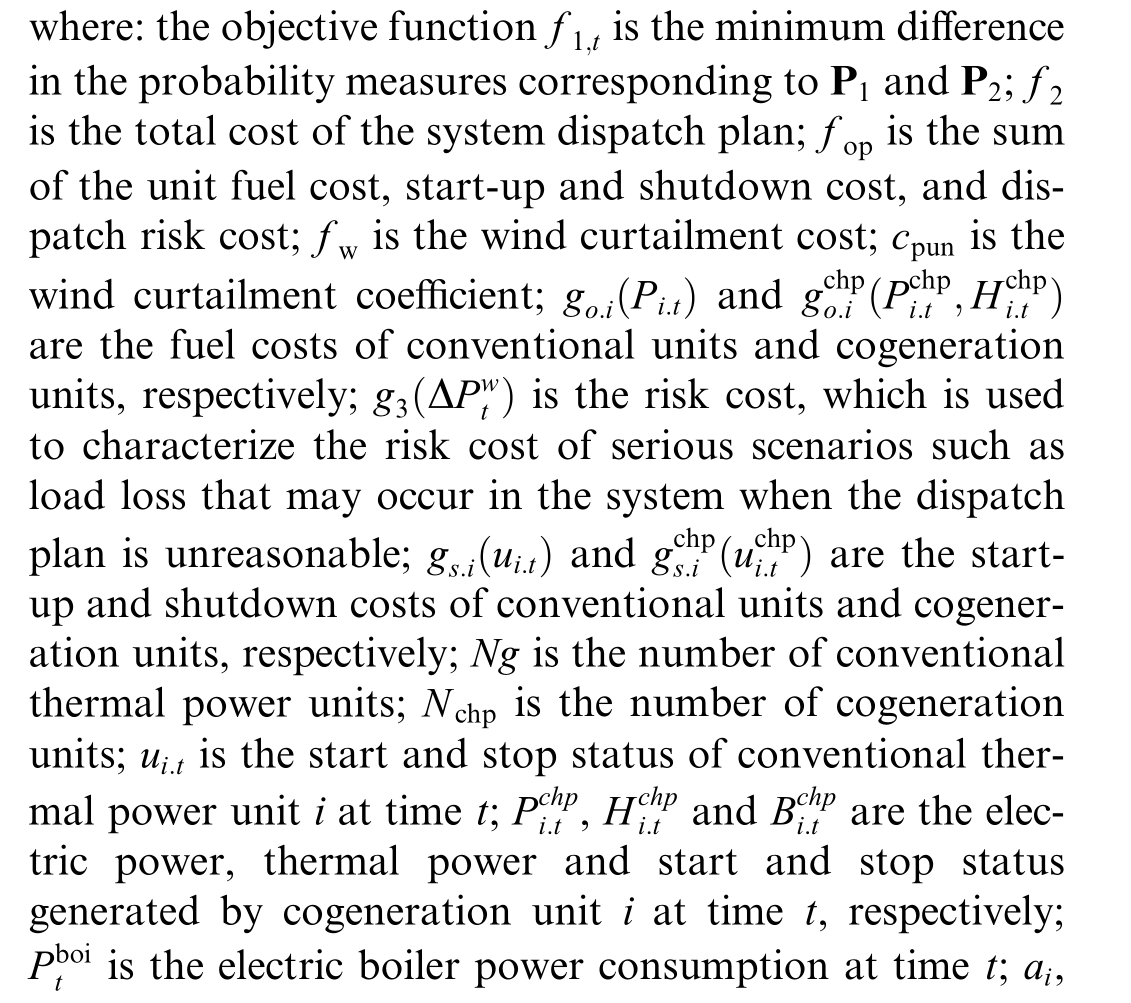
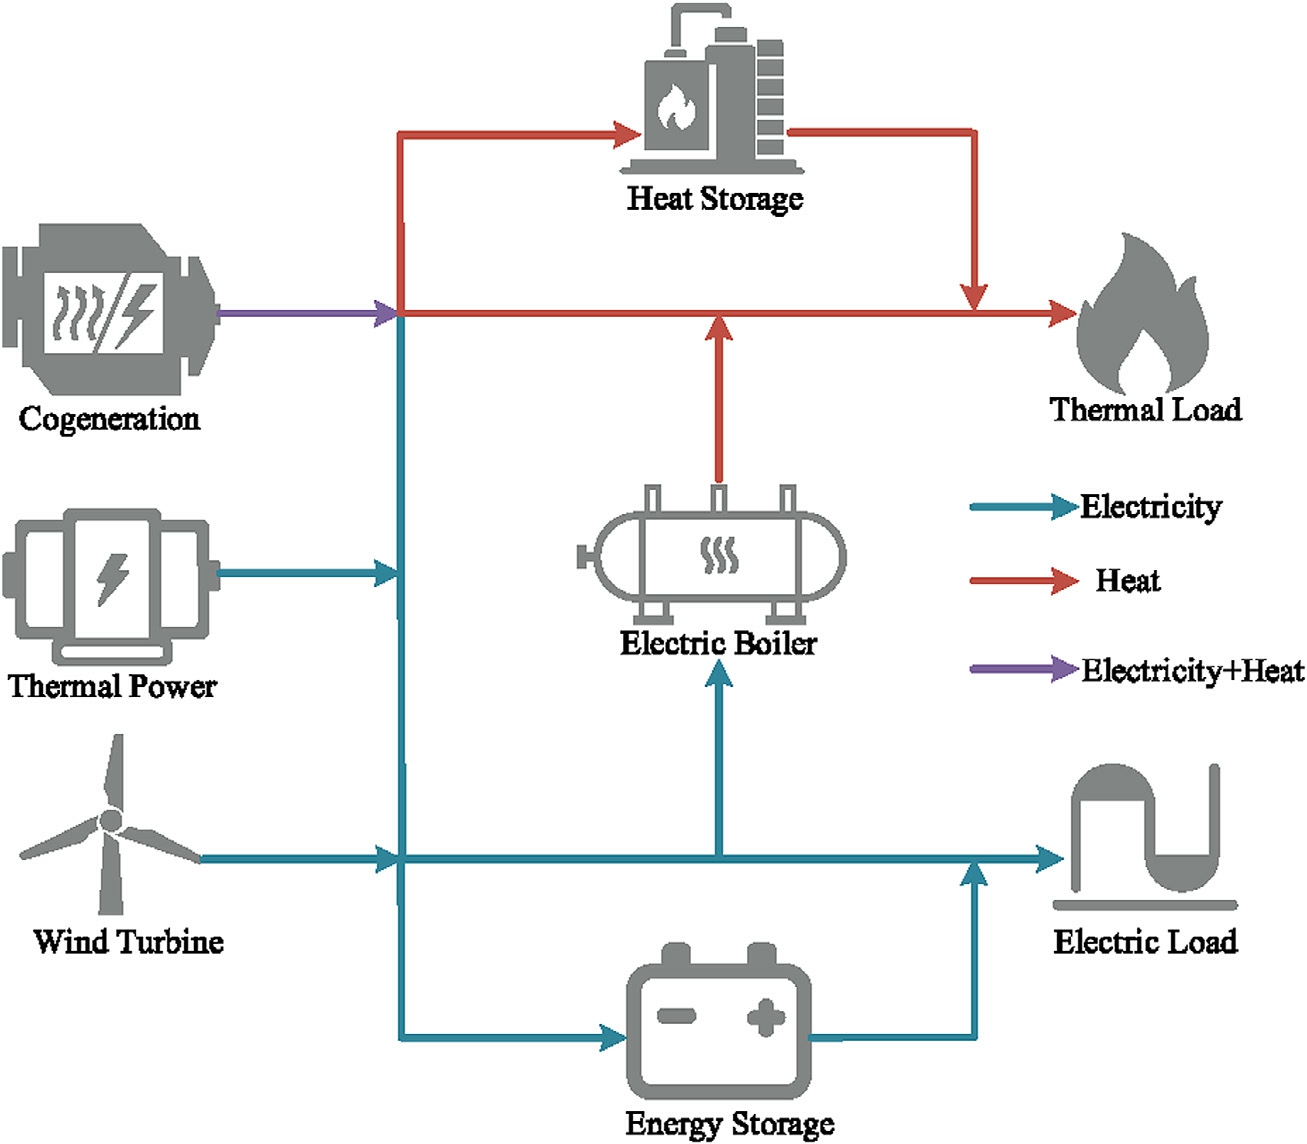
Fig. 6. Structure diagram of power system with BES device.
3.2 Constraints
The frequency safety constraints are shown in (9) to(12), and conventional constraints including unit operation constraints, BES device operation constraints, power flow constraints an d constraints related to the heating system can be found in [26].
To mitigate the volatility of wind power, the uncertainty in load forecasting, and potential risks like sudden failures, and thereby safeguard power syst em stability—operational reserve capacity must be ensured to maintain supply disruption risks within acceptable thresholds.
To optimize the system’s operating cost while ensuring its safety, this paper introduces chance constraints to plan the spinning reserve capacity, setting the constraint conditions that include random variables such as wind power output forecasting errors and load forecasting errors at an acceptable confidence level.

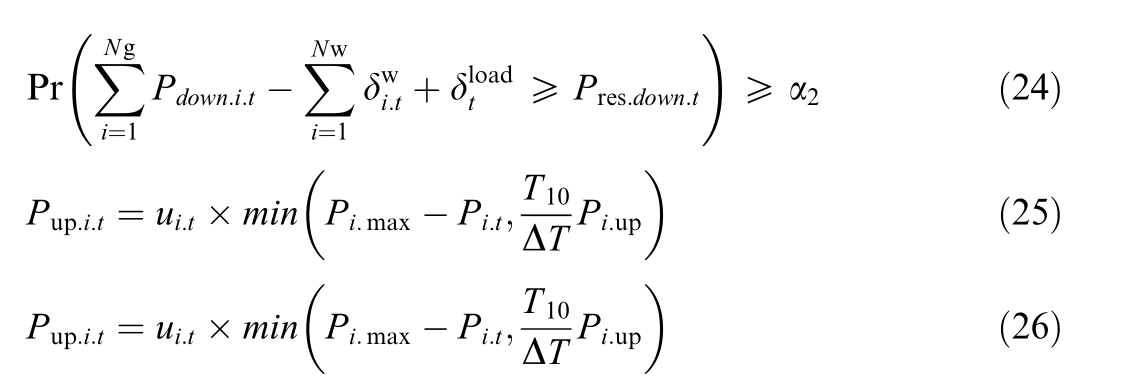
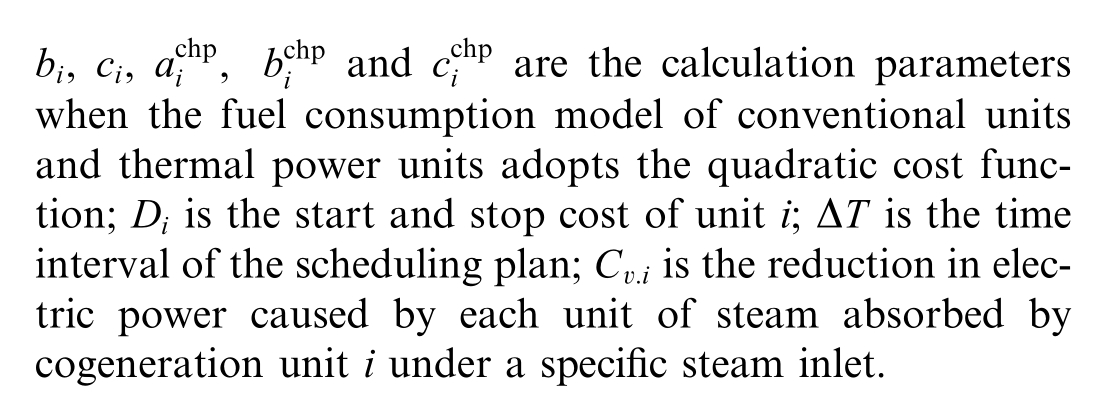
where: Pup i t and Pdown i trespectively represent its upward and downward reserve capacities at time t; Pres up tand Pres down trespectively represent the positive and negative reserve capacities requ ired for the safe operation of the system. ΔT and T10are respectively the scheduling time interval and the response time for spinning reserve, T10is set to 10 min; α1 and α2are the confidence levels for positive and negative reserves.
3.3 Model solution
3.3.1 Solving multi-objective programming
As revealed by the modeling process, the model established in this paper is a multi-objective optimization model. Traditional multi-objective optimization problems often adopt compromise models or interactive approaches.The former transforms weighted summation into a single objective function for optimization by assigning different weights to each objective function,but this method highly depends on the rationality of weight settings. The latter relies on the dominance relationship between solutions and gradually approaches the Pareto front through an iterative process. However, when dealing with large-scale scheduling models, this method often leads to low computational efficiency due to numerous variables, complex constraints, and multiple iterations.
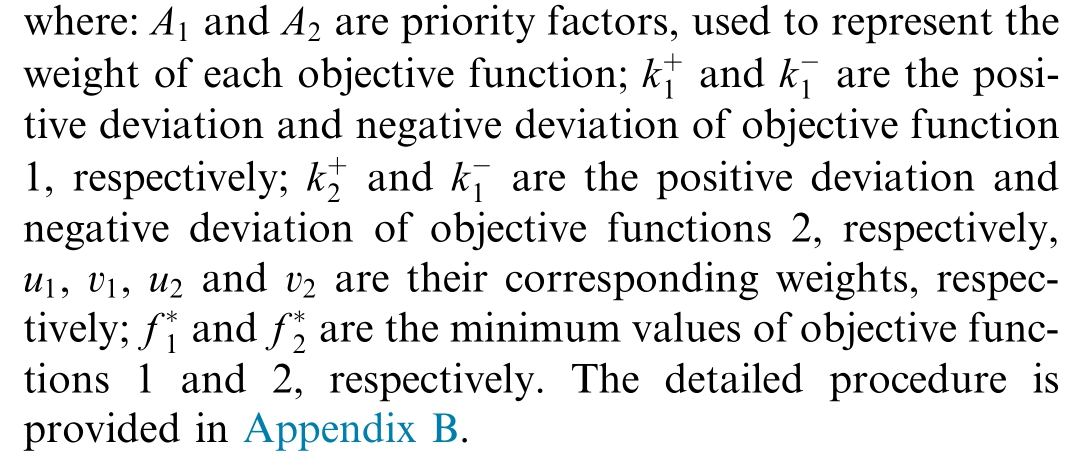
In view of the above issues, this paper introduces the goal programming method to solve the multi-objective programming model, prioritizing the optimization of the probability measure of source-load power matching that symbolizes power balance[27]. After considering the priority of objective functions, the multi-objective scheduling model proposed in this paper is transformed into:

3.3.2 Linearization of the frequency minimum constraint
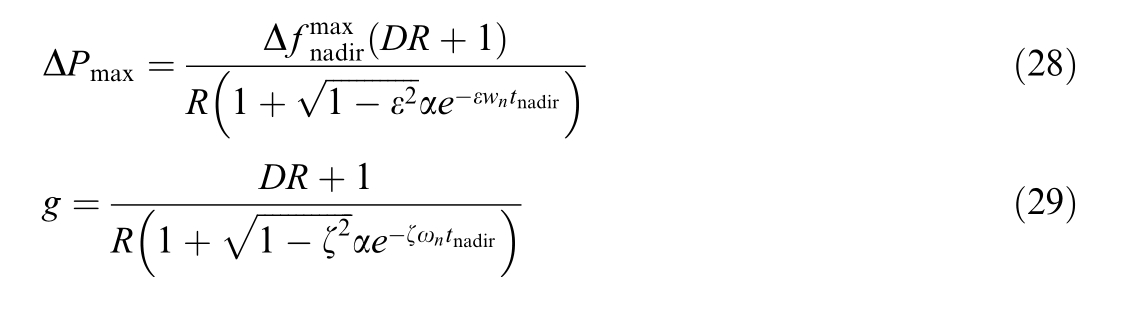
The constraint equation for the frequency nadir in (12)is nonlinear and cannot be solved directly. In this paper,we introduce an operational metric termed power security margin, which refers to the maximum disturbance that the power system can tolerate given a known maximum frequency deviation.We express the portion of(28) excluding the maximum frequency deviation using the function g.In(28), g consists of five variables: H, FH, R, D, and TR. For this study, we set the load damping factor D to 1 and the reheater time constant TR to 10. Consequently, g ultimately becomes a nonlinear function of H, FH, and R.We employ the piecewise linearization method from [22]to linearize (29).
3.3.3 Deterministic transformation of chance constraints
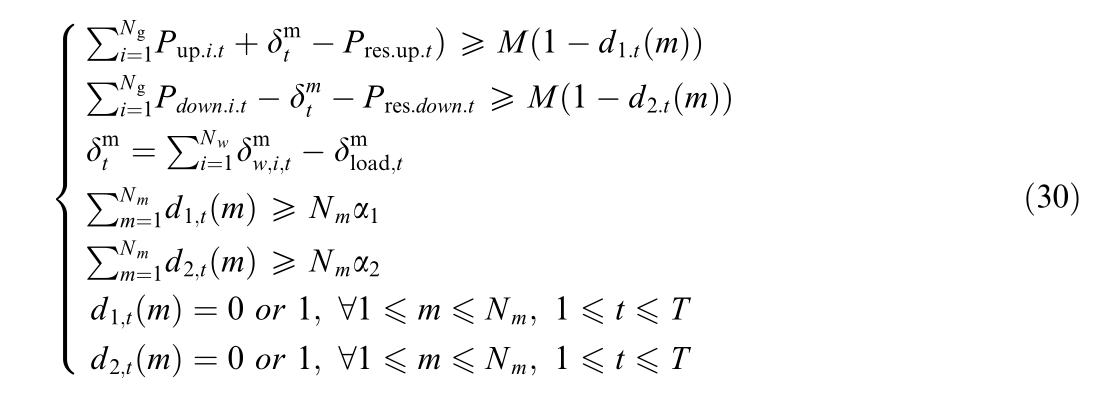
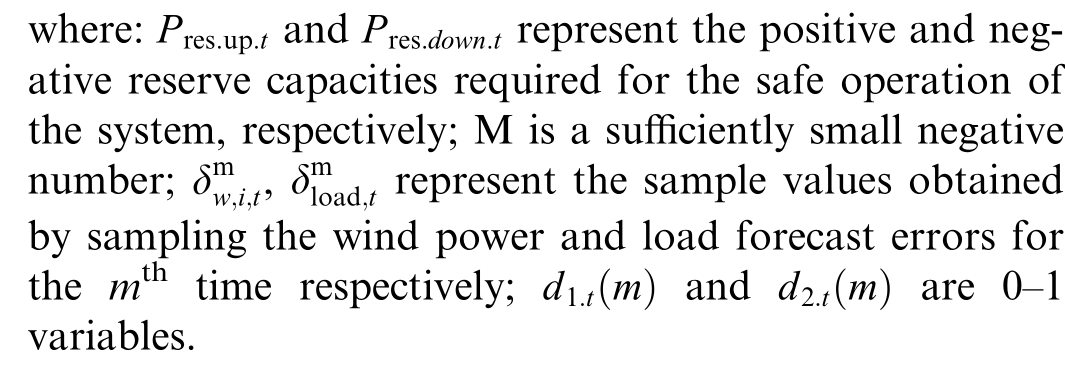
In the model established in this paper,(24) and(25)are chance constraints that need to be transformed into equivalent deterministic constraints. When the cumulative probability distribution of random variables is unknown, these chance constraints can be converted into several mixedinteger constraints with the sampling-based chance constraint equivalent deterministic transformation method.
Latin hypercube sampling is employed to perform subsampling on the wind power and load forecast errors,respect ively. When the number of sub-samples is suffi-ciently large, the constraints of (23) and (24) can be expressed as (30).
4 Case study
4.1 Case overview
This paper’s example is from the Belgian load and Eliaconnected wind power forecast data for 2016–2017, utilizing the IEEE 118-bus model to validate the effectiveness of the proposed model. Detailed information regarding the system’s grid structure, generator sets, and load parameters is provided in [28]. Wind turbines and synchronous units participate in the system frequency response, while cogeneration units do not. A total of 96 scheduling intervals is set for the entire 24-h period. The maximum allowable frequency deviation is 0.5 Hz; the maximum initial frequency change rate is 0.42 Hz/s; the minimum inertia time constant permitted by the system is 5.95 s; and the dynamic frequency response parameters of the unit can be found in [29]. The BES system has a rated capacity of 1880 MWh and a duration of 4 h. Detailed parameters can be found in [30]. The simulations were conducted in the MATLAB R2023b environment, using GUROBI 12.0.1 for problem-solving. The computer specifications include an i5-13500H processor and 16 GB of RAM.
4.2 Necessity analysis of frequency security constraints
To validate the necessity of the dynamic frequency security constraint proposed in this paper, clarify its impact on economic efficiency, and demonstrate the benefits of BES participation in frequency regulation, this section presents four scenarios for comparison. The specific settings are detailed in Table 2.
4.2.1 Scheduling result analysis
As shown in Table 3, Scenario 2 incorporates BES into the system power balance on the basis of Scenario 1,resulting in a 5.46% reduction in total cost. In Scenario 3,frequency security constraints are introduced compared to Scenario 1. However, wind power fails to provide sufficient inertia support, and CHP units do not participate in frequency regulation. Consequently, synchronous generators are required to undertake additional frequency regulation tasks, leading to increased operational costs for synchronous units and a 16.02% rise in total cost compared to Scenario 1. Scenario 4 builds upon Scenario 3 by integrating BES. Since BES provides frequency support—thereby reducing the frequency regulation burden on synchronous generators—and absorbs part of the wind power to mitigate curtailment, Scenario 4 achieves reductions in operational costs for all units, wind curtailment penalties,and total system costs. Furthermore, analysis of the solution times reveals that Scenario 1(without BES/frequency constraints)and Scenario 2(with BES only)consume similar computation time (492.83–497.36 s), indicating that BES constraints had minimal impact on computational burden.
Figs. 7 and 8 illustrate the charging and discharging power of BES and wind curtailment across different scenarios,respectively.As shown in Fig. 8, the peak wind curtailment for all scenarios occurs between 10:00 and 20:00,primarily because of the low electrical load during this period, which limits wind power integration. However, Scenarios 2 and 4, equipped with BES, partially alleviate wind curtailment challenges, with their curtailment levels consistently lower than those of Scenarios 1 and 3, which lack energy storage. These optimization results demonstrate that the rational deployment of BES plays a critical role in enhancing the efficient utilization of renewable energy and maintaining system frequency security.
4.2.2 Analysis of frequency indicators of each scenario
To further investigate the impact of frequency security constraints on system frequency, Fig. 9 and Fig. 10 compare the frequency nadir points and the RoCoF for the system across various scenarios.
Since Scenarios 1 and 2 did not consider dynamic frequency security constraints, the frequency nadir points,and RoCoF in certain periods exceeded permissible limits.In contrast, the frequency security indicators for Scenarios 3 and 4 remained within safe boundaries. Compared to Scenario 3, Scenario 4 exhibited higher frequency nadir points and lower RoCoF values. This improvement is attributed to the shorter response time of energy storage systems, which allows them to inject power into the system almost instantaneously upon disturbance occurrence,thereby reducing power imbalance and mitigating the frequency nadir points and RoCoF. In Scenario 4, the frequency nadir in some periods remained at 50 Hz, with an initial rate of frequency change of 0 Hz/s. This occurs because the disturbance power in these periods was relatively small,and the power injected by energy storage systems fully compensated for the system’s power imbalance,maintaining the frequency at its nominal value.
Without considering the AGC units and intraday adjustments, Fig. 11 compares the frequency dynamics of each scenario in the 45th scheduling interval. Due to the fact that the system frequency has entered the steady-state regulation phase after the 42nd scheduling cycle, and the frequency fluctuation amplitude in subsequent scheduling cycles is less than 0.01 Hz, the subsequent waveforms are not drawn. For Scenarios 1 and 2, the frequency rapidly declines after a disturbance, with the lowest frequency deviation of 0.6 Hz, exceeding the upper limit of the maximum allowable frequency deviation. In contrast, Scenarios 3 and 4 satisfy the frequency security constraints for the lowest frequency deviation. Among them, Scenario 4 achieves the smallest frequency deviation, reducing it by 0.23 Hz compared to Scenario 1 and by 0.12 Hz compared to Scenario 3.The initial RoCoF is determined by the disturbance and inertia at that moment. The frequency response of energy storage reduces the disturbance magnitude at the initial moment, thereby lowering the RoCoF. In Scenario 4, the RoCoF is 0.14 Hz/s, which is 0.16 Hz/s lower than that of Scenario 3 and 0.24 Hz/s lower than that of Scenario 1. These results demonstrate the effectiveness of the proposed frequency security constraints and indicate that a rational configuration of energy storage can ensure the frequency security.
4.3 Analysis on the effectiveness of probabilistic power balance model
To verify the effectiveness of the probabilistic power balance model, four optimization scenarios are set up for compari son based on the consideration of BES and frequency security constraints.
Scenario 5: Traditional deterministic optimal scheduling model. The prediction errors in Eq. (13) are ignored.
Table 2 Simulation example comparison settings.

Table 3 The results of each scenario.

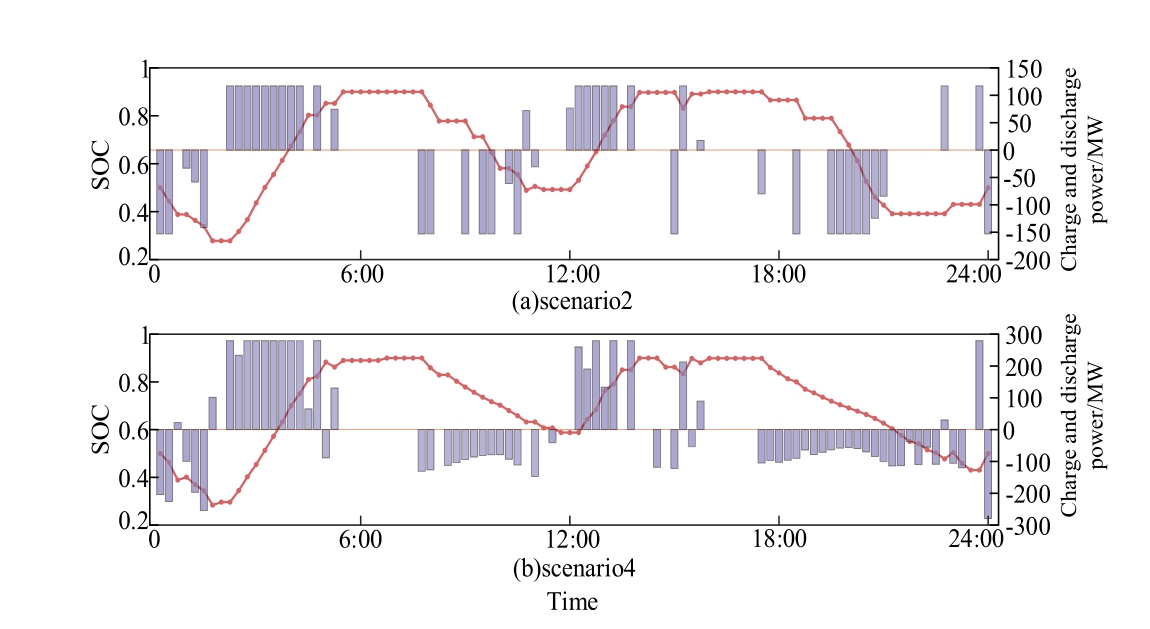
Fig. 7. The charging and discharging power of BES.
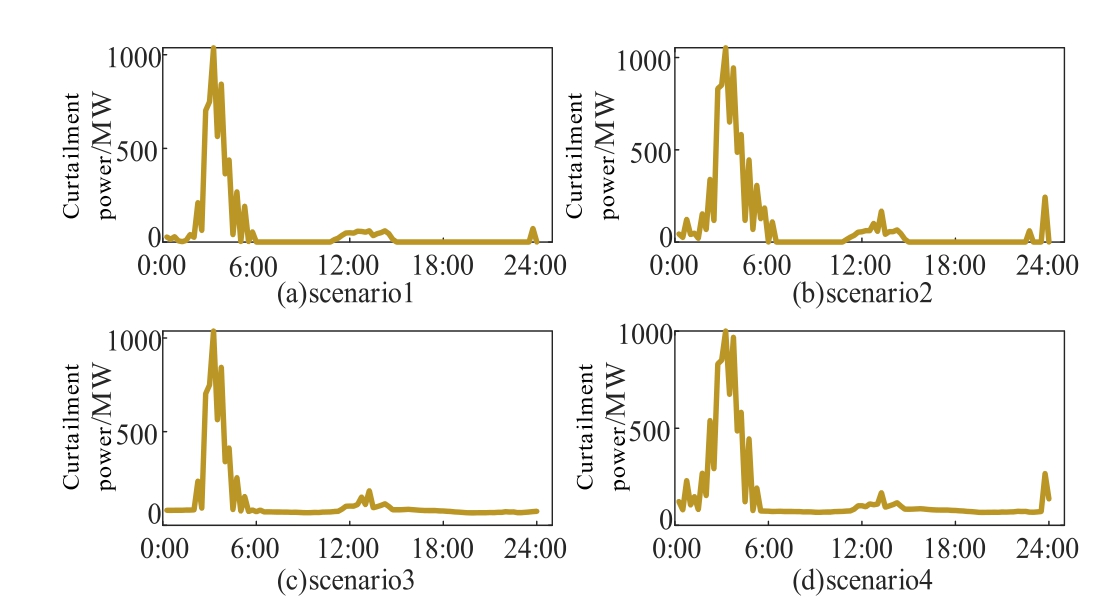
Fig. 8. Curtailment power of each scenario.
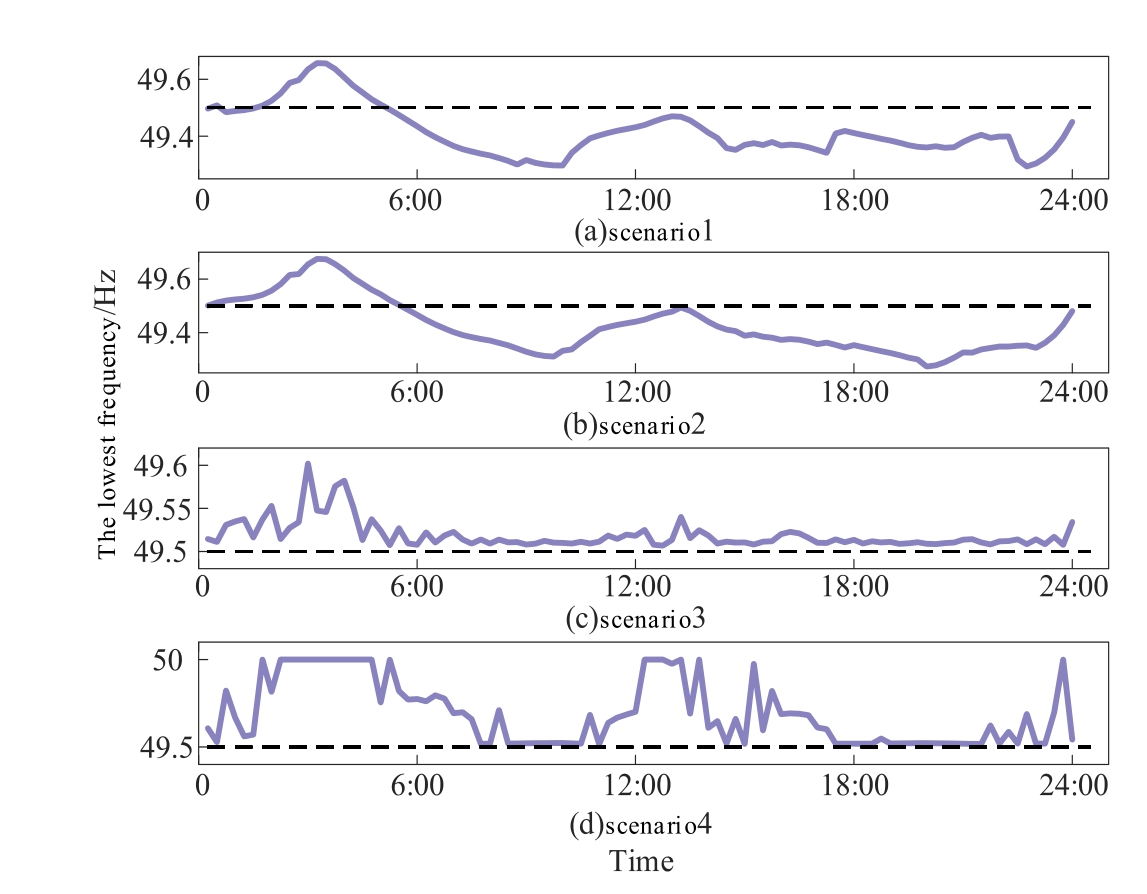
Fig. 9. The frequency nadir of each scenario.
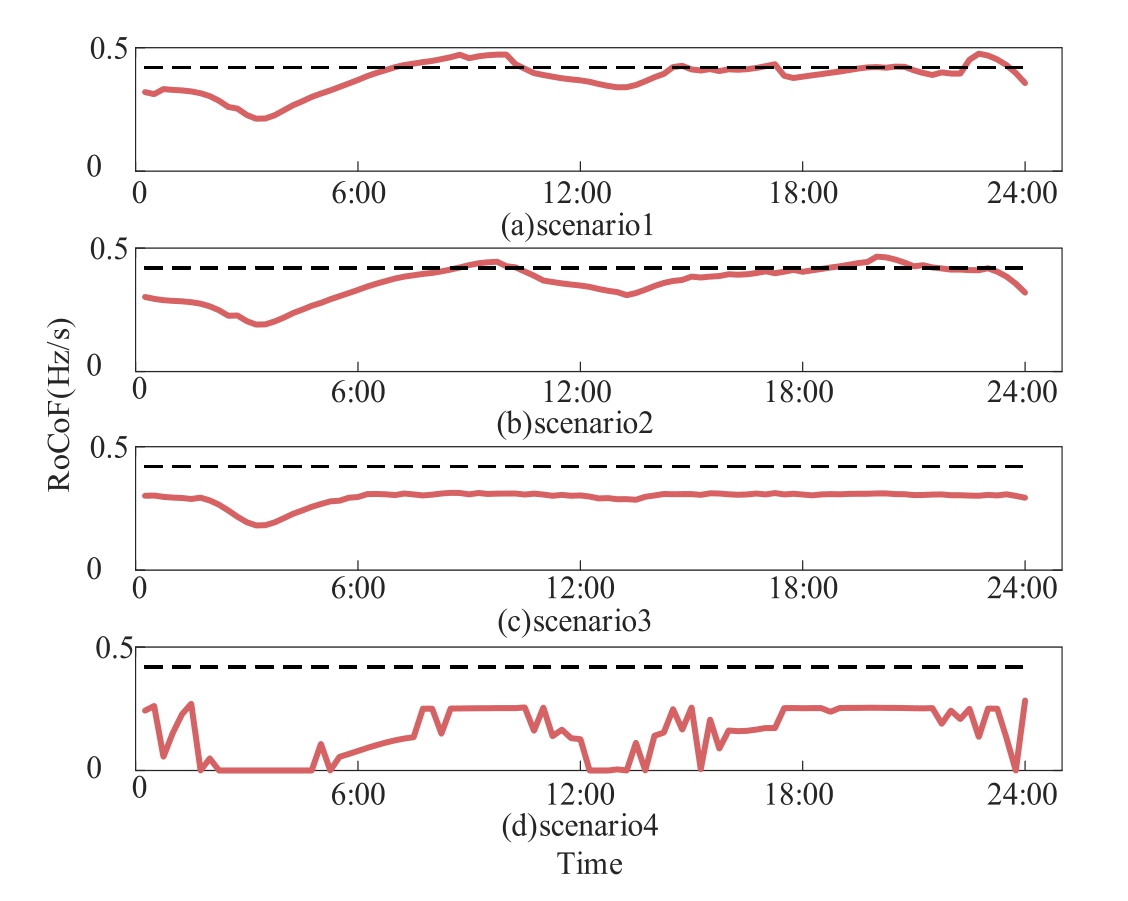
Fig. 10. The RoCoF of each scenario.
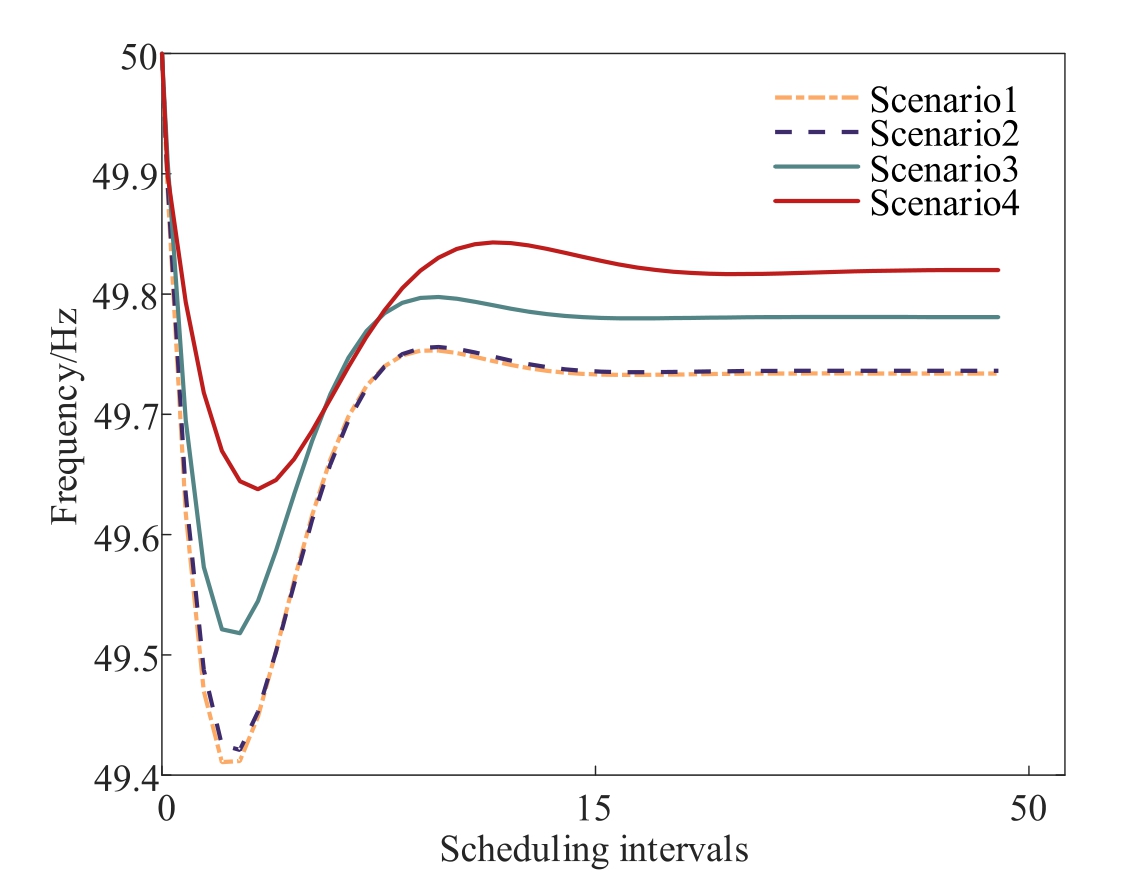
Fig. 11. The frequency dynamics of each scenario in the 45th scheduling interval.
Scenario 6: Chance-constrained stochastic optimal scheduling model. The prediction errors in Eq. (13) are ignored, and the confidence level of syst em reserve constraints is
Scenario 7: Scenario-based stochastic optimal scheduling model. The prediction errors in Eq. (13) are considered. Latin hypercube sampling is used to generate 10,000 scenarios, which are reduced to 20 representative scenarios for calculation.
Scenario 8: The proposed probabilistic power balance optimal scheduling model in this paper. The prediction errors in Eq.(13) are considered, and the Wasserstein metric method proposed in this paper is combined for solution. The confidence level of system reserve constraints is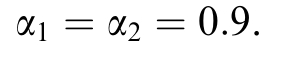
4.3.1 Economic indicators and frequency security margin analysis
The simulation results under the four scenarios are shown in Table 4.
The simulation results show that both the total cost and wind curtailment cost of the optimal scheduling model proposed in this paper are lower than those of the other three models. The traditional deterministic model has the highest total cost and wind curtailment cost, while the scenario-based method and chance-constrained method are in between. This is because: for the traditional deterministic model, when the actual output deviates from the predicted value, it is necessary to supplement power through high-price fuel units or bear the penalty of wind curtailment. Meanwhile, the load forecast deviation will trigger the overload operation of synchronous units,increasing the fuel and operation and maintenance costs.However, the model in this paper breaks through the rigid constraint of complete equality of predicted values in the construction of power balance equations. By quantifying the distribution difference of source-load power through Wasserstein distance, it incorporates uncertainties into scheduling decisions, so as to c arry out optimization search in a broader parameter space. This not only effectively broadens the optimization dimension but also significantly improves the flexibility of optimization. In contrast, although the scenario-based optimization method of Scenario 7 simulates uncertainties through various representative scenarios, it essentially transforms the uncertainty problem into a deterministic problem for processing.Inevitably,information loss may occur in this process, leading to the optimization results possibly deviating from the optimal solution. The chance-constrained optimization method of Scenario 6, although considering uncertainties to a certain extent, focuses on finding the optimal solution under the condition of meeting certain probability constraints, and may lack sufficient sensitivity to some extreme or low-frequency situations. The frequency security margins under different modeling methods are shown in Fig. 12. Scenario 8 has the highest frequency security margin, Scenario 5 has the lowest, and the margins of Scenario 6 and Scenario 7 are relatively close.
Furthermore, analysis of the solution times reveals that the computation times for Scenarios 5, 6, and 7 stabilized within 501.25–517.46 s, demonstrating convergent computational efficiency among traditional stochastic optimization methods. Scenario 8 (probabilistic power balance + frequency constraints) required 620.71 s.Although Scenario 8 had a longer solution time, it incorporated prediction errors with higher precision, achieving a balance between optimization accuracy and computational efficiency.
4.3.2 Statistical analysis of power deviation and frequency deviation under different uncertainty modeling methods
To further compare the impact of different scheduling models on the simulation results under various scenarios,a representative set of 10,000 scenarios was constructed based on the actual distributions of wind power and load forecasting errors. The scheduling schemes corresponding to the four scenarios in the simulation case were statistically analyzed within the constructed scenario set. During this process, the regulation effects of AGC units and intraday adjustments were disregarded to assess the inherent capability of each model in addressing uncertainti es arising from wind power and load variations.For the primary frequency regulation process, only the frequency deviations induced by this stage were considered to reflect the models’ability to maintain system frequency stability, thereby indirectly evaluating their comprehensive performance in managing uncertainties. The resulting power supply–demand deviations and frequency deviations across different scenarios are illustrated in Fig. 13 and Fig. 14,respectively.
In Fig. 13, the power supply–demand deviations of Scenario 5 and Scenario 6 are identical. Scenario 7 exhibits a subsequently lower deviation, while Scenario 8 achieves the smallest deviation. Since both Scenario 5 and Scenario 6 employ the same 10,000 simulated scenarios and neither considers prediction errors during the scheduling phase,their power supply–demand deviation distribution curvesare entirely consistent. Scenario 7, however, incorporates prediction errors into the scheduling process, leading to a significant reduction in power supply–demand deviations. Nevertheless, the scenario-based optimization method inherently loses partial prediction error information during scenario generation and reduction. In contrast,the proposed Scenari o 8 transforms the traditional equality constraints in the power balance equation into a problem of minimizing probabilistic measure differences,thereby demonstrating smaller power supply–demand deviations.
Table 4 Optimization results of different scenarios.

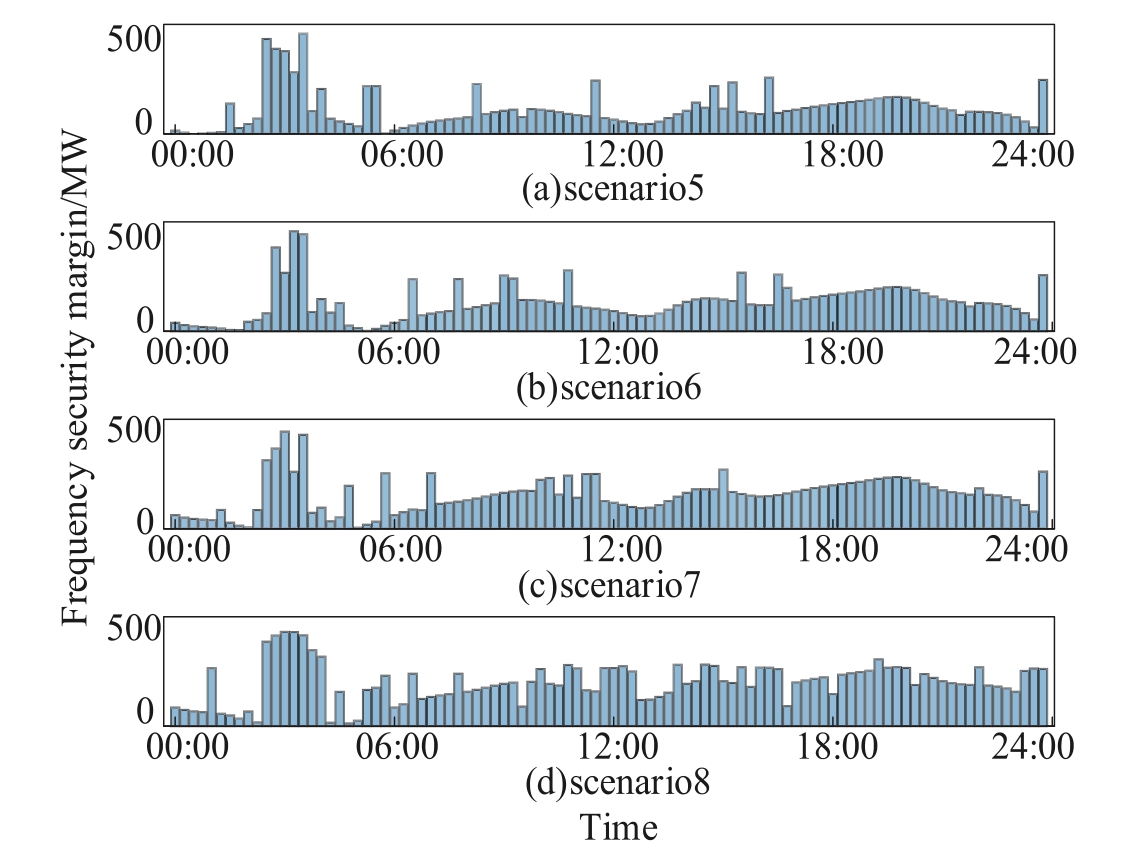
Fig. 12. Frequency security margin of each scenario.
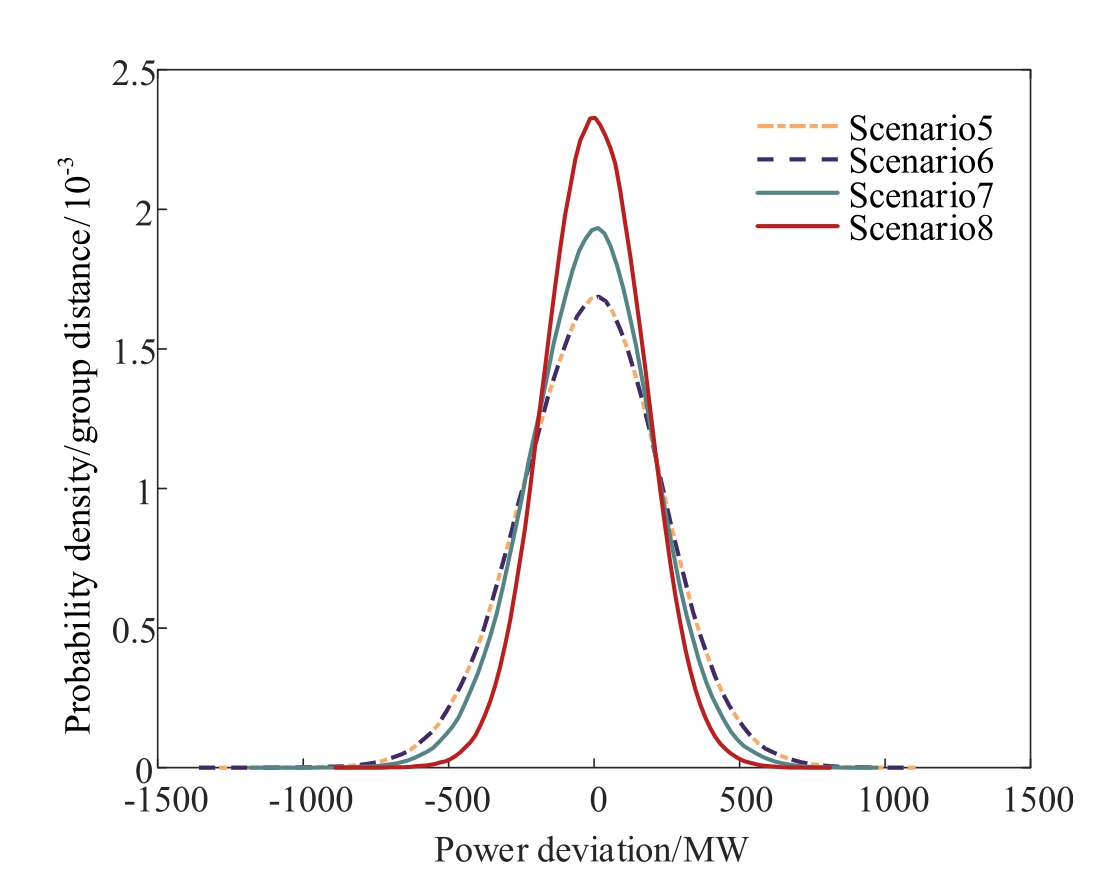
Fig. 13. The power deviation statistics of each scenario.
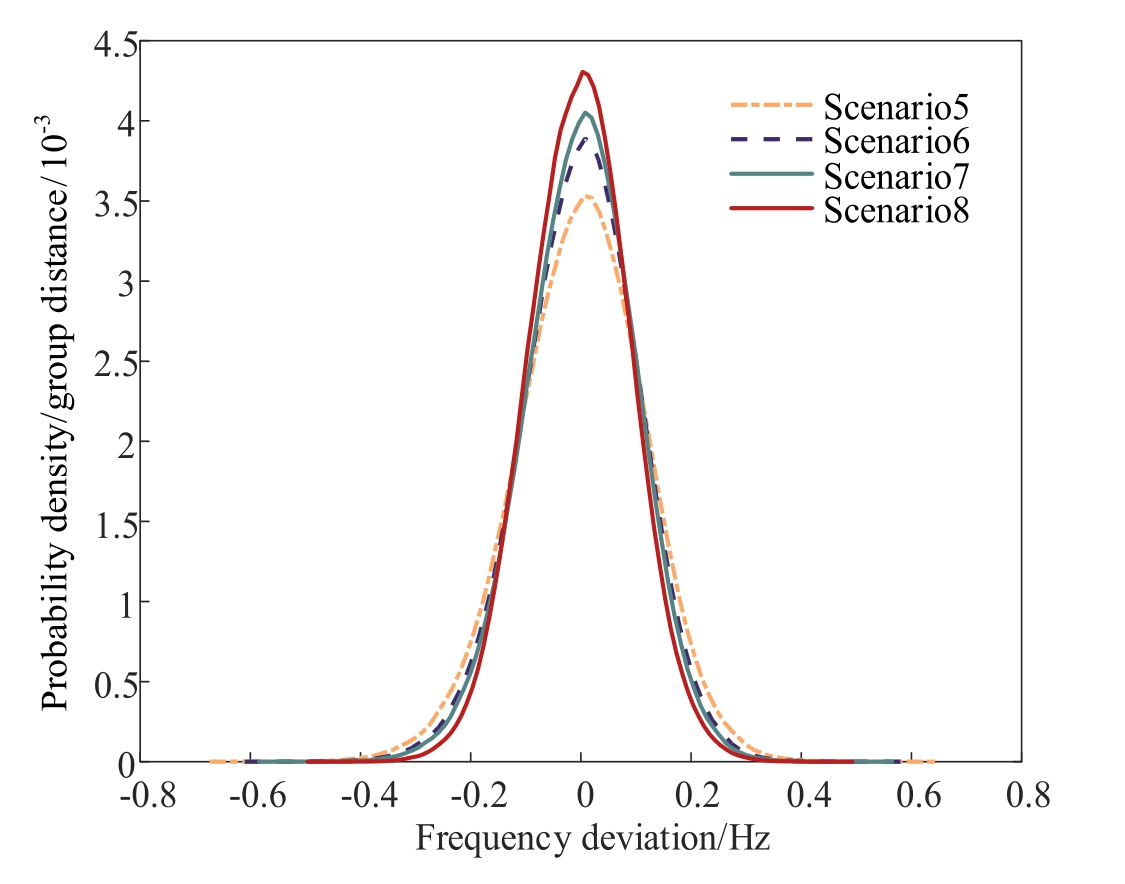
Fig. 14. The frequency deviation statistics of each scenario.
In Fig. 1 4, the frequency deviations across the four scenarios exhibit trends consistent with the power supply–demand deviations observed in Fig. 13. However, the frequency deviation curves of Sc enario 5 and Scenario 6 are no longer fully aligned. This divergence stems from the fact that frequency deviations are not only directly affected by power supply–demand imbalances but also influenced by unit commitment schemes and operational working points. By introducing system spinning reserve constraints, Scenario 6 partially accounts for the impact of uncertainties on spinning reserve capacity, thereby enabling its scheduling scheme to more effectively regulate frequency deviations compared to Scenario 5.
4.4 Analysis of the superiority of combining frequency security constraints with probabilistic power balance model
To further analyze the impact of frequency security constraints and probabilistic power balance models on frequency changes in system scheduling results, three scenarios are established for comparative analysis: Scenario 9,Scenario 10, and Scenario 11, as shown in Table 5. Scenario 10 is solved using the scenario method. It is evident that the scheduling outcomes of Scenario 10 are identical to those of Scenario 7,and similarly,the outcomes of Scenario 11 are identical to those of Scenario 8, as shown in Table 6.
Fig. 1 5 depicts the frequency variation statistics across various scenarios, with the theta axis representing frequency values and the R axis indicating scheduling intervals. Analysis reveals that Scenario 11, which incorporates both frequency security constraints and the probabilistic power balance equation, benefits from not only wind turbines and synchronous units participating in frequency regulation but also fully considers the influence of prediction errors. Consequently, it achieves the smallest comprehensive frequency deviation, only slightly exceeding that of Scenario 10 at specific time points. Conversely,Scenario 9,which neglects frequency security con-straints, exhibits a substantial increase in frequency deviation co mpared to the other two scenarios.
Table 5 Simulation example comparison settings.
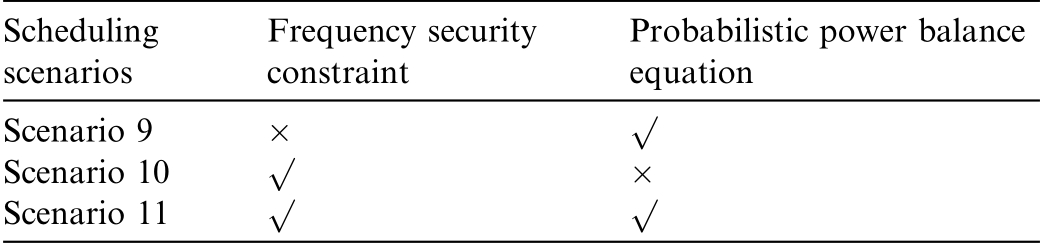
Table 6 Optimization results of different scenarios.
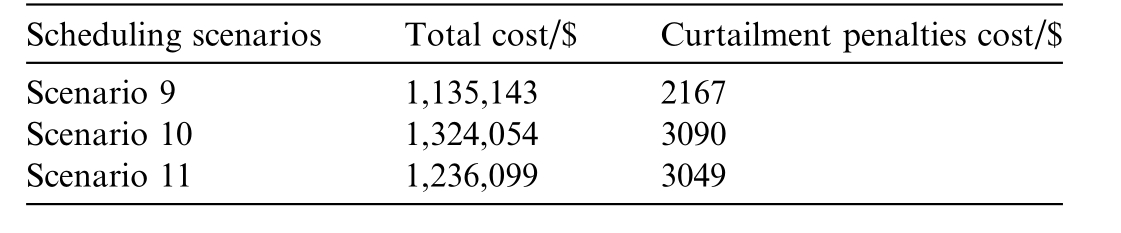
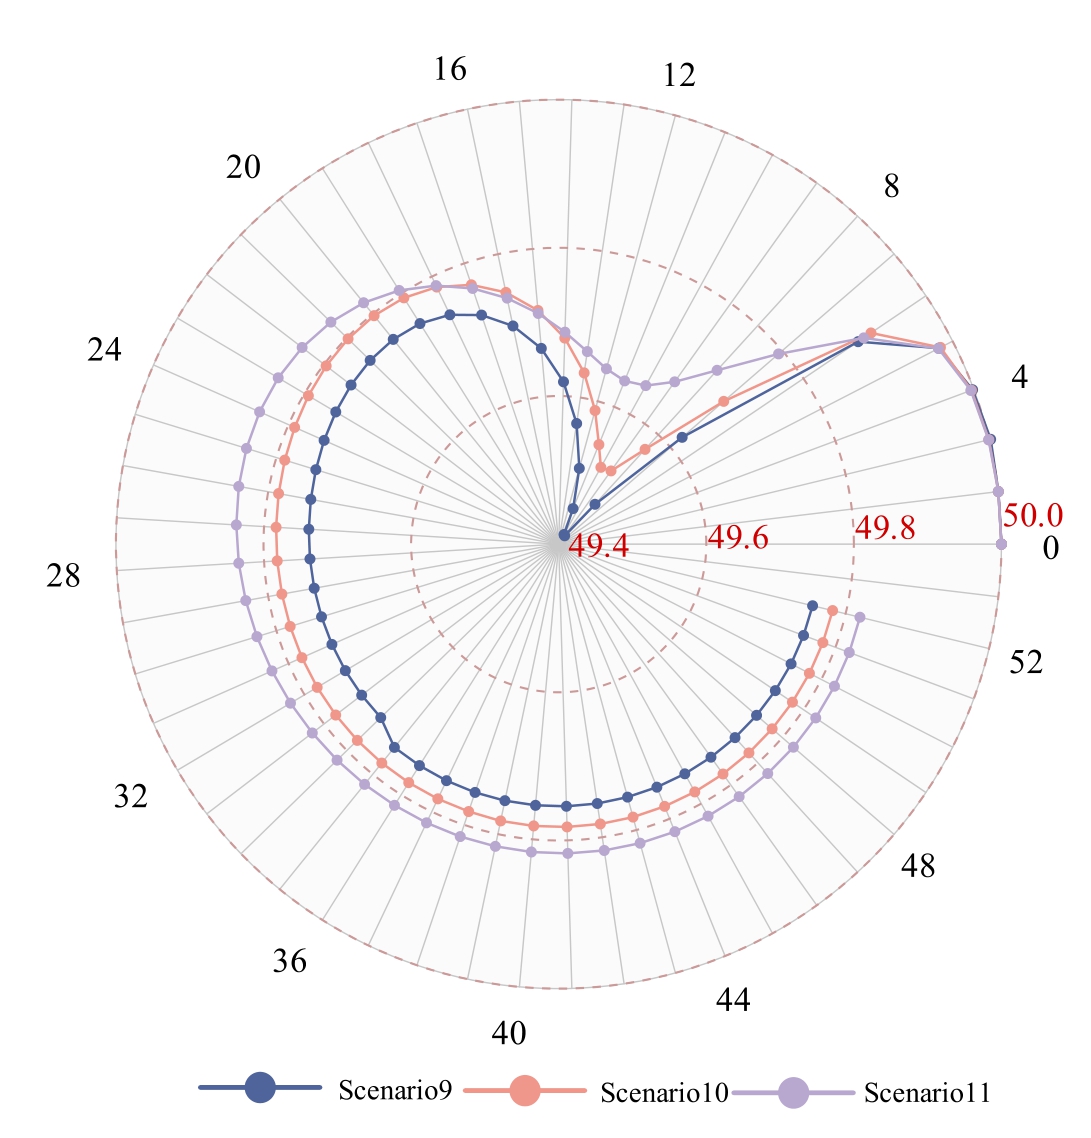
Fig. 15. The frequency change statistics of each scenario.
Based on these operational results, it is evident that both frequency security constraints and probabilistic power balance can reduce frequency deviation to some extent. However, the impact of frequency security constraints is more pronounced,while the advantage of probabilistic power balance primarily lies in its thorough consideration of prediction errors, indirectly minimizing frequency deviation. Fig. 16 indicates that the system frequency nadir in Scenario 11 is 0.03 Hz higher than that in Scenario 10 (which only includes frequency constraints),and the RoCoF is reduced by 0.12 Hz/s. This improvement is attributed to the probabilistic power balance mechanism, which quantifies the distributional discrepancy between source and load through the Wasserstein distance. By reducing the probability density of power imbalance at its source, this approach effectively mitigates the magnitude of frequency disturbances, demonstrating the synergistic effect of integrating probabilistic power balance with frequency security constraints.
4.5 Sensitivity analysis
4.5.1 Sensitivity analysis of renewable energy capacity
Fig. 17 compares the operating costs and wind curtailment rates of Scenario 9 and Scenario 11 across varying renewable energy capacities. As the renewable energy capacity rises from 80,000 MW to 96,000 MW, it replaces a portion of thermal power generation due to its lower cost, resulting in decreased operating costs for both scenarios. However, the difference in operating costs between the two scenarios increases from 5.48%to 9.23%.The sole distinction between these two scenarios lies in the consideration of frequency security constraints. The simulation results highlight the significance of frequency security constraints in systems with high renewable energy penetration.
4.5.2 Frequency security margin sensitivity analysis
Fig. 18 compares the influence of different frequency security margins on the operating results of Scenario 9 and Scenario 11. As shown in Fig. 1 8, as the frequency security margin requirement decreases, both the total operating cost and wind curtailment rate decrease. Notably,when the frequency security margin falls below a certain threshold, scenario 11 yields the same operating results as scenario 9. This indicates that when the frequency security margin requirement is sufficiently low, the frequency constraint becomes ineffective. In actual operation, an appropriate frequency security margin should be selected to balance the economy and safety of system operation.
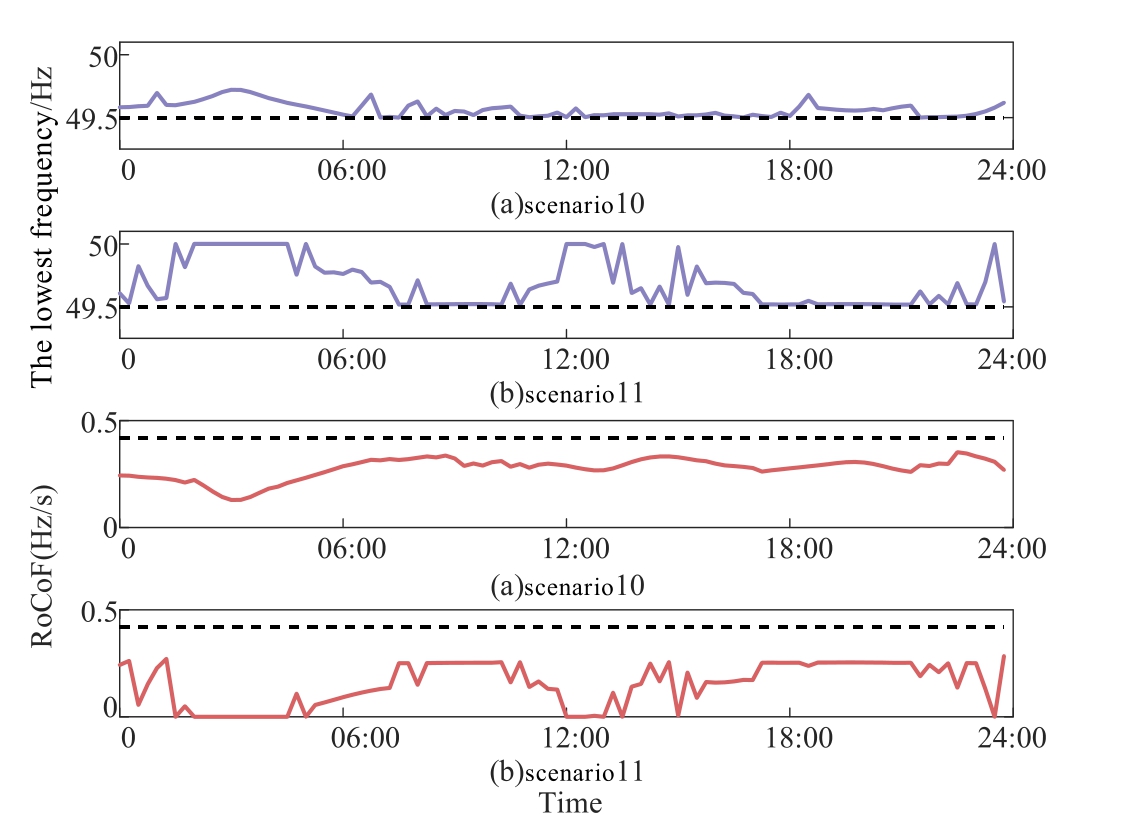
Fig. 16. Frequency indicators of Scenarios 10 and 11.
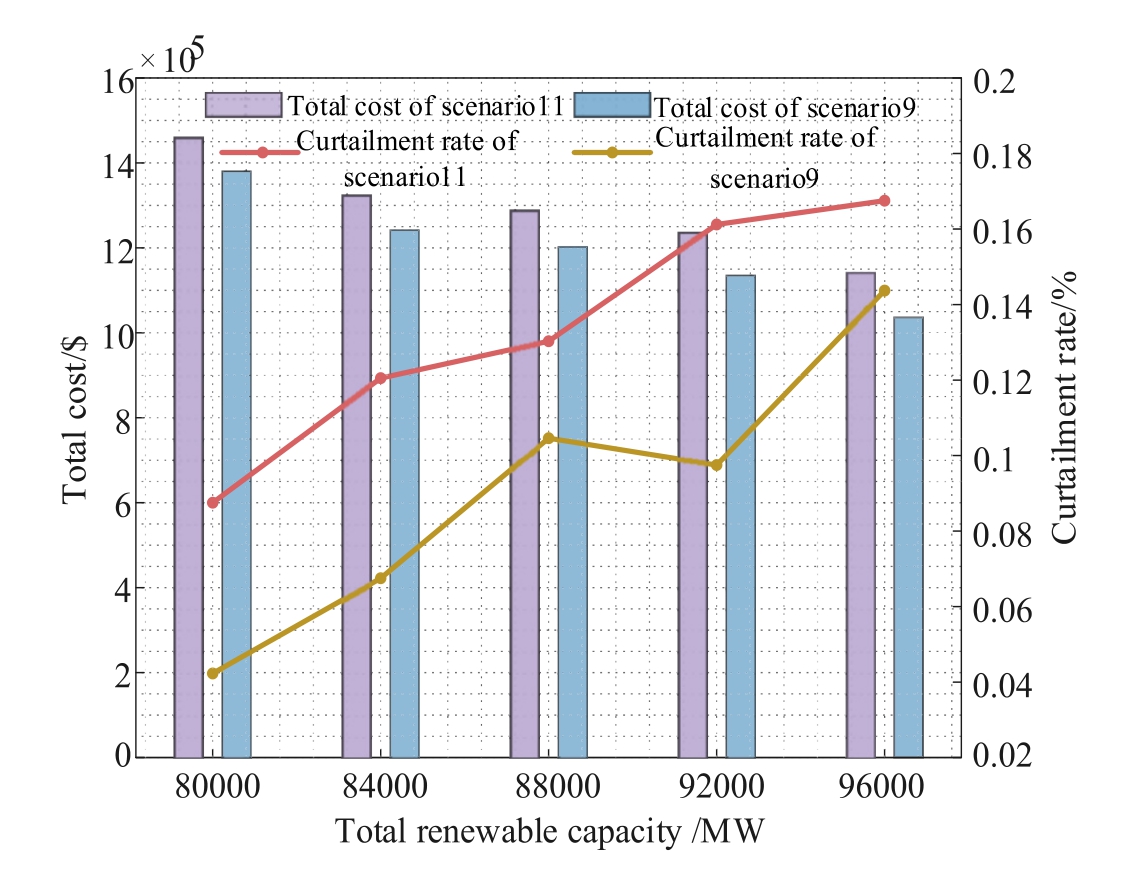
Fig. 17. Impact of renewable energy capacity.
5 Conclusion and future outlook
This paper considers dynamic frequency security constraints in the model scheduling stage and establishes a power system optimization scheduling model based on probabilistic power balance. Through example simulation,we achieve a balance between computational efficiency and optimization accuracy:although solution time increases by 18.4% compared to the scenario method, total cost decreases by 6.7%.The specific conclusions are as follows:
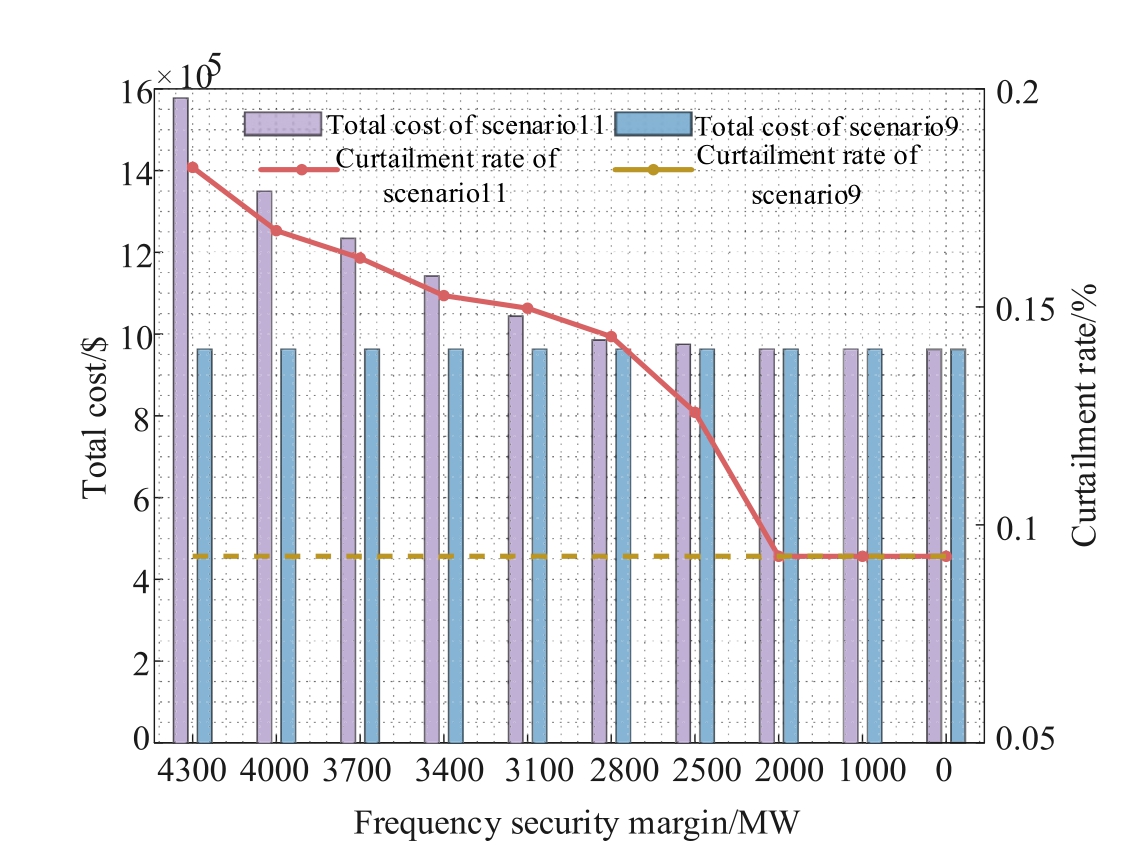
Fig. 18. Impact of frequency security margin.
1) The probabilistic power balance optimization scheduling model not only provides more rational dispatching schemes under uncertain environments but also significantly reduces power supply–demand imbalances in actual operations. Compared with the scenario-based optimization model, the statistical value of power supply–demand deviation of this model is reduced by approximately 15%. Moreover,in 90% of the simulation scenarios, the power deviation can be less than 50 MW, while the scenario method achieves this level in only 72% of the scenarios.
2) Both frequency security constraints and the probabilistic power balance model contribute positively to mitigating frequency deviations. However, the former exhibits a more pronounced impact, while the latter indirectly facilitates frequency deviation reduction by minimizing source-load imbalance power.
3) When the required frequency security margin is sufficiently low, frequency constraints become ineffective. In practical operations, an appropriate frequency security margin should be selected to balance the system’s economic efficiency and safety. Scenarios considering frequency security constraints have the maximum reduction of frequency nadir deviation by 0.3 Hz compared with unconstrained scenarios; while under the same frequency security constraints, the statistical value of frequency deviation in scenarios using the probabilistic power balance model is further reduced by 20% compared with the scenario-based optimization method.
4) Probabilistic power balance constraints form a complementary optimization path with frequency security constraints by optimizing the distribution matching degree of source-load power. The former indirectly alleviates frequency regula tion pressure by reducing the probability of power imbalance,while the latter ensures stability under extreme conditions through rigid thresholds.
This paper does not consider power grid transmission losses, but transmission losses are potential factors affecting system economy and frequency stability. In the follow-up research, it will be further improved by combining with DC/AC power flow equations. In addition, in terms of the robustness verification of the model, this paper mainly verifies the effectiveness of the method through typical scenario simulations, but there is a lack of adaptability analysis for extreme operating conditions(such as sudden large-scale renewable energy disconnection, sudden load surges or drops, etc.). In the future, a robust optimization framework can be introduced to construct a two-layer verification system of ‘‘nominal scenarios + extreme disturbance sets”. By quantifying the performance degradation curves of the model under different risk levels, the reliability of the model will be improved.
CRediT authorship contribution statement
Zhiwei Li: Writing – review & editing, Supervision, Project administration, Conceptualization. Jiakai Wang:Writing – original draft, Software, Resources, Investigation. Nayang Dong: Formal analysis, Data curation. Yuze Zhao: Validation, Methodology.
Declaration of competing interest
The authors declare that they have no known competing financial interests or personal relationships that could have appeared to influence the work reported in this paper.
Acknowledgments
This work is supported by National Natural Science Foundation of China (52307098).
Appendix A
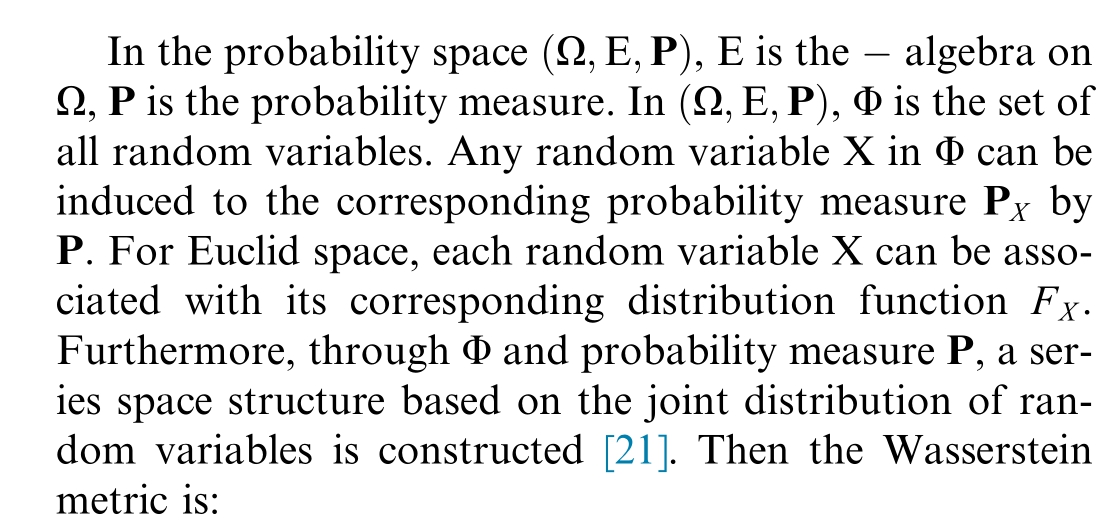

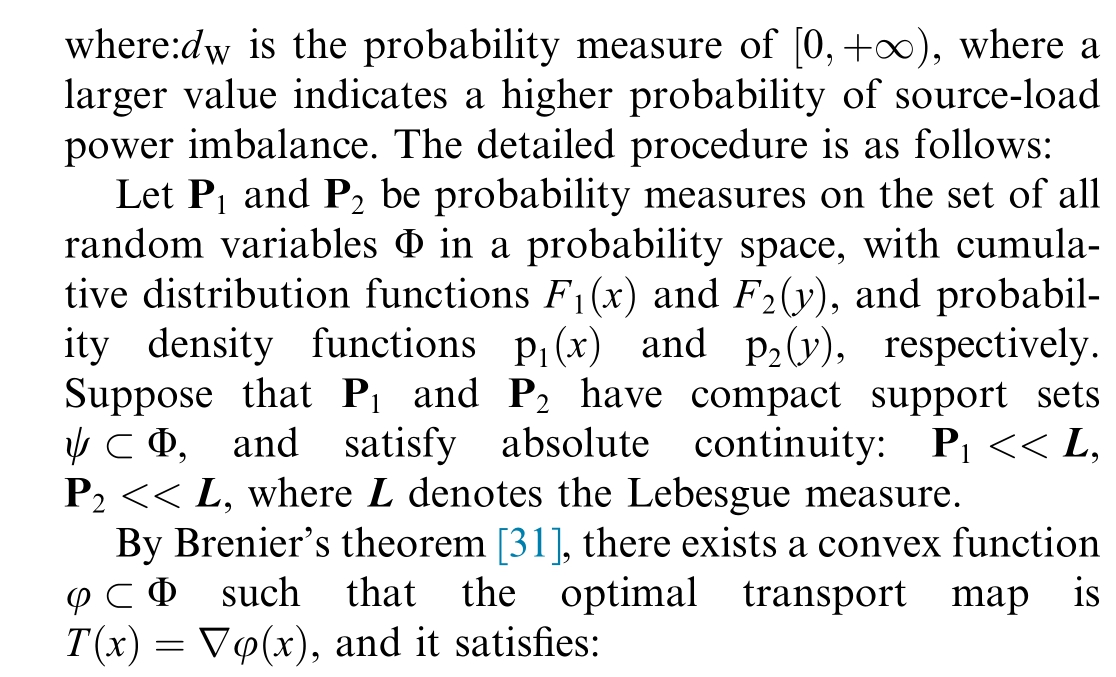

From Eq. (A2), it follows that Y = T(X), and the Wasserstein distance can be expressed as:

The probability that the discrepancy between probability measures P1 and P2is zero can be expressed as:

where, γ is the joint distribution of P1 and P2,and θ denotes the Dirac function.







By the definition of the total variation dist ance, it can be decomposed as:

Substituting Eq. (10) into Eq. (A8), we obtain:

From Eq. (A11), it follows that:

Thus, when
Appendix B
(1) Priority factors A 1 and A2
First priority A1: Corresponding to the source-load probabilistic power balance objective, ensuring the maximum probability matching between power supply and load under full-power scenarios, thereby reducing power disturbances from the source. As this objective is directly linked to frequency security, it is treated as the top priority.
Second priority A2: Corresponding to the minimization of the total system cost, optimizing economy under the premise of meeting frequency security requirements.
Based on the principle that ‘‘safety takes precedence over economy” in the economic dispatch of power systems, A1 should be far greater than A2, reflecting the rigid constraint through an order-of-magnitude difference. To ensure that the power balance objective is prioritized during the optimization process and that the frequency security indicators (frequency nadir  49.5 Hz, RoCoF
  0.42 Hz/s) are satisfied, we set A1 = 1000 and A2 = 1.
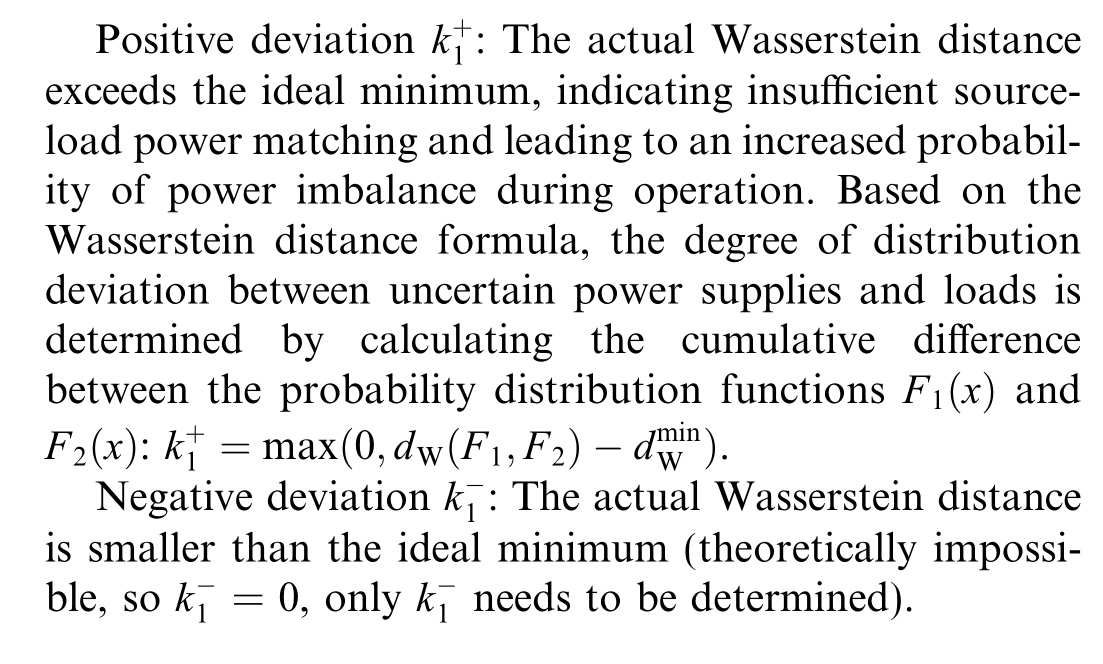
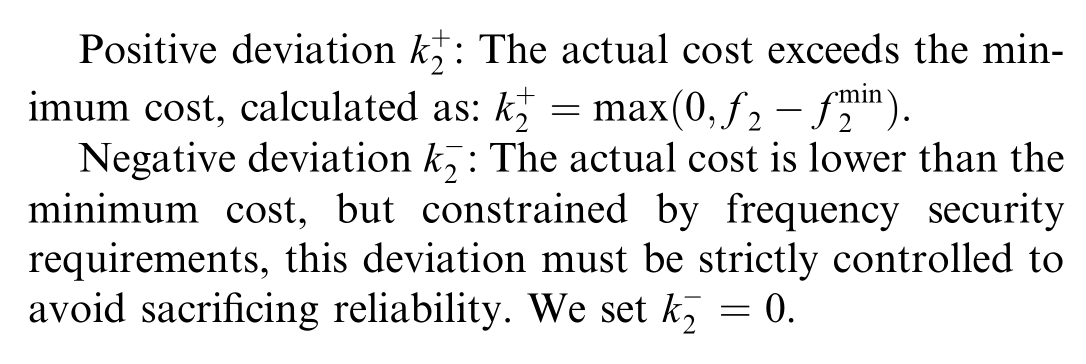
(2) Positive and Negative Deviation Variables and
and
1) Deviation variables for Objective Function 1(Power Balance):
2) Deviation variables for Objective Function 2 (Total Cost):
(3) Weight coefficients u 1, v 1, u 2, v2
1) Weight coefficients for objective function 1:u 1, v1
Positive deviation weight u 1:quantifies the impact of insufficient power matching on frequency security, set as u 1= 1 (reference unit).
Negative deviation weight v 1:Since there is no ‘‘overoptimization” issue in power matching,v 1= 10 is adopted(to minimize positive deviations, as referenced in Appendix A: smaller Wasserstein distance indicates higher matching probability).
2) Weight coefficients for objective function 2: u 2, v2
Positive deviation weight u 2:controls cost overruns(positive deviations), set as u 2= 10 based on unit cost parameters to en sure chance constraint satisfaction.
Negative deviation weight v 2:permits cost savings (negative deviations), set as = 1 to avoid compromising frequency security for excessive economic optimization.
(4) Flowchart
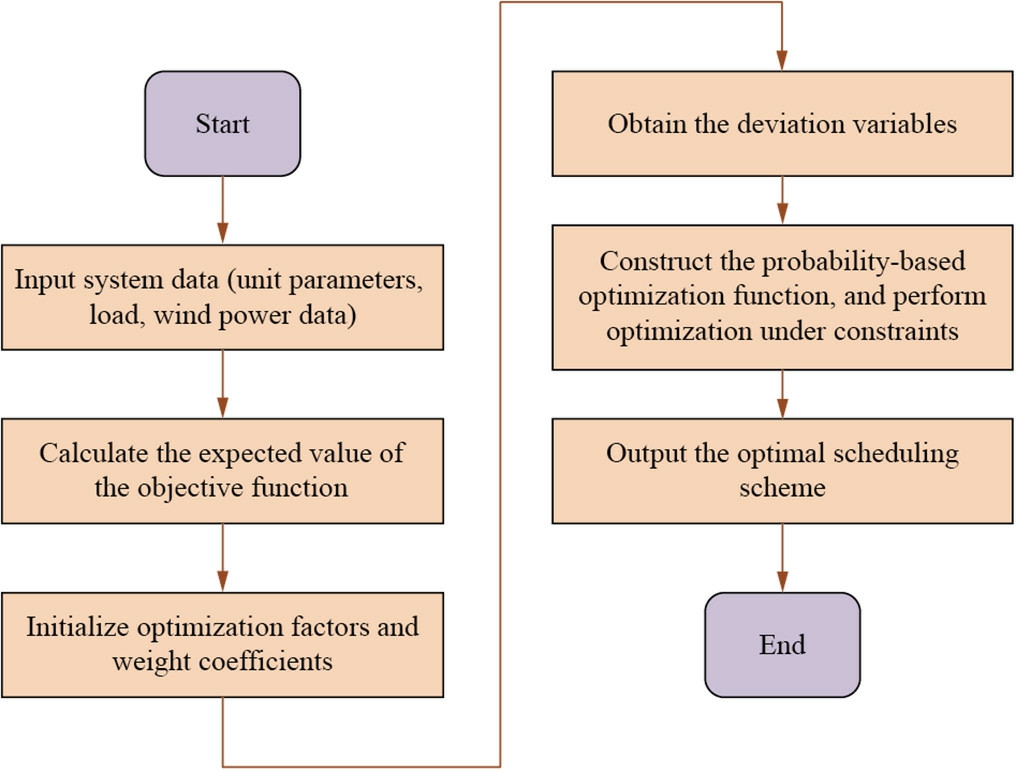
Fig. B1. Flowchart for solving the proposed go al programming model
(5) Sensitivity Analysi s
Sensitivity analyses are conducted for the ne gative deviation weight v 1 and positive deviation weight u2.
1) Sensitivity analysis of the negative deviation weight v1.
Table B1 The results of each scenario.
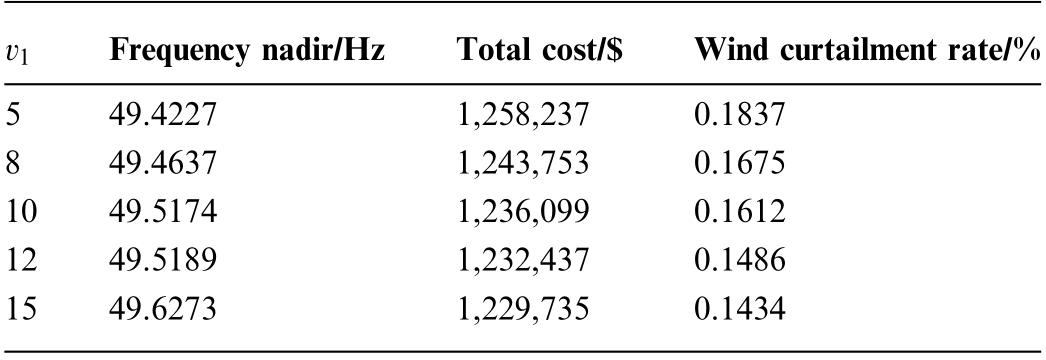
As analyzed in Table B1, when the negative deviation weight v 1increasesfrom5 to15,thewindcurtailmentrate decreasesfrom18.37%to 14.34%,thetotalcostonly decreases by 2.3%, and the change in the freque ncy nadir is not obvious.This indicates that the negative deviation weight v 1has a smallimpactoneconomy,provingthe settinglogicof‘‘excessivepower matching poses no threat to frequency”.
2) Sensitivity analysis of the positive deviation weight u2
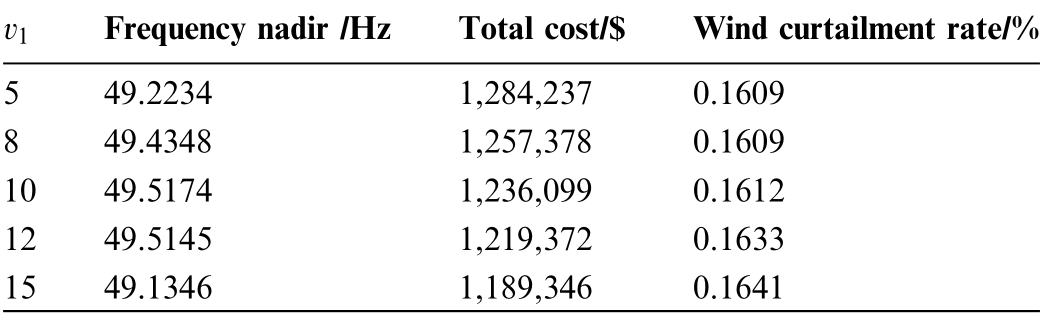
As analyzed in Table B2, when the positive deviation weight u 2increases from 5 to 15, the total cost decreases by 7.4%, but frequency security significantly deteriorates,the frequency nadir drops from 49.2 Hz to 49.1 Hz, falling below the 49.5 Hz frequency security requirement set in this paper. This indicates that both excessively high and low values of u 2introduce frequency security risks. Furthermore, the wind curtailment rate only increases by 2%, demonstrating that u 2primarily affects the trade-offbetween cost and security, with limited impac t on renewable energy absorption capacity.
Table B2 The results of each scenario.
References:
[1]Research Group of Chinese Energy Development Strategy, Research on Mid-and Long-Term (2030, 2050) Energy Development Strategy of China: Comprehens ive Volume, Science Press, Beijing, 2011.
[2]Q. Hou, E. Du, N. Zhang, C. Kang, Impact of high renewable penetration on the power system operation mode: a name="ref3" style="font-size: 1em; text-align: justify; text-indent: 2em; line-height: 1.8em; margin: 0.5em 0em;">[3]E. Du et al., Managing wind power uncertainty through strategic reserve purchasing, IEEE Trans. Power Syst. 32 (4) (2017) 2547–2559.
[4]N. Nguyen, J. Mitra, An analysis of the effects and dependency of wind power penetration on system frequency regulation, IEEE Trans. Sustain. Energy 7 (2016) 354–363.
[5]L. Xie et al., Wind integratio n in power systems: operational challenges and possible solutions, Proc. IEEE 99 (1) (2011) 214–232.
[6]J.F. Restrepo, F.D. Galiana, Unit commitment with primary frequency regulation constraints, IEEE Trans. Power Syst. 20 (4)(2005) 1836–1842.
[7]G.W. Chang, C. Chuang, T. Lu, C. Wu, Frequency-regulating reserve constrained unit commitment for an isolated power system,IEEE Trans. Power Syst. 28 (2) (2013) 578–586.
[8]H. Chavez, R. Baldick, S. Sharma, Governor rate-constrained OPF for primary frequency control adequacy, IEEE Trans.Power Syst.29 (3) (2014) 1473–1480.
[9]Y. Wen, W. Li, G. Huang, X. Liu, Frequency dynamics constrained unit commitment with BES, IEEE Trans. Power Syst. 31 (6) (2016) 5115–5125.
[10]H. Ahmadi, H. Ghasemi, Security-cons trained unit commitment with linearized system frequency limit constraints, IEEE Trans.Power Syst. 29 (4) (2014) 1536–1545.
[11]F. Teng, V. Trovato, G. Strbac, Stochastic scheduling with inertia dependent fast frequency response requireme nts, IEEE Trans.Power Syst. 31 (2) (2016) 1557–1566.
[12]M. Paturet, U. Markovic, S. Delikaraoglou, E. Vrettos, P.Aristidou, G. Hug, Stochastic unit commitment in low-inertia grids, IEEE Trans. Power Syst. 35 (5) (2020) 3448–3458.
[13]L.E. Sokoler, P. Vinter, R. Baerentsen, K.Edlund,J.B.Jorgensen,Contingency-constrained unit commitment in meshed isolated power systems, IEEE Trans. Power Syst. 31 (5) (2016) 3516–3526.
[14]M. Mazidi, N. Rezaei, A. Ghader i, Simultaneous power and heat scheduling of microgrids considering operational uncertainties: a new stochastic p-robust optimization approach, Energy 185(2019)239–253.
[15]Y. Li, J. Zhang, X. Wu, et al., Stochastic-robust planning optimization method based on tracking-economy extreme scenario tradeoff for CCHP multi-energy system, Energy 283(2023) 129025.
[16]L. Ju, R. Zhao, Q. Tan, et al., A multi-objective robust scheduling model and solution algorithm for a novel virtual power plant connected with power-to-gas and gas storage tank considering uncertainty and demand response, Appl. Energy 250 (2019) 1336–1355.
[17]Y. Liang, Z. Xu, H. Li, et al., A random optimization strategy of microgrid dispatching based on stochastic response surface method considering uncertainty of renewable energy supplies and load demands, Int. J. Electr. Power Energy Syst. 154 (2023) 109408.
[18]R. Yan, J. Wang, S. Huo, et al., Flexibility improvement and stochastic multi-scenario hybrid optimization for an integrated energy system with high-proportion renewable energy, Energy 263(2023) 125779.
[19]E.W. Anderson, L.P. Hansen, T.J. Sargent, A quartet of semigroups for model specification, robustness, prices of risk, and model detection, J. Eur. Econ. Assoc. 1 (1) (2003) 68–123.
[20]L.P. Hansen, T.J. Sargent, Robust control and model uncertainty,Am. Econ. Rev. 91 (2) (2001) 60–66.
[21]Y. Liu, H. Wang, T. Wang, et al., Volatility ambiguity, portfolio decisions, and equilibrium asset pricing, Manag. Sci. (2024).
[22]Q. Shi, F. Li, H. Cui, Analytical method to aggregate multimachine SFR model with applications in power system dynamic studies, IEEE Trans. Power Syst. 33 (06) (2018) 6355–6367.
[23]A.L. Gibbs, F.E. Su, On choosing and bounding probability metrics, Int. Stat. Rev. 70 (3) (2010) 419–435.
[24]R. Hochreiter, G.C. Pflug, Financial scenario generation for stochastic multi-stage decision processes as facility location problems, Ann. Oper. Res. 152 (1) (2007) 257–272.
[25]V.M. Zolotarev, Probability metrics, Theory Probab. Appl. 28 (2)(1984) 278–302.
[26]Z. Shi et al., A low-carbon economic dispatch for integrated energy systems with CCUS considering multi-tim e-scale allocation of carbon allowance, Appl. Energy 351 (2023) 121841.
[27]A. Charnes, W.W. Cooper, Managemen t Models and Industrial Applications of Linear Programming, Wiley, New York, 1961.
[28]Y. Wang, S. Zhao, Z. Zhou, A. Botterud, Y. Xu, R. Chen, Risk adjustable day-ahead unit commitment with wind power based on chance constrained goal programming, IEEE Trans. Sustain.Energy 8 (2) (2017) 530–541.
[29]M. Paturet, U. Markovic, S. Delikaraoglou, et al., Stochastic unit commitment in low-inertia grids, IEEE Trans. Power Syst. 35 (5)(2020) 3448–3458.
[30]A.J. Conejo, Y. Cheng, N. Zhang, C. Kang, Long-term coordination of transmission and storage to integrate wind power, CSEE J. Power Energy Syst 3 (1) (2017) 36–43.
[31]F. Santambrogio, Optimal Transport for Applied Mathematicians,Springer International Publishing, Cham, 2015.
[32]C. Villani, Optimal Transport: Old and New, Springer, Berlin,2008.
Received 8 May 2025;revised 16 November 2025; accepted 21 December 2025
Peer review under the responsibility of Global Energy Interconnection Group Co. Ltd.
* Corresponding author.
E-mail addresses: zhiwei__li@126.com (Z. Li), wangjiakai13@163.com (J. Wang).
https://doi.org/10.1016/j.gloei.2025.12.001
2096-5117/© 2026 Global Energy Interconnection Group Co. Ltd. Publishing services by Elsevier B.V. on behalf of KeAi Communications Co. Ltd.
This is an open access article under the CC BY-NC-ND license(http://creativecommons.org/licenses/by-nc-nd/4.0/).

ZhiweiLI received the B.S. degree in electrical engineering and automation in 2013, the M.S.degree in power system and automation in 2016,and the Ph.D. degree in electrical engineering from North China Electric Power University in 2019. His research interests include optimal scheduling of novel power systems, renewable energy integration, coordinated optimization of multi-energy systems, and operation of integrated energy system