
0 Intr oduction
Energy indices are vital for evaluating global energy trends and their economic and societal impacts. They provide comprehensive measures of energy market performance, covering key indicators such as prices, supply,demand, and investments. These indices guide investment decisions, set performance standards, and help mitigate risks in energy assets. They are crucial for monitoring energy security, identifying supply chain vulnerabilities,and shaping policies to improve efficiency, sustainability,and fair energy distribution.Energy indices also track progress toward sustainable development goals and influence inflation, consumer power, and business competitiveness,driving innovation in energy-saving technologies and promoting a low-carbon future.
Research highlights the critical role of energy indices in evaluating global energy patterns and their impact on economies and societies [1]. These indices provide insights into the relationships between energy use, economic growth, carbon emis sions, and oil prices, helping policymakers develop strategies for sustainable development[2]. By analyzing trends like renewable energy, decarbonization, and decentralization, countries can reduce greenhouse gas emissions, enhance energy security, and expand access. Modelling and simulation techniques further support the prediction of future energy consumption,GDP, carbon emissions, and human development, aiding decision-making. However, none of the existing indices fully meet the criteria for comprehensive sustainability assessment. Ultimately, energy indices offer a framework for addressing global energy challenges and promoting sustainable economies [3].
Accurate prediction of the World Energy Index (WEI)is crucial for policymakers and investors, providing essential insights for informed decision-making in energy markets [4,5]. Forecasting the WEI helps adapt policy frameworks to address financialization and market dynamics, assess global economic conditions, and anticipate energy needs and oil price constraints [6]. It aids in managing energy risks, developing efficient pricing mechanisms, and informing the creation of energy indexes [7].Precise WEI predictions also help firms optimize energy procurement and reduce waste, while AI-driven forecasts support energy efficiency, budget optimization, and management of energy imbalances in smart grid operations[8–13].
Mathematical-based artificial intelligence (AI) models that rely on extensive data have demonstrated significant promise in utilizing enormous datasets and capturing intricate correlations for the goal of making predictions. These models employ machine learning and deep learning technologies, along with approaches like semantic analysis and cognitive technologies, to assess and forecast many economic, statistical, and technological data. They have the ability to efficiently integrate many forms of data,including as drilling sequence data, stock data, consumption data, product movement data, product specification data, and activity specification data, in order to precisely predict demand and optimize inventory management[14–18]. By integrating big data analytics, these models can offer accurate economic information, enhance economic analysis, facilitate decision-making, and contribute to economic self-regulation [19]. The application of artificial intelligence in scientific and technology forecasting is a developing area that has the capability to improve the precis ion and thoroughness of predictions, especially in the realm of digital transformation and the data economy[20]. These advanced techniques like statistical approaches and machine learning algorithms, and deep learning methodologies have capacity for developing accurate forecasting models and provide the ability to evaluate extensive and intricate information, detect complex patterns,and capture non-linear relationships within the energy market [21–24].
Integrating Iraq’s Gross Domestic Product (GDP) into energy forecasting is key to understanding its relationship with global energy trends. GDP reflects economic activity,influencing energy deman d in high consumption sectors[25]. Models like Particle Swarm Optimization can help estimate GDP growth, while economic complexity frameworks can outperform traditional methods. The impact of oil prices on Iraq’s GDP underscores the need to diversify exports. By including Iraq’s GDP in energy models,analysts can improve prediction accuracy, aiding policymakers and stakeholders in maki ng informed decisions in a dynamic global energy landscape [26]. This study focuses on predicting the WEI using AI models such as K-Nearest Neighbors (KNN), Support Vector Regression(SVR), and Long-Short Term Memory (LSTM), incorporating Iraq’s GDP and other relevant parameters.
A solid theoretical framework underpins the integration of the World Energy Index (WEI) with the selected features in this study. The WEI is a composite indicator that reflects fluctuations in energy demand, supply, prices, and investment, making it inherently linked to macroeconomic performance. Economic theory suggests that Gross Domestic Product (GDP) is both a driver and an outcome of energy consumption, particularly in resource-dependent economies. According to the energy–growth nexus, higher GDP stimulates energy demand through industrialization,infrastructure expansion, and consumption growth, while energy market volatility, in turn, influences GDP through revenue fluctuations, fiscal stability, and investment flows.Iraq’s GDP exemplifies this dual relationship due to its heavy reliance on oil exports, where global energy prices directly determine fiscal health and e conomic output. By situating Iraq’s GDP within the WEI forecasting framework, this study operationalizes the feedback loop between national economic performance and global energy interconnection. Moreover, the use of AI models such as KNN, SVR, and LSTM allows the detection of nonlinear, dynamic relationships that traditional econometric models often fail to capture. This theoretical foundation establishes a clear rationale for the selected features, positioning them as not merely statistical inputs but as variables grounded in well-established energy–economy linkages.
This study seeks to bridge that gap by employing advanced AI models, including K-Nearest Neighbors(KNN), Support Vector Regression (SVR), and Long Short-Term Memory (LSTM), to forecast the WEI while explicitly incorporating Iraq’s GDP as a determinant factor. The contribution lies not merely in applying AI to energy forecasting, but in demonstrating how embedding country-specific economic indicators within global index predictions can yield more accurate, context-sensitive,and policy-relevant outcomes. By doing so, this research advances both methodological and applied understanding of global energy interconnection, offering novel insights into how resource-dependent economies shape, and are shaped by, the broader energy landscape.
1 Literature revie w
Precise prediction of energy use is crucial for firms to strategize energy procurement and prevent wasteful energy utilization, which can result in financial repercussions[10,27]. Utilizing artificial intelligence approaches to predict power usage allows energy businesses to formulate efficient energy pol icies and oil volatility index, enhance energy efficiency, and optimize budgets [11]. This section reviews traditional and AI-ba sed approaches to energy index forecasting. Previous studies highlight the effectiveness of AI models like ANNs, SVMs,and GPR in predicting energy trends.
1.1 Energy index forecasting
Traditional time series models, machine learning approaches, and hybrid models have been extensively studied for forecasting energy indices. The comparison of these methodologies has shown that hybrid models, which combine the advantages of both traditional regression and machine learning techniques, tend to outperform individual models in terms of accuracy and prediction performance [4,28]. Machine learning methods, particularly when applied to short-term forecasting of renewable electricity generat ion,have been found to outperform physical and statistical methods [29]. However, the application of machine learning algorithms to energy forecasting is hindered by challenges such as incomplete and uncertain input data, as well as high computational complexity[30]. To address these challenges, data preprocessing methods such as normalization, anomaly detection, and missing value recovery can be used to improve the efficiency of machine learning models for forecasting renewable energy generation [31]. Additionally, recent developments in probabilistic deep learning have shown promising results in energy forecasting, particularly when dealing wi th large sample sizes and nonlinear patterns.Some of these models are shown in Fig. 1.
Recent research in power systems has increasingly focused on optimizing resource allocation and enhancing operational efficiency. For instance, models have been developed to allocate subsidies to power distribution companies with the goal of reducing losses, providing a structured economic incentive to improve system performance.Additionally, methods for optimal placement and capacity determination of distributed generators (DGs) using genetic algorithms have shown significant potential in minimizing losses and improving voltage profiles,while simultaneously supporting economic and technical objectives.Integrating such approaches highlights the importance of combining economic modeling and optimization techniques to achieve efficient, reliable, and cost-effective power system operation [32,33].
Several methods have been explored for forecasting energy indices. Gurrib [34] found that energy futures indices could predict US stock movements, while Lee and Tong [35] introduced a hybrid dynamic model combining grey models with genetic programming for energy consumption forecasting.Lescaroux[36] focused on global industrial energy demand, and Hassani et al.[37] improved energy forecasts by integrating US EIA data with Google Trends. Traditional time series models, such as ARIMA,VAR, and ARCH, have been effective in energy forecasting, with works by Elsaraiti and Kumar [38] and Weron,et al. [39] showcasing their efficacy in predicting energy consumption and electricity spot prices. Moreover,machine learning (ML) methods, like artificial neural networks (ANN) and support vector machines (SVM), have proven highly accurate in forecasting renewable energy production and consumption,with hybrid models offering superior accuracy.
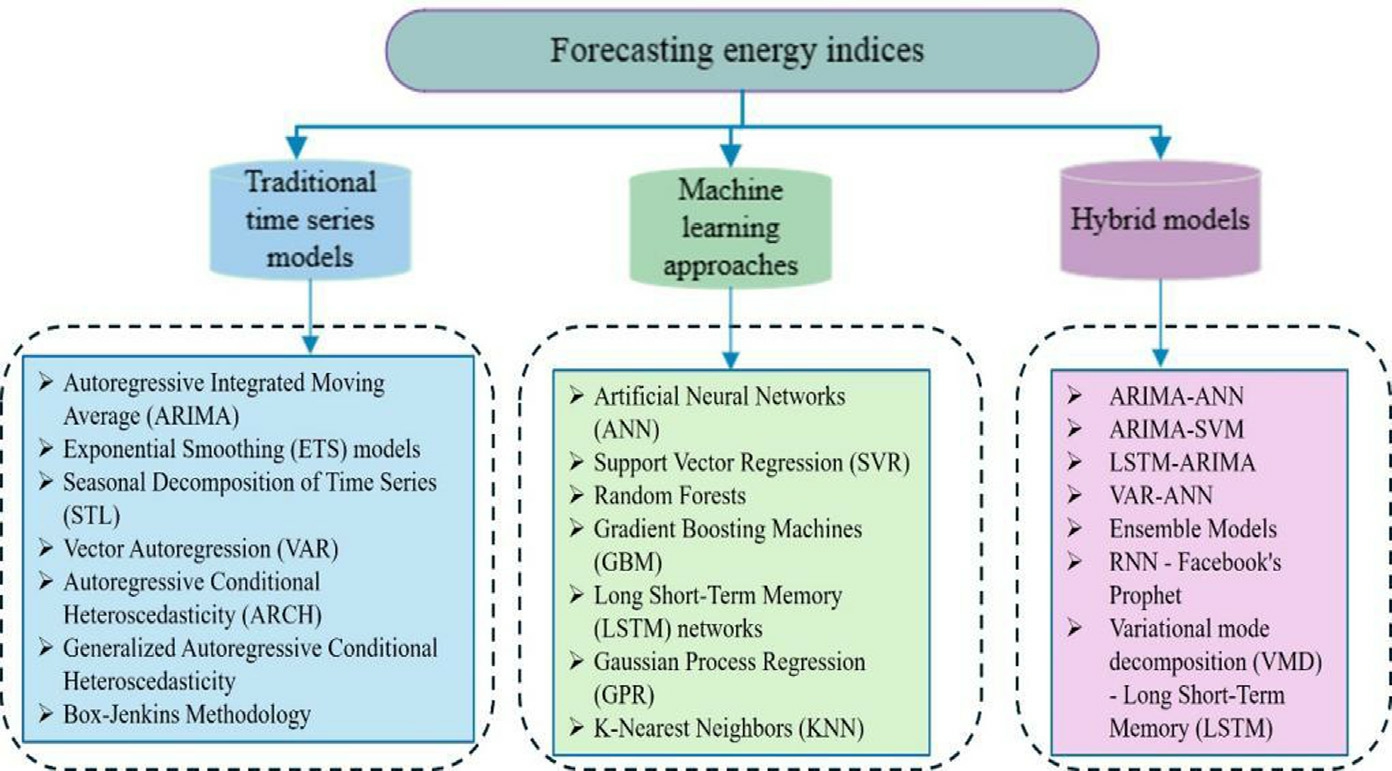
Fig. 1. Different energy indices prediction models.
For instance, Phyo and Byun [40] demonstrated that deep learning hybrid models outperform standalone methods in predicting energy usage. Artificial neural networks(ANN), including multilayer perceptron’s (MLP) and LSTMs, have demonstrated strong performance in forecasting energy demand, surpassing traditional methods like linear regression (LR) and SVM. SVM, combined with optimization techniques, has also proven effective in forecasting energy reserves and usage in various industries.Furthermore, Gaussian Process Regression (GPR) has been successfully applied to forecast energy consumption,outperforming classic models in accuracy. Hybrid models combining deep learning techniques have yielded promising results. For example,Phyo and Byun[40] showed that hybrid models integrating MLP, CNN, and LSTM provided better predictions than standalone models. Similarly,other hybrid approaches, such as those combining regression models with LSTM, improved long-term energy forecasting. These hybrid models are increasingly adopted in energy forecasting tasks due to their ability to handle complex datasets and provide more accurate predictions.Finally, various studies emphasize the importance of economic fact ors, such as GDP, inflation, and metal prices,in energy forecasting. For instance, fluctuations in GDP and inflation in major energy-consuming countries like the US and China significantly impact global energy trends, while metal prices affect production costs in energy-intensive industries. The current study builds upon these insights, considering nine key variables, including metal prices, GDP, and inflation, to improve forecasting accuracy for the World Energy Index. How ever, research gaps remain in addressing the influence of war-affected nations like Iraq on energy forecasts.
2 Data visualization and soft compu ting development methodology
2.1 Data visualization
The 348 datasets selected for this analysis provided significant insights into the energy index fluctuation under examination because they were directly related to the goals of the study. The study employed datasets sourced from reliable and trustworthy sources to enhance the analysis’s reliability for work purposes. Infield and Freris [41]reported that between 2011 and 2021, the global electricity supply from renewable energy sources increased from 20%to 28%, while the contribution of fossil fuels decreased from 68% to 62%. The chosen time frame, spanning from January 1, 1994, to December 31, 2022, allows the proposed energy index model to include significant historical events and patterns that are relevant to the study question,ensuring a comprehensive analysis of the data. Data preprocessing involved normalizing and dividing datasets into a training dataset, which accounted for 75% of the total,and a testing set, which accounted for the remaining 25%. addressing missing values. Fig. 2 shows the distribution of the data in each variable’s based on the frequency plot to provide clear visual representation, aiding in understanding central tendencies, variability, and patterns within the dataset efficiently and comprehensively.
Fig. 2 presents the frequency distribution plots for all the variables considered in this study. These plots provide a visual summary of the underlying data distribution,highlighting patterns, skewness, and the presence of any outliers.
The plots shape and spread indicate the distribution shape of each variable, whether approximately normal,skewed (positively or negatively), or uniform. Variables with near-normal distributions suggest that standard pa rametric statistical techniques could be appropriate, while skewed distributions may require transformation or nonparametric methods.
The Peaks in the frequency distributions show where most of the observations are concentrated, giving insight into the mean and median values of the variables.
The spread of the plots highlights the range and dispersion of each variable, helping to identi fy variables with high variability that might influence model stability or error.
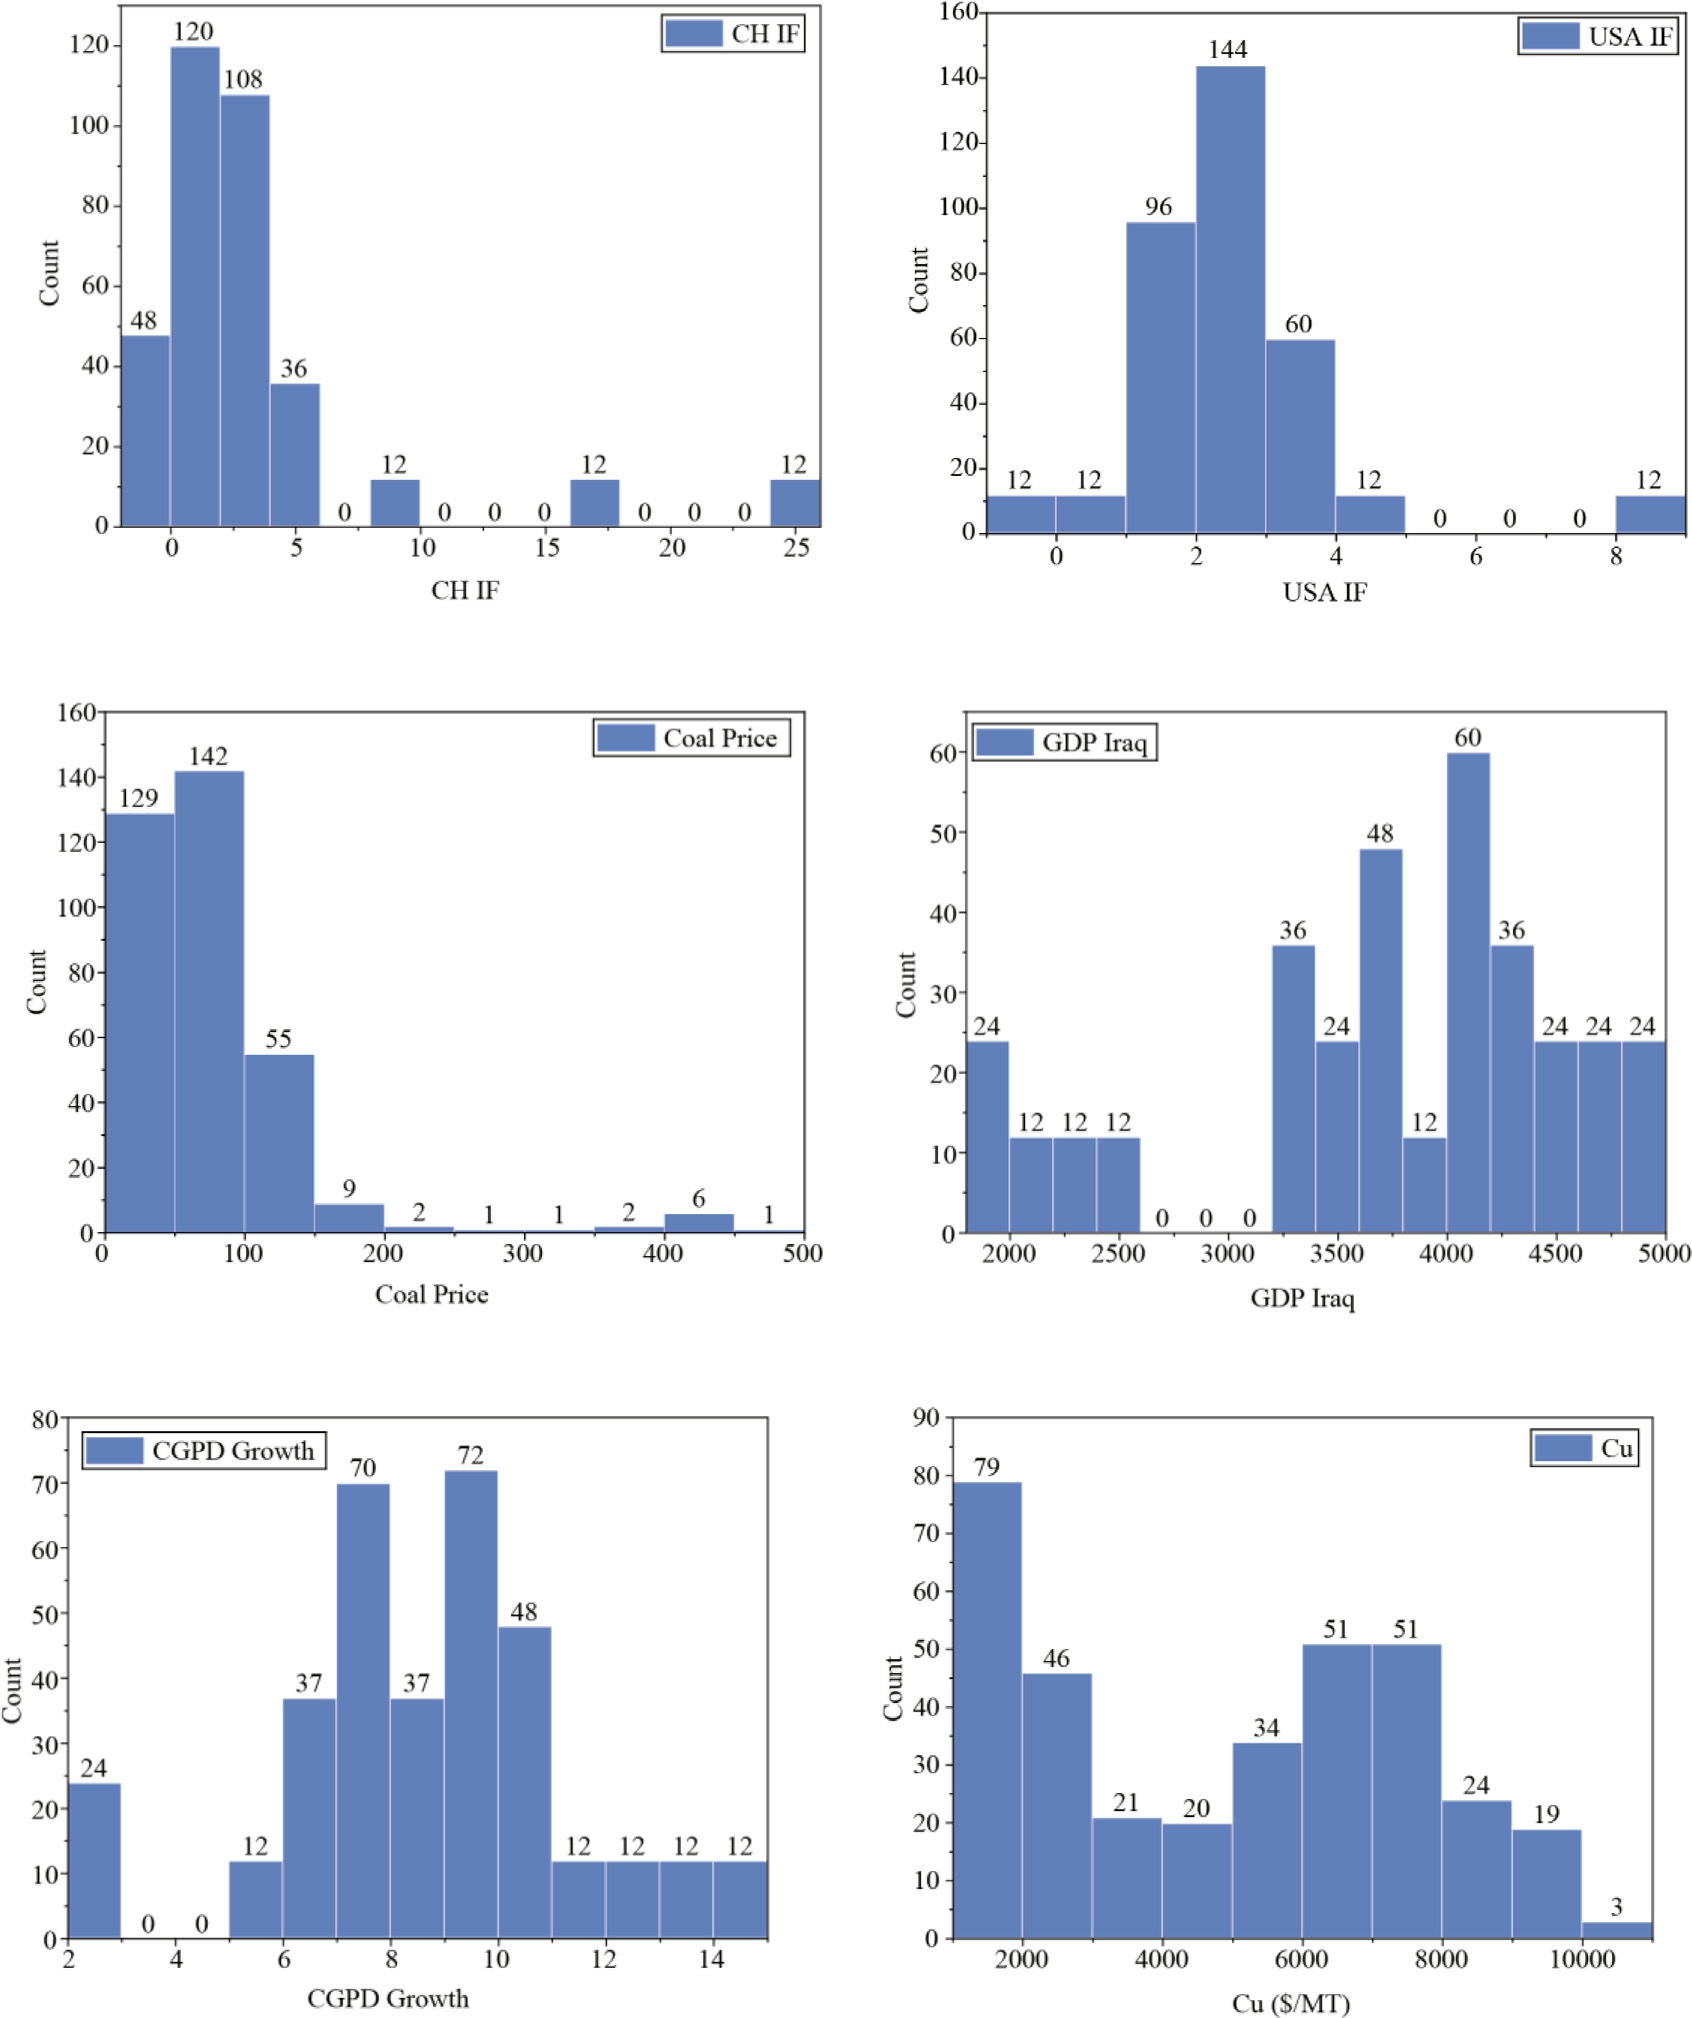
Fig. 2. Frequency distribution plots of all variables.
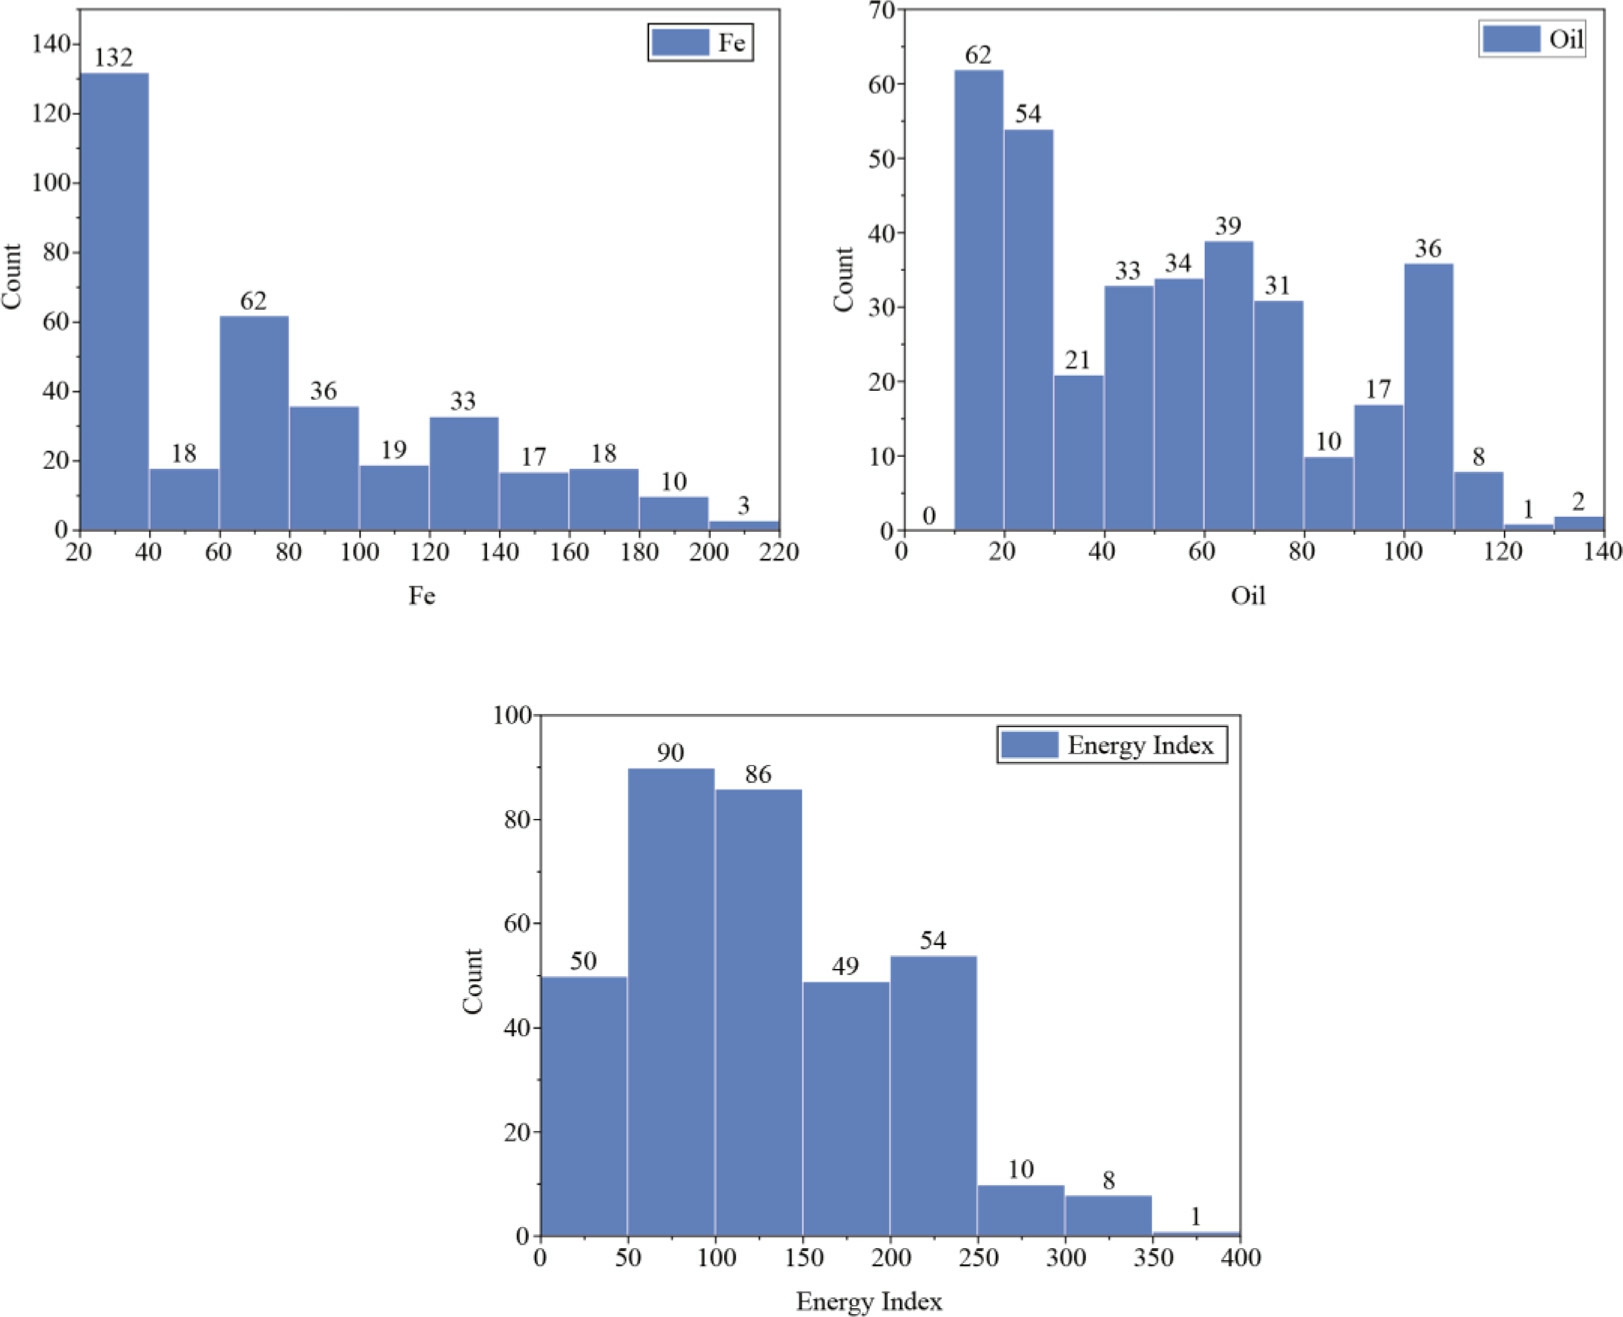
Fig 2. (continued)
Violin plots, also known as box-and-whisker plots, are valuable tools in statistics for visually representing the distribution and central tendency of a dataset [42]. The box plot was used to displays key summary statistics of the model data, including the median, quartiles, and potential outliers. The range from the 25th percent ile (Q1) to the 75th percentile (Q3) is depicted within the box portion of the plot as shown in Fig. 3. Based on Fig. 3, the energy index variables distribute between 50–150 based on Q1 and Q3 distribution result.
The Grouped marginal (GM) plot represents a visual tool used to understand how different factors, like energy consumption and GDP, relate to the World Energy Index.It arranges graphs in a grid, each showing how the index changes when one factor is held constant while others vary. By studying these plots, researchers can see which factors most affect the index and whether they interact in unexpected ways. This helps in building better forecasts for global energy trends, guiding decisions on energy policies and investments [41]. Fig. 4 illustrates the grouped marginal plot in this study, which scatters the 348 data points at a density ranging from 100 to 400 for energy index. The scatter range is different for all input variables.Particular for Oil and Energy index the scatter ranges in continuous way at a range of 20–140 for oil and 50–400 for energy index.
Fig. 4 presents the Grouped Marginal (GM) plots for each input variable against the target variable. These plots provide a visual representation of the relationship between individual input features and the output, highlighting how changes in each input may influence the predicted outcome. From the GM plots, it can be observed that some variables exhibit a strong positive or negative correlation with the target, indicating their high influence on the model predictions. Other variables show relatively flat or non-linear trends, suggesting a more subtle or complex impact on the target. These insights are valuable for feature selection and model interpretation, as they help identify which inputs contribute most significantly to the output and which may require further transformation or engineering to improve predictive performance.
Fig. 5 shows Pearson correlation plot which ranges from 1 to 1. Based on this Cu, Fe, Oil, and coal price are correlated with maximum positive value with the output energy index with values 0.87, 0.82, 0.97, an d 0.77 respectively.In similar fashion,Fig. 6 illustrates spearman,correlation plots which ranges from 1 to 1 like Pearson correlation. However, this method is applicable when the relationship between variables is assumed to be nonlinear. In this study, Cu, Fe, oil, and coal prices exhibit strong positive correlations with the output energy index,with correlation values of 0.89,0.88,0.99,and 0.86,respectively.Similar trends are observed in both the Pearson and Spearman correlation analyses.
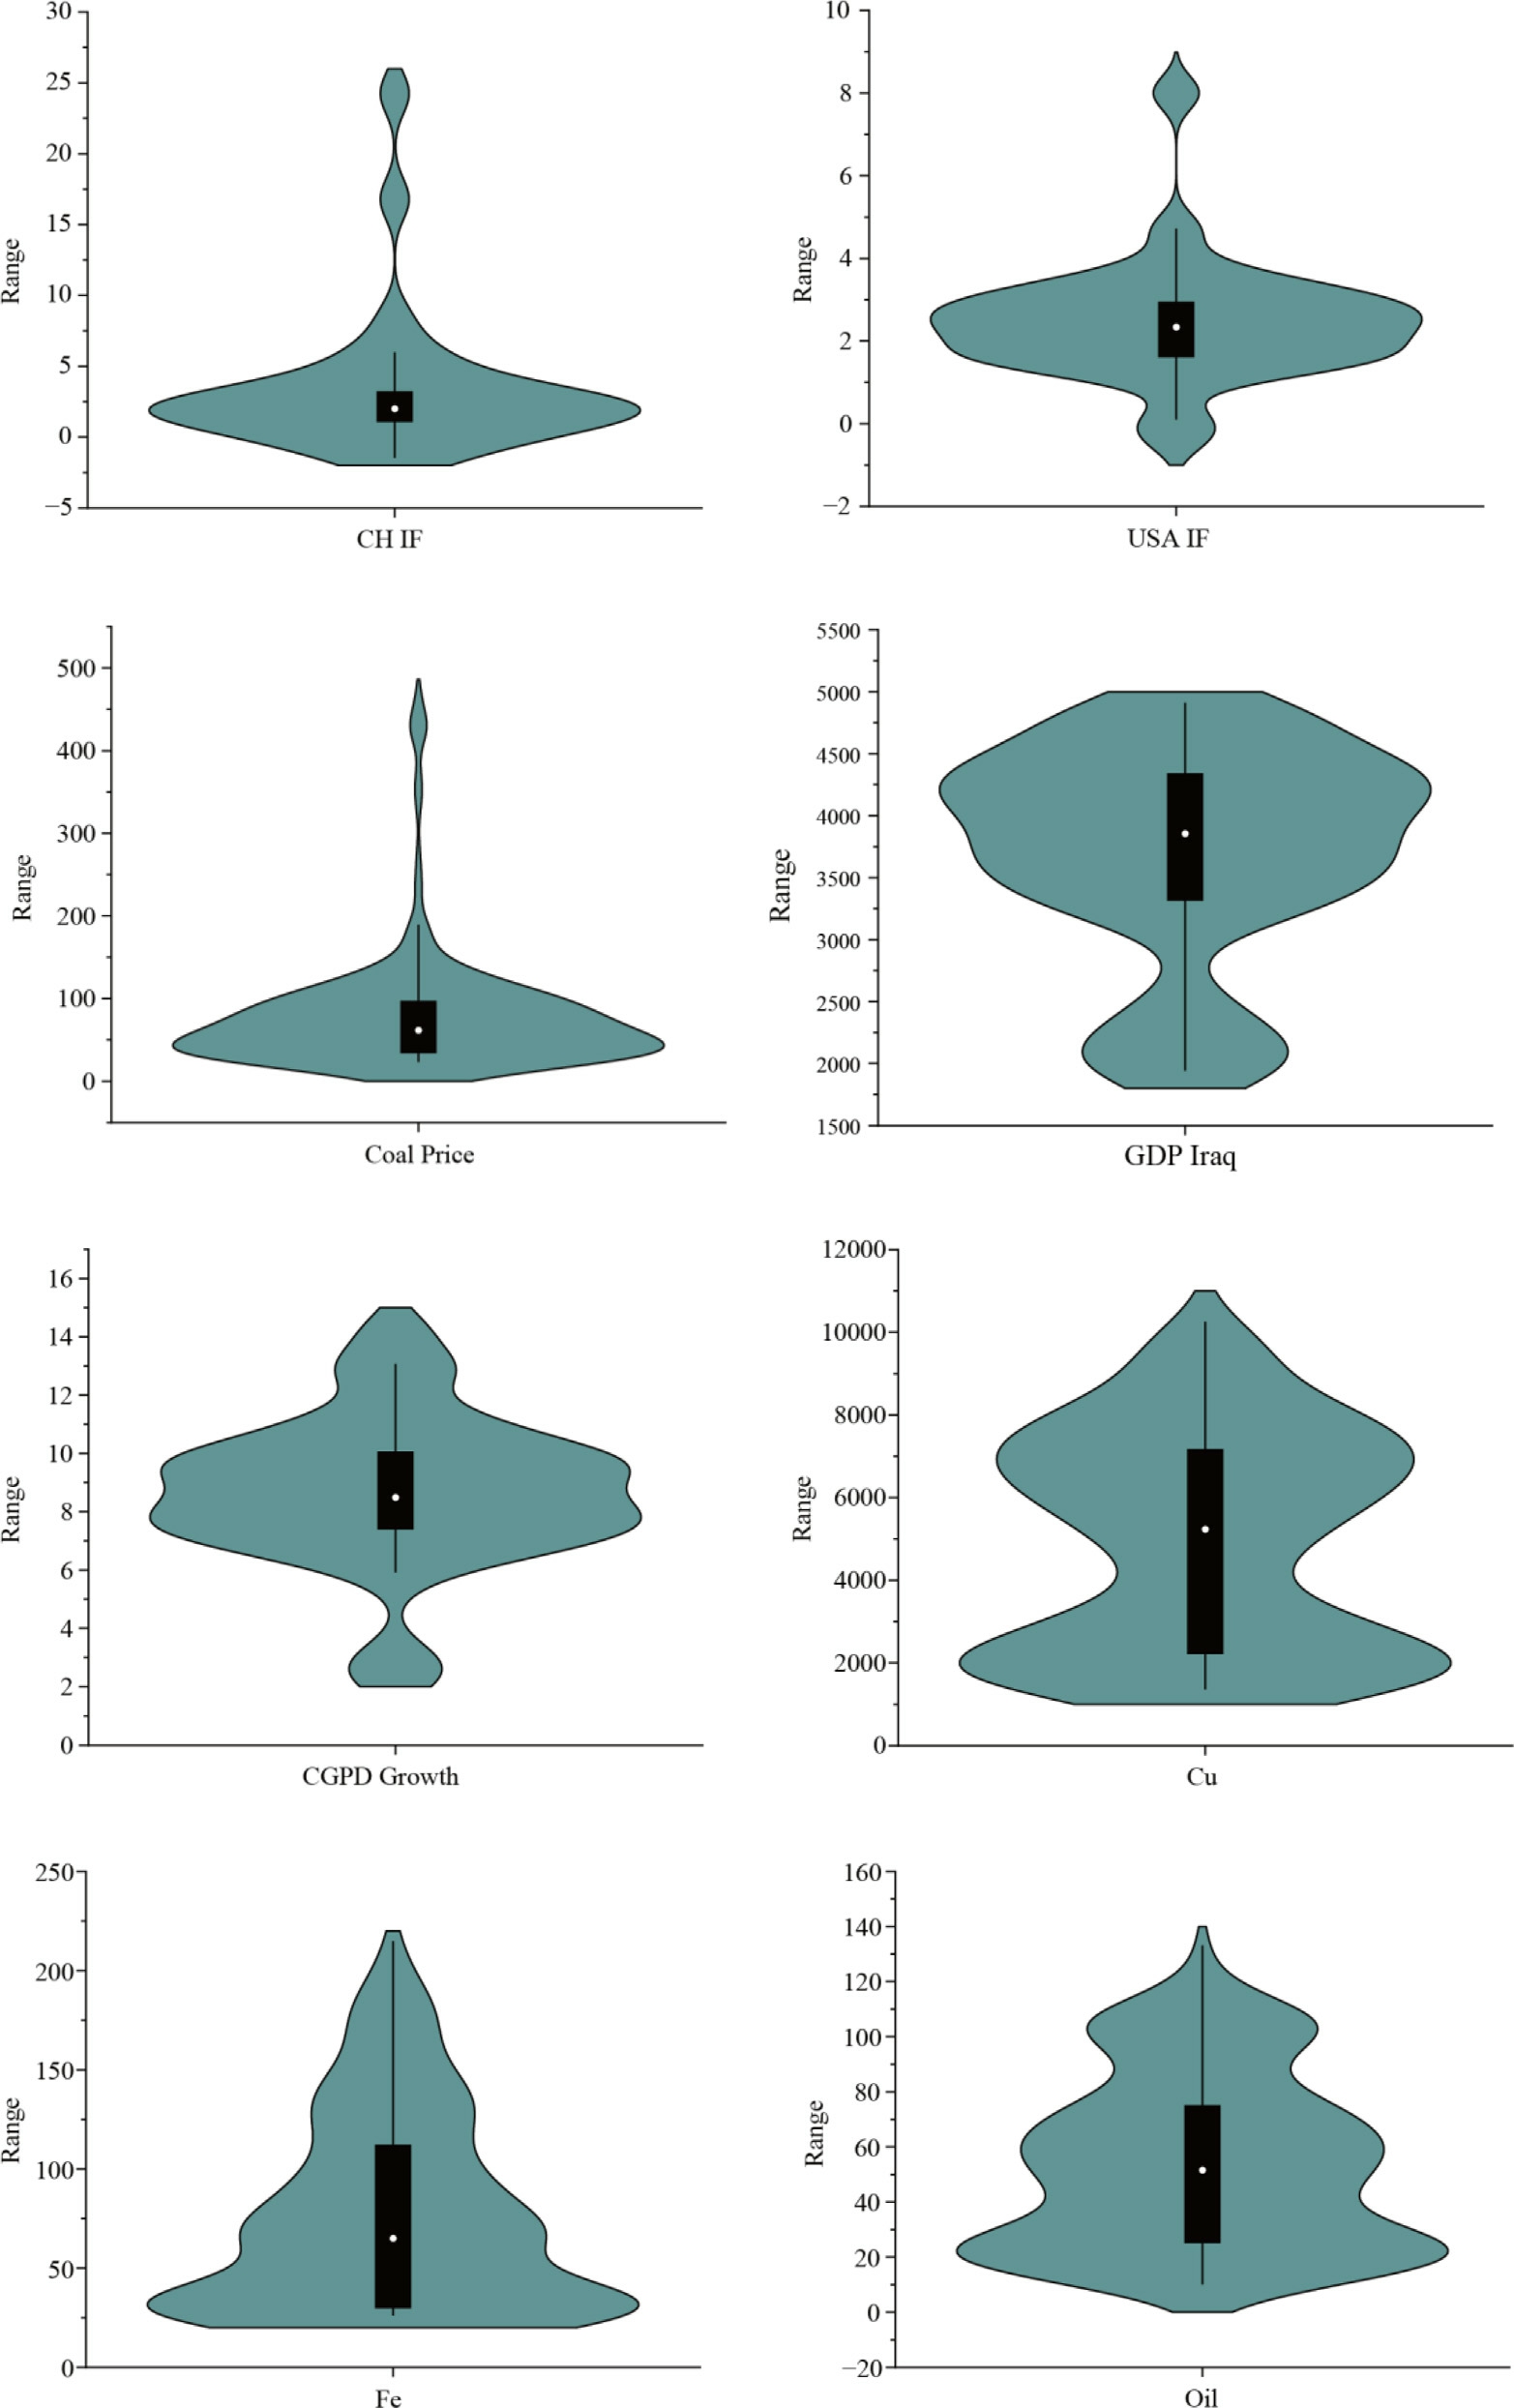
Fig. 3. Violin plots of all variables range from the 25th percentile (Q1) to the 75th percentile (Q3).
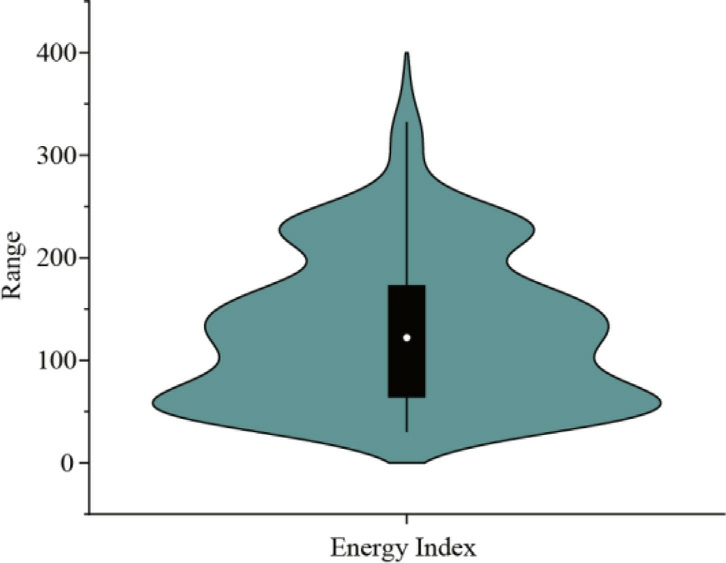
Fig 3. (continued)
Utilizing 3D map plots to forecast the World Energy Index, incorporating variables like coal, oil, and iron ore, offers a robust analytical method. These visualizations provide simultaneous insights into multiple dimensions,facilitating a deeper grasp of the relationships between energy factors. By dynamically portraying intricate data sets, 3D maps plots empower to analys e historical trends,detect cyclical patterns, and project future trends under various scenarios. Furthermore, these visualizations serve as effective communication tools, simplifying complex information into intuitive representations that assist decision-making for policymakers and industry stakeholders. Fig. 7 depicts the 3D map plot of the target output with each two input variables. There is a less 3D coverage among the energy index with CH IF and USA IF.
The Scatter matrix plots help visualize pairwise relationships between the input and output variables, aiding in identifying patterns and trends.Also,the Pearson correlation plots quantify linear relationships between variables, providing insights into their strength and direction. Based on this plot result, it was found that oil and energy index have positively correlated with 0.97 value. In a similar manner Cu and Fe are also positively correlated with energy index. The scatter matrix plot of this study is depicted in Fig. 8.
To compare the feature of several individual observations (series) on a set of numeric variables Parallel plot or parallel coordinates plot allows. Each vertical bar represents a variable and often has its own scale. (The units can even be different).
Fig. 9 presents the Energy Index time series plot, which illustrates the fluctuations in Iraq’s energy index over a specific period. This plot highlights the dynamic changes in the country’s energy performance, tracking variations in energy production,consumption,or overall energy market trends.
2.2 Model development methodology
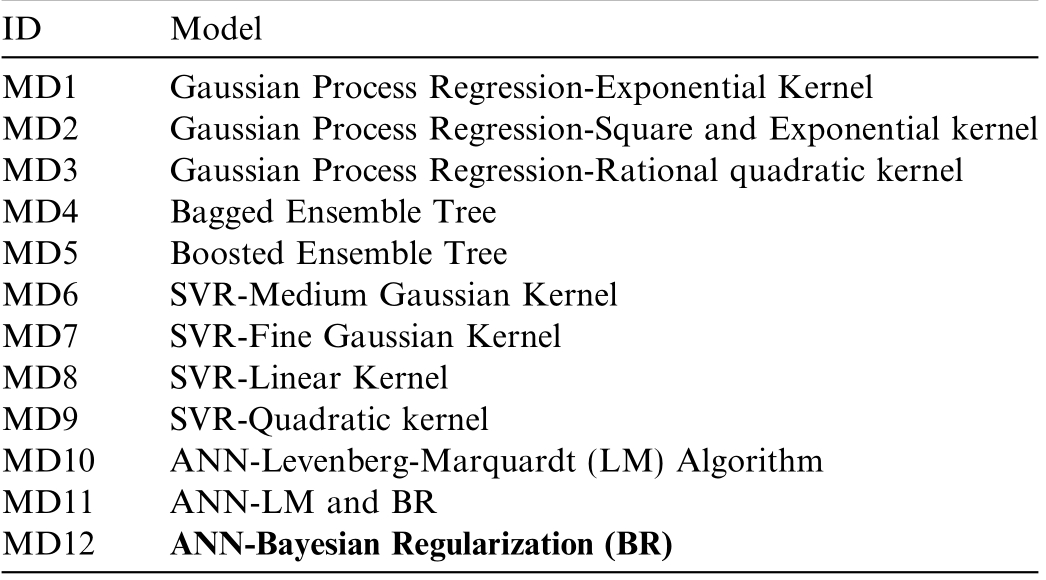
To achieve the study objectives, twelve AI models were used to predict the WEI, incorporating nine parameters,including Iraq’s GDP. Model performance was assessed using various metrics, such as root mean square error,mean absolute error, correlation coefficient, coefficient of determination, mean absolute percentage error, variance accounted for, and Performance Error Index (PEI). The models were compared to determine the most accurate forecasting approach. Model ID and artificial intelligence techniques are present in Table 1. The dataset was partitioned into k equally sized folds (in this study, k= 10).At each iteration, one-fold was held out as the validation set while the remaining k–1 folds were used to train the model. This process was repeated 10 times, ensuring that each data point was used once for validation and k–1 times for training. The average performance metrics (e.g., R2,RMSE, MAE) across the folds were then computed to provide a reliable estimate of the model’s predictive performance while minimizing bias from random sampling.
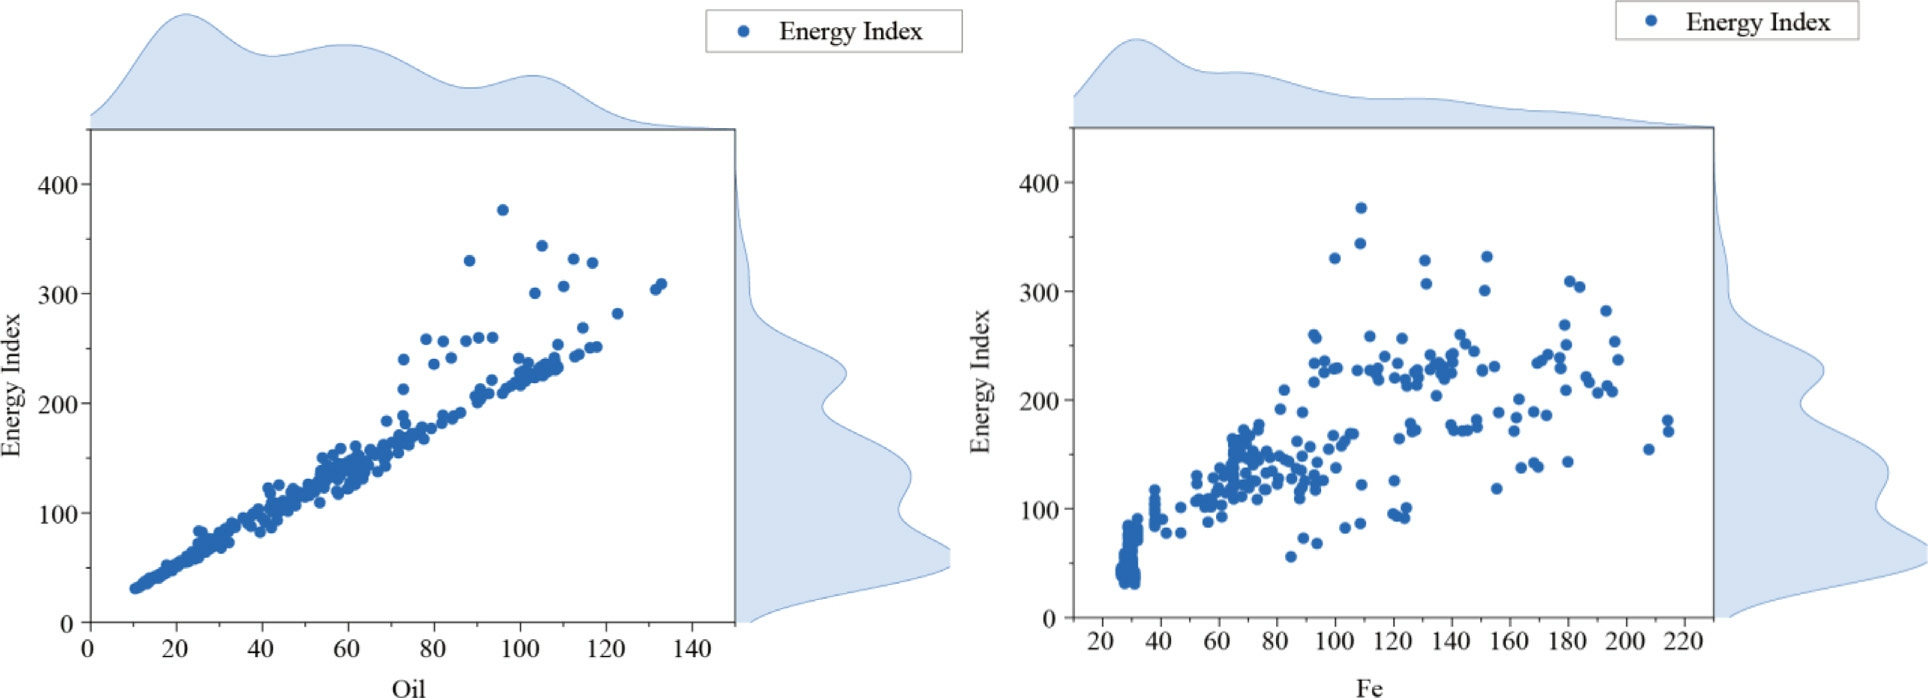
Fig. 4. Grouped marginal (GM) plot of each input variable with the target variable.
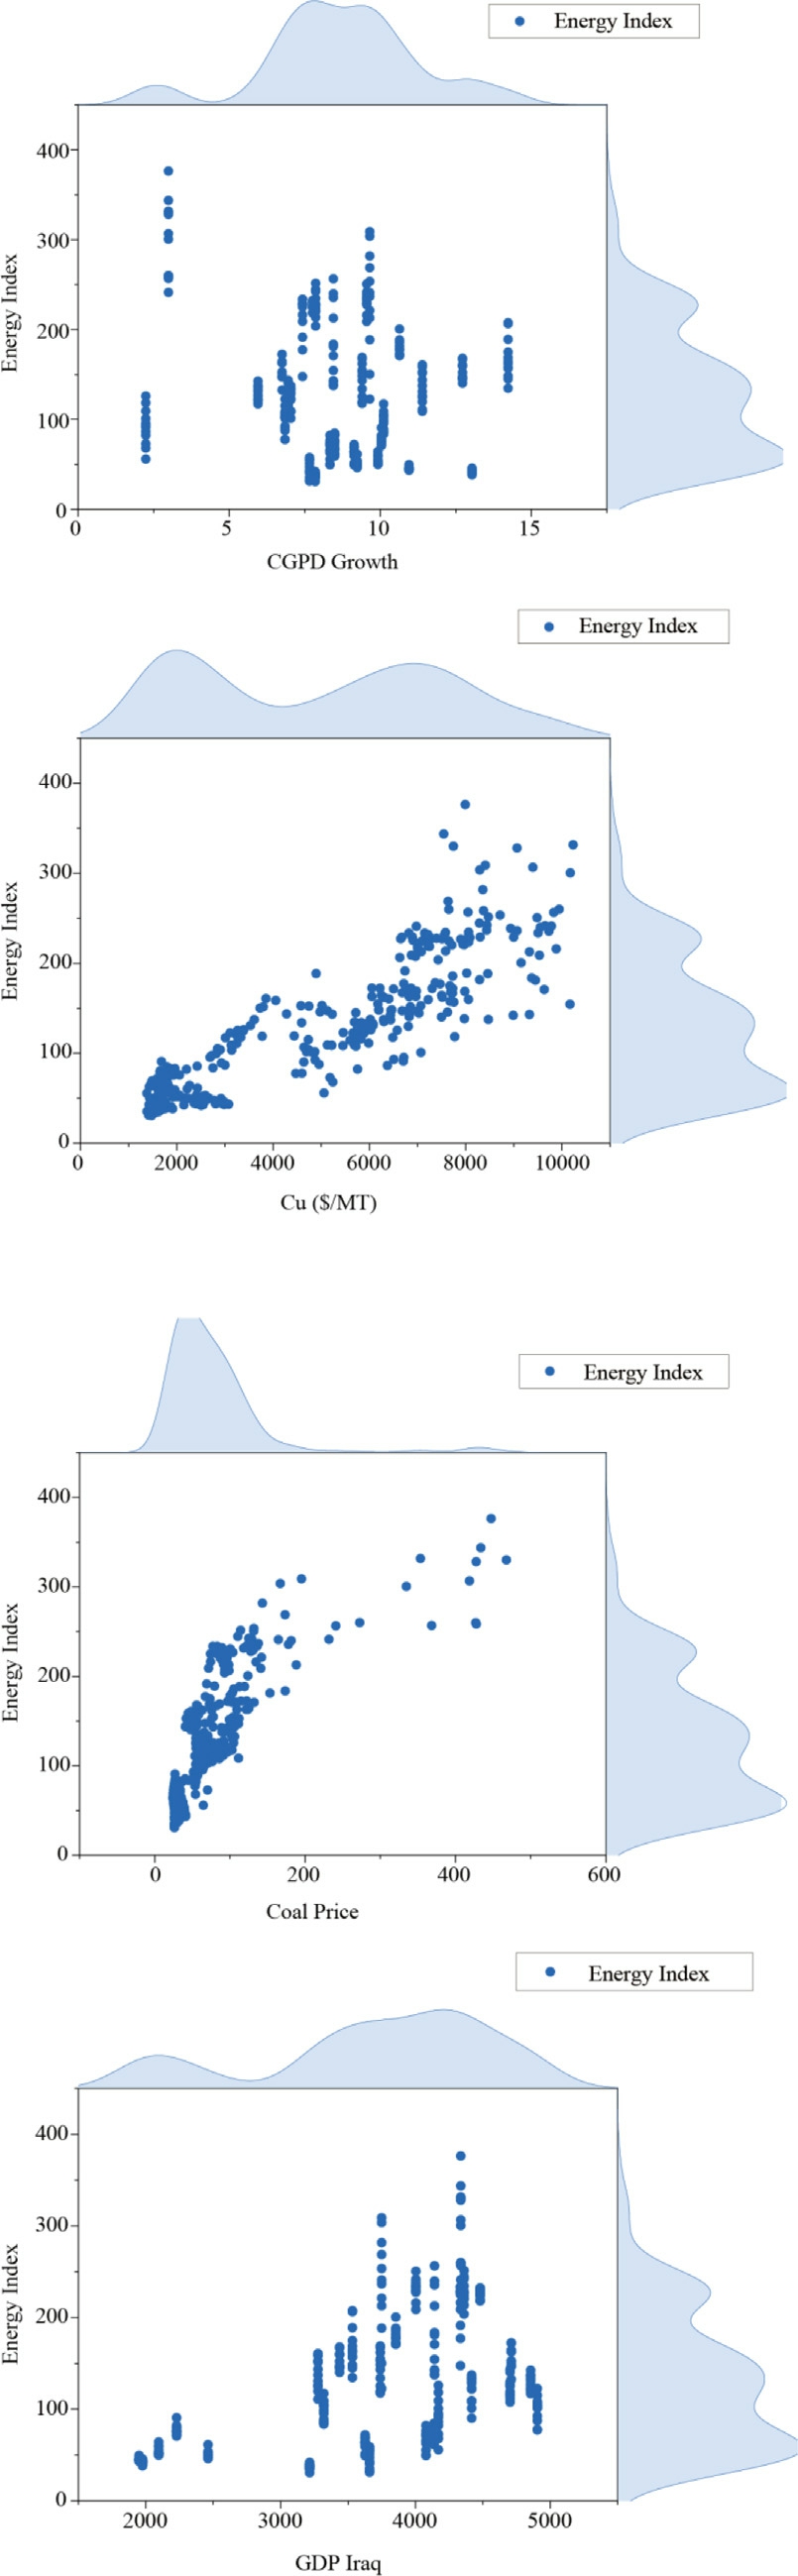
Fig 4. (continued)
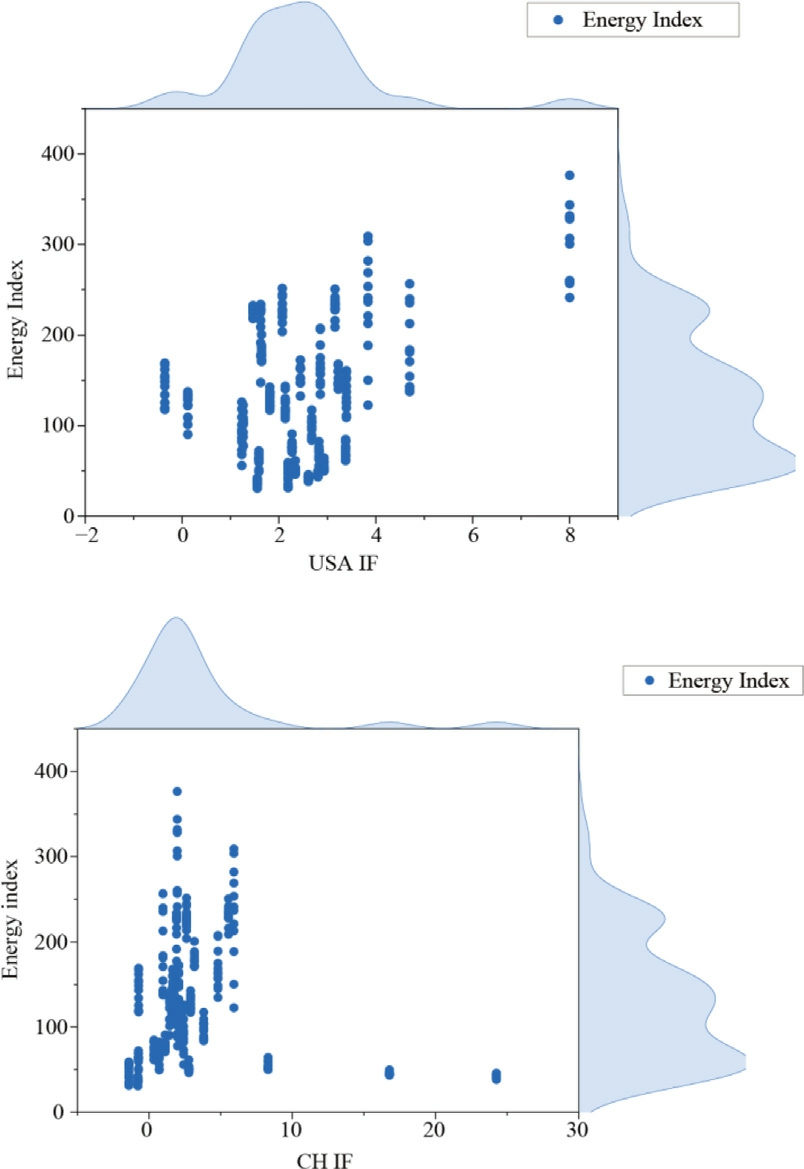
Fig 4. (continued)
In addition to cross-validation, the dataset was randomly divided into two subsets: 80% for model training and 20% for independent testing. The training subset was used to fit the model parameters, while the testing subset served as an unseen dataset to evaluate model generalizability. Performance on the test set was compared with cross-validation results to ensure consistency and to further verify that the model was not overfitting.
2.2.1 Development of Gaussian Process Regression (GPR) model
For decades, researchers have used the GPR to collect random variables, any limited number of which have a joint Gaussian distribution[43]. Many mining applications have benefited from the application of GPR. A rthur et al.[44] focused on reducing the environmental impacts of blasting. They used GPR to reduce the impact of blasting in an open pit mine in Ghana. Their analysis results showed that the GPR-suggested model was more accur ate than the other standard models.Dong[45] aimed to make effective analysis and use of gas measuring data in mines to achieve more accurate gas emission quantity prediction based on GPR. This study demonstrated that the GPR model is an effective method for predicting gas emission quantities and has a high practical a pplication value.The GPR method was used by Pu et al. [46] to investigate whether cemented rockfill strength has on-ground support performance. Their study showed that the GPR model was effective for cemented rockfill strength.
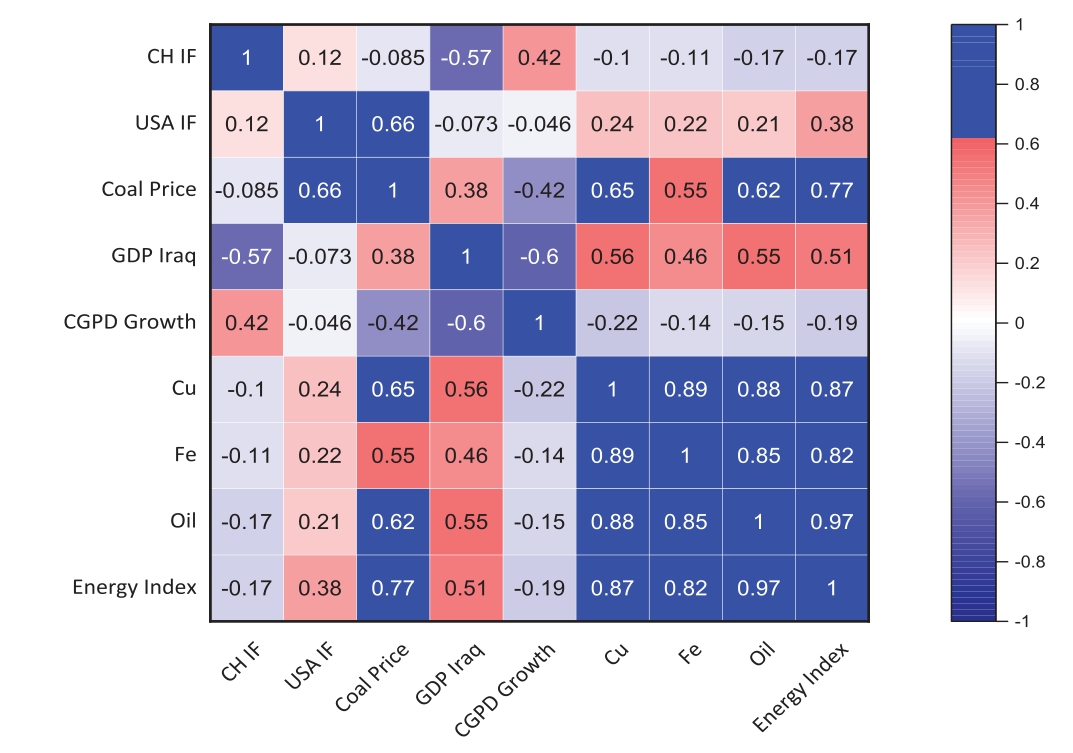
Fig. 5. Pearson correlation plot.
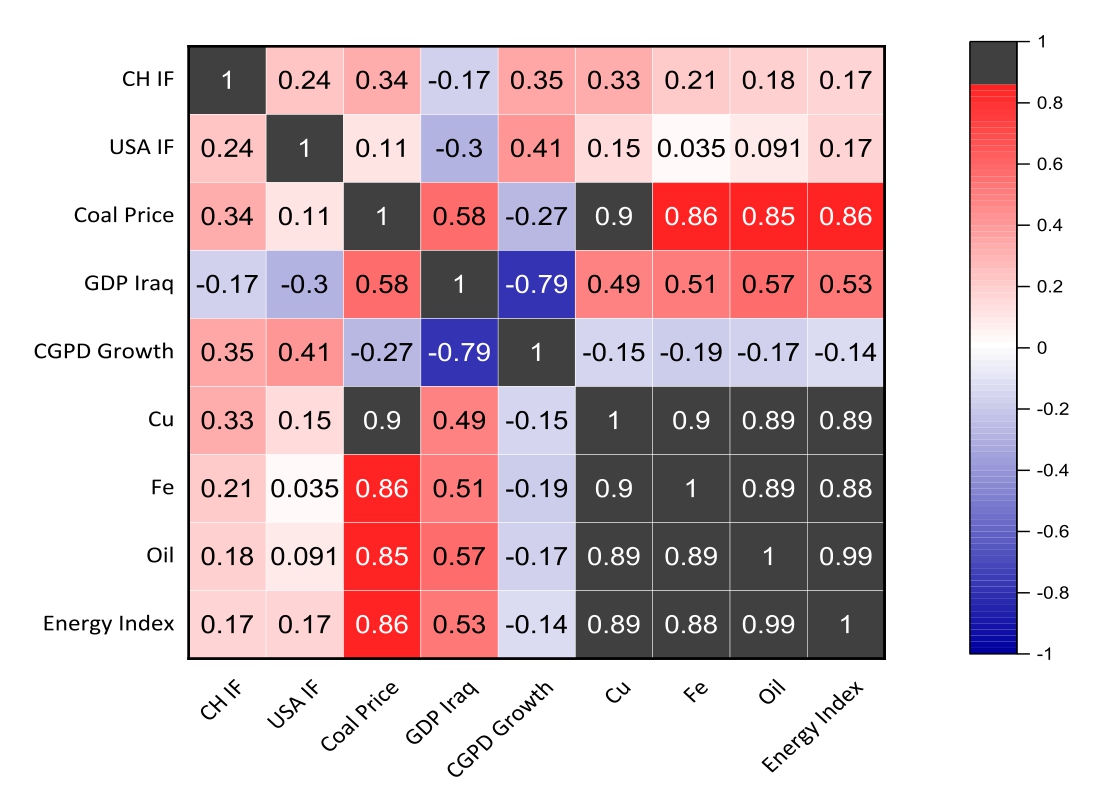
Fig. 6. Spearman correlation plot.
In GPR, time series are modelled by employing a mean function of m(x) and co variance function of (CovF)k(x, x) as described Eq. (1).

In the above description, input and output of the training set are shown by x and y severally. The hidden variable of the algorithm is characterized by f ( x). In most of the applications, it is widespread to choose the mean function of discussing equatio n to zero. The similarity between input variables is described by CovF which is a vital parameter in this algorithm because for the data points which have the similar value of x are more probable to obtain a same value of output. The present work utilizes various types of kernel function, which are described in the Eqs. (2)–(5) [47].
Exponential:

Squared and Expo nential:

In the above equation, θ1 and θ2 represent hyperparameters which should be optimized. The Euclidean distance of x and x is shown by d.
Rational quadrat ic:

In which,  is a positive parame ter of covariance.
The prediction of WEI using GPR algorithms modelling was done using Exponential Kernel (MD1), Square and Exponential kernel (MD 2), and Rational quadratic kernel (MD 3). The training process uses constant basic function, isotropic kernel structure, and automatic kernel scale and sigma with standardize and optimize numeric parameters. Fig. 10 shows the regression graphs for both training and testing data results derived from the created three kernel GPR models. The model result demonstrates that the coefficient of correlation (R2 ) values achieved during model development for the training and testing datasets are significantly high. The correlation coefficients for MD 1, MD 2 and MD 3 models are 0.9999, 0.9810, and 0.9999 for training respectively, and 0.9660, 0.9519, and 0.9588 for the testing datasets respectively.
2.2.2 Development of Ensemble Tree (ET) regression model
ET, which is based on the principles of collective behaviour and collaboration, combines multiple decision trees into a community. An ET technique is a set of separate weak models (number of learners) that, when combined(number of predictors), provide a reliable mathematical prediction.There are two types of ET:boosted and bagged trees [48]. While Bagged trees consist of combining different ensemble bootstraps into separated decision trees,boosted trees, on the other hand, are also an ensemble of regression trees. ET uses subsets of the original data to produce a series of sequentially average-performing models. Next, the models are improved by combining them using a specific cost function, like Eq. (6) [49].

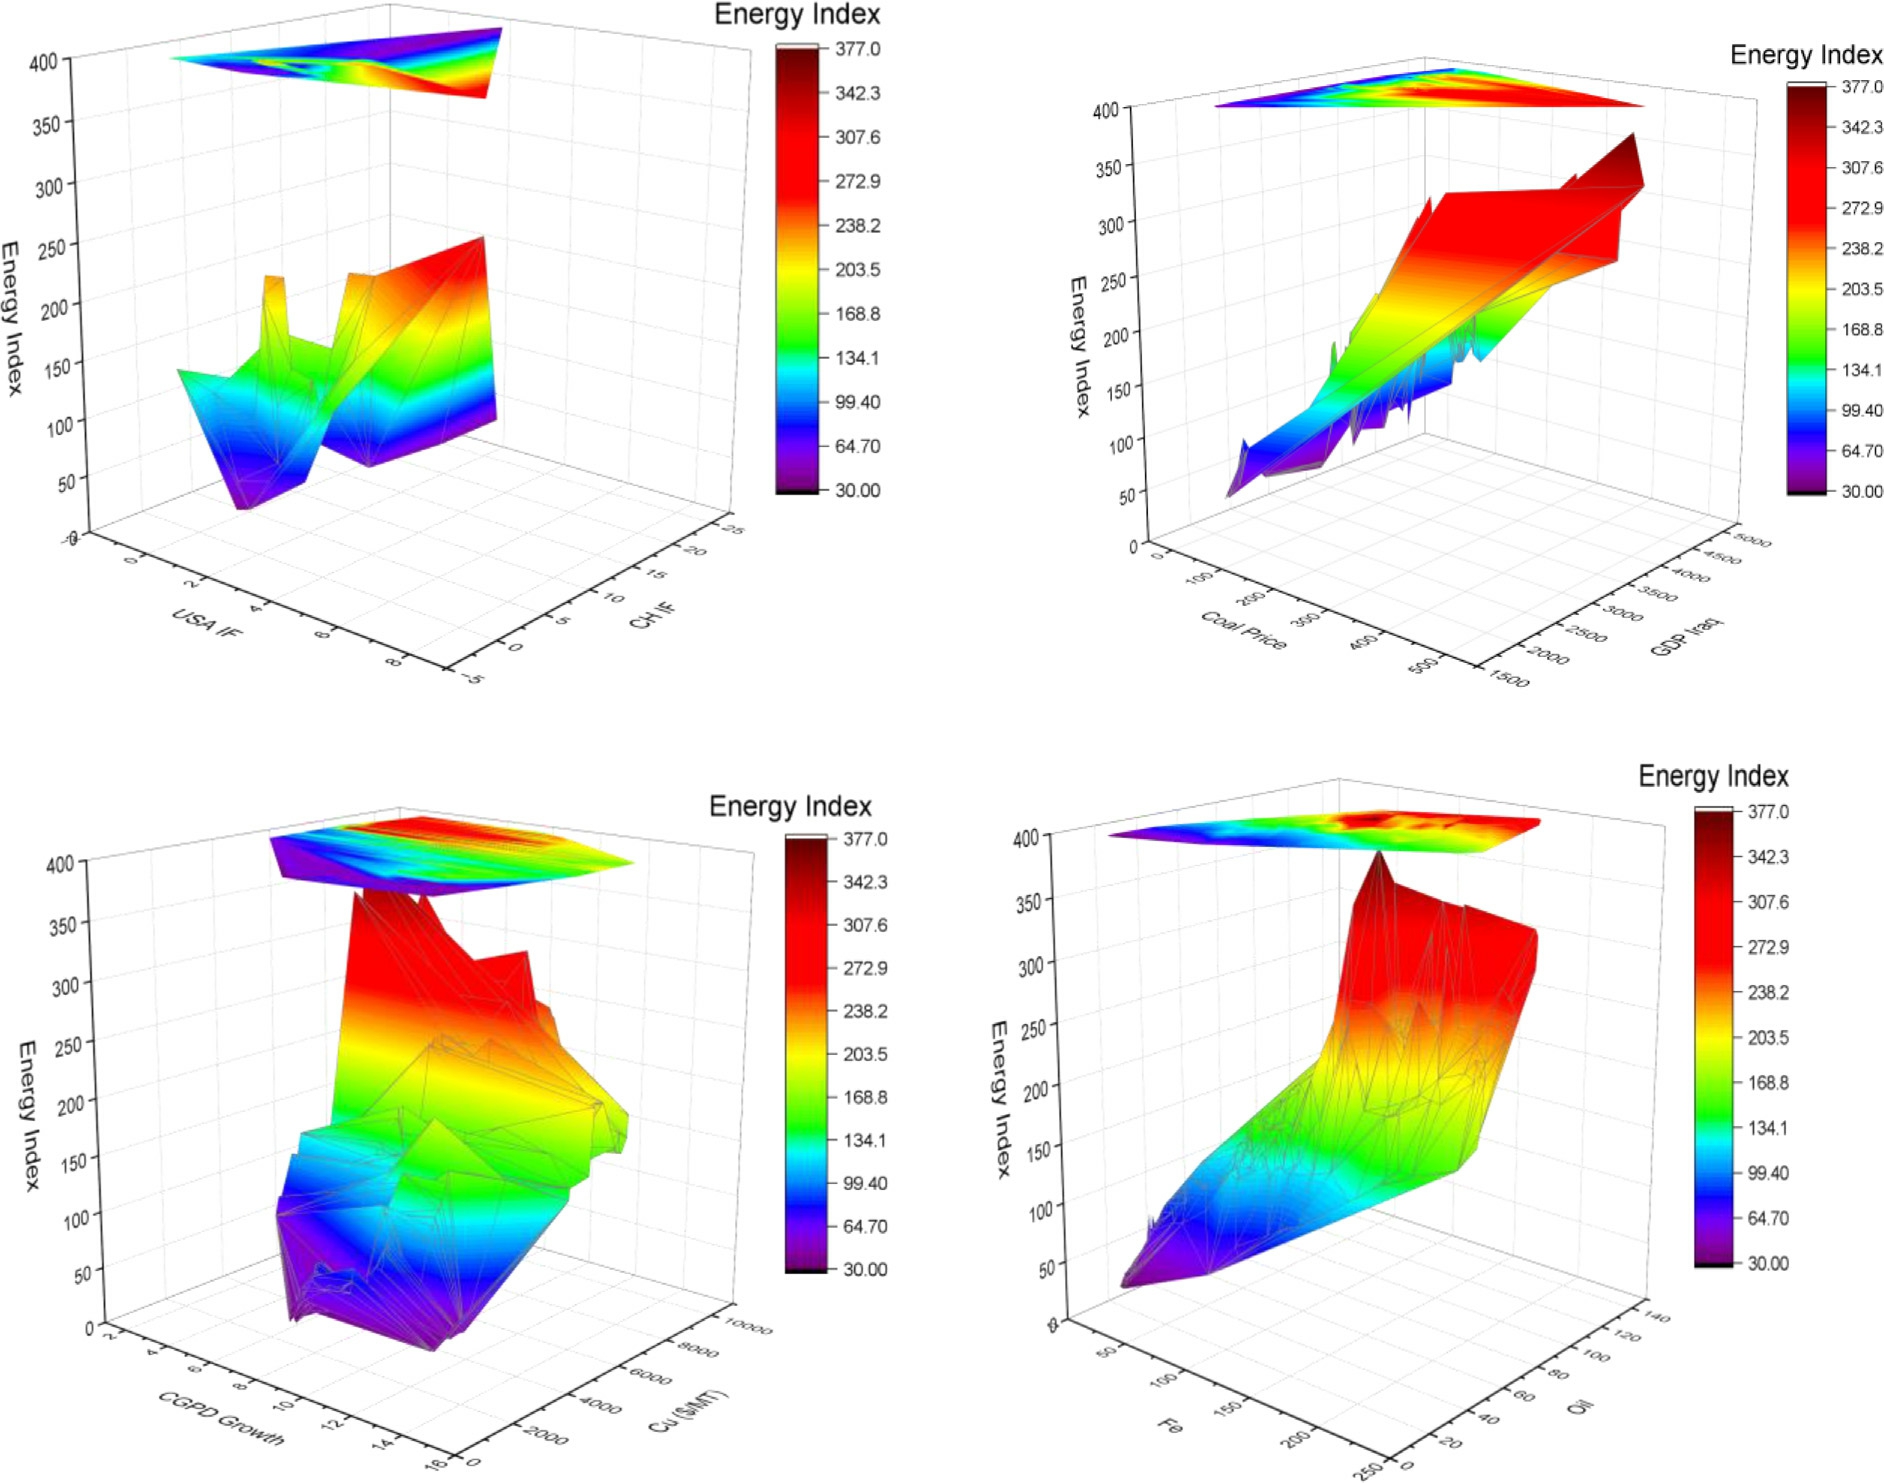
Fig. 7. 3D map plot of the target output with each two input variables.
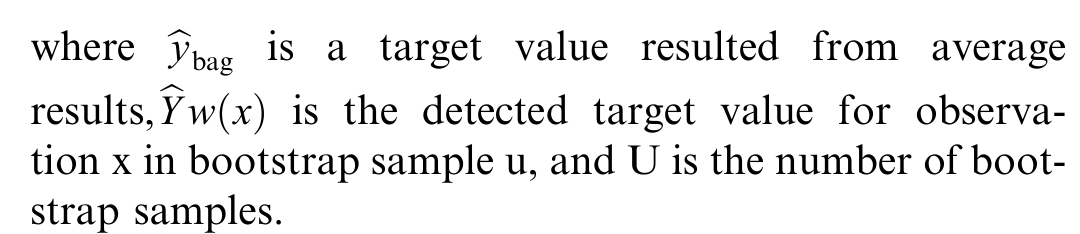
In this study, Bagged and Boosted Ensemble Tree models were applied to develop forecasting model for Wei et al.gorithms created the predicted WEI model. Fig. 11 shows the regression graphs for both training and testing data resul ts derived from the developed ET models.
The model result demonstrates that the coefficient of correlation (R2 ) values achieved during model construction for the training and testing datasets are significant high for MD5 as compared to MD 4 as shown in Fig. 11.
2.2.3 Development of Support Vector Regression (SVR) model
The SVR is a well-known model for data categorization in two-dimensional space in various technical, scientific,and humanities domains. It is possible to fit suitable lines and curves for pre diction and deliver the best regression connections in both linear and nonlinear modes by defining and developing mathematical ideas [50]. The goal of support vector regression, or the SVR model, is to find the function f (x) for the training patterns x that has the highest margin of the training values y. The SVM regression model (x) represents the training patterns x and f.In other words, the SVR model is a model that fits data to a curve of thickness E such that the test data has the least amount of error. The SVM model uses a set of functions in the form of Eq. (8) for prediction [50].

Here w is the weighting of the vector, x and b are the bias values. To minimize the test error, the comp lexity of the expression must be minimized,which requires minimizing the weight vector.
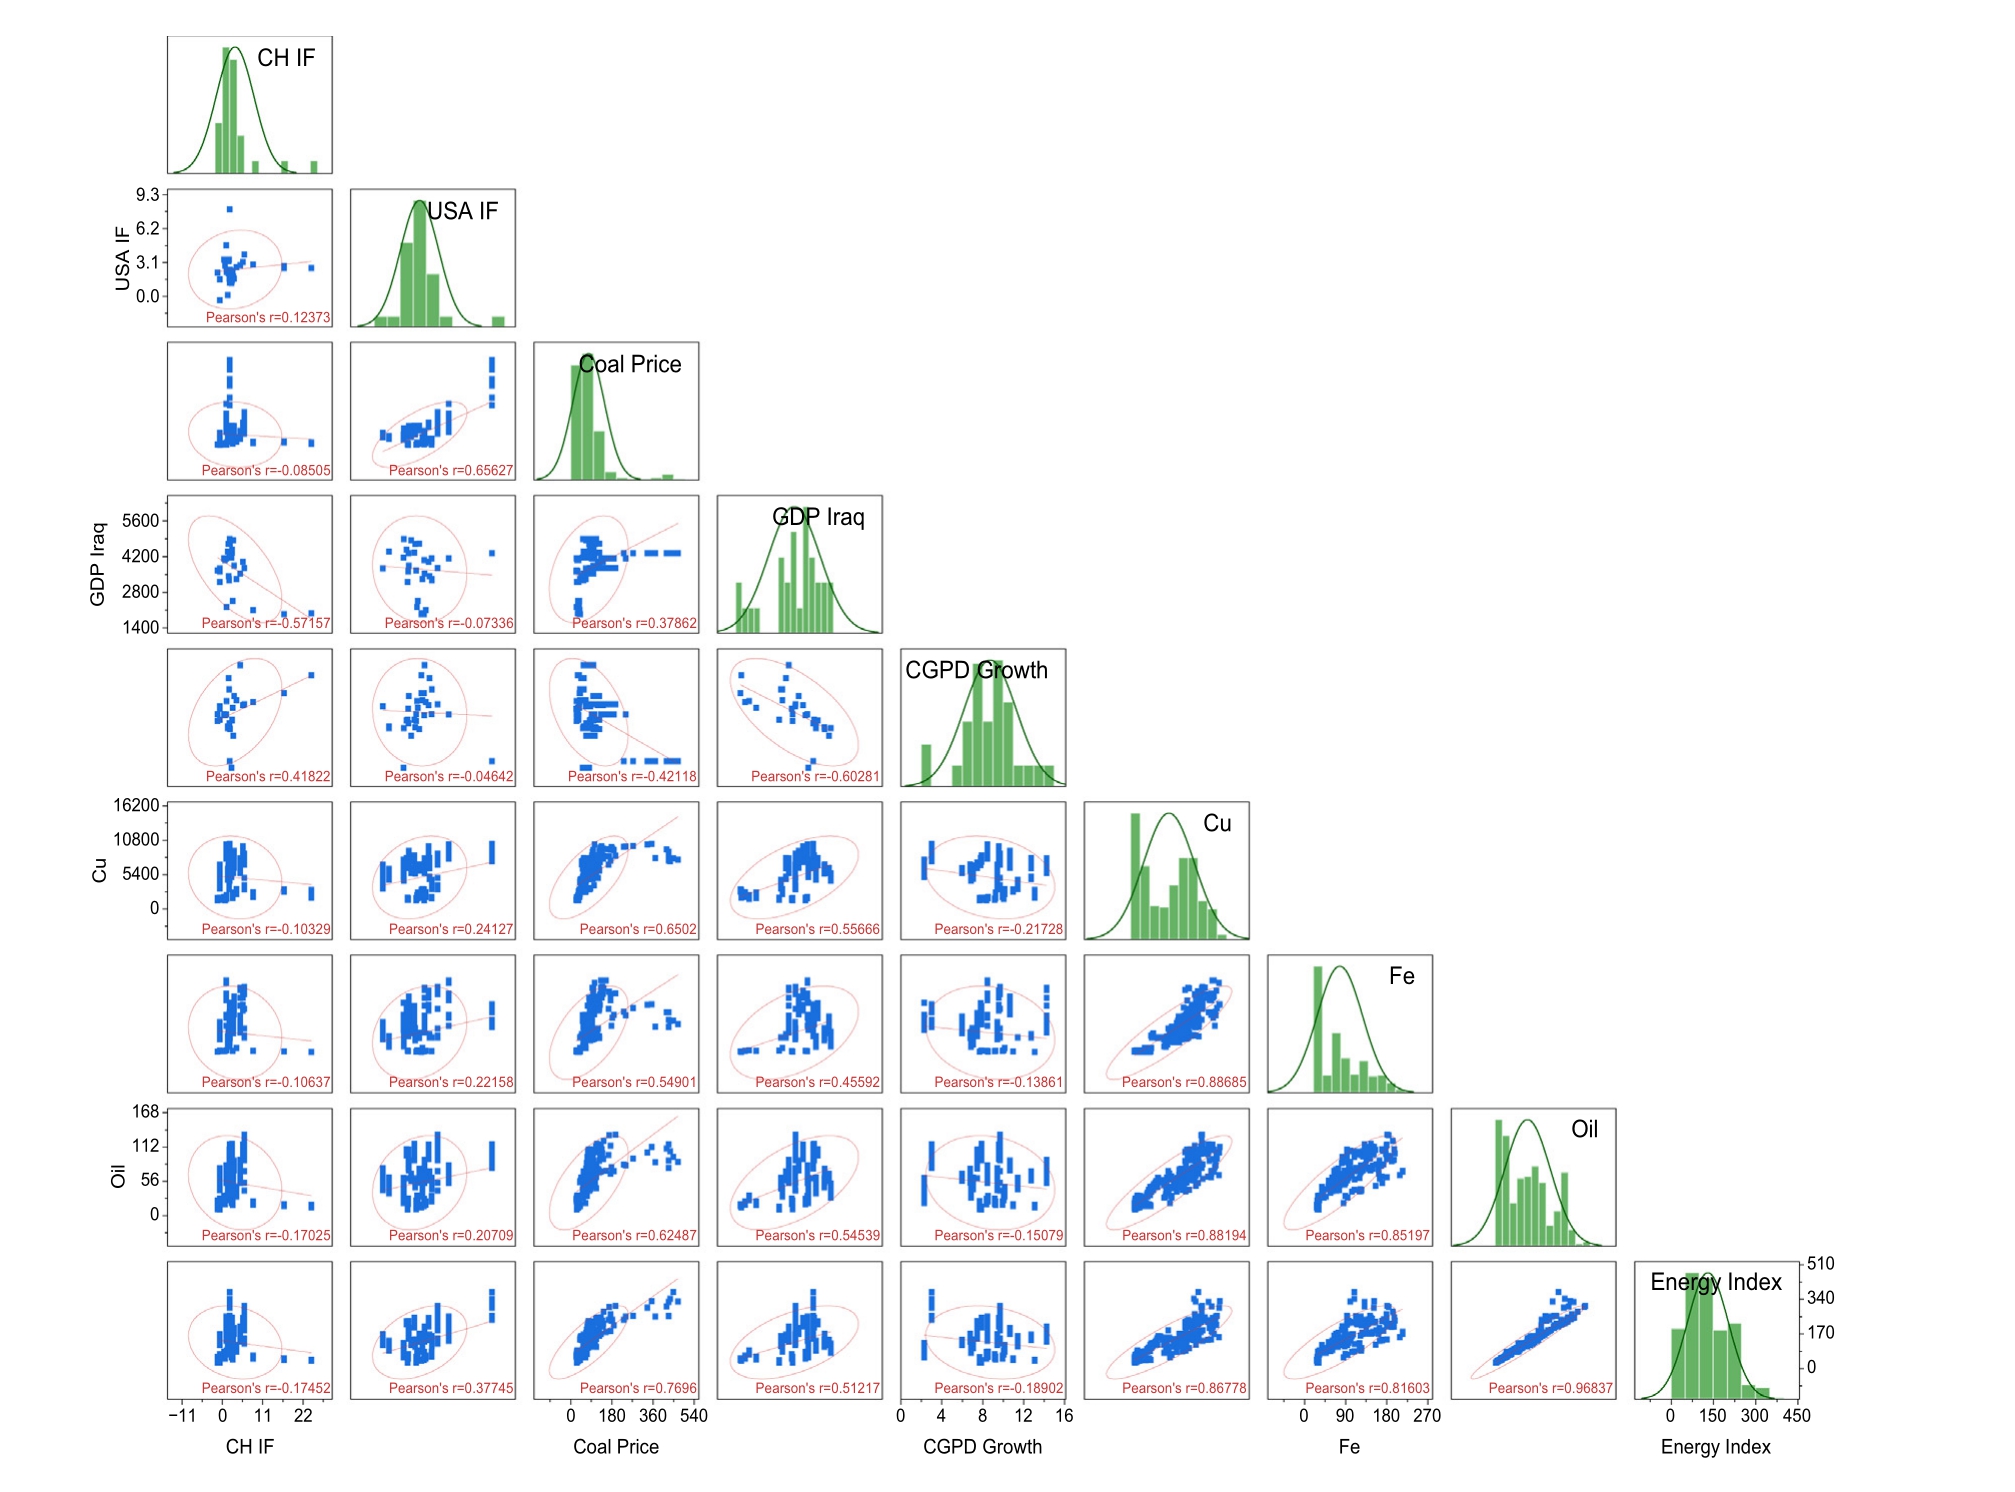
Fig. 8. Scatter matrix plot of all variables.
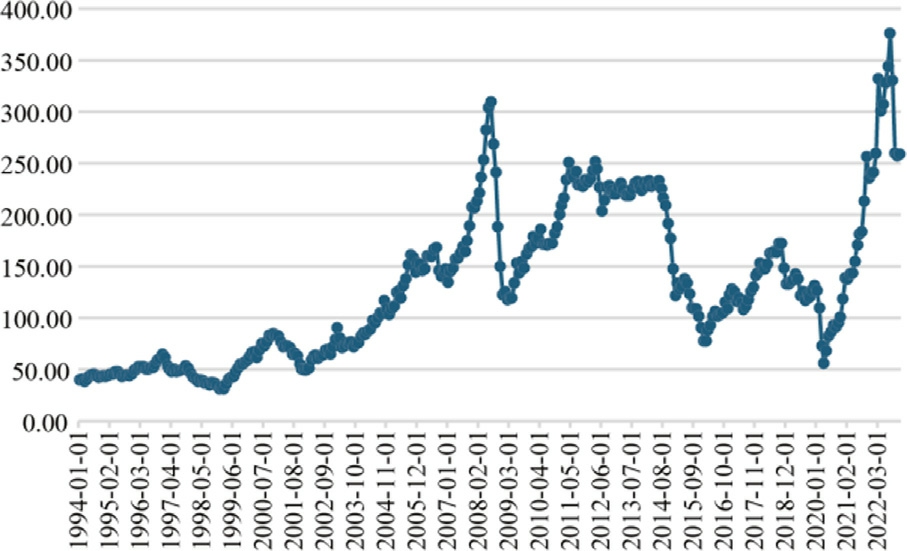
Fig. 9. Iraq Energy Index Time series Plot.
Four distinct Support Vector Regression (SVR) techniques were evaluated, including a medium Gaussian kernel (MD 6), fine Gaussian kernel (MD 7), linear kernel(MD 8), and quadratic kernel (MD 9). The Support Vector Regression (SVR) techniques w ere used to develop the energy index model. Fig. 1 2 shows the regression graphs illustrating the outcomes of the four SVR algorithms on both the training and testing data. The model’s results indicate that the coefficient of correlation (R2 ) values obtained during the development of the model for both the training and testing datasets are statistically significant.The R 2 values for the model training and test stages of MD6, MD7, MD8, and MD9 are as follows: 0.9937,0.9864, 0.9902, and 0.9944 for the training datasets,respectively, and 0.9493, 0.9656, 0.9784, and 0.9279 for the testing datasets.
Table 1 Model ID and AI-techniques.
2.2.4 Development of Artificial Neural Network (ANN)model and WEI prediction
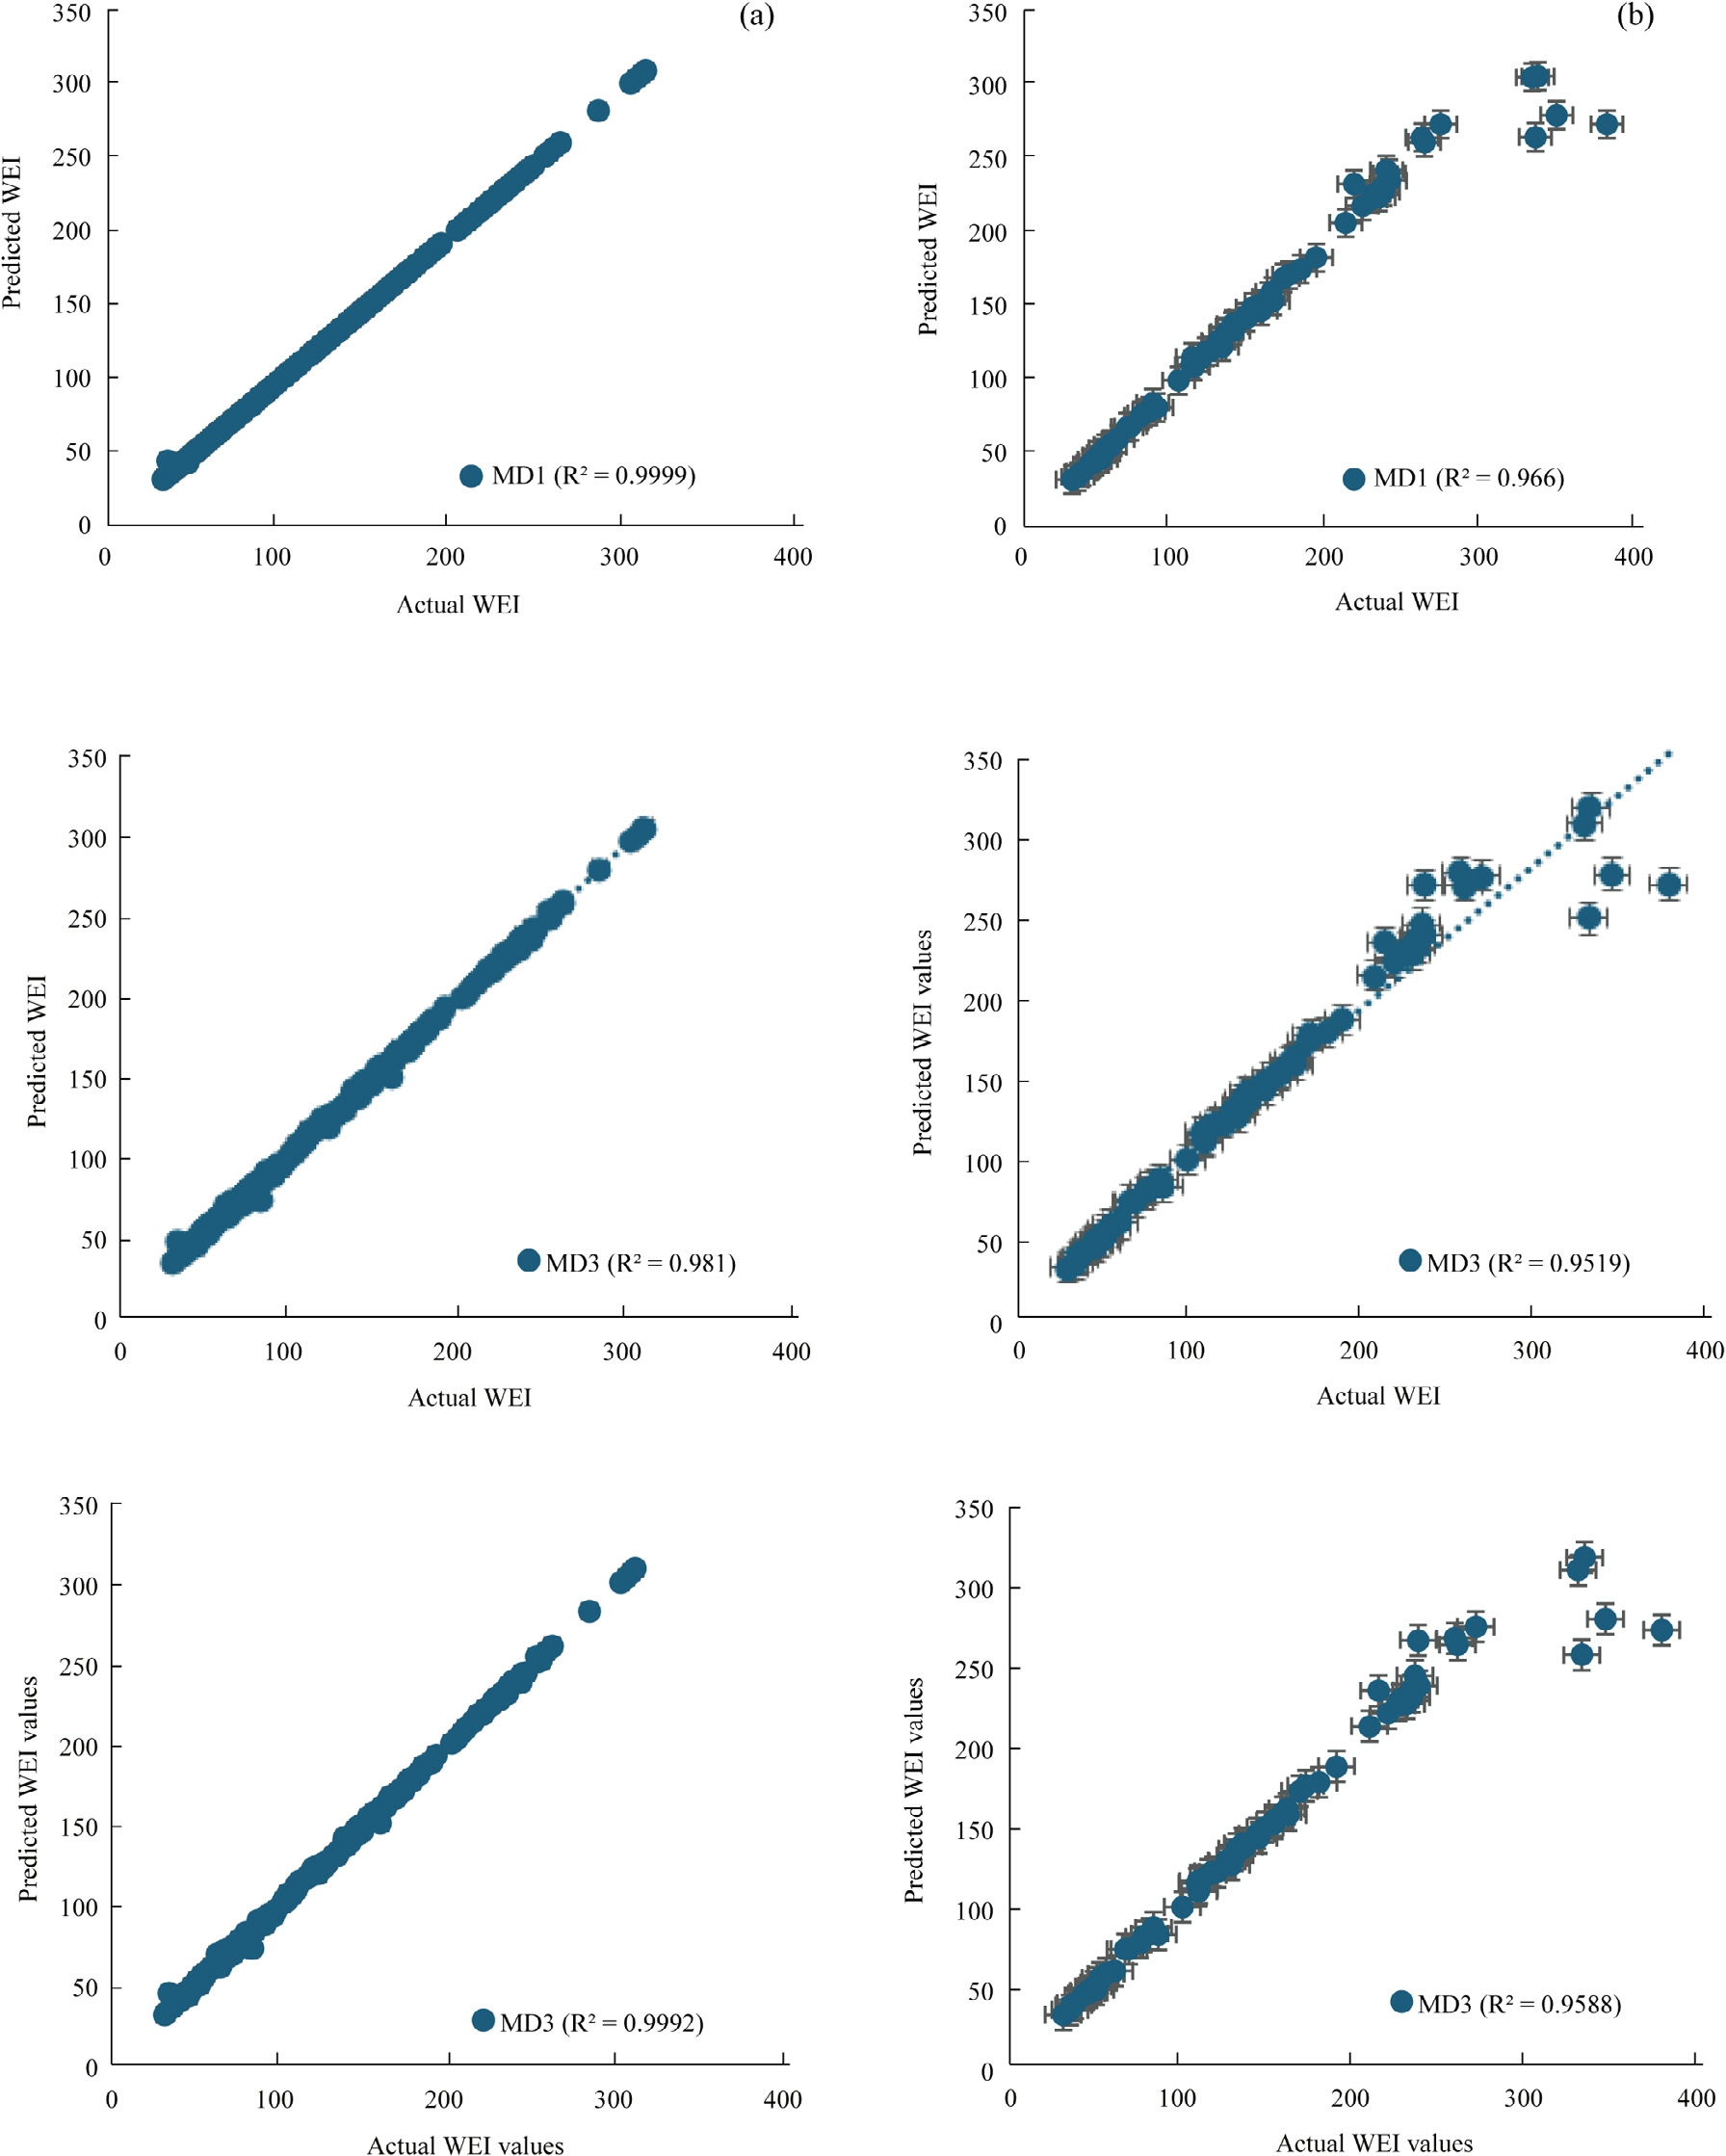
Fig. 10. Relationship between the GPR predicted WEI and measured values, (a) train datasets, (b) test datasets for MD1, MD2 and MD3.
According to Taiwo and Adebayo[51] and Gebretsadik et a l. [52], ANNs are algorithm that learn from data samples offer to them and use these data to set their weights to capture the relationship between the historical set of model inputs and corresponding outputs. Random weights are assigned to the data set and fed to the hidden layer in a forward direction the net input in the hidden layer is given by Eq. (9).

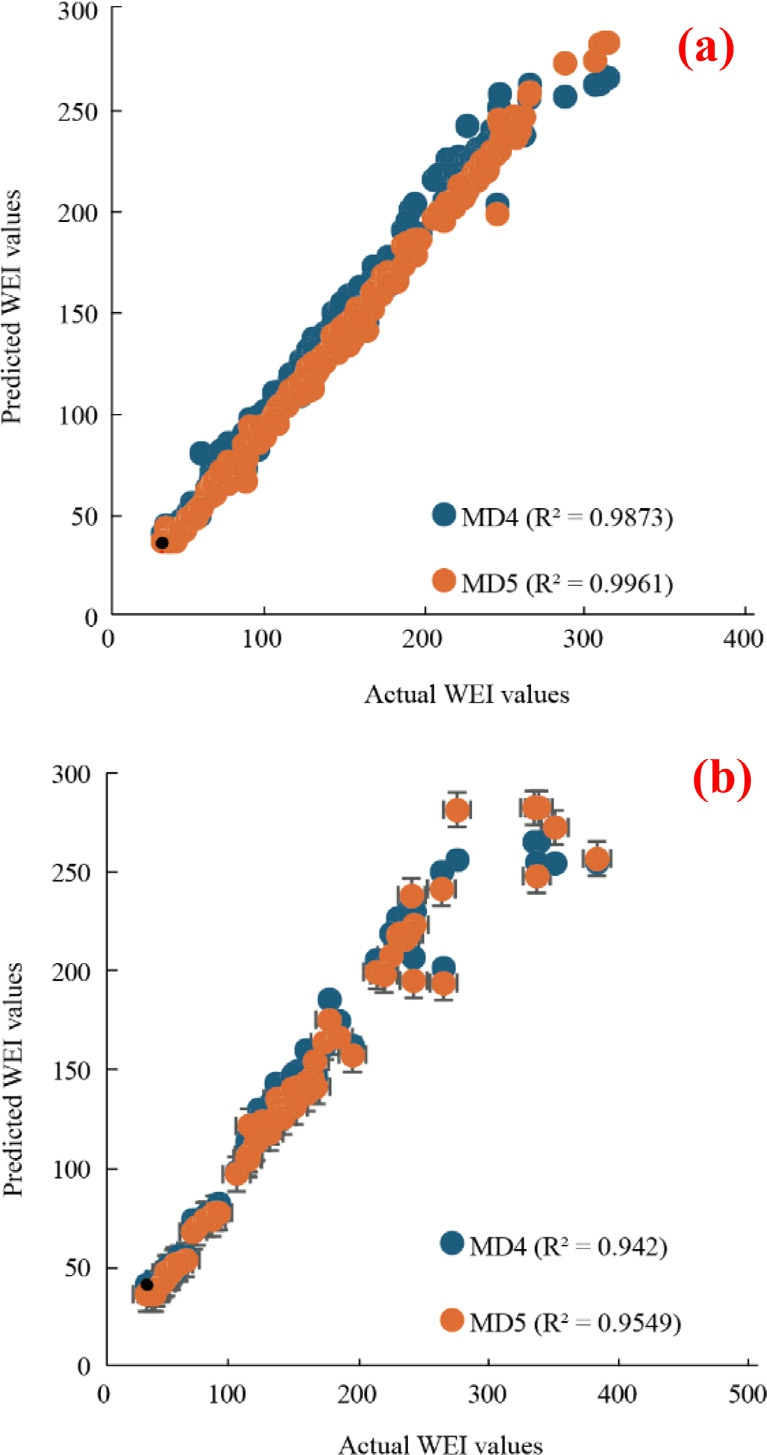
Fig. 11. Relationship between the ET predicted WEI and measured values, (a) train datasets, (b) test datasets for MD4 and MD5.
Fig. 13 (a) depicts the ANN model architecture, as well as (b) the model’s error histogram. The three different ANN algorithms(Levenberg-Marquardt(MD 10),Hybrid Levenberg-Marquardt (MD 11), and Bayesian regularization (MD 12)) were tested with out-of-state testing data.ANN algorithms created the predicted WEI model.
Fig. 14 shows the regression graphs for both training and testing data results derived from the developed ANN algorithms. The model result demonstrates that the coefficient of correlation (R2 ) values achieved during model construction for the training and testing datasets are significant. For MD10, MD11, and MD12,the R2 values for the model training and test stages are 0.9965,0.9968, and 0.9982 for the training datasets, respectively,and 0.9683, 0.9637, and 0.9441 for the testing datasets.
Based on the model information provided in Table 2,the output from each neuron was extracted as P1-P5 values. These neuron outputs were mathematically expressed using the activation function and subsequently denormalized to calculate the WEI for each corresponding P1-P5 value. The model bias and weight function were transformed into mathematical expression as shown in Eq.(10).
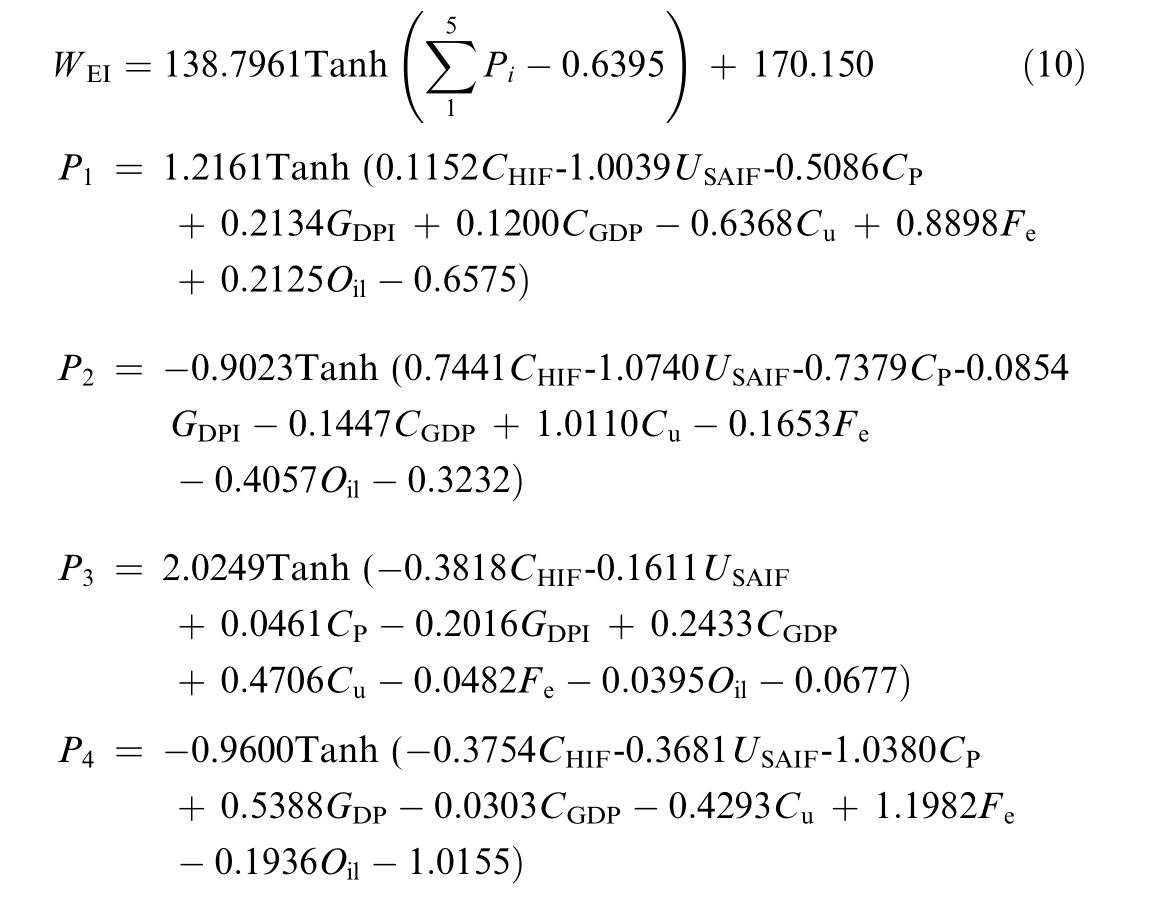
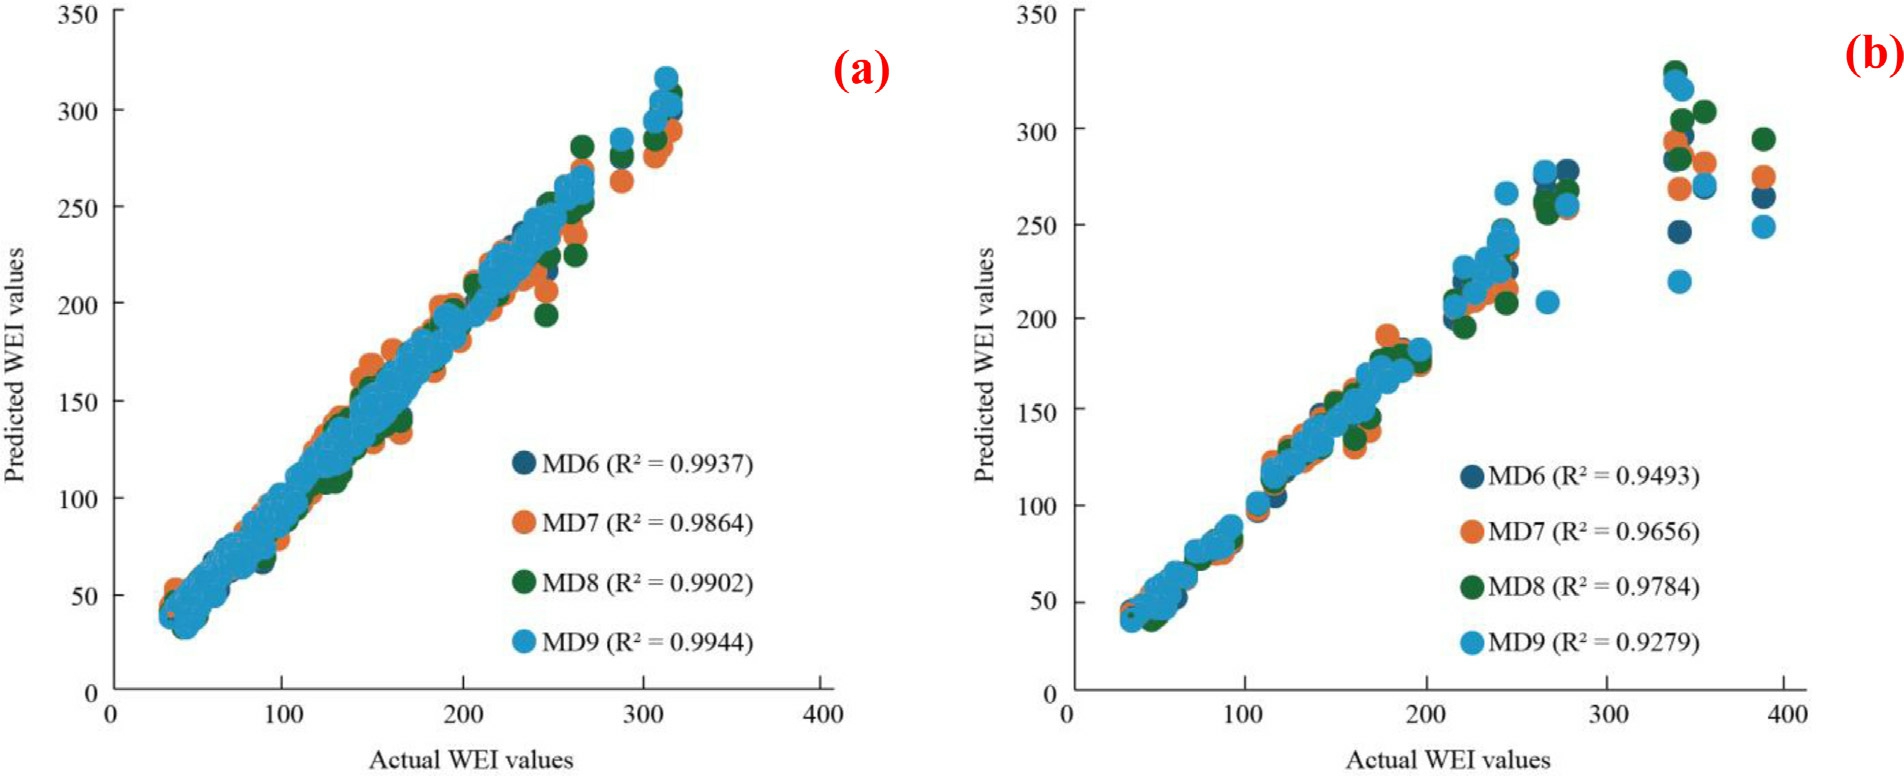
Fig. 12. Relationship between the SVR predicted WEI and measured values, (a) train datasets, (b) test datasets for MD6, MD7, MD8 and MD9.
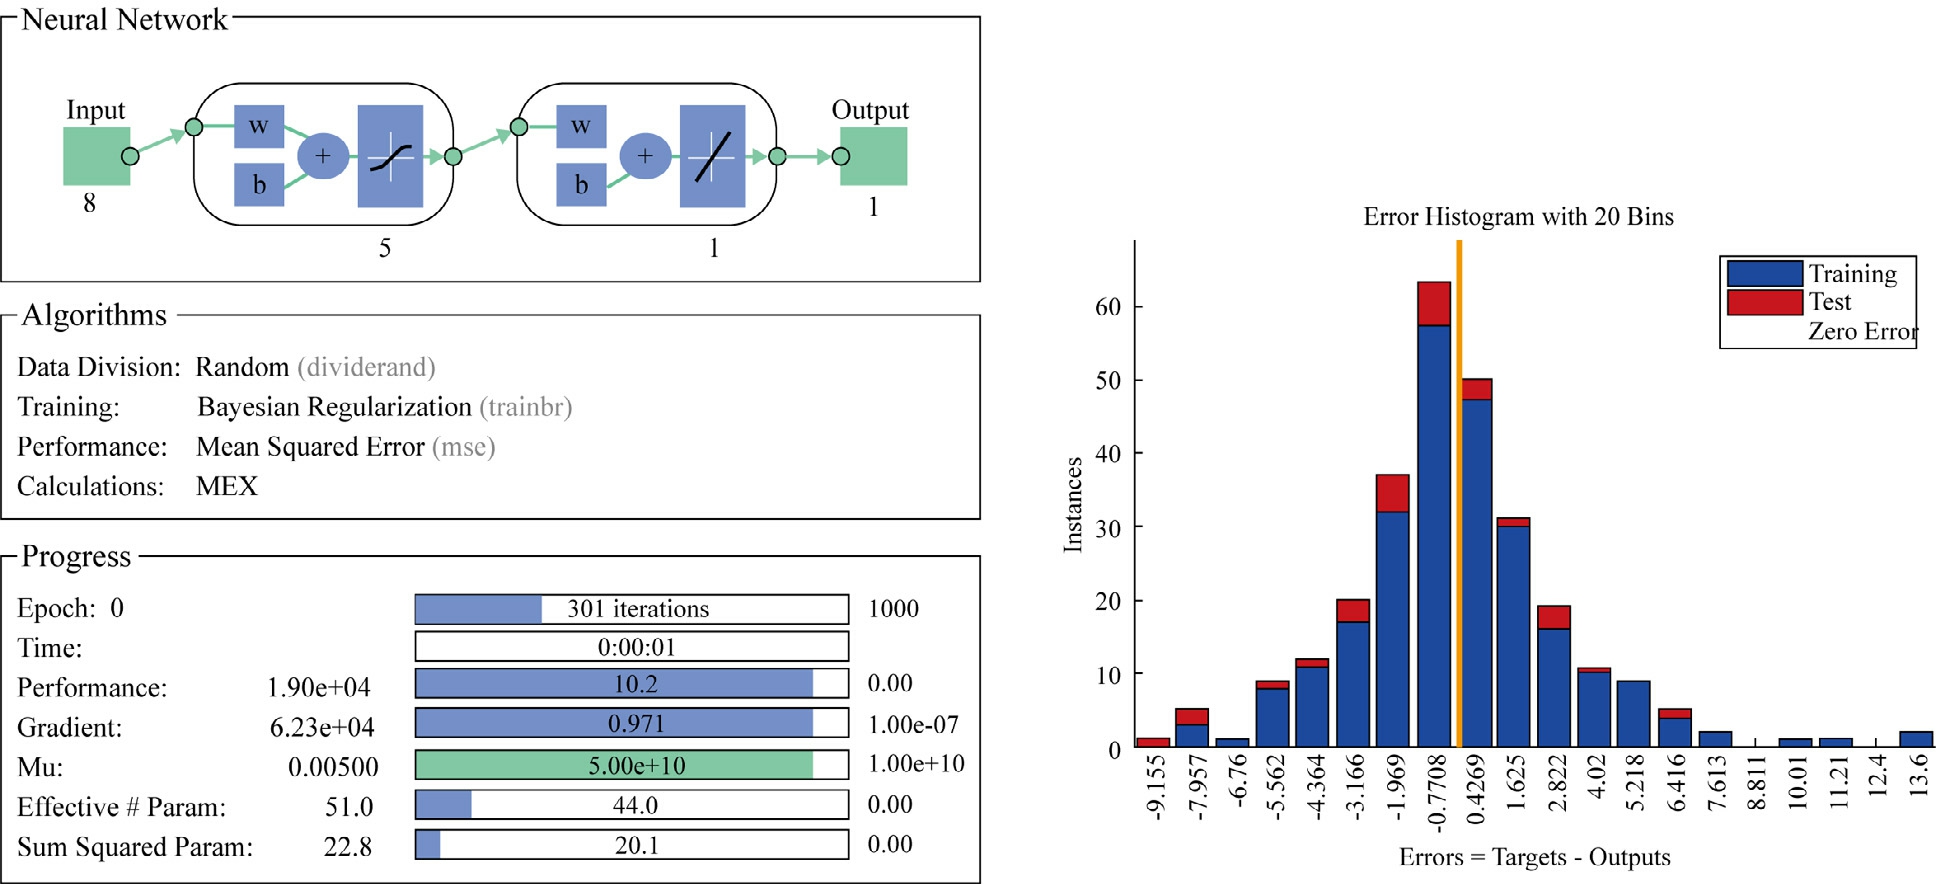
Fig. 13. (a) ANN model architecture and (b) Error histogram of the model.
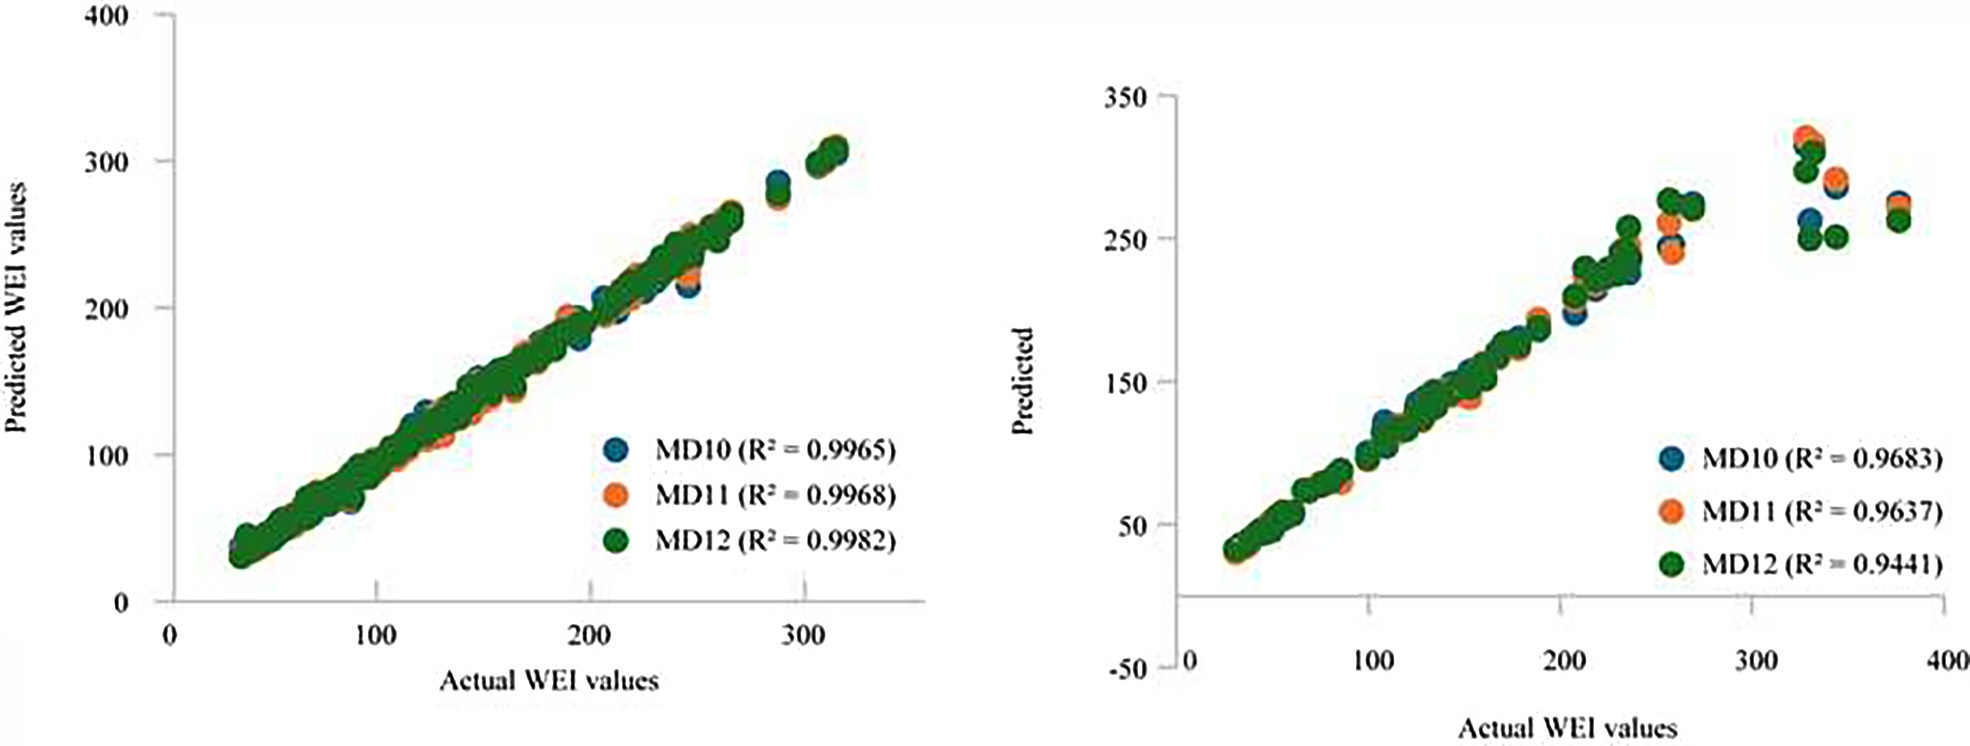
Fig. 14. Relationship between the ANN predicted WEI and measured values, (a) train datasets, (b) test datasets for MD10, MD11 and MD12.
Table 2 Optimum ANN model hyperparam eters for equation development.
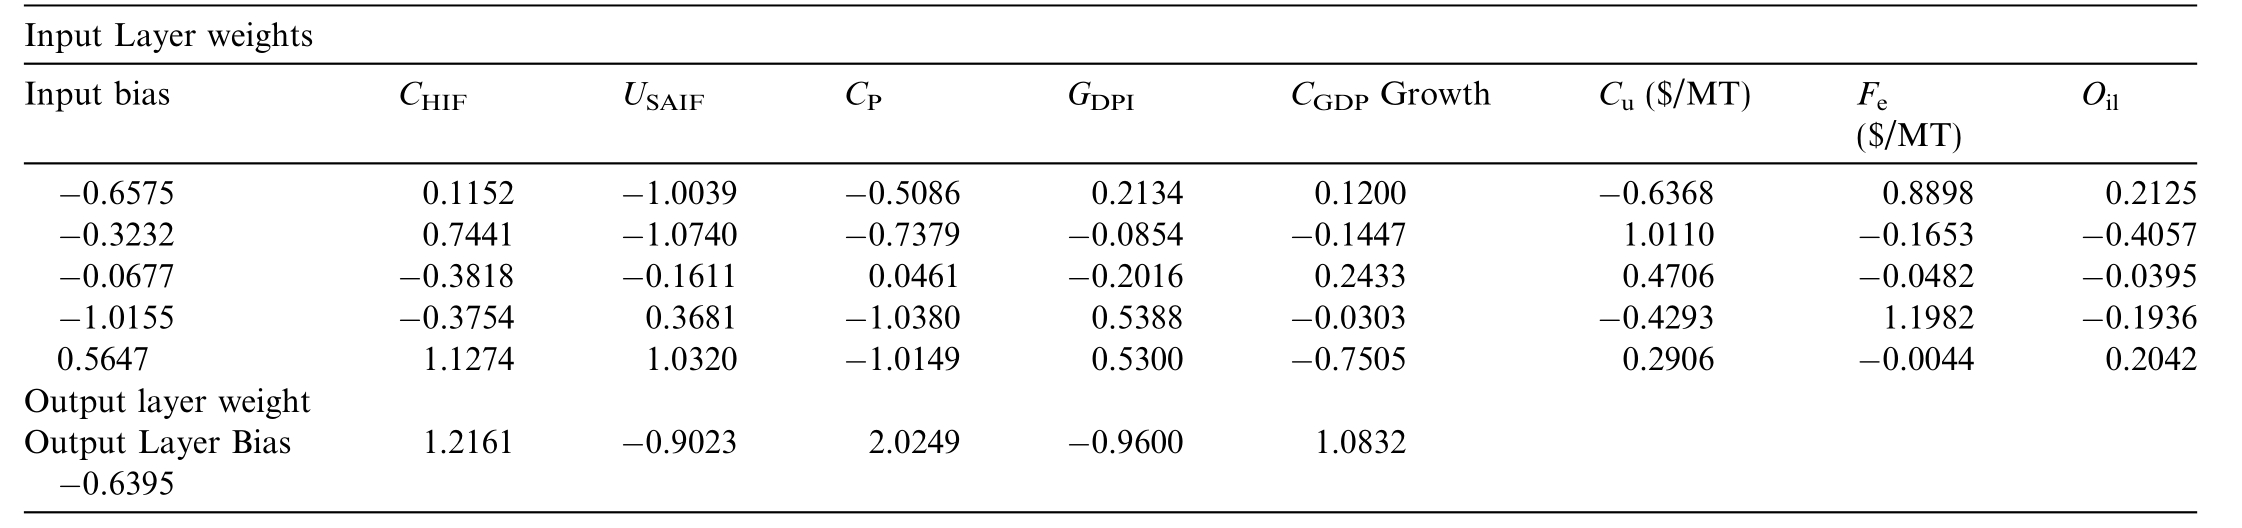

Where CHIF is China inflation rate, WEI is World Energy Index USAIF is United state inflation rate, CP is coal prices, GDPI is Iraq gross domest ic product, CGDP is China gross domestic product, Cu is copper price, and Fe is iron price.
2.2.5 Model performance evaluation techniques
The model prediction accuracy was evaluated using six statistical metrics: root mean square error, mean absolute error, correlation coefficient, coefficient of determ ination,mean absolute percentage error, variance accounted for,and performance error index (PEI). Eqs. (11)–(17) specify these indice s [50].
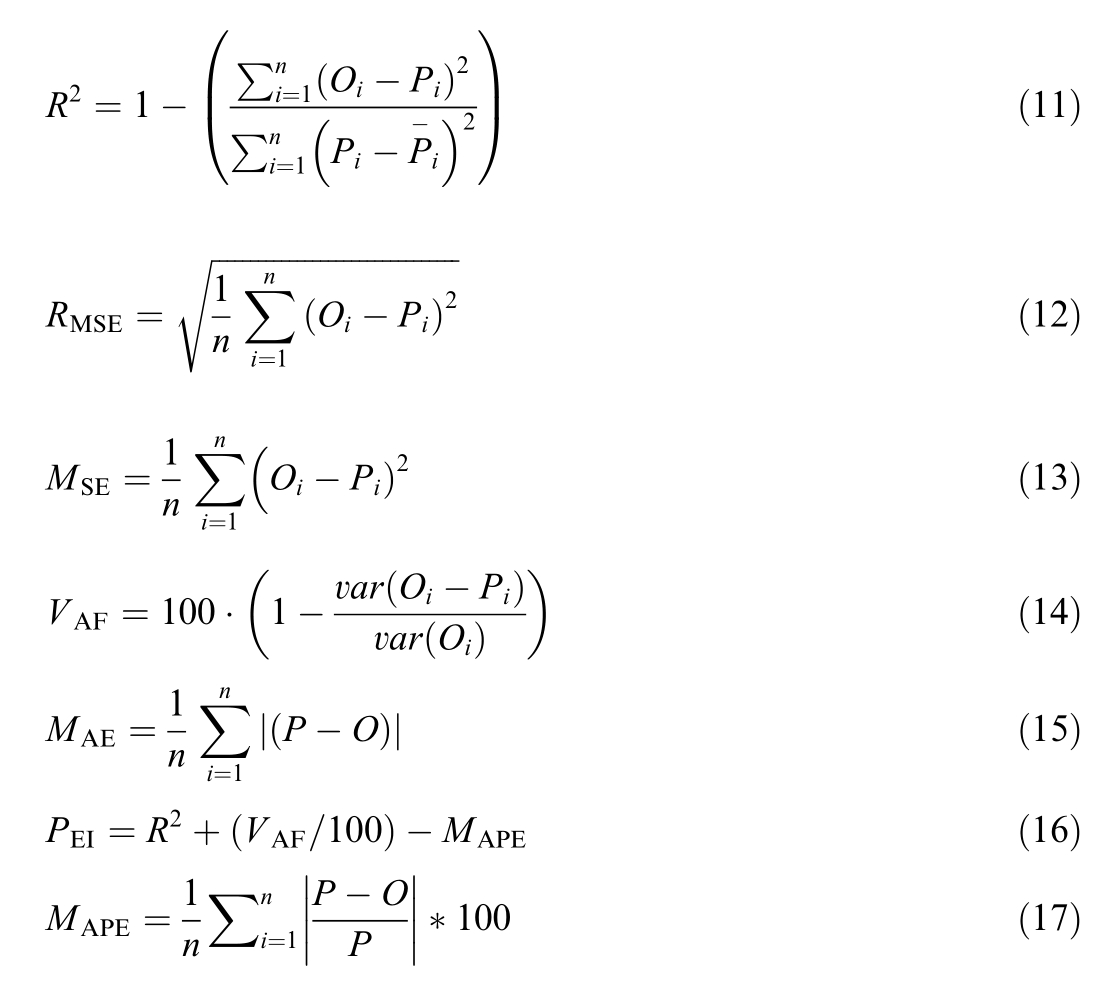
where Oi signifies measured value; Pi indicates predicted value and
and  are average of the estimated and actual values respectively; n signifies the number of data sets.
Furthermore, the study used the Final Rating (FR)approach for the model performance analysis to evaluate the efficacy of the different proposed models. The FR technique was used to assign ratings to all the model evaluation results. The architecture with the lowest RMSE,MAE, MAPE, and PEI values, as wel l as the highest R2 and VAF values,among others,was given a higher ranking.Notably, the number of developed models generated for each technique determines the ranking.If there are twenty models, the study used Eq. (18), which describes the FR rating system, to assign a rating of twelve to the model that performs the best [53].

Where ri indicates the rate of evaluation criteria, i stands 1 for train rates of evaluation indicators or 2 for test rates of evaluation indicators.
3 Results and discussion
The GPR-Exponential Kernel model outperformed others in predicting the WEI, with statistical analysis highlighting the importance of including Iraq’s GDP.Detailed results are shown in Tables 3–5 and Figs. 10–14. In this study, the error analysis and performance were evaluations for twelve models to assess their accuracy in predicting WEI.
The comparative performance of the twelve models provides important insights into their predictive capability and general ization when applied to the World Energy Index (WEI) forecasting task.
During training, several models achieved near-perfect accuracy, with MD1 demonstrating the lowest error values(MSE = 0.0115, RMSE = 0.1072, MAE = 0.0638,R2 = 0.9999). Models MD2 and MD3 also performed competitively, with low RMSE values (1.98 and 1.81,respectively) and high R2 scores above 0.98. By contrast,models such as MD4, MD5, MD6, and MD7 showed significantly higher error magnitudes (RMSE > 5.0), with negative Prediction Error Indices (PEI), indicating instability and possible overfitting. Although models like MD10,MD11 and MD12 achieved balanced training accuracy(RMSE between 2.85 and 4.01, R2 ranging from 0.996 to 0.998,the large variation in error distribution across models highlights that not all algorithms were equally suited for capturing the nonlinear structure of the WEI dataset.
When tested on unseen data, model performance diverged further. MD8 emerged as the most stable and reliable model, with the lowest test RMSE (1.43), highest R2 (0.9784), and strong VAF (97.26%). This indicates that MD8 captured the underlying dynamics effectively without excessive overfitting. Models MD1, MD3, and MD10 also delivered competitive generalization (RMSE = 1.72–1.86,R2 = 0.96–0.97), though their higher MAE and MAPE values suggest slightly weaker ha ndling of error dispersion.In contrast, models such as MD4, MD 4, MD6, and MD7 exhibited significant degradation in testing(RMSE between 1.96 and 2.53, with higher MAE > 10), pointing to poor generalization despite strong training performance. Negative PEI values for these models reinforce their limited predictive stability.
The key finding is that training accuracy alone is not a sufficient indicator of forecasting robustness. While several models (e.g., MD1 and MD2) showed almost perfect fit during training, their test performance deteriorated,underscoring susceptibility to overfitting. Conversely,MD8 s balance of high R2 , low error, and strong VAF across both train and test phases demonstrates its robustness and suitability for WEI forecasting.The strong gener-alization of MD8 can be attributed to its ability to capture non-linear dependencies while avoiding excessive sensitivity to noise in the data.
Table 3 Error analysis result for the training and testing phase.
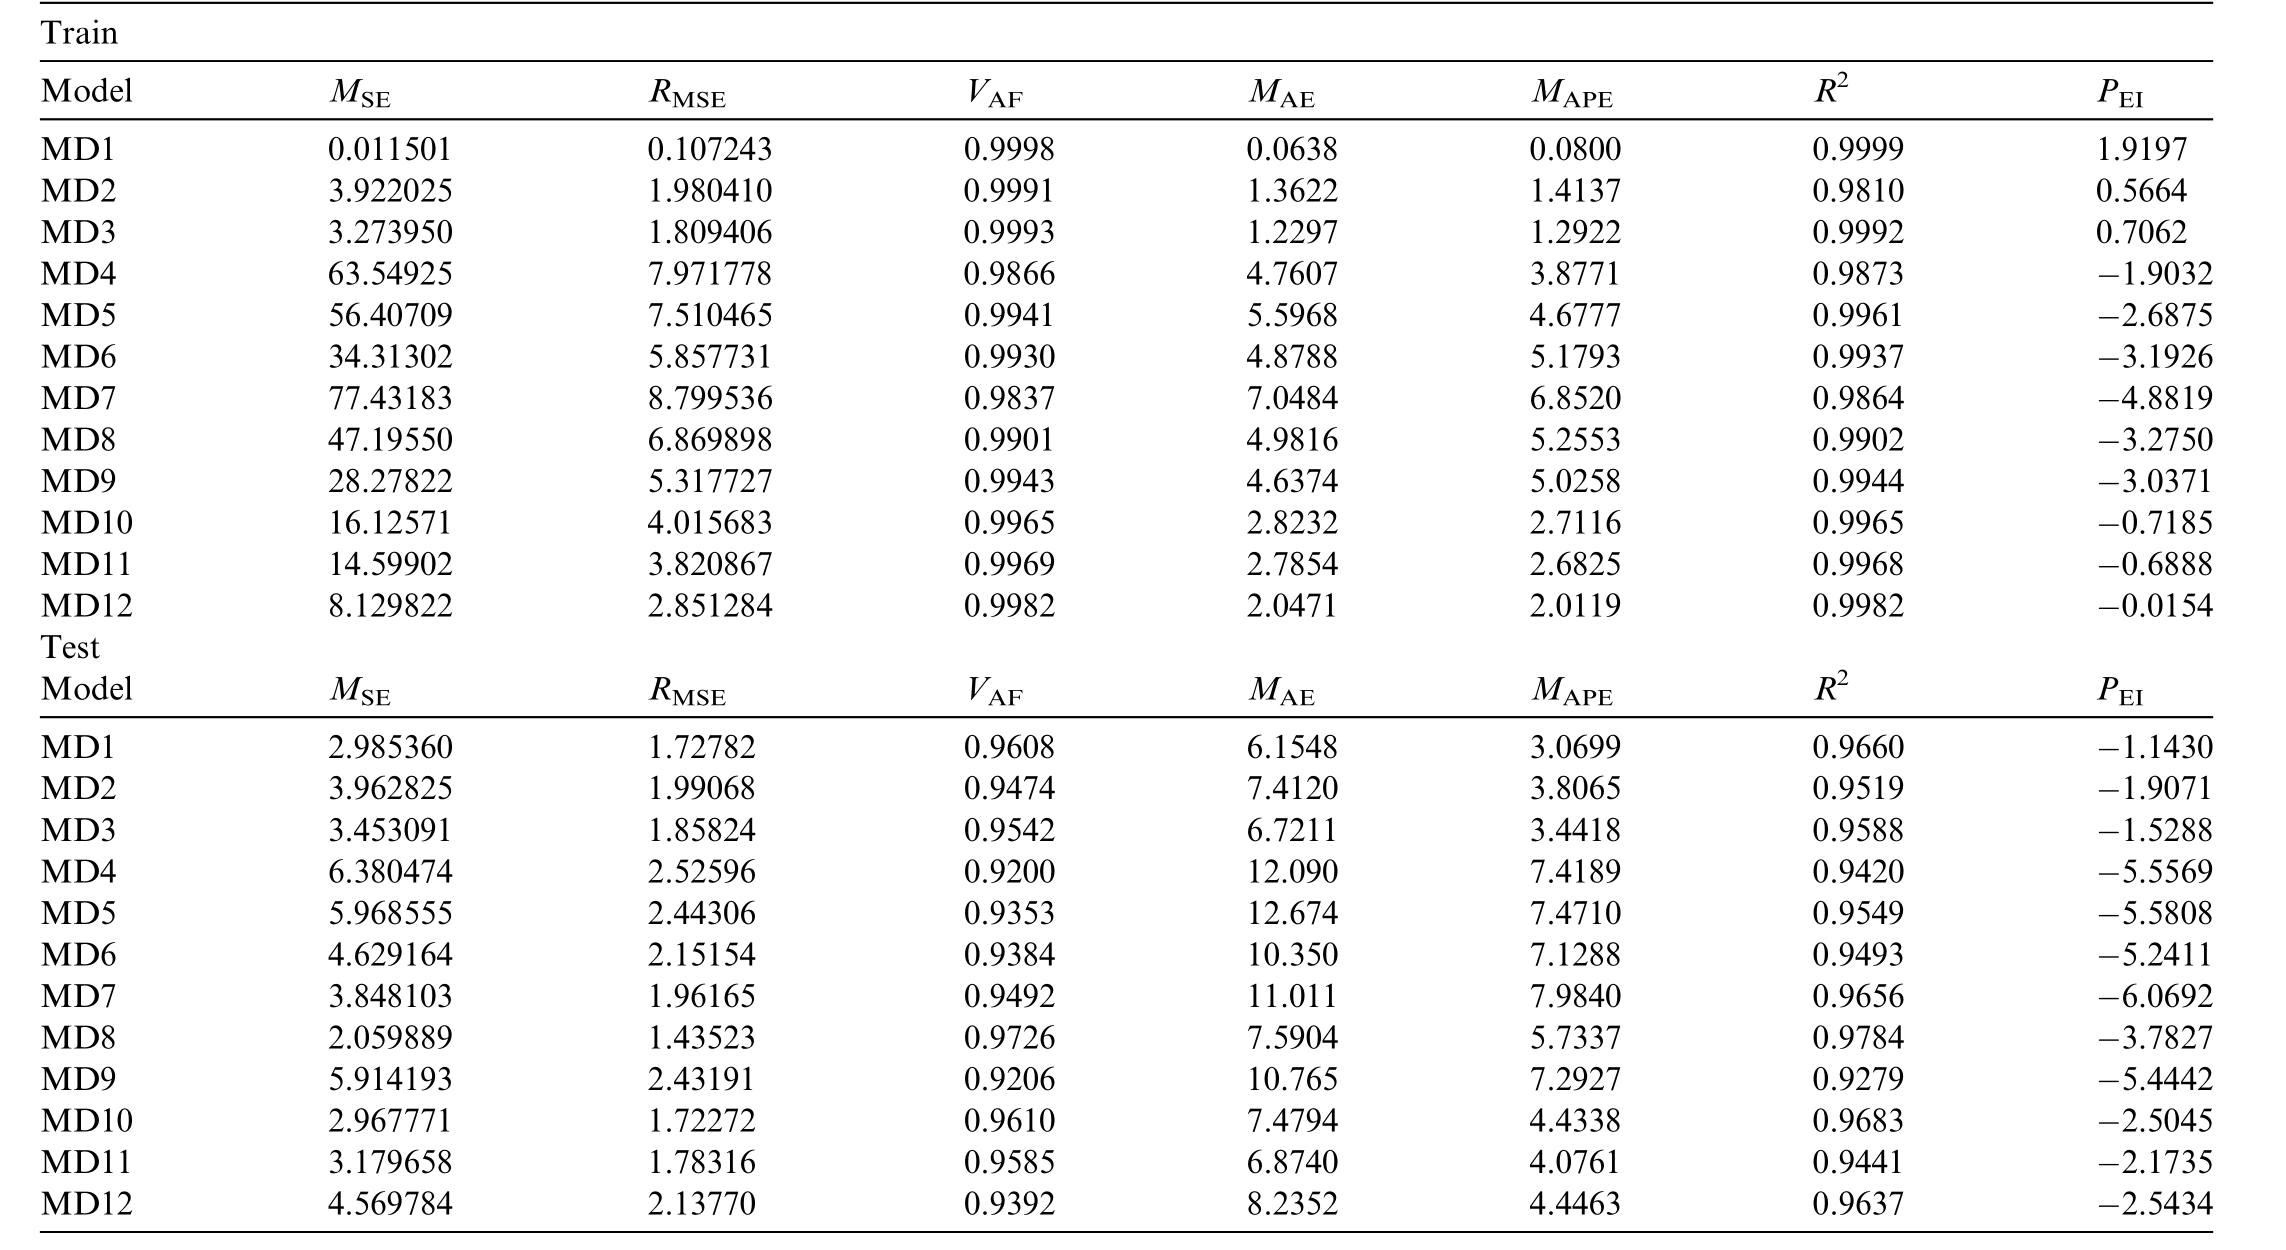
Table 4 Error analysis rating result for the training and testing phase.
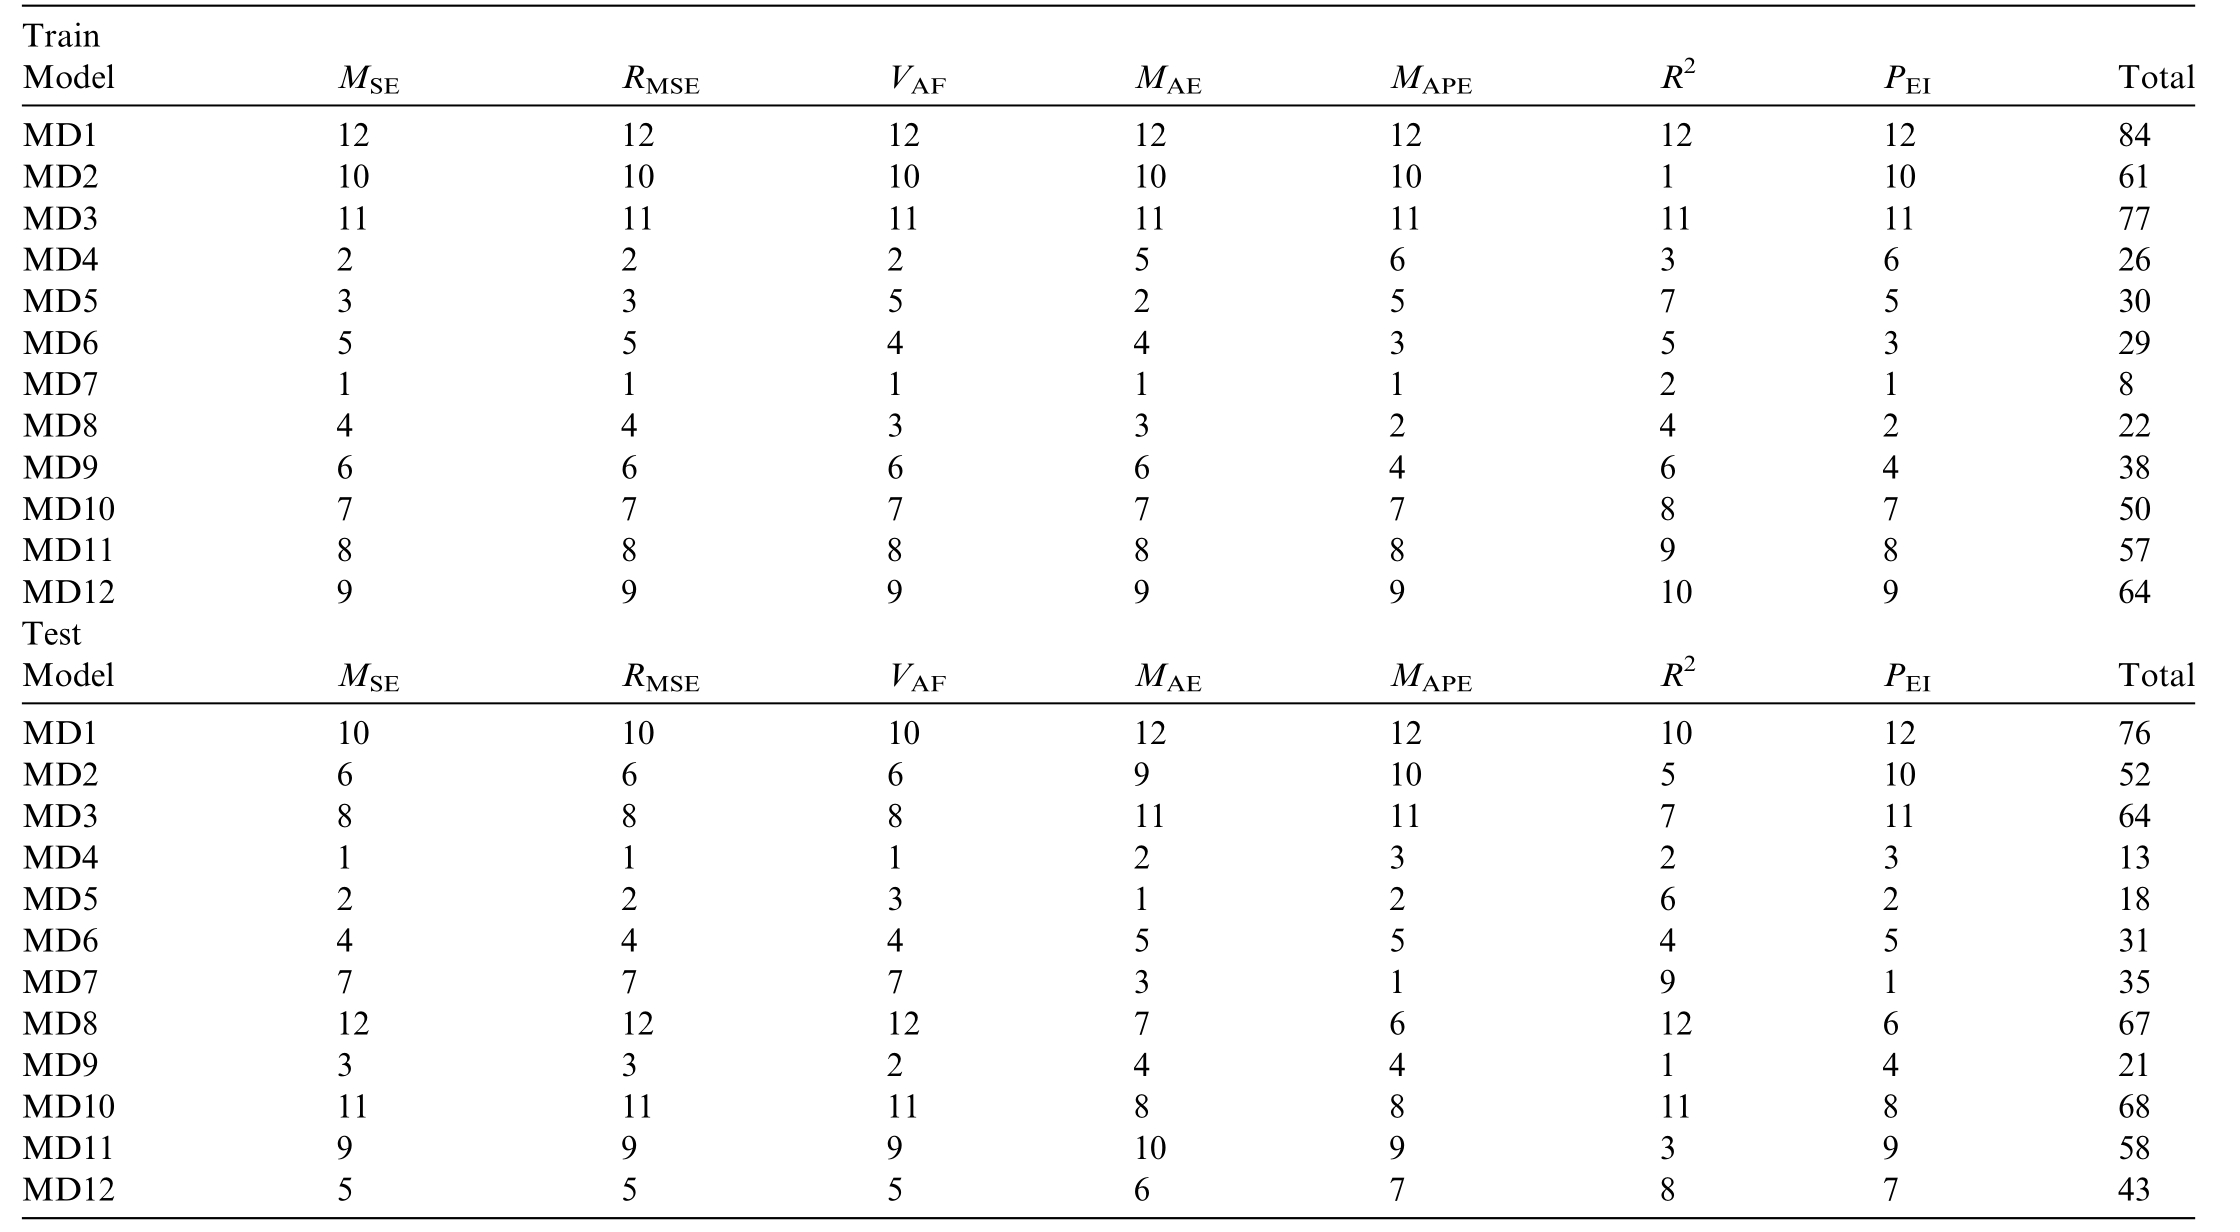
Table 5 Final performan ce ranking analysis.
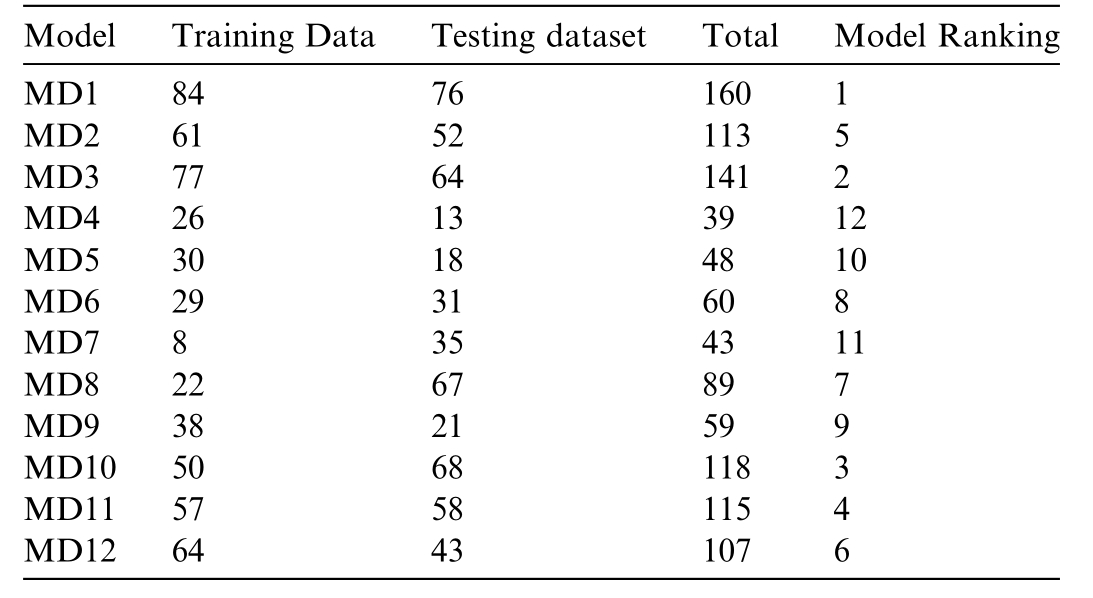
These study results highlight the necessity of evaluating multiple performance criteria, RMSE, MAE, MAPE, R2 ,VAF, and PEI rather than relying on a single metric. For policymakers and investors, models like MD8, which provide stable and reliable predictions under out-of-sample conditions, are particularly valuable for decision-making in volatile energy markets.
4 Conc lusion
The rapid evolution of global energy markets demands advanced predictive tools to ensure stability, efficiency,and sustainability. This study applied twelve advanced AI-based mathematical models to forecast the World Energy Index (WEI), identifying the Gaussian Process Regression–Exponential Kernel (GPR-EK) model as the most effective. Its superior training accuracy (MSE =0.0115, R2 = 0.9999) and strong testing performance(RMSE = 1.728, MAPE = 3.07%) demonstrate its ability to capture the complex, nonlinear dynamics of energy markets. By incorporating diverse variables, including Iraq’s GDP,the proposed framework illustrates the potential of AI to uncover intricate correlations and reduce forecasting uncertainties.
Developing models for the energy index carries significance beyond comparing the performance of different algorithms. From a policy perspective, the findings of this study provide a scientific foundation for strengthening energy security, mitigating supply chain disruptions, and designing equitable distribution strategies. For investors and industry stakeholders, predictive analytics offer a competitive edge by enabling risk-informed decision-making and enhancing asset performance. More broadly, this research highlights the transformative potential of AI in energy economics, serving as a bridge between theoretical modeling and practical application.
Despite these contributions, opportunities for further development remain. Future work should incorporate more diverse datasets, such as geopolitical shocks and renewable energy adoption trends to improve model adaptability. Additionally, exploring hybrid AI frameworks that combine deep learning with ensemble methods could further enhan ce predictive accuracy. Advancing real-time forecasting capabilities also represents a crucial step toward managing the volatility and complexity of global energy markets more effectively.
Ethical stateme nt
Authors state that the research was conducted according to ethical standards.
Funding body
This research received no exter nal funding.
CRediT authorship contribution statement
Hawraa H. Abbas: Writing – original draft, Visualization, Methodology, Investigation, Formal analysis, Data curation, Conceptualization. Blessing Olamide Taiwo:Writing – original draft, Visualization, Validation, Software, Resources, Methodology, Data curation. Angesom Gebretsadik: Writing – review & editing, Writing – original draft, Software, Investigation, Formal analysis, Conceptualization. Esma Kahraman: Validation, Project administration, Methodology, Investigation, Funding acquisition,Formal analysis. Yewuhalashet Fissha: Writing – review& editing, Validation, Supervision, Software, Methodology, Investigation, Formal analysis. Mohammad Khishe:Writing – review & editing, Visualization, Supervision,Investigation, Formal analysis, Data curation. N. Rao Cheepurupalli: Visualization, Supervision, Resources, Project administration, Investigation, Formal analysis.
Credit authorship contribution statement
All authors contributed equally to the manuscript.
Data availabil ity
The data used in this study is available on reasonabl e request through the corresponding author.
Declaration of competing interest
The authors declare that they have no known competing financial interests or personal relationships that could have appeared to influence the work reported in this paper.
References
[1]P. Jakovac, The influence of energy trends on the global economy,in: International Scientific Conference EMAN – Economics and Management: How to Cope with Disrupted Times, 2022, pp. 299–308.
[2]S.N. Nnamchi, Z.O. Jagun, M.A. Ijomah, et al., Time series analysis of global energy indices: logarithmic and normalized techniques for developmental studies, Energy Econom. Lett. 9 (1)(2022) 1–19.
[3]P. Ziemba, A. Becker, J. Becker, Models and indices of sustainability assessment in the energy context, Energies 15 (24)(2022) 1–22.
[4]M. Li, R. Waheed, D. Kirikkaleli, et al., Relevance of hybrid artificial intelligence for improving the forecasting accuracy of natural resource prices, Geosci. Front. 15 (3) (2024) 101670.
[5]X.J. Xu, Y. Zhang, China mainland new energy index price forecasting with the neural network, Energy Nexus 10 (2023)100210.
[6]P. Pinson, L.Y. Han, J. Kazempour, Regression markets and application to energy forecasting, TOP 30 (3) (2022) 533–573.
[7]F. Wu, D.Y. Zhang, Q. Ji, Energy market financialization and its policy implications, in: The Handbook of Energy Policy, Springer Nature Singapore, 2023, pp. 403–425.
[8]C. Baumeister, D. Korobilis, T.K. Lee, Energy markets and global economic conditions, Rev. Econ. Stat. 104 (4) (2022) 828–844.
[9]S.N. Nnamchi, O.A. Nnamchi, J.D. Busingye, et al., Modeling,simulation, and prediction of global energy indices: a differential approach, Front. Energy 16 (2) (2022) 375–392.
[10]M.R. Maarif, A.R. Saleh, M. Habibi, et al., Energy usage forecasting model based on long short-term memory (LSTM) and eXplainable artificial intelligence (XAI), Information 14 (5) (2023)265.
[11]E.V. Palchevsky, V.V. Antonov, L.E. Kromina, et al., Intelligent forecasting of electricity consumption in managing energy enterprises in order to carry out energy-saving measures,Mekhatronika, Avtomatizatsiya, Upravlenie 24(6)(2023)307–316.
[12]P. Delis, S. Degiannakis, K. Giannopoulo s, Forecasting the oil volatility index using factors of uncertainty, Asian J. Econom.Empir. Res. 9 (1) (2022) 13–20.
[13]A. Mystakidis, E. Ntozi, K. Afentoulis, et al., Energy generation forecasting: elevating performance with machine and deep learning,Computing 105 (8) (2023) 1623–1645.
[14]K.S. Arvind, G. Sindhu Madhuri, An energy efficient artificial intelligence based innovation detection for complex data communication model, in: Proceedings of 2023 Internatio nal Conference on Distributed Computing and Electrical Circuits and Electronics (ICDCECE) Ballar, 2023 in India, 2023. pp. 1–7.
[15]M.E. Eldred, J. Thatcher, A. Rehman, et al., Leveraging AI for inventory management and accurate forecast–an industrial field study, Proceedings of SPE Symposium Leveraging Artificial Intelligence to Shape the Future of the Energy Industry. 2023 in Al Khobar, Saudi Arabia, 2023, pp. 214457-MS.
[16]K. N, S. N, C.I. Hermina, et al., Stock market prediction using AI,in: Proceedings of 2023 2nd International Conference on Vision Towards Emerging Trends in Communication and Networking Technologies (ViTECoN), 2023 in Vellore, India, 2023. pp. 1–5.
[17]A.A. Rodionov, R.A. Fayziev, G.A. Jakupov,The introduction of artificial intelligence in statistical and economic research, in:Proceedings of the 6th International Conference on Future Networks & Distributed Systems. 2022 in Tashkent TAS Uzbekistan, 2022, pp. 147–151.
[18]L.L. Wang, L.Y. Zhao, Digital economy meets artificial intelligence: forecasting economic conditions based on big data analytics, Mob. Inf. Syst. 2022 (2022) 7014874.
[19]Y.M. Tang, K.Y. Chau, Y.Y. Lau, et al., name="ref20" style="font-size: 1em; text-align: justify; text-indent: 2em; line-height: 1.8em; margin: 0.5em 0em;">[20]M.P. Institute, S.S. Golubev, F. Enterprise, et al., The use of artificial intelligence technologies for scientific and technological forecasting, J. Appl. Informat. 17 (4) (2022) 57–74.
[21]C. Zhang, N.N.A. Sjarif, R.B. Ibrahim, Deep learning techniques for financial time series forecasting: a review of recent advancements: 2020-2022, ArXiv: 2305.04811. 2023.
[22]M. Iaousse, Y. Jouilil, M. Bouincha, et al.,Comparative simulation study of classical and machine learning techniques for forecasting time series data, Int. J. Online Biomed. Eng. (IJOE) 19 (8) (2023)56–65.
[23]B.R.A. Kumar, S. Katiyar, P. Lingada, et al., Evaluating the performance of diverse machine learning approaches in stock market forecasting, in: Multi-disciplinary Trends in Artificial Intelligence, Springer Nature, Switzerland, 2023, pp. 255–264.
[24]M.U. Tariq, S.B. Ismail, M. Babar, et al.,Harnessing the power of AI: Advanced deep learning models optimization for accurate SARS-CoV-2 forecasting, PLoS One 18 (7) (2023) e0287755.
[25]A.H. Gatea, N.J. Sadik, H.A. Rasheed, Modeling the trend of Iraqi GDP for 1970-2020, Period. Eng. Nat. Sci.(PEN)11(1)(2023)216.
[26]B.M. Dolgonosov, The energy representation of world GDP,Biophys. Econom. Sustain. 5 (3) (2020) 12.
[27]A.A.A. Leiwi, The repercussions of oil price fluctuations on iraqs gross domestic product analytical study for the period between 2000-2019, Int. Acad. J. Account. Finan. Manag. 9 (2) (2022) 48–61.
[28]N.N. Sergeev, P.V. Matrenin, A review of international experience in forecasting renewable energy generation using machine learning methods, IPolytech J. 27 (2) (2023) 354–369.
[29]A. Sinha, T. Singh, R. Vyas, et al., A methodological review of time series forecasting with deep learning model: A case study on electricity load and price prediction, in: Machine Learning, Image Processing, Network Security and Data Sciences, Springer Nature,Singapore, 2023, pp. 457–479.
[30]L.B. Sina, C.A. Secco, M. Blazevic, et al., (2023) Hybrid forecasting methods: a systematic review, Electronics 12 (9)(2023) 2019.
[31]D. Kaur, S.N. Islam, M.A. Mahmud, et al., Energy forecasting in smart grid systems: recent advancemen ts in probabilistic deep learning, IET Generat., Trans. Distribut.16(22)(2022)4461–4479.
[32]A. Shaghaghi, M. Taghi Tahooneh, V. Rezaei, et al.,A new model for allocating subsidies to power distribution companies for loss reduction, Expert Syst. Appl. 275 (2025) 127025.
[33]A. Shaghaghi, M. Taghitahooneh, R. Dashti, et al., An economic model for optimal placement and capacity determination of DGs using genetic algorithm, in: Proceedings of 2024 9th International Conference on Technology and Energy Management (ICTEM)2024 in Behshar, Mazandaran, Iran, 2024, pp. 1–7.
[34]I. Gurrib, Can an energy futures index predict US stock market index movements?, Int J. Energy Econ.Policy 8(5)(2018)230–240.
[35]Y.S. Lee, L.I. Tong, Forecasting nonlinear time series of energy consumption using a hybrid dynamic model, Appl. Energy 94(2012) 251–256.
[36]F. Lescaroux, Industrial energy demand, a forecasting model based on an index decomposition of structural and efficiency effects,OPEC Energy Rev. 37 (4) (2013) 477–502.
[37]H. Hassani, E.S. Silva, Forecasting energy data with a time lag into the future and Google trends, Int. J. Energy Stat. 4 (4) (2016)1650020.
[38]M. Elsaraiti, G.M. Ali, H. Musbah, et al., Time series a nalysis of electricity consumption forecasting using ARIMA mode l, in:Proceedings of 2021 IEEE Green Technologies Conf erence(GreenTech), 2021 in Denver, USA, 2021, pp. 259– 262.
[39]R. Weron, A. Misiorek, Short-term electricity price forecasting with time series models: A review and evaluation. HSC Research Reports, Hugo Steinhaus Center, Wroclaw University of Science and Technology, 2006, Available online: https://ideas.repec.org/p/wuu/wpaper/hsc0601.html.
[40]P.P. Phyo, Y.C. Byun, Hybrid ensemble deep learning-based approach for time series energy prediction, Symmetry 13 (10)(2021) 1942.
[41]D. Infield, L. Freris, Renewable energy in power systems. 2025.Available online: https://books.google.com/books?hl=en&lr=&id=l-a9DwAAQBAJ&oi=fnd&pg=PP15&dq=42.%09Infield,+D.,+%26+Freris,+L.+Renewable+energy+in+power+systems.+John+Wiley+%26+Sons+(2020)+&ots=en2TDHzMRf&sig=w0hTLba3NW7lS_YZjmNFPrUPcA4.
[42]N. Majaw, S.S. Ahmed, Exploring data distributions using box and whisker plot analysis, in: Proceedings of 2023 14th International Conference on Computing Communication and Networking Technologies (ICCCNT), 2023 in Delhi, India, 2023, pp. 1–8.
[43]J. Dong, M. Mukadam, F. Dellaert, et al., Motion planning as probabilistic inference using Gaussian processes and factor graphs,in: Proceedings of Robotics: Science and Systems, 2016, pp. 1–9.
[44]C.K. Arthur, V.A. Temeng, Y.Y. Ziggah, Novel approach to predicting blast-induced ground vibration using Gaussian process regression, Eng. Comput. 36 (1) (2020) 29–42.
[45]D.W. Dong, Mine gas emission prediction based on Gaussian process model, Procedia Eng. 45 (2012) 334–338.
[46]Y.Y. Pu, D.B. Apel, J. Chen, et al., A Gaussian process machine learning model for cemented rockfill strength prediction at a diamond mine, Neural Comput. Applic.32(14)(2020)9929–9937.
[47]X.J. Zhou, F.Y. Zhou, M. Naseri, An insight into the estimation of frost thermal conductivity on parallel surface channels using kernel based GPR strategy, Sci. Rep. 11 (2021) 7203.
[48]Z.H. Zhou, W. Tang, Selective ensemble of decision trees, in:Rough Sets, Fuzzy Sets, Data Mining, and Granular Computing,Springer, 2007, pp. 476–483.
[49]M. Omar, E. Alotaibi, M.G. Arab, et al., Harnessing natureinspired soft computing for reinforced soil bearing capacity prediction: a neuro-nomograph approach for efficient design, Int.J. Geosynth. Ground Eng. 9 (4) (2023) 53.
[50]W. Cai, X.D. Wen, C.E. Li, et al., Predicting the energy consumption in buildings using the optimized support vector regression model, Energy 273 (2023) 127188.
[51]B.O. Taiwo, B. Adebayo, Artificial neural network technique as an approach for the prediction of blast fragment oversize-undersize and optimization of dolomite quarry blasting operation, in:Proceedings of 7th UMaT Biennial International Mining and Mineral Conference. 2022 in Tarkwa, Ghana, 2022, pp. 1–12.
[52]A. Gebretsadik, R. Kumar, Y. Fissha, et al., Enhancing rock fragmentation assessment in mine blasting through machine learning algorithms: a practical approach, Disc. Appl. Sci. 6 (5)(2024) 223.
[53]S. Hosseini, J. Khatti, B.O. Taiwo, et al., Assessment of the ground vibration during blasting in mining projects using different computational approaches, Sci. Rep. 13 (2023) 18582.
Received 9 April 2025;revised 31 August 2025; accepted 27 September 2025
Abbreviations: AI, Artificial Intelligence; WEI, World Energy Index; GDP, Gross Domestic Product; MSE, Mean Squared Error; RMSE, Root Mean Squared Error; VAF, Variance Accounted For; MAE, Mean Absolute Error; MAPE, Mean Absolute Percentage Error; R2 , Coefficient of Determination;PEI, Performance Error Index; KNN, K-Nearest Neighbors; SVR, Support Vector Regression; LSTM, Long Short-Term Memory; ANN, Artificial Neural Network; BR, Bayesian Regularization; LM, Levenberg-Marquardt Algorithm; GPR, Gaussian Process Regression;ET,Ensemble Tree;CNN,Convolutional Neural Network;CP,Coal Prices;Cu,Copper Price;Fe,Iron Price;CHIF,China Inflation Rate;USAIF,USA Inflation Rate;CGDP,China Gross Domestic Product; GDPI, Iraq Gross Domestic Product; FR, Final Rating; GM, Grouped Marginal Plot; Q1, 25th Percentile; Q3, 75th Percentile Peer review under the responsibility of Global Energy Interconnection Group Co. Ltd.
* Corresponding authors at: Division of Sustainable Resources Engineering, Graduate School of Engineering, Hokkaido University, Kita-13, Nishi-8,Sapporo 060-8628, Japan.
E-mail addresses: hawraa.h@uokerbala.edu.iq (H.H. Abbas), taiwoblessing199@gmail.com (B.O. Taiwo), angstg2007@gmail.com (A. Gebretsadik),ekahraman@cu.edu.tr (E. Kahraman), yewuhala@asahikawa-nct.ac.jp (Y. Fissha), m_khishe@alumni.iust.ac.ir (M. Khishe), nraocheepurupalli@gmail.com (N. Rao Cheepurupalli).
https://doi.org/10.1016/j.gloei.2025.09.007
2096-5117/© 2026 Global Energy Interconnection Group Co. Ltd. Publishing services by Elsevier B.V. on behalf of KeAi Communications Co. Ltd.
This is an open access article under the CC BY-NC-ND license(http://creativecommons.org/licenses/by-nc-nd/4.0/).

Hawraa H. Abbas Doctor of Engineering. Professor at University of Kerbala a Ph.D. from Cardiff University/UK. She received her B.Sc.degree in computer engineering from Baghdad University, Iraq and M.Sc. degree in computer engineering also from Baghdad University,Iraq. Her research interests include AI algorithms and applications, 3D face modeling,classification of facial traits, image processing,computer network design, genetic associations,computer vision.