
0 Intr oduction
Driven by global carbon neutrality targets [1], PV generation has become a cornerstone of renewable energy,with its global installed capacity exceeding 2.2 TW in 2024 [2]. However, the inherent intermittency and volatility of PV power pose severe chall enges to grid stability under high penetration levels[3].Consequently, developing precise PV system models and high-fidelity forecasting techniques is imperative to mitigate these uncertainties,thereby optimizing power dispatch,guiding energy storage sizing, and minimizing curtailment.
While traditional analytical models demand accurate infrastructure metadata (e.g., module parameters and spatial coordinates) to define physical constraints[4], conventional style="font-size: 1em; text-align: justify; text-indent: 2em; line-height: 1.8em; margin: 0.5em 0em;">Despite the decisive role of data, current review literature predominantly focuses on algorithmic innovations[5–10], leaving dataset-centric reviews scarce. More importantly, while numerous public datasets exist, they exhibit significant heterogeneity in temporal resolution, timespan, and geographic coverage. This inconsistency severely compli cates data selection for researchers. Furthermore,existing style="font-size: 1em; text-align: justify; text-indent: 2em; line-height: 1.8em; margin: 0.5em 0em;">To bridge this gap, this paper presents a comprehensive review of publicly available benchmark datasets for PV system modeling and forecasting. We systematically c ategorize these resources into three primary domains:1)meteorological datasets, encompassing diverse sources from satellite retrievals to ground observations; 2) PV generation datasets, detailing actual power output profiles across varying temporal resolutions; and 3) static system parameters, providing geospatial and physical module parameters. By thoroughly analyzing the characteristics, quality,and specific applications of these resources,this work aims to serve as an authoritative guide to data selection, establishing a solid foundation for future style="font-size: 1em; text-align: justify; text-indent: 2em; line-height: 1.8em; margin: 0.5em 0em;">The remainder of this paper is organized as follows:Sections 1–3 detail the meteorological, PV generation,and static system parameters,respectively.Section 4 examines data utilization for PV forecasting, followe d by the conclusion in Section 5.
1 Meteorological datas ets
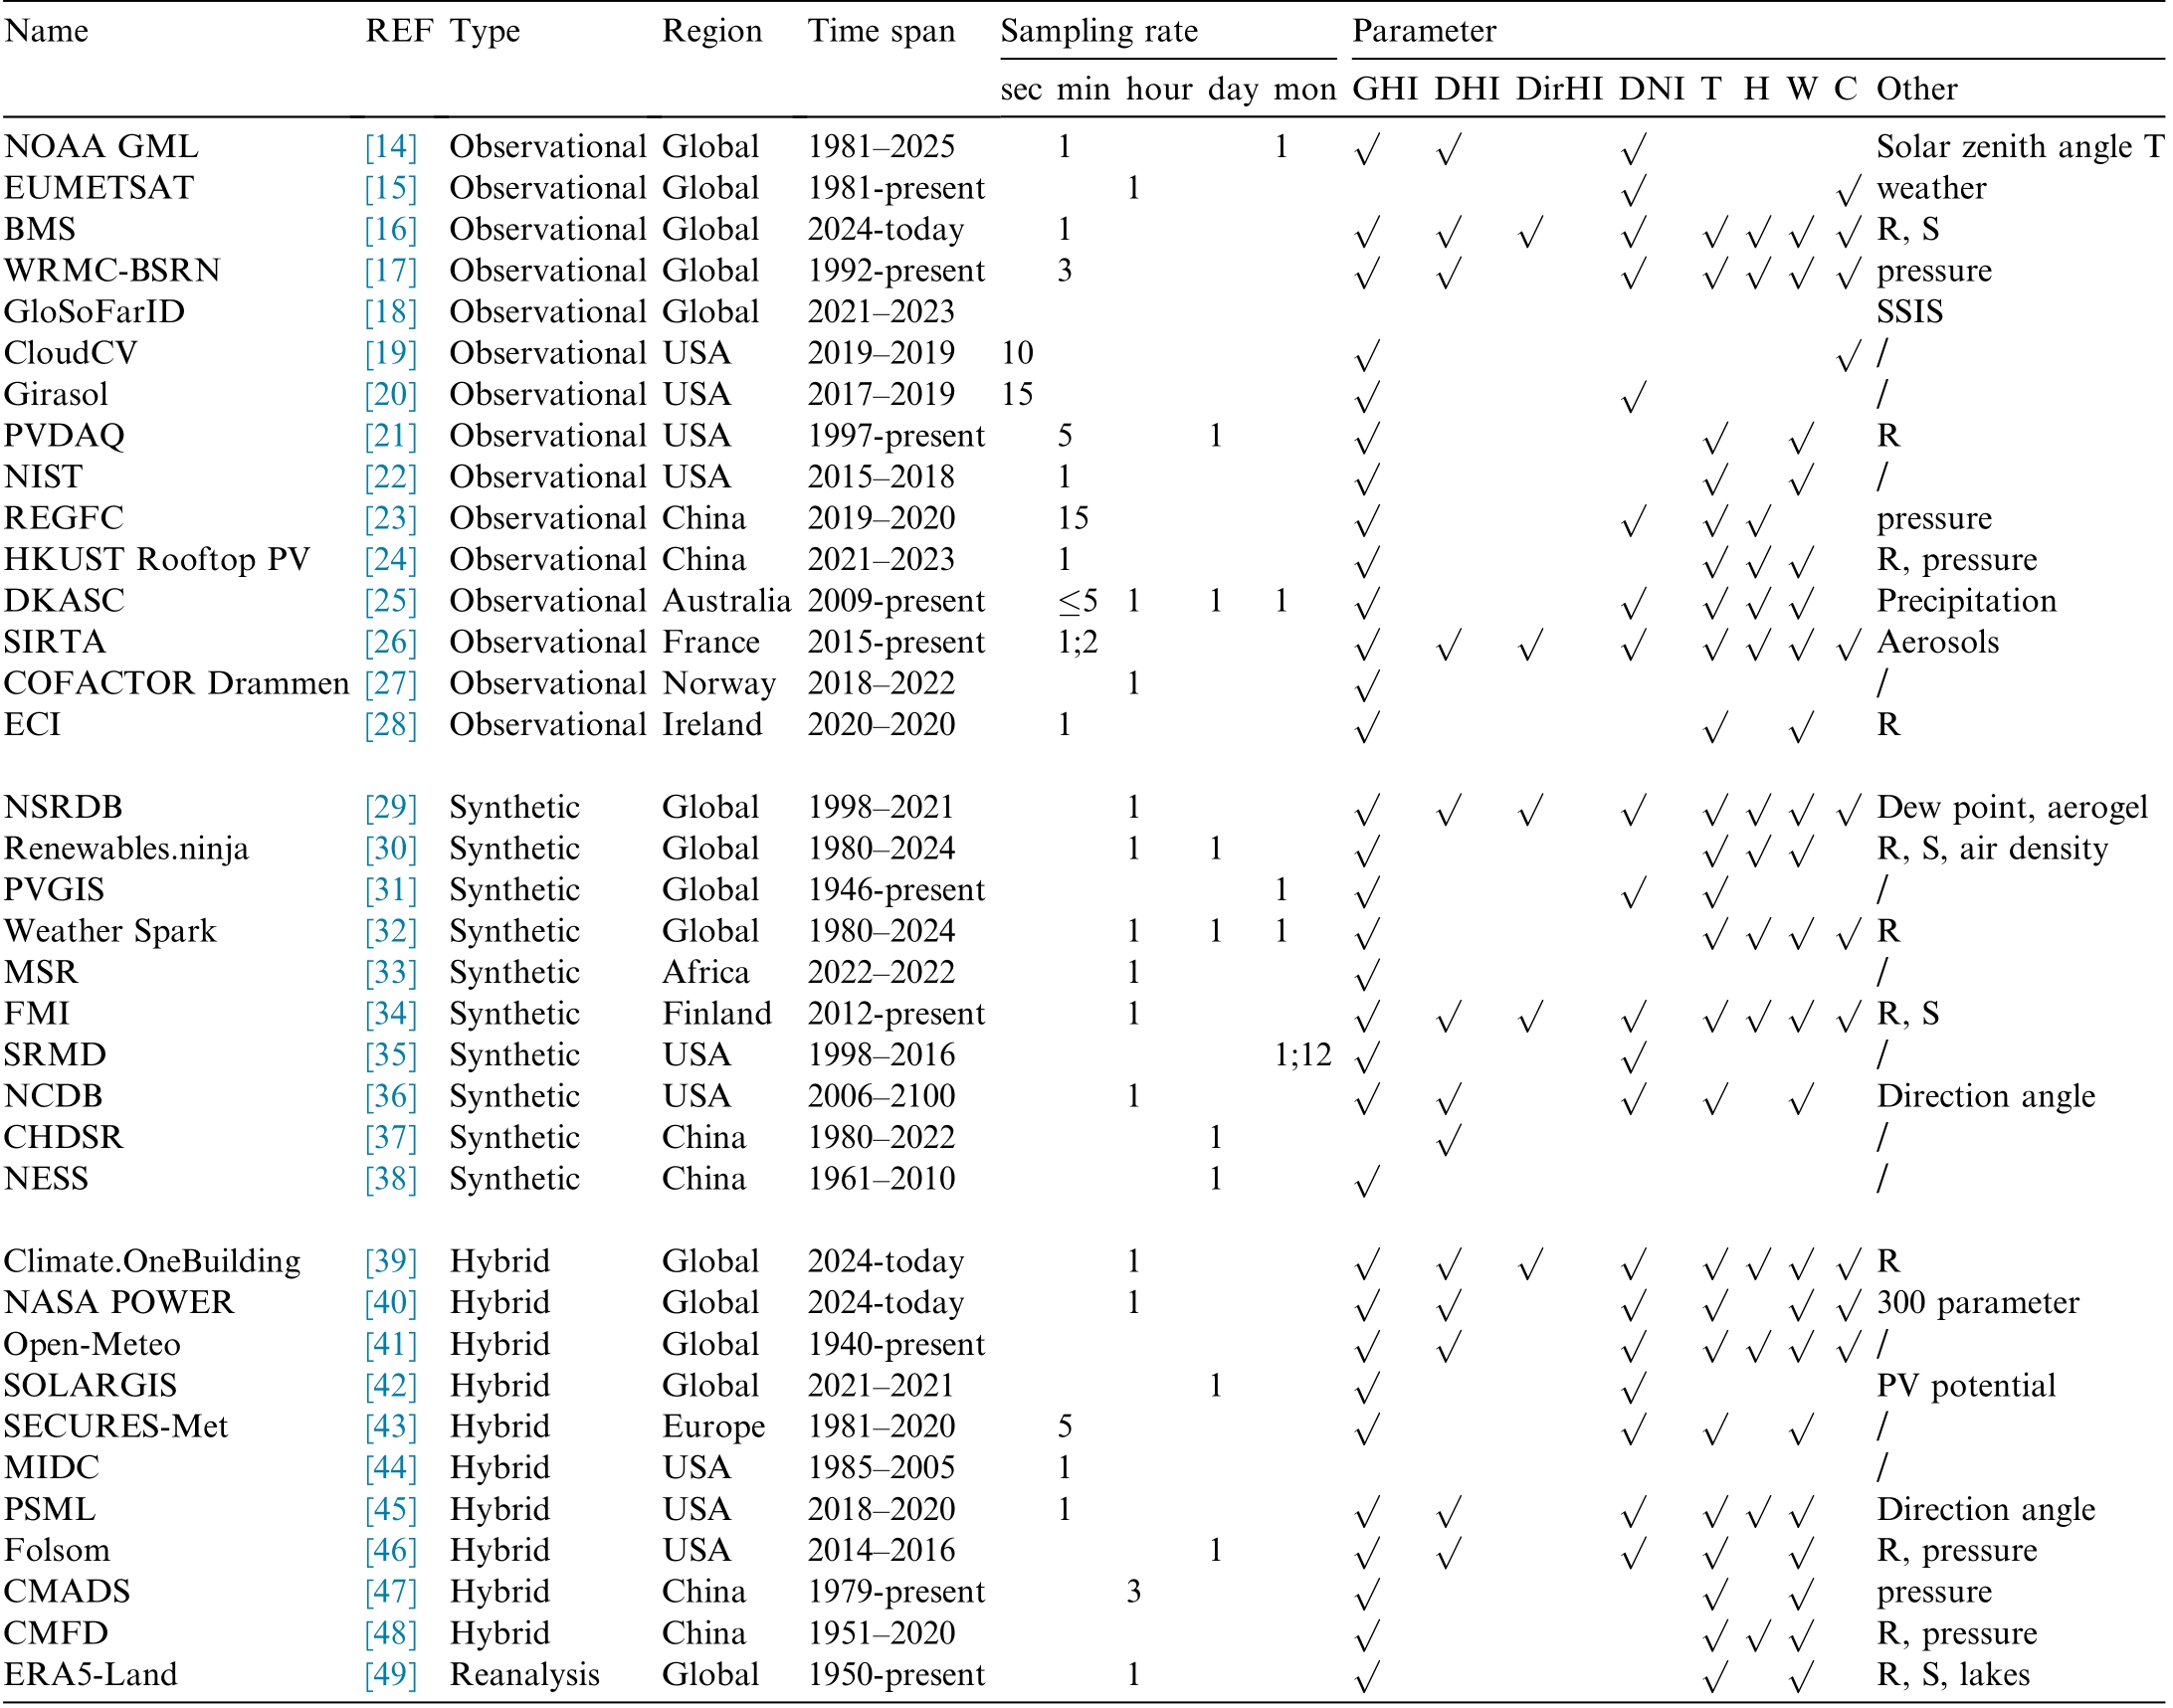
This section categorizes meteorological datasets into four primary types based on their diverse sources and generation mechanisms: observational, synthetic, hybrid, and reanalysis. To provide a granular analysis, these resources are further subclassified by geographic coverage into global, regional, national and station-level scales. By examining their intrinsic characteristics, core variables, and applicable scenarios, this section systematically evaluates the respective advantages and limitations of each category in PV system modeling and for ecasting. The comprehensive specifications of these datasets are summarized in Table. 1. The geographic distribution for the meteorological dataset is shown in Fig. 2; the distribution of sampling rates is shown in Fig. 3.
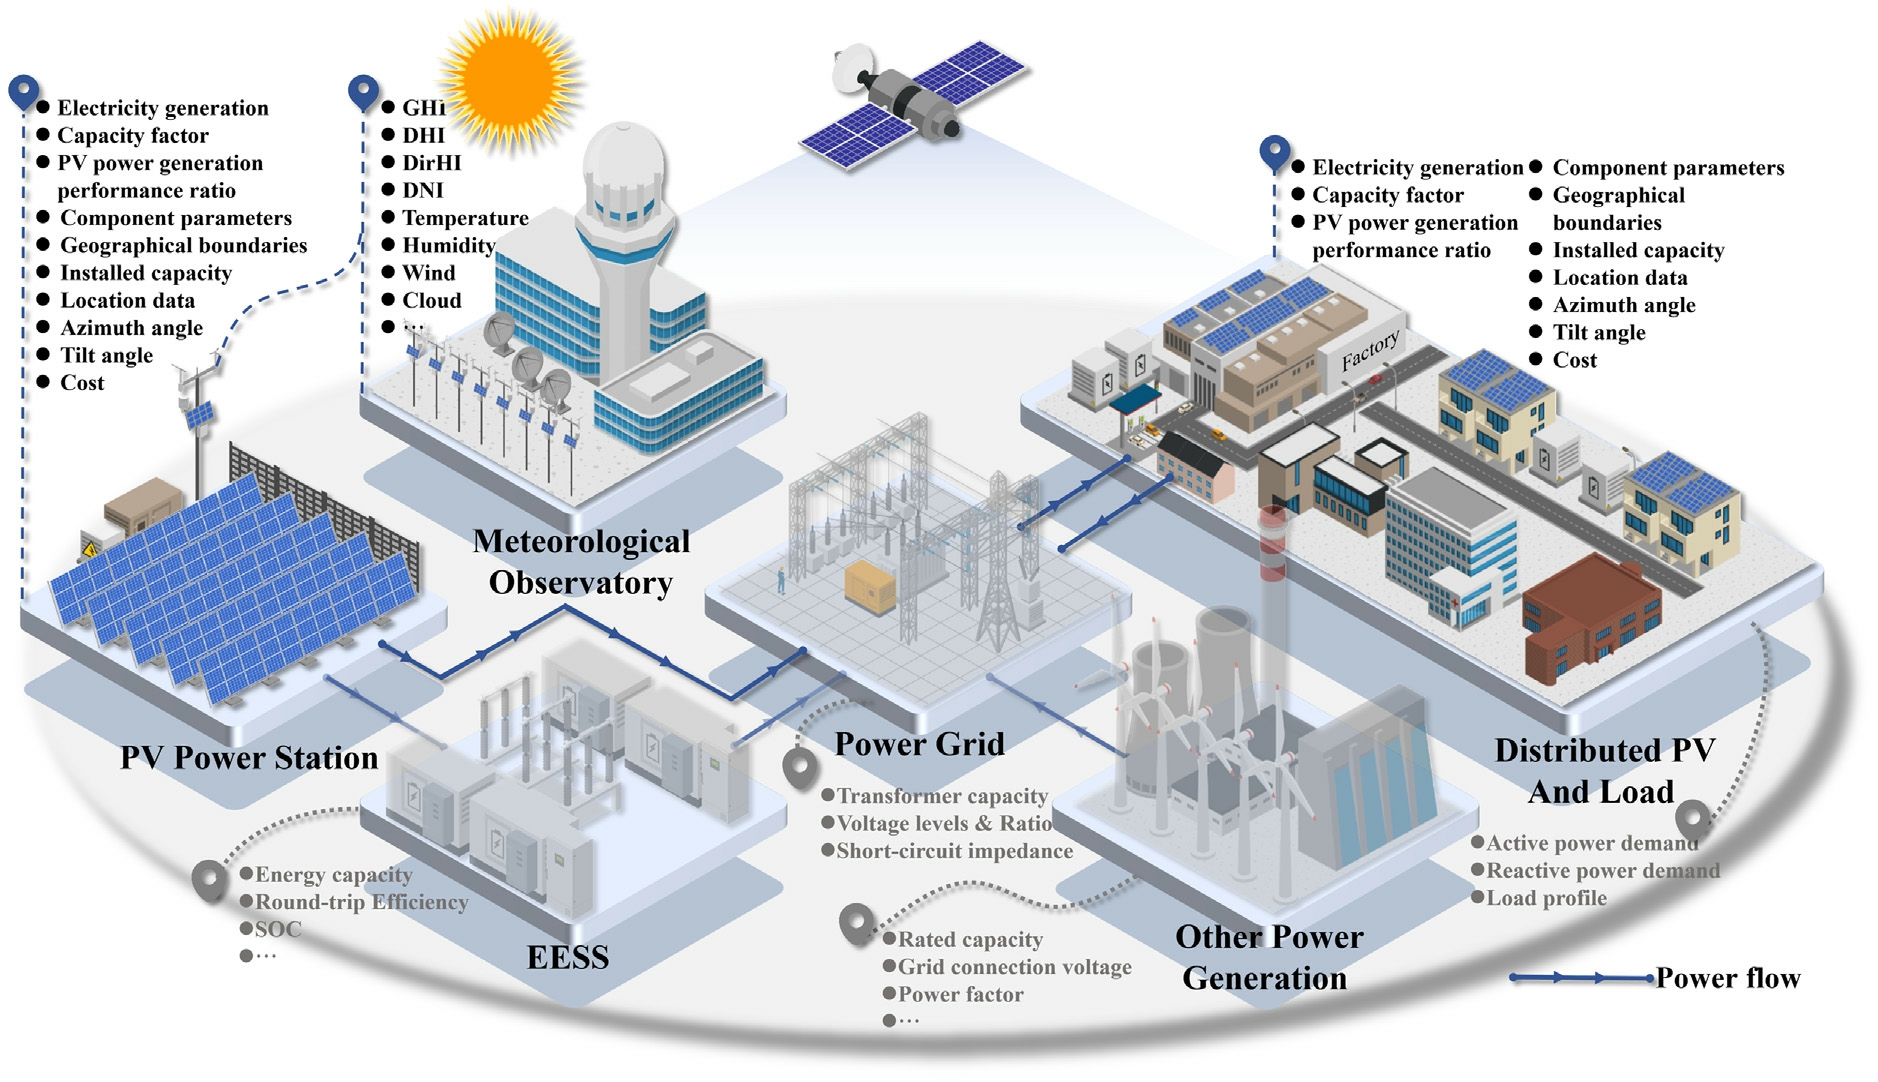
Fig. 1. System architecture diagram.
1.1 Observational datasets: global scale
Observational datasets comprise empirical measurements acquired directly through in-situ field observations and physical sensor networks.
1) NOAA GML [14]

The National Oceanic and Atmospheric Administration’s Global Monitoring Laboratory (NOAA GML)tracks long-term atmospheric observations. Maintained through strict quality control, NOAA GML datasets establish widely recognized benchmarks in atmospheric and radiometric research. Specifically, integrating NOAA GML irradiance data with meteorological variables facilitates robust short- to ultra-short-term PV forecasting.Additionally, detailed atmospheric records like aerosol profiles are vital for model calibration, effectively mitigating forecast errors during complex weather conditions[50–52].
2) EUMETSAT [15]

The European Organisation for the Exploitation of Meteorological Satellites (EUMETSAT) compiles radiometric datasets from operational satellite fleets like the Meteosat series, which capture comprehensive observations across both visible and infrared channels. Benefiting from rigorous radiometric calibration and advanced cloud detection methods, these observations exhibit exceptional data fidelity and temporal continuity.Consequently,these refined datasets drive foundational irradiance modeling and downstream multi-scale PV forecasting and system performance evaluation [53–55].
3) BMS [16]

The Baseline Measurement System (BMS) dataset,curated by the National Renewable Energy Laboratory(NREL), archives ground-based observations collected at the Solar Radiation Research Laboratory. It features long-term, 1-minu te-resolution solar irradiance data, synchronized with meteorological parameters and sky imagery. This fine-grained telemetry directly underpins precision PV system modeling and long-term PV module performance evaluation, strictly calibrating PV energy yield assessment criteria [56–58].
4) WRMC-BSRN [17]

The World Radiation Monitoring Center-Baseline Surface Radiation Network (WRMC-BSRN) dataset records global, ground observations with state-of-the-art radiometric precision. Collected from globally distributed stations, this dataset comprises high-frequency measurements of solar shortwave and terrestrial longwave radiation, which are primarily hosted on the PANGAEA repository. Owing to their high fidelity, these records establish a definitive standard for validating and refining PV power forecasting models [59,60]. Furthermore, they are instrumental in calibrating PV reference cells to evaluate module conversion efficiency a nd assessing the operational resilience of PV systems under extreme climates[50].
5) GloSoFarID [18]

The Global Multispectral Dataset for Solar Farm Identification (GloSoFarID) provides satellite imagery across 13 spectral bands, acquired by the Sentinel-2 mission between 2021 and 2023 with a 10-meter spatial resolution. These observations are paired with pixel-level ground-truth segmentation masks that accurately delineate PV plant boundaries. By combining diverse spectral signatures with these high-quality annotations, t he dataset serves as a robust resource for training computer vision models. Consequently, it facilitates the automated extraction of PV footprints and spatial capacity estimation, laying a geospatial foundation for regional-scale PV system modeling.
1.2 Observational datasets: national scale
1) CloudCV [19]

The CloudCV dataset, compiled by the NREL at the Solar Radiation Research Laboratory, archives fisheye sky images captured at 10-second intervals synchronously with ground-level irradiance measurements. These highfrequency optical observations train deep learning archi-GHI=’Global horizontal irradiance’, DHI=’Diffuse Horizontal Irradiance’, DirHI=’Direct Horizontal Irradiance’, DNI=’Direct Normal Irradiance’,T=’Temperature’, H=’Humidity’, W=’Wind’, C=’Cloud’, R=’Rainfall’, S=’Snowfall’, SSIS=’Spectral Satellite Image Samples’.tectures to identify cloud kinematics and track localized trajectories, ultimately driving image-based ultra-shortterm PV forecasting.
Table 1 Meteorolo gical datasets.
2) Girasol [20]

The Girasol dataset, developed by the University of New Mexico, aggregates 244 days of high-frequency sky images, GHI measurements, solar position records, and local meteorological variables.Hosted on Dryad,this multimodal repository underpins microgrid energy dispatch optimization and parameterizes ultra-shor t-term PV power forecasting models [12,61].
3) PVDAQ [21]

The Photovoltaic Data Acquisition (PVDAQ) repository, maintained by NREL, synchronizes static plant metadata, continuous PV generation records across diverse commercial facilities, and local meteorological data. Transcending standard diagnostic validation, this
extensive technological and spatial operational context establishes a definitive baseline for cross-dataset generalization and meta-analyses within PV forecasting architectures [62–64].
1.3 Observational datasets: station scale
1) NIST [22]

The National Institute of Standards and Technology(NIST) dataset archives high-resolution, synchronized meteorological and operational measurements from its Gaithersburg campus[65,66]. Featuring diverse array configurations and localized environmental records, it enables researchers to investigate how distinct array geometries and microclimates impact overall generation efficiency[65].
2) REGFC [23]

The Chinese State Grid Renewable Energy Generation Forecasting Competition (REGFC) dataset aggregates localized generation and synchronous meteorological records from eight PV plants and six wind farms geographically distributed across China. Hosted on Figshare with both raw and preproces sed time-series, this vast geographic diversity drives the modeling of spatiotemporal dynamics and operational characteristics within regional PV forecasting architectures [67,68].
3) HKUST Rooftop PV [24]

The HKUST Rooftop PV dataset compiles highresolution generation profiles (2021–2023) from 60 gridconnected systems, strictly paired with synchronous meteorological data. It explicitly categorizes stations into configurations with and without modu le-level power optimizers,directly parameterizing optimizer efficacy under complex urban partial-shading conditions to refine distributed PV performance models.
4) DKASC [25]

The Desert Knowledge Australia Solar Centre(DKASC) dataset integrates over 15 years of operational records from regional PV facilities, a precinct microgrid,and its Battery Energy Storage System.Synchronized with multi-site meteorological data across diverse climatic zones, including Darwin and Alice Springs, these profiles enable researchers to investigate the local ized impacts of extreme weather on long-term PV performance and algorithmic robustness[69–71].
5) SIRTA [26]

The SIRTA dataset, operated by the Pierre-Simon Laplace Institute in France and hosted by the AERIS data center, captures highly granular atmospheric and radiometric profiles from the Saclay Plateau. Since 2002, continuous measurements have been conducted using over 100 instruments distributed across four different regions. The public database data spans from 2015 to the present. This extensive temporal depth and spatial density directly parameterizes localized spectral irradiance analysis and long-term PV module degradation models [72–74].
6) COFACTOR Drammen [27]

The COFACTOR Drammen dataset comprises four years of climatological and operational data collected from 45 public buildingsinDrammen,Norway.Itshallmarkistheinclusionof detailed architectural and operational metadata for each facility, ranging from floor areas and construction years to HVAC specifications and energy labels. By pairing this building metadata with high-resolution sub-metering records, the dataset provides a specialized multi-domain foundation for simulating Building-Integrated PV systems and optimizing distributed urban energy management frameworks[75].
7) ECI [28]

The Energy Community in Ireland (ECI) dataset tracks a full year (2020) of minute-resolution energy profiles from a residential prosumer network, synchronized with local meteorological data. By detailing the highly volatile generation and consumption patterns of individual households, the repository uniquely supports the optimization of microgrid management and peer-to-peer energy trading strategies within distributed PV forecasting frameworks [76].
1.4 Synthetic datasets: global scale
Generated by simulating atmospheric physics or extracting statistical patterns from empirical data, synthetic datasets provide continuous profiles that overcome the spatiotemporal limitations of physical sensor networks. However, as model-driven approximations, they may struggle to capture the highly localized anomalies and extreme weather events typically found in direct physical observations, despite preserving overarching statistical distributions. The data sources for the synthetic datasets are shown in Fig. 4.
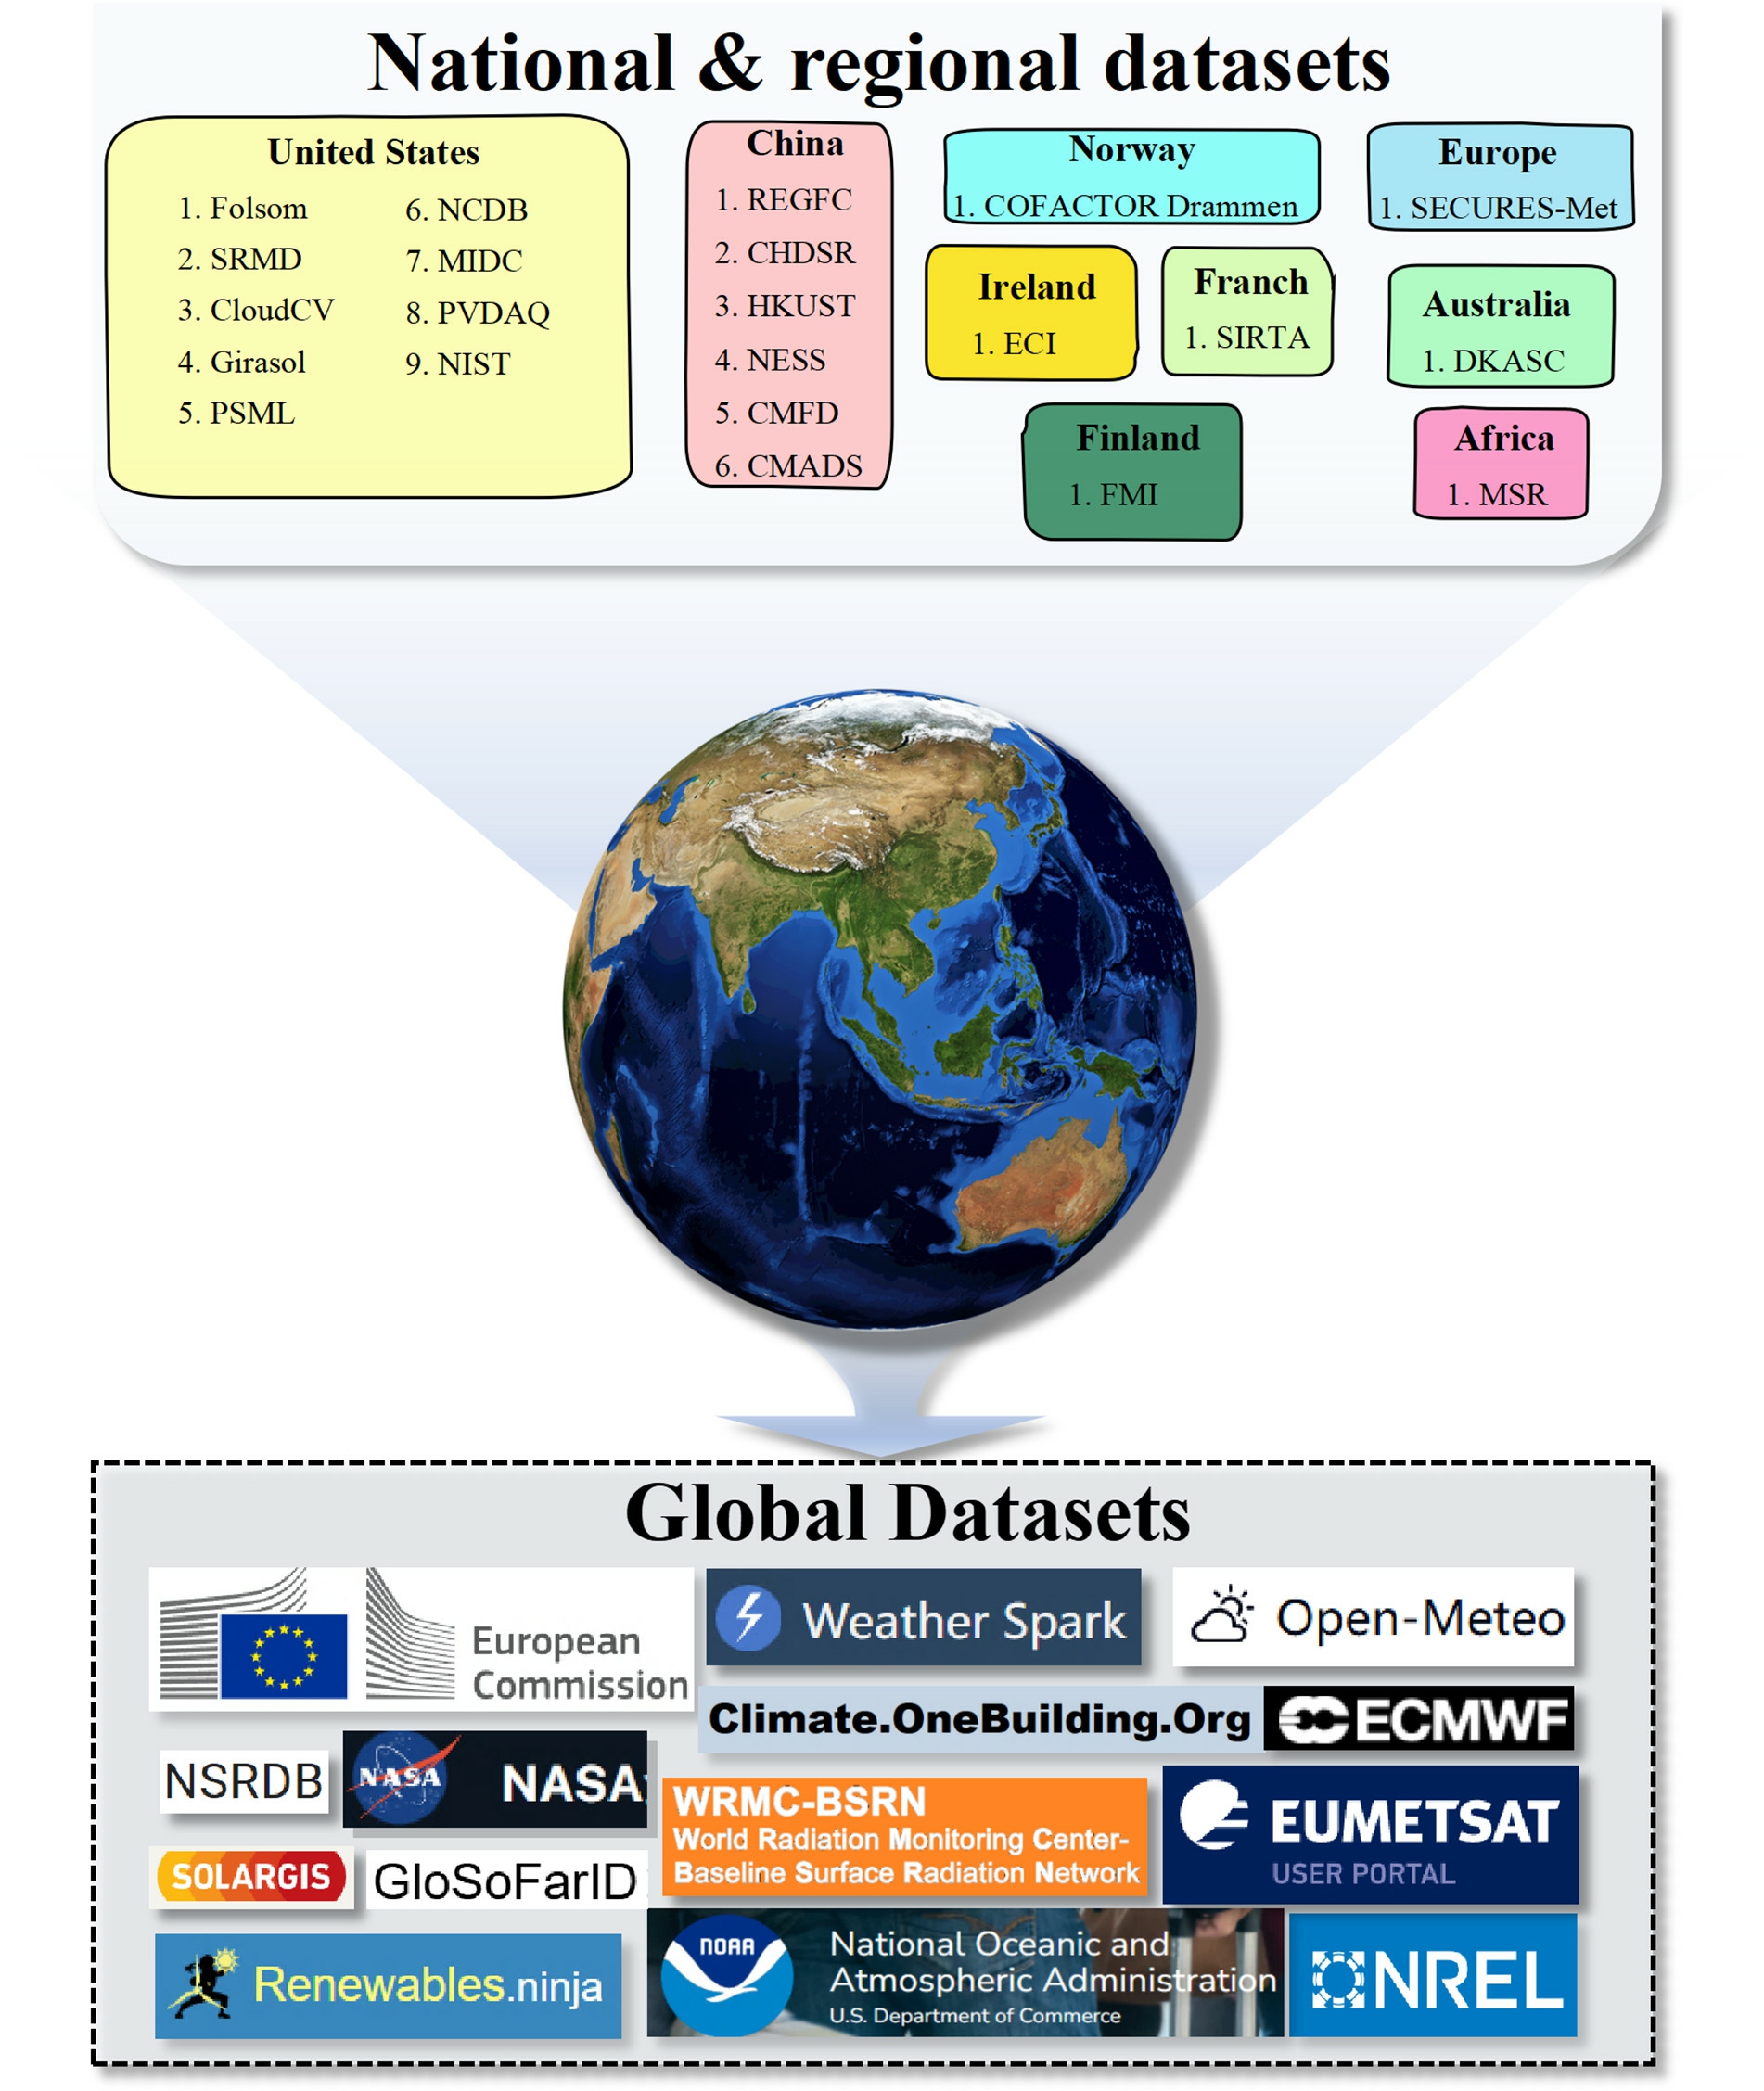
Fig. 2. Meteorolo gical datasets.
1) NSRDB [29]

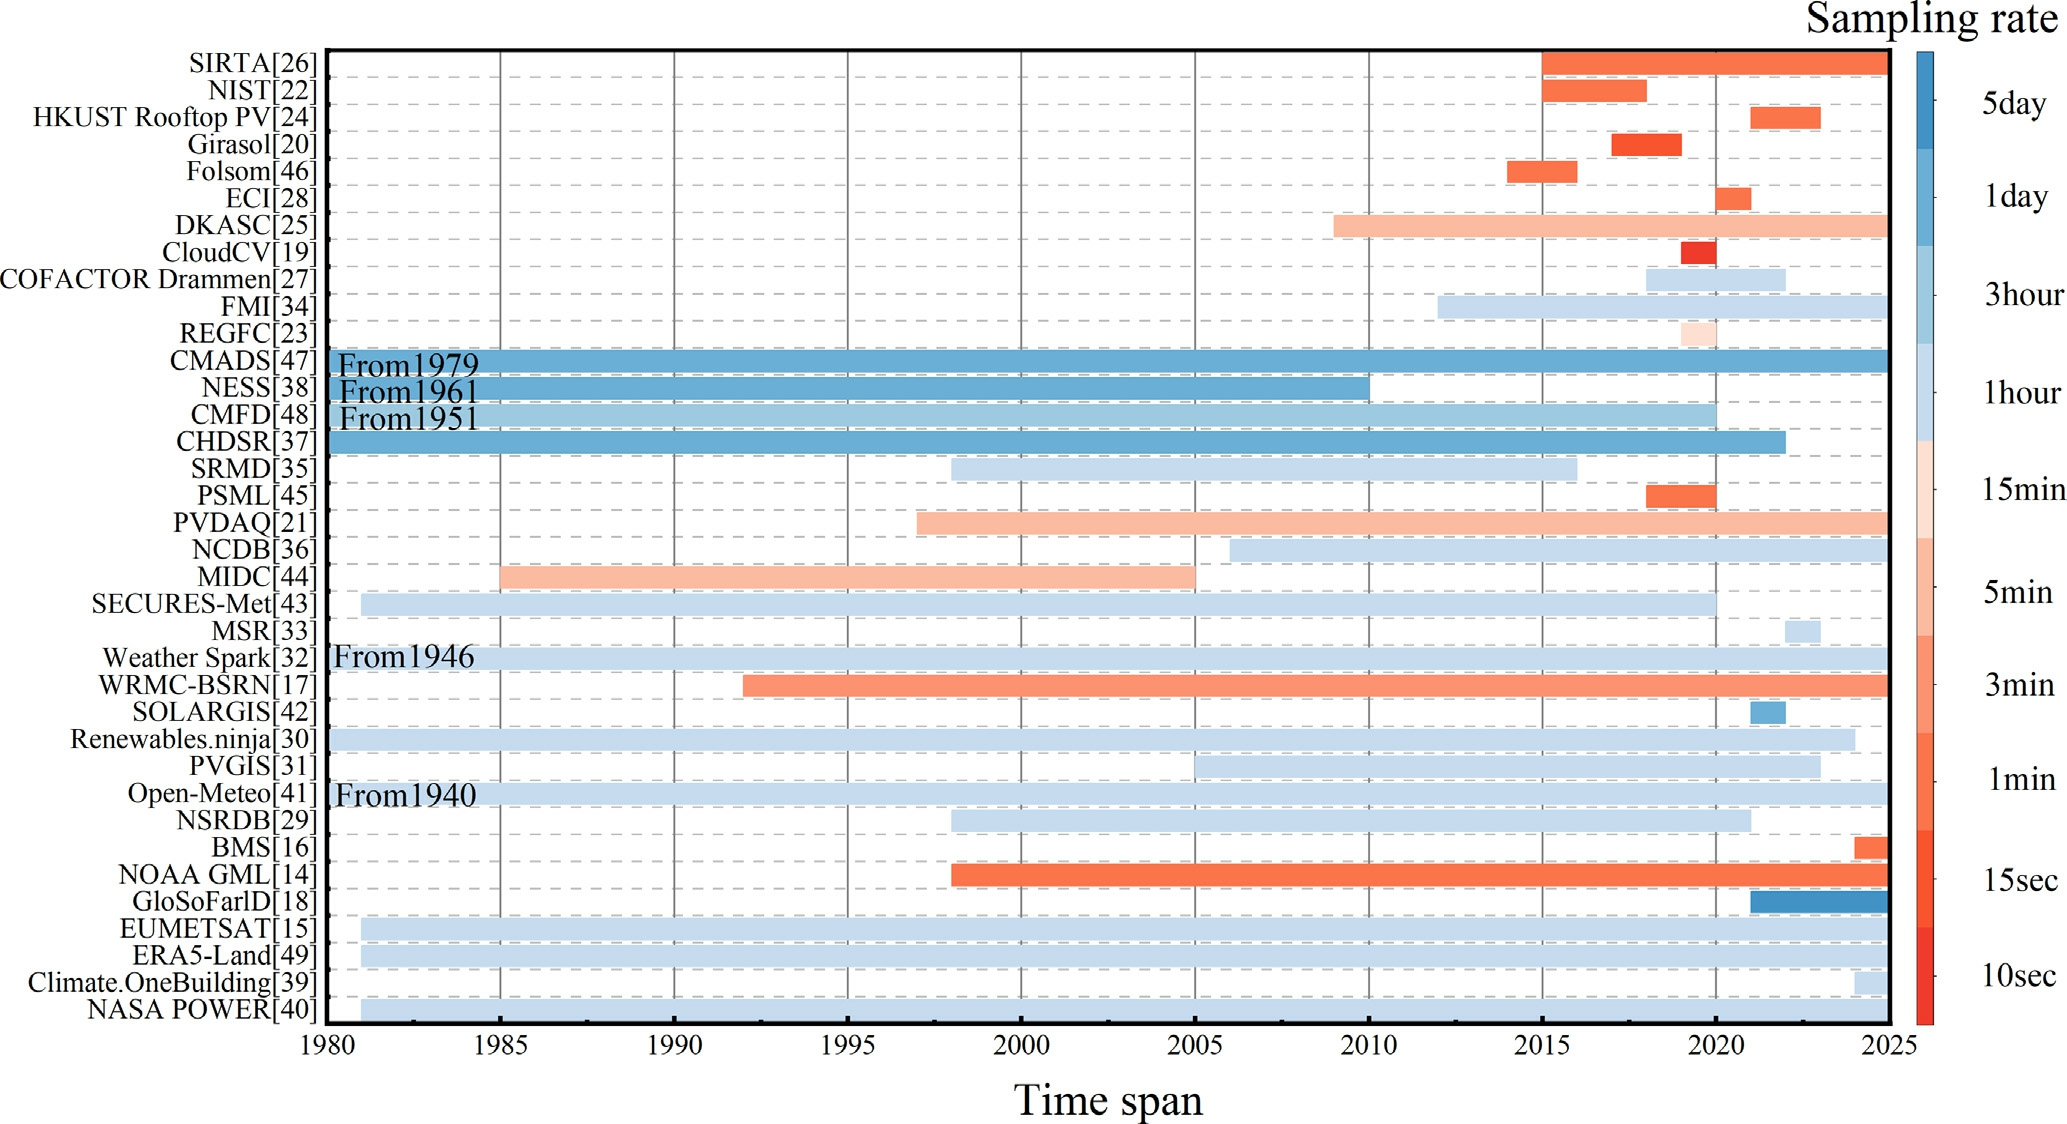
Fig. 3. Meteorological datasets (The resolutions shown in the figures are the minimum resolutions provided by this dataset).
The National Solar Radiation Database (NSRDB),developed by NREL, couples geostationary satellite imagery (e.g., GOES) with NASA MERRA-2 parameters via the Physical Solar Model (PSM V3) and SUNY models.This mechanism yields continuous meteorological profiles with a spatiotemporal resolution of up to 5 min and 2 km across multiple continents. Consequently, its validated wide-area coverage establishes the dataset as an authoritative benchmark for global PV resource assessment, strategic system planning, and regional-scale spatial modeling[77–79].
2) Renewables.ninja [30]

Renewables.ninja operates as an interactive simulation engine rather than a traditional static database, processing NASA MERRA-2 atmospheric variables and EUMETSAT satellite irradiance via the Global Solar Energy Estimator. By simulatinguser-customizedhourlyPVgenerationprofilesbased on specific geographic and technologi cal inputs,this dynamic generation capability parameterizes regional PV system modeling and macroscopic grid-level energy planning[80–82].
3) PVGIS [31]

The Photovoltaic Geographical Information System(PVGIS), developed by the European Commission’s JRC, constructs standardized Typical Meteorological Year datasets tailored for PV design and building simulations. Adhering to the ISO 15927-4 standard, it generates a representative full year of hourly meteorological data for any global coordinate by integrating regional databases, including EUMETSAT SARAH (Europe/Africa), NSRDB (Americas), and ERA5 (highlatitudes). By applying inclined-plane transposition algorithms and the Huld performance model to these integrated inputs, this API-accessible framework synthesizes generation profiles specifically for assessing regional yield potential [83–85].
4) Weather Spa rk [32]

The Weather Spark platform distills long-term global weather data (1980–2024) into accessible statistical distributions by processing ground-based temperature observations and NASA MERRA-2 parameters through the International Standard Atmosphere model. By distilling long-term meteorological time-series into accessible statistical distributions, this resource serves as a macroscopic benchmark for evaluating pre-deployment PV energy yields and long-term system reliability across diverse climatic zones [86,87].
1.5 Synthetic datasets: regional/national scale
1) MSR [33]

The Model Supply Regions (MSR) dataset for Africa fuses meteorological data from Global Solar and Wind Atlases with comprehensive geospatial infrastructure records. By overlaying these resource profiles with socioeconomic constraints (e.g., terrain slopes, land-use, population densities, transmission networks), these technoeconomically processed layers parameterize large-scale grid integration modeling and regional PV forecasting architectures [88,89].
2) FMI [34]

The Finnish Meteorological Institute (FMI) is tailored for Northern European research. It integrates observations from ground stations, pyranometers, and wind profilers with EUMETSAT ice and snow imagery. These multi-source inputs are synthesized using the HARMONIE-AROME (MEPS) regional model and ECMWF global framework, followed by statistical postprocessing. By capturing high-latitude climate dynamics,the dataset uniquely enables the analysis of PV performance and degradation under severe sub-arctic winter conditions, specifically regarding snow accumulation and extreme low temperatures [90,91].
3) SRMD [35]

The Solar Resource Maps and Data (SRMD), developed by NREL, merges GOES satellite imagery, NASA MERRA-2 data, and Digital Elevation Models through the Physical Solar Model (PSM V3.0). Resolving annual and monthly GHI and DNI at a 4-km spatial resolution across the US, this vectorized geographic repository constrains macroscopic energy system planning and regional PV potential modeling [92–94].
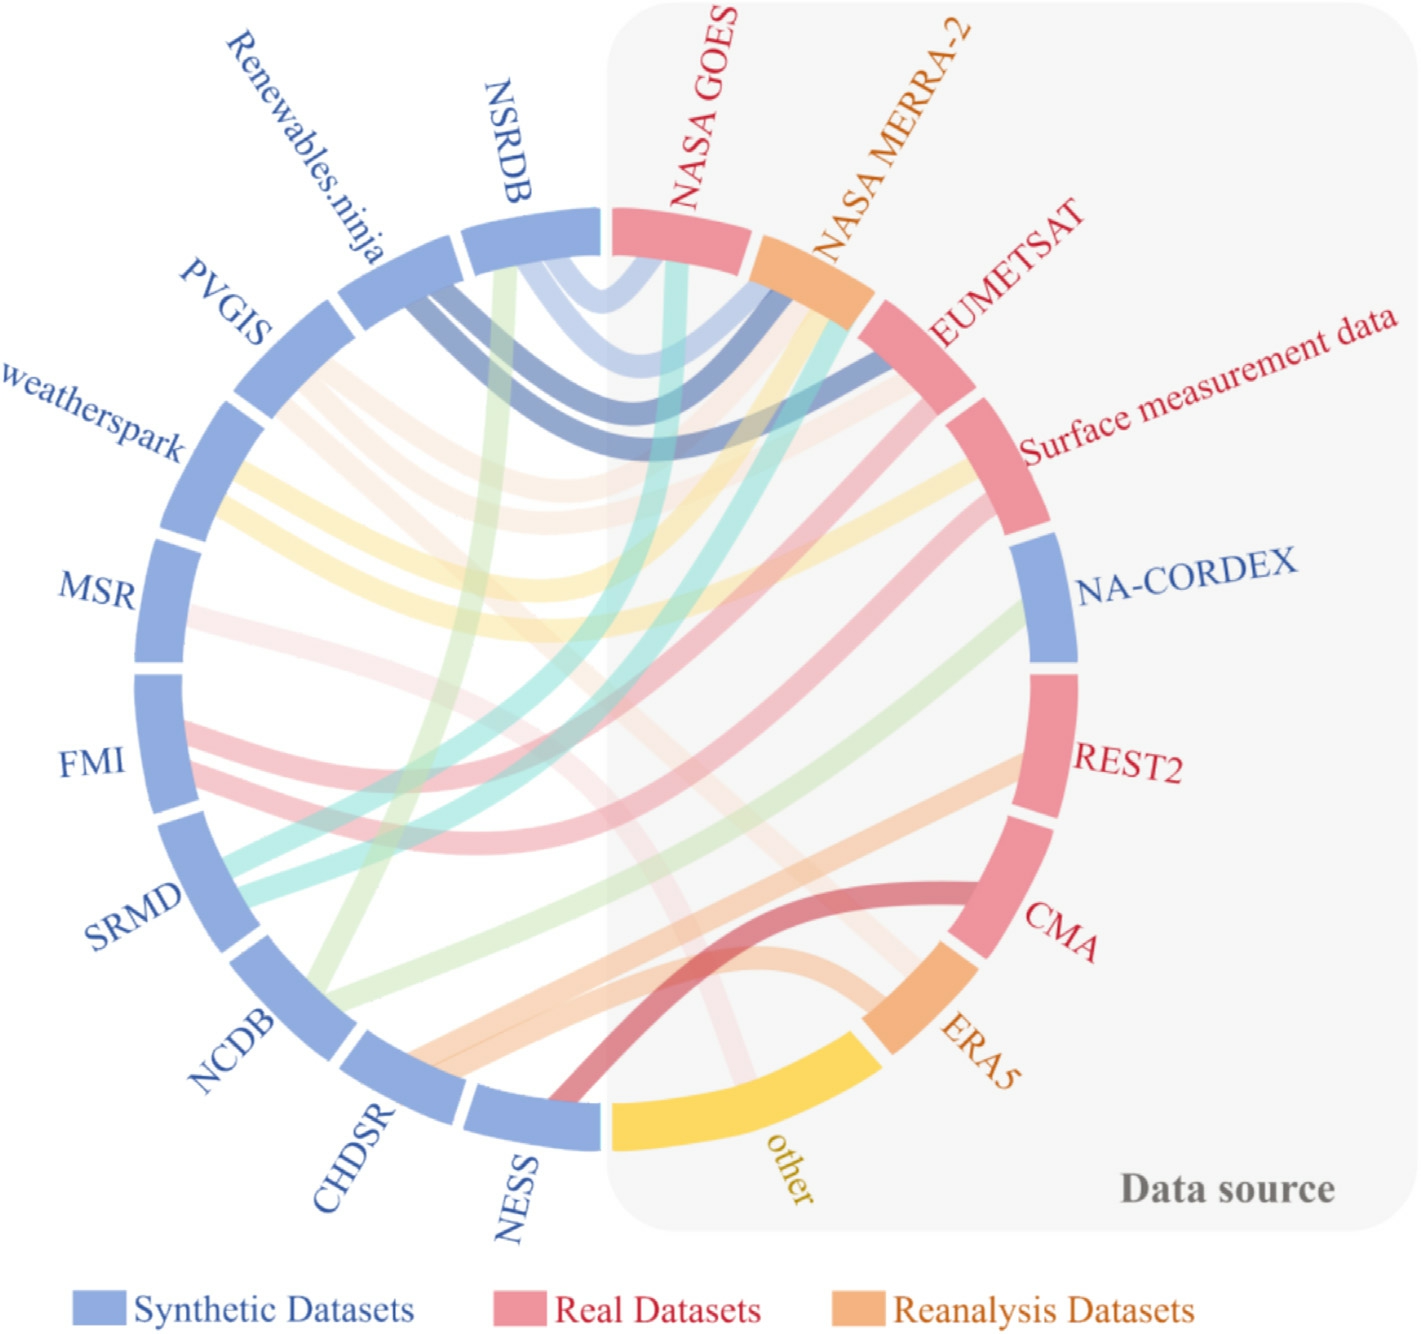
Fig. 4. Sources of synthetic datasets.
4) NCDB [36]

The National Climate Database (NCDB), developed by NREL, projects century-scale renewable energy scenarios by integrating NA-CORDEX models (e.g., CanRCM4)with historical NSRDB observations using dynamical evolution and statistical downscaling. Outputting biascorrected irradiance parameters (GHI, DNI, DHI), this high-resolution repository explicitly parameterizes the impact of long-term climate change on regional PV generation and system reliability forecasting [95–97].
5) CHDSR [37]

The Daily Surface Solar Diffuse Radiation Dataset in China (CHDSR) extracts 10-km resolution daily diffuse radiation profiles (1980–2022) by applying an ensemble framework, reconciling REST2 clear-sky estimates with machine-learning-refined cloud dynamics, to ERA5 and MERRA-2 inputs. By isolatin g the diffuse irradiance component, these profiles calibrate PV system performance models and forecasting algorithms under China’s diverse atmospheric turbidity conditions[98].
6) NESS [38]

The Daily Average Solar Radiation Dataset from 716 Meteorological Stations in China (NESS), provided by the National Earth System Science Data Center, maps a half-century (1961–2010) of daily radiation profiles alongside precise geographic coordinates. Utilizing Artificial Neural Network and Yang hybrid models, it calibrates routine China Meteorological Administration observations to benchmark long-term climate trends and validate satellite-derived PV forecasting inputs across diverse topographies [99–101].
1.6 Hybrid datasets: global scale
Hybrid datasets construct heterogeneous frameworks by integrating empirical in-situ observations with synthetically generated meteorological models.
1) Climate.OneBuilding.Org [39]

The Climate.OneBuilding.Org repository standardizes meteorological profiles by fusing NOAA empirical records with ECMWF ERA5 reanalysis data. Incorporating specialized regional datasets (e.g., CSIRO, CWEC) and future climate projections, this unified multimodal archive directly pa rameterizes long-term PV performance evaluation and building energy co-simulation [102,103].
2) NASA POWER [40]

The NASA Prediction of Worldwide Energy Resources(NASA POWER) project synthesizes satellite-derived observations and atmospheric reanalysis models to provide over 300 distinct solar and meteorological parameters globally. By offering highly customizable formats and spatiotemporal resolutions, the platform effectively translates raw planetary observations into actionable engineering inputs.This flexibility establishes it as a critical foundation for comprehensive PV system performance assessments and global infrastructure planning [104,105].
3) Open-Meteo [41]

The Open-Meteo API operates as a dynamic data aggregator rather than a static archive, orchestrating numerical weather prediction models (e.g., DWD, NOAA)to deliver low-latency historical and real-time meteorology. Achieving 1–2 km resolution ac ross the US and Europe(11-km globally),this multi-model architecture powers real-time distributed energy management and dynamic PV forecasting [106,107].
4) SOLARGIS [42]

The SOLARGIS is an industrial-grade global dataset providing over 30 years of solar and meteorological data that covers 99% of the global population. It distinguishes itself through extreme granularity, achieving a spatial resolution of up to 250 m and minute-level temporal fidelity.Validated across more than 1500 global ground stations,the platform serves as a highly reliable benchmark for minimizing uncertainty in large-scale resource assessment and long-term system performance optimization[108,109].
1.7 Hybrid datasets: regional/national scale
1) SECURES-Met [43]

SECURES-Met is an open-access meteorologicaldataset engineered to model the power supply and demand dynamics of the European grid. It aggregates highresolution data (up to 1 km) into NUTS regions, balancing localized fidelity with computational efficiency. The dataset synthesizes historical ERA5 reanalysis (1981–2020)with CMIP5 EURO-CORDEX climate projections(1951–2100) across RCP4.5 and RCP8.5 scenarios. It further converts raw environm ental variables—including wind and hydropower—directly into generation profiles.This dual temporal scale directly parameterizes largescale energy models and benchmarks grid resilience under evolving climate scenarios [110,111].
2) MIDC [44]

The Measurement and Instrumentation Data Center(MIDC) is an NREL-hosted dataset aggregating highfrequency, near-real-time observations and historical data from ground stations across the United States and international sites. It delivers 1-minute resolution irradiance profiles (GHI, DNI, and DHI) paired with sensor metadata(e.g., tilt and azimuth), while featuring built-in analyt ical tools for clear-sky estimation and solar position calculation. As a source of low-latency, ground-truth data, the dataset serves as a definitive benchmark for analyzing intra-hour solar variability and validating high-frequency solar resource models [112,113].
3) PSML [45]

The PSML dataset, developed by Texas A&M University, is an open-access, multi-scale repository designed for machine learning applications in decarbonized grids. Generated via a Transmission and Distribution co-simulation framework, it synchronizes meteorological data with load profiles, renewable generation, and voltage/current measurements. Capturing grid dynamics from minute-level trends down to millisecond-level electromagnetic transients, this multi-scale repository directly trains AI architectures to manage weather-driven volatility within renewable-heavy PV forecasting models.
4) Folsom [46]

The Folsom dataset is an open-access multimodal repository comprising three years (2014–2016) of 1-minuteresolution observations from California. It explicitly synchronizes high-frequency meteorological data with groundbased s ky imagery to provide paired visual and radiometric inputs. Equipped with standardized baseline models and evaluation frameworks, the collection establishes a rigorous benchmarking environment for deep learning tools targeting ultra-short-term multimodal modeling [114,115].
5) CMADS [47]

The China Meteorological Administration Data Service(CMADS) centers on CMA-RA V1.5, a global threedimensional atmospheric reanalysis dataset featuring a 10-km horizontal resolution and hourly profiles. It reconstructs global atmospheric states from the surface to a 55-km altitude since 1979, synthesizing 204 distinct variables(e.g., geopotential height, temperature, and wind fields)via advanced data assimilation.This native data infrastructure provides a physically consistent foundation for training large-scale AI weather models and conducting regional solar resource assessments within the Chinese context [116].
6) CMFD V2. 0 [48]

The China Meteorological Forcing Dataset (CMFD)v2.0, jointly developed by the Chinese Academy of Sciences and Tsinghua University, is a regional repository spanning 70 years (1951–2020) with a 0.1°spatial and 3-hour temporal resolution across mainland China and adjacent territories. It fuses ERA5 reanalysis with station observations via AI techniques to optimize shortwave and longwave radiation fluxes, explicitly correcting data shifts caused by station relocations to ensure long-term consistency. These bias-corrected variables parameterize climate change analysis and drive the assessment of longterm atmospheric impacts on regional solar yield.
1.8 Reanalysis datasets
Reanalysis datasets assimilate historical observations into fixed numerical weather prediction models to generate time-continuous, spatially complete, and physically consistent climate records. Unlike purely synthetic data, these products approximate physical processes while maintaining the spatiotemporal integrity of empirical measurements.
1) ERA5-Land [49]

The ERA5-Land dataset, released by the Copernicus Climate Change Service and the European Centre for Medium-Range Weather Forecasts, is a global landsurface climate reanalysis repository. It operates as an enhanced-resolution replay of the ERA5 land component,delivering hourly records from 1950 to the present at a 9-km spatial resolution and encompassing over 200 surface energy variables (e.g., 2-meter temperature, multi-layer soil moisture,and radiation fluxes).This rigorous physical consistency across complex terrains establishes the dataset as a vital input for large-scale solar simulations and regional resource assessments [117,118].
1.9 Review
This section reviews the meteorological datasets critical for PV system modeling and forecasting. Empirical repositories (e.g., NOAA GML, EUMETSAT) provide critical ground-truth baselines but suffer from sparse spatial coverage. Conversely, synthetic datasets (e.g., NSRDB, PVGIS)leverage numerical models to offer wide-area continuity,yet inherently struggle to capture local weather anomalies.Bridging this gap, Hybrid and reanalysis datasets (e.g.,NASA POWER, ERA5-Land) assimilate empirical observations into numerical weather prediction frameworks.This integration ensures the physical consistency and spatiotemporal continuity required for both macroscopic grid planning and localized assessments. Ultimately, dataset selection must align with the specific application scale, as the quality of these environmental drivers directly dictates the accuracy of subsequent PV generation profiles.
2 PV generation datasets
Historical PV generation data constitutes the groundtruth time series for training and validating forecasting models. The utility of these records relies on their integration with static system metadata to define the physical constraints of the energy conversion process. Furthermore,their spatiotemporal resolution directly dictates the applicable forecasting horizons. Accordingly, this section categorizes prominent public PV datasets by temporal resolution and application domain.The comprehensive specifications of these datasets are summarized in Table. 2 and the resolutions of the datasets are shown in Fig. 5.
2.1 Low-resolution datasets
1) LBNL [119]

The Lawrence Berkeley National Laboratory (LBNL)dataset aggregates 12 years (2012–2024) of solar capacity and generation records across U.S. Regional Transmission Organizations, Independent System Operators, and Balancing Authorities. Disaggregating data into utilityscale (>1MW) and distributed (<1MW) systems alongside cumulative capacity metadata, this repository directly normalizes generation profiles against infrastructure growth to parameterize regional grid modeling and inter-regional system value assessments [134,135].
2) Ember [120]

The Ember Solar Power Dataset is a global statistical repository tracking PV generation (in TWh) across over 200countries and regions from 1965 to the present.It synthesizes and standardizes records from the Energy Institute’s Statistical Review of World Energy to provide absolute generation figures alongside per capita consumption and solar power’s share in the primary energy mix. This macro-level perspective ena bles researchers to analyze global energy transitions,assess regional developmental potential,and validate international decarbonization strategies[136,137].
3) EWCI [121]

The Extreme Weather Impacts on Utility-Scale Photovoltaic Plant Performance (EWCI) dataset, curated by the U.S. Department of Energy, quantifies the resilience of large-scale PV systems under acute adverse events. It synchronizes generation profiles from multiple utility-scale plants with site-level meteorological records specifically during extreme weather conditions, including hail, gale-force winds, heavy snow, and thermal stress. By isolating performance degradation during these envi ronmental anomalies,the collection establishes a critical foundation for reliability-centered PV forecasting and the modeling of generation drops under extreme weather scenarios[138,139].
2.2 Medium-resolution datasets
1) 1/8°[122]

The 1/8°Hourly Wind and Solar Generation Profile Dataset is a model-driven repository covering the contiguous United States. It simulates hourly generation by applying regional atmospheric model outputs to standardized power plant configurationswithineach1/8° 1/8°grid cell.Thecollection spans historical records (1980–2022) and future climate scenarios (2020–2099), integrating surface-level solar irradiance with wind profiles at multiple hub heights (80 m,100 m, 125 m). These continuous synthetic profiles parameterize prospective site evaluations in style="font-size: 1em; text-align: justify; text-indent: 2em; line-height: 1.8em; margin: 0.5em 0em;">2) EIA [123]

The U.S. Energy Information Administration (EIA)RenewableEnergyDataset isagrid-levelrepositoryintegrating PV generation records with wind, hydroelectric, and geothermal metrics. It tracks multi-dimensional economic and system indicators, including cumulative installed capacity, international trade flows, and the Levelized Cost of Energy, across annual series dating back to 2001, supplemented by monthly summaries and real-time hourly grid monitoring. T his fusion of macroscopic infrastructure costs and generation profiles directly calibrates PV system capacity modeling and benchmarks federal and state renewable energy policies[140–142].
3)C3S Ener gy [124]

The European Climate-Driven Datasets for Energy(C3S Energy) is a continental-scale repository tracking PV generation, wind power, hydroelectric inflows, and thermal demand across the EU27, the UK, and the Balkans. It integrates historical records since 1940 with climate projections extending to 2100 under diverse emission scenarios. This country-level aggregation and exceptional temporal depth enable researchers to model long-term PV performance under climate change and assess the resilience of continental energy-mix transitions [143–145].
4)ReEDS [125]

The 2024 County-level Hourly Renewable Energy Capacity Factor Dataset, developed by NREL for the Regional Energy Deployment System (ReEDS), provides hourly capacity factors for every U.S. county across 15 meteorological years (2007–2013, 2016–2023). It incorporates three distinct land-use scenarios (Open, Reference,and Limited) to define the geograp hical and regulatory constraints for utility-scale and distributed solar deployment.This multi-technology framework directly drives largescale capacity expansion modeling and parameterizes high-penetration PV grid impacts[146].
5) CURVE [126]

The U.S. Utility-Scale Photovoltaics Supply Curve(CURVE) dataset, released by NREL, profiles approximately 60,000 potential utility-scale sites across the United States. It integrates hourly PV generation records with critical economic metrics (levelized cost of energy andlevelized cost of transmission) and incorporates geospatial exclusion layers to define environmental and regulatory constraints. This explicit formulation of techn ical potential and economic costs benchmarks large-scale deployment feasibility and constrains economically-informed PV grid integration modeling.
6) GODEEEP-solar [127]

The Global Hourly Capacity Factors and Validation Dataset for Utility-Scale PV Plants (GODEEEP-solar) is a global repository designed for large-scale solar simulation and power system analysis. Structurally divided into two components, the Profiles module delivers hourly capacity factors paired with 2020 plant configuration metadata, while the Validation module supplies empirical measurements for algori thmic verification. This dualmodule architecture addresses the scarcity of groundtruth data in global modeling, enabling researchers to develop machine learning-driven PV generation models backed by rigorous physical consistency and empirical validation.
7) Other datase ts Note that several datasets (e.g., Renewables.ninja,PVGIS, MSR, and COFACTOR Drammen) also integrate power generation records with meteorological parameters. Section 2 previously analyzed these resources as environmental drivers; therefore, they are cross-referenced he re to avoid redundant technical exposition.
2.3 High-resolution datasets
1) SKIPP’D [128]
The Sky Images and Photovoltaic Power Generation Dataset (SKIPP’D), released by Stanford University, is a multimodal repository targeting cloud dynamics and ultra-short-term forecasting. It synchronizes 1-minute high-resolution fish-eye sky imagery with power output from a 30-kW rooftop array, where a minimal 125-meter spatial offset between the camera and the panels ensures strong physical coupling between cloud motion and power fluctuations. Supplemented by camera calibration and array specification metadata, these tightly coupled visual and electrical profiles establish a rigorousenvironment for training deep learning models in cloud segmentation, motion prediction, and intra-hour forecasting [147].
Table 2. PV generation datasets.
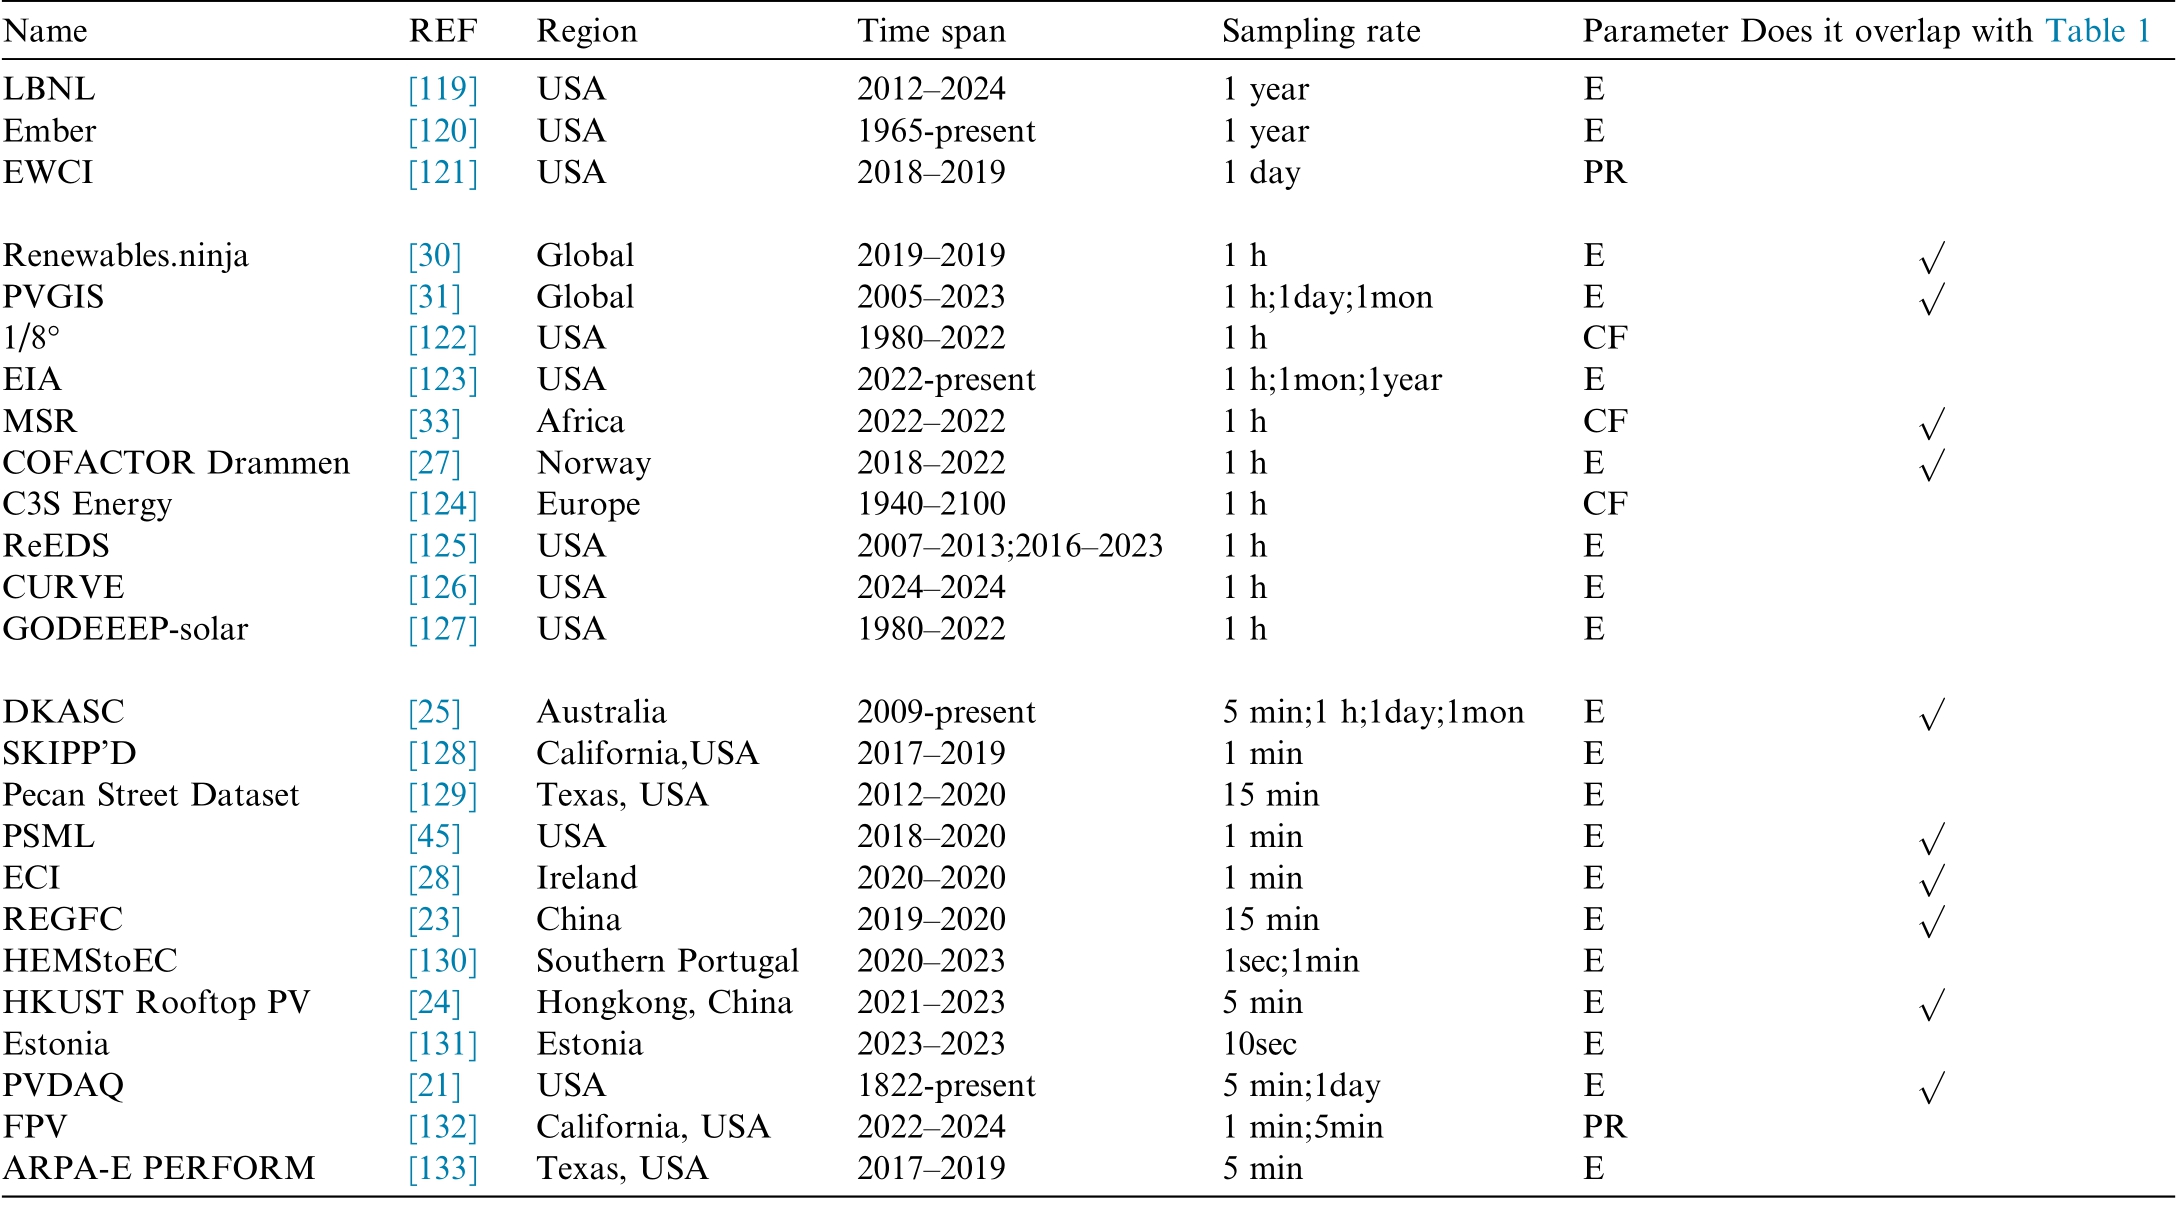
E=’Electricity generation’, CF=’Capacity factor’=Actual power generation / theoretical maximum power generation, PR=’Photovoltaic power generation performanc e ratio’=Actual output level / Expected output level under current lighting conditions.
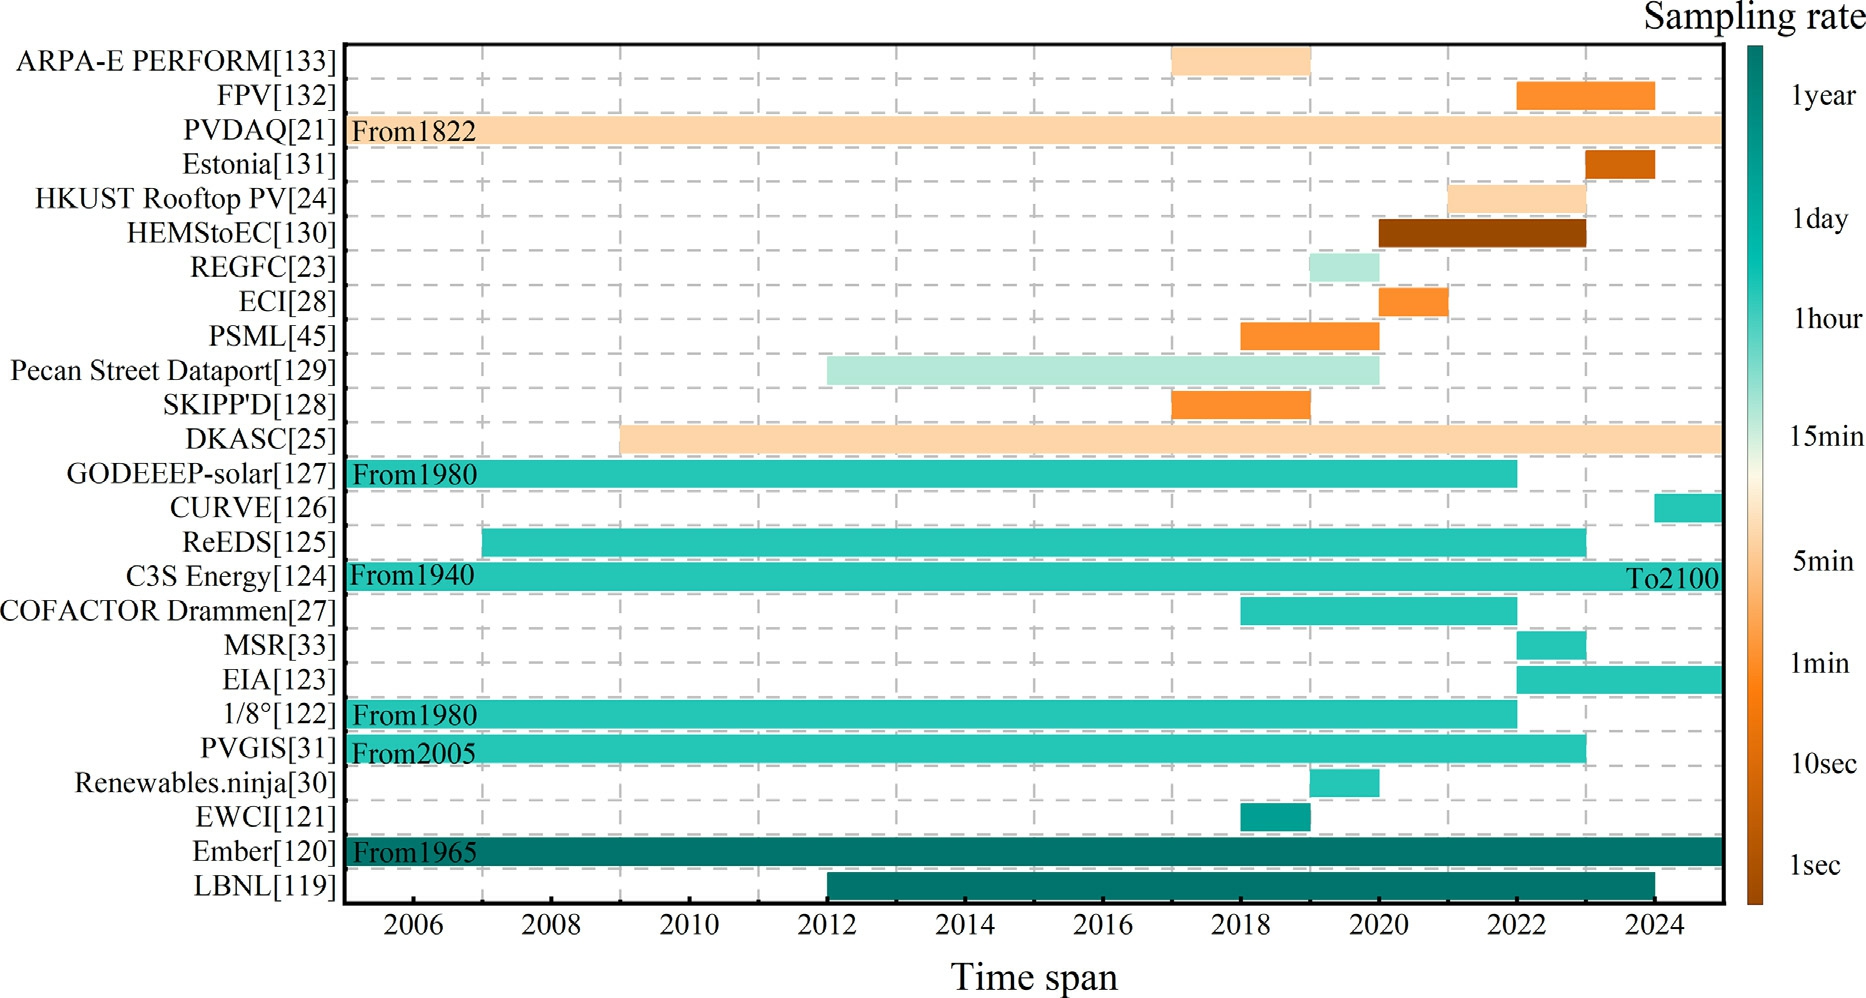
Fig. 5. PV generation datasets (The resolutions shown in the figures are the minimum resolutions provided by this dataset).
2) Pecan Street Dataport [129]

The Pecan Street Dataport is an empirical repository focusing on residential energy dynamics and behind-themeter interactions. It provides circuit-level PV generation and consumption profiles from over 1000 households across diverse climatic regions (e.g., Texas, California,New York). The platform delivers synchronized records at multi-tier intervals (1-s, 1-min, 15-min) alongside 2-kHz high-frequency waveform data for electromagnetic transient analysis. This integ ration of high-frequency time-series with comprehensive metadata (e.g., household demographics, building envelopes, and array configurations) enables researchers to model residential demand elasticity,optimize load control,and analyze decentralized PV integration [148].
3) HEMStoEC [130]

The HEMStoEC (From Home Energy Management Systems to Energy Community) dataset is an opensource repository targeting the synergistic optimization of smart homes and energy communities. It synchronizes high-frequency PV generation records with residential baseloads, energy storage states, and bidirectional grid interactions to capture distributed energy volatility and demand elasticity. Coupled with device specifications and community network topologies, this household-tocommunity linkage establishes a granular foundation for decentralized PV system modeling and the training of short-term forecasting algorithms tailored for peer-topeer energy networks [149,150].
4) Estonia [131]

The Estonia Residential PV and Consumption Dataset,released by Tallinn University of Technology, provides 10-second monitoring records from a DC nanogrid-equipped residence in a high-latitude region throughout 2023. It integrates real-time PV generation with bidirectional power flows and Battery Energy Storage System operations, explicitly capturing the system’s droop control characteristics. This high-frequency telemetry benchmarks PV generation forecasting under extreme low-irradiance conditions and constrains the small-signal stability modeling of decentralized DC microgrids [151,152].
5) FPV [132]

The High-Resolution Floating Photovoltaic (FPV)dataset, jointly developed by the Florida Solar Energy Center and NREL, provides over two years of 1-minuteresolution monitoring data from four water-based PV installations in California and Florida, alongside a colocated land-based reference system. It integrates realtime PV generation with localized water-surface meteorological records and high-precision readings from 15 module temperature sensors per site, supplemented by metadata on inverter configurations and mooring architectures. This precise characterization of the water-surface thermal environment enables researchers to model environmental coupling and train site-specific machinelearning forecasting algorithms that account for waterdriven cooling effects [153].
6) ARPA-E PERFORM [133]

The ARPA-E PERFORM dataset, curated by the U.S.Department of Energy, is a stochastic benchmark capturing the inherent variability and uncertainty of solar generation, wind power, and electrical load. It strictly preserves spatiotemporal correlations from sub-hourly to annual scales, coupling PV generation records with synthetic grid topologies, nodal specifica tions, and probabilistic forecast outputs. This explicit parameterization of grid constraints and systemic uncertainty enables researchers to develop probabilistic PV forecasting architectures and model risk-aware system dispatch [154,155].
7) Other datase ts
Several datasets (e.g., Pecan Street Dataport, PSML,ECI, REGFC, HKUST Rooftop PV, and PVDAQ) also integrate power generation records with meteorological parameters. Section 2 previously analyzed these resources as environmental drivers; therefore, they are crossreferenced here to avoid redundant technical exposition.
2.4 Review
This section classifies PV generation datasets by temporal resolution and application domain. Low-resolution repositories (e.g., LBNL, Ember) track macroscopic energy transitions and infrastructure growth but cannot capture intra-hour volatility or transient grid fluctuations.Medium-resolution collections (e.g., EIA, ReEDS) provide hourly profiles for grid-level dispatch and capacity expansion modeling, yet lack the sub-minute fidelity required for advanced deep learning architectures. High-resolution datasets (e.g., SKIPP’D, Pecan Street Dataport) deliver high-frequency empirical records to drive ultra-shortterm forecasting and multimodal cloud-dynamics analysis.Consequently, dataset selection must strictly align with the target forecasting horizon. Moreover, the predictive modeling capacity of these time-series fundamentally depends on corresponding static metadata to provide the physical context for interpreting environmental responses.
3 Static system parameters
Static system parameters establish the physical framework for high-fidelity PV forecasting and system simulation by defining the geospatial attributes and hardware topologies of power plants. Critical parameters, including geospatial coordinates, rated capacity, module specifications, and temperature coefficients, map transient meteorological drivers to PV generation outputs and govern intrinsic energy loss mechanisms. Consequently, this static metada ta provides refined boundary conditions for analytical models and injects physical prior knowledge into datadriven architectures, ultimately enhancing model generalization across diverse spatiotemporal scales. The comprehensive specifications of these datasets are summarized in Table. 3.
3.1 Site-level geospatial and scale datasets
1)UKPVGeo [11]
The United Kingdom PV Geography (UKPVGeo)dataset, jointly developed by Queen Mary University of London, the Alan Turing Institute, and Open Climate Fix, catalogues location records for over 260,000 solar PV systems across the UK. It leverages crowdsourcing to catalog previously unmonitored small-scale residential installations alongside utility-scale farms, capturing the vast majorit y of the nation’s installed capacity. These highly granular geospatial attributes directly anchor regional grid impact assessments and inform localized PV forecasting algorithms tailored to high-density distributed solar penetration [167,168].
2)USPVDB [156]
.The United States Solar PV Database (USPVDB),developed by Lawrence Berkeley National Laboratory and the U.S. Geological Survey, is a dynamically updated geospatial repository tracking utility-scale solar projects ( 1MW) across the United States. It maps precise site-level point locations and detailed boundary polygons alongside critical metadata, including gridconnection timestamps, installation architectures, tracking configurations, and land-use classifications. Delivered in Shapefile and GeoJSON formats, these explicit spatial and architectural attributes constrain macrolevel PV capacity expansion mode ling and scale largescale solar forecasting architectures alongside land-use evaluations [169].
3)Microsoft [157]
The Microsoft India Solar Dataset applies deep learning to Sentinel-2 multispectral imagery to extract the precise spatial footprints of utility-scale solar installations across India (as of 2021). It advances beyond simple point-based centroids to render full-area delineations,which are valuable for accurately estimating active aperture areas and regional shading effects. Delivered in GeoJSON format,these explicit spatial boundaries(delivered in GeoJSON)correlate land-surface occupancy with regional generation, directly calibrating large-scale solar potential modeling and satellite-derived irradiance-to-power forecasting algorithms.
4)CPVPD-2024 [158]
The 2024 China PV Power Plant Vector Dataset(CPVPD-2024), released by Beijing University of Technology, is a panel-level geospatial repository mapping approximately 4520.47 km2 of PV installations across 34 Chinese provincial regions. Applying the DSFA-SwinNet deep learning framework to high-resolution satellite imagery, it achieves a 90.38\% extraction accuracy, demonstrating exceptional sensitivity to a grivoltaic arrays and small-scale distributed plants in complex topography.These precise geographic boundaries, surface areas, and elevation metrics quantify terrain-induced irradiance variability and resolve localized shading effects within highresolution PV forecasting systems.
5)PVRDB [159]
The NREL Rooftop PV Database (PVRDB) utilizes Light Detection and Ranging telemetry to quantify rooftop PV technical potential across 128 U.S. metropolitan areas. It advances beyond 2D imagery by extracting three-dimensional structural parameters, building footprints, developable roof planes, slope, aspect, and capacity estimates, delivered in computationally effici ent Parquet format. This sub-meter vertical accuracy translates the geometric constraints of complex roofs into localized shading factors,directly refining urban distributed PV forecasting and system capacity modeling.
6)BDAPPV [160]
A crowdsourced dataset of aerial images with annotated solar PV arrays and installation metadata(BDAPPV) is a multimodal benchmark integrating approximately 28,000 high-resolution aerial images across diverse geographic and atmospheric conditions. It extracts ground-truth segmentation masks for 13,000 installations,including 8000 instances that strictly synchronize imagery,masks, and static system metadata. This deliberate inclusion of varying image qualities addresses the distribution shift challenge in computer vision, enabling researchers to model PV capacity across heterogeneous environments and extract spatial parameters for regional PV forecasting.
Table 3. PV generation datasets.
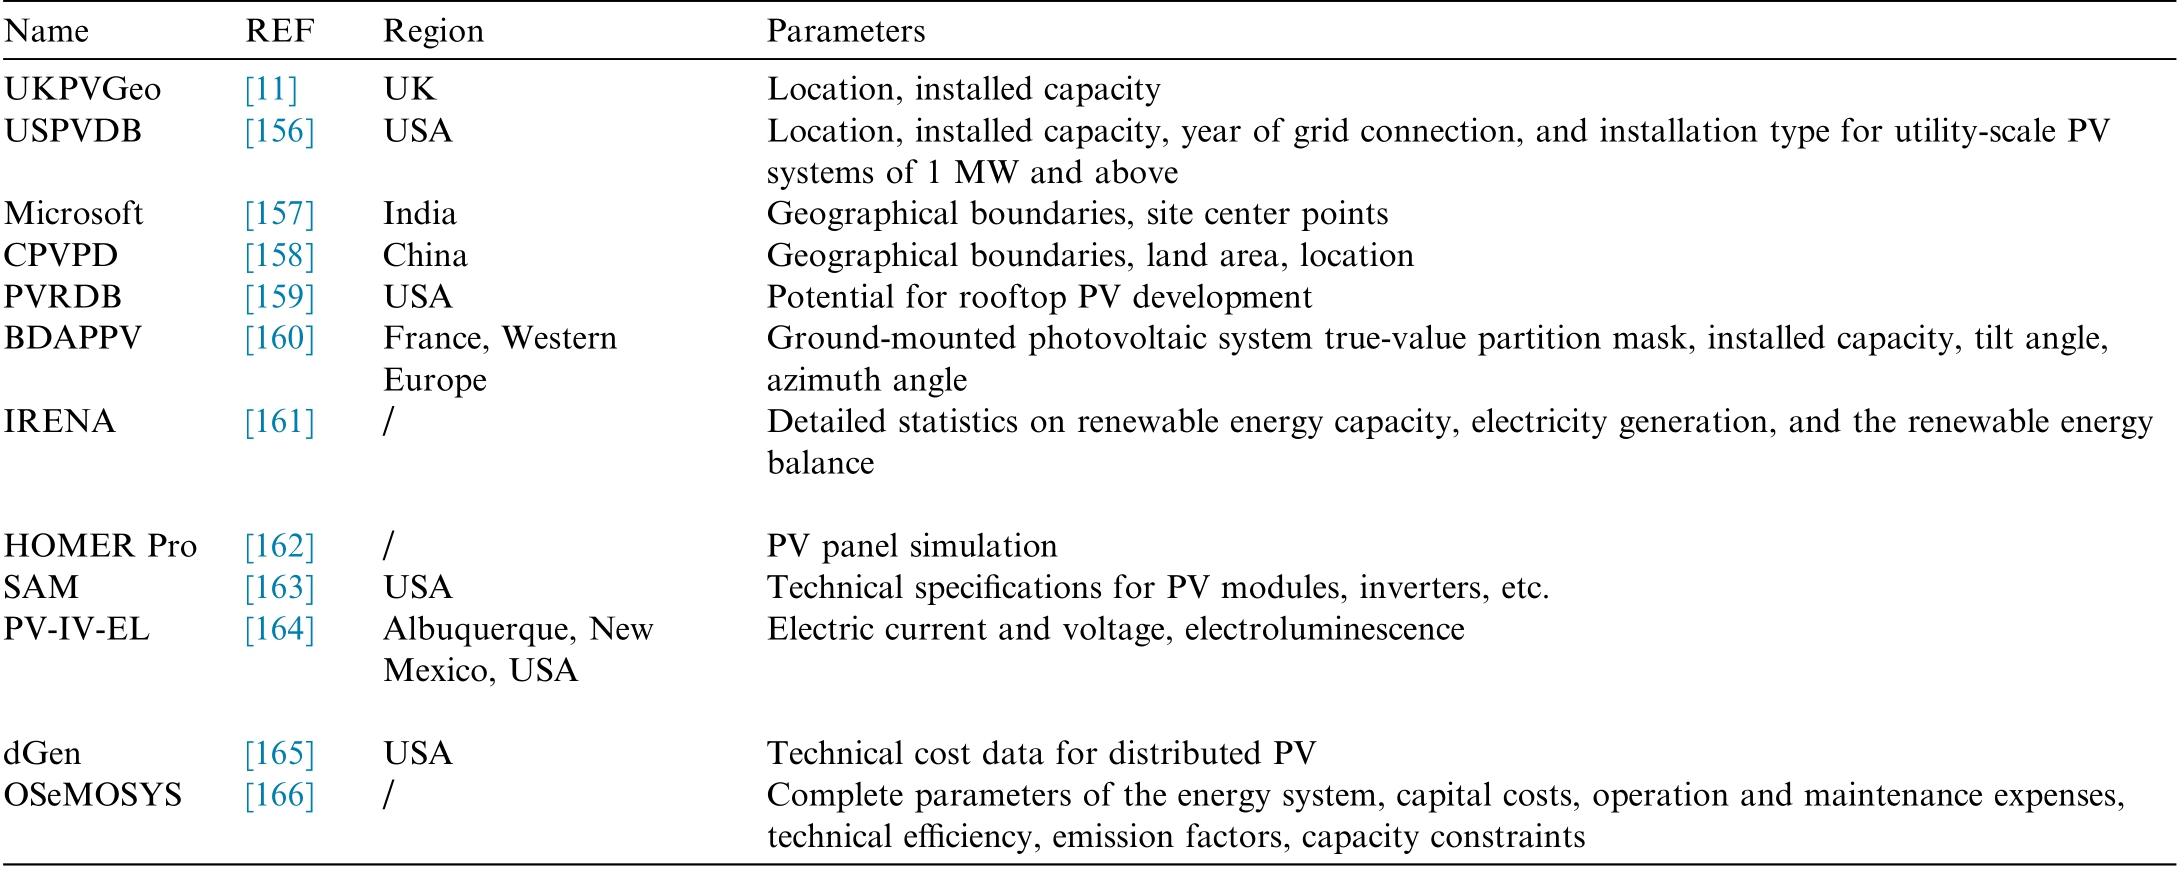
7) IRENA [161]The IRENA Renewable Energy Statistics Database,published by the International Renewable Energy Agency,tracks renewable infrastructure evolution across over 200 countries and territories, providing cumulative and incremental installed capacity (MW) records for solar and other sub-sectors. It harmonizes heterogeneous national reporting into a consistent global framework, delivering two decades of standardized historical metrics for cross-regional benchmarking. This integration of long-term capacity statistics and energy balances explicitly normalizes PV generation profiles against macro-level infrastructure growth,strictly anchoring long-term capacity expansion modeling and cross-regional PV forecasting.
3.2 Component-level physical properties and technical parameters datasets
1) HOMER Pr o [162]
The HOMER Pro Microgrid Analysis and Optimization System pro vides an exhaustive library of static hardware specifications (e.g., PV modules, inverters, and battery storage) for distributed energy resource modeling.It synthesizes these localized technical parameters with global meteorological data via NASA and NREL APIs to drive minute-level or hourly high-fidelity simulations for any global coordinate. Coupled with multi-sector load profiles, this unified techno-economic framework directly bounds microgrid system modeling with physical hardware limits and formulates site-specific inputs for PV forecasting algorithms.
2)SAM [163]
The System Advisor Model (SAM), developed by NREL, integrates high-fidelity performance modeling with financial analysis by synchronizing meteorological data(e.g., NSRDB) with an exhaustive library of hardware specifications (PV modules, inverters, and energy storage).It executes sub-hourly simulations that explicitly account for complex loss mechanisms, including self-shading, spectral effects, and temperature-induced de gradation. Coupling these physical parameters with regional incentive policies and utility rate structures, the platform strictly grounds techno-economic system modeling and quantifies physical loss factors within advanced PV forecasting architectures.
3)PV-IV-EL [164]
The Sandia PV Module I-V and Electroluminescence(EL) Dataset pairs 613 sets of current–voltage (I-V) flash tests with high-resolution EL imagery across 438 commercial modules from 17 manufacturers. Going beyond static datasheet parameters, it documents modules retrieved from field operations with up to five years of exposure to capture the dynamic physical evolution of defects. This explicit correlation between visual degradation and electrical performance loss enables researchers to mod el system degradation and parameterize health-aware constraints within long-term PV forecasting architectures.
3.3 System-level technical–economic and planning datasets
1)dGen [165]
The Distributed Generation Market Demand Model(dGenTM ), developed by NREL, applies agent-based modeling to project multi-decadal adoption pathways for distributed energy resources. It integrates high-spatialresolution building load profiles with evolving technology cost curves, utility rate structures, and geospatial potentials to simulate investment decisions across residential,commercial, and indust rial sectors at the county level or finer. By explicitly rendering these socio-economic constraints, the model directly projects long-term distributed PV market penetration and maps the spatiotemporal evolution of grid-wide generation dynamics.
2)OSeMOSYS [166]
The Open Source Energy Modelling System (OSe-MOSYS) is an open-source framework for long-term national and regional energy system planning. It spans the entire energy value chain, integrating capital costs,operation and maintenance expenses, technical efficiency metrics, and emission factors. It applies standardized availability profiles and capacity constraints to establish boundary conditions for integ rating volatile PV generation into stable long-term energy balances. This multi-decadal scenario construction directly shapes the modeling of high-penetration renewable policies and anchors the macroeconomic baselines necessary for long-term PV forecasting.
3.4 Review
Site-level geospatial resources (e.g., UKPVGeo,USPVDB, CPVPD) establish the geographic anchor by defining spatial boundaries and capacities, yet lack the granular electrical parameters to model internal conversion losses. Specialized multimodal datasets (e.g.,BDAPPV, PVRDB) extract high-resolution image features and 3D geometric metadata but rarely capture the longitudinal degradation profiles or microgrid-level economic metrics necessary for life-cycle analysis.Integrated simulation platforms (e.g., HOMER Pro, SAM) deliver component-level fidelity, utilizing exhaustive technical specifications to parameterize physical boundary conditions. Conversely, macro-system frameworks (e.g., dGen,OSeMOSYS) transform these static hardware parameters into dynamic socio-economic adoption pathways. Ultimately, comprehensive static metadata transcends mere infrastructure cataloging to become a prerequisite for physics-aware machine learning. Integrating these stabl e physical constraints with transient PV generation profiles ensures superior model generalization and enables researchers to chart robust decarbonization trajectories.
4 Data utilization for PV forecasting
4.1 Data fusion across forecasting horizons
Enhancing PV forecasting accuracy intrinsically relies on the spatiotemporal fusion of dynamic meteorological drivers, static system metadata, and historical generation profiles. Crucially, as the underlying mechan isms of irradiance shift across different horizons,capturing these distinct dynamics necessitates tailored style="font-size: 1em; text-align: justify; text-indent: 2em; line-height: 1.8em; margin: 0.5em 0em;">1)Ultra-short-term (Intra-hour) forecasting for transient cloud kinematics
Ultra-short-term forecasting delivers critical situational awareness to mitigate grid instability caused by rapid,localized irradiance fluctuations. Resolving these complex transient cloud dynamics demands the synchronized fusion of high-resolution ground-based sky images and subminute meteorological data (e.g., CloudCV, Girasol, Folsom, SIRTA) with high-frequency PV power signals(e.g., SKIPP’D, Pecan Street Dataport, HEMStoEC, Estonia, FPV). Beyond temporal alignment, spatial metadata directly translates 2D cloud motion vectors into localized shading impacts on specific PV topologies. Consequently,leveraging parameters like camera calibration matrices and spatial offsets (e.g., the 125-m baseline in SKIPP’D)facilitates precise spatial mapping and rigorous physical coupling.
2)Short-to-medium-term (intra-day to day-ahead)forecasting for downsc aling macro-climate data
Short-to-medium-term forecasting (typically 1 to 72 h ahead) supports grid and market operations by downscaling macro-scale meteorological forecasts into site-specific generation profiles. This horizon requires coupling extensive meteorological forecasts (e.g., NASA POWER,Open-Meteo, Renewables.ninja, CHDSR, NSRDB,PVGIS, MIDC) with site- or aggregate-level generation profiles (e.g., PVDAQ, REGFC, DKASC, HKUST Rooftop PV, COFACTOR Drammen). Integrating hardwarespecific constraints (e.g., inverter clipping thresholds, temperature coefficients) with geospatial metadata and component-level properties (via HOMER Pro or SAM)grounds the meteorological-to-power mapping in physical reality. This rigorous fusion helps robust feature engineering when converting plane-of-array irradiance into active power, effectively mitigating the risk of learning spurious correlations during extreme weather anomalies.
3) Long-term forecasting for assessing climate resilienc e and capacity expansion
Long-term macro-grid planning shifts the analytical focus from operational scheduling to system resilience and capacity expansion. Accounting for non-stationary climate trends and seasonal variations at this scale demands datasets with exceptional historical depth. Consequently, this horizon requires synthesizing decadal climate records (e.g., ERA5-Land, CMFD V2.0, CMADS,NCDB, SECURES-Met, MSR, SRMD) with aggregated generation statistics and capacity factors (e.g., LBNL,Ember, EIA, 1/8°datasets, C3S Energy, ReEDS, CURVE,GODEEEP-solar, IRENA, EWCI). Superimposing geospatial constraints (e.g., footprints and land-use exclusions from USPVDb, UKPVGeo, PVRDB, Microsoft India,CPVPD-2024)and techno-economic adoption pathways (e.g., dGen, OSeMOSYS) anchors these long-term projections in infrastructural realities. This multi-layered integration ensures that capacity models reflect feasible deployment limits rather than unattainable theoretical climate potentials.
4.2 Data dependencies of modeling paradigms
The The chosen modeling framework dictates the required modalities, granularity, and physical consistency of the underlying data. Classifying these models by their specific data dependencies clarifies their operational applicability and constraints.
1)Persistence models
The persistence model assumes that current conditions will remain constant, presenting the most minimal data requirements among all paradigms. As the universal baseline for ultra-short-term forecasting, it relies exclusively on recent, high-resolution observations of the target variable(e.g., 1-minute irradiance from MIDC or 10-se cond power profiles from Estonia). This paradigm eliminates the need for exogenous meteorological forecasts or multimodal inputs (e.g., sky images) and establishes baseline performance based solely on recent historical trends.
2)Physical mod els
Physical models generate predictions by applying atmospheric equations to meteorological inputs, bypassing the need for massive historical power labels. However, this paradigm is extremely sensitive to precise physical metadata and boundary conditions. These frameworks integrate standardized meteorological records (e.g., PVGIS,NSRDB) with hardware specifications from platforms like HOMER Pro and SAM. Accurate static parameter libraries (e.g., self-shadowing geometries, temperature coefficients, inverter efficiency curves) are mandatory.Without them, sub-hourly physical simulations lose bounda ry constraints and deviate severely. Furthermore,for full-lifecycle degradation modeling, empirical datasets like PV-IV-EL supply the critical health parameters required to calibrate these physical equations over multiyear operations.
3) style="font-size: 1em; text-align: justify; text-indent: 2em; line-height: 1.8em; margin: 0.5em 0em;"> id="generateCatalog_26" style="text-align: left; text-indent: 0em; font-size: 1.2em; color: rgb(195, 101, 0); font-weight: bold; margin: 0.7em 0em;">4.3 Challenges in data fusion
1) Spatio-temporal Misalignm ent
A fundamental challenge in multi-source data integration is the intrinsic scale mismatch between gridded meteorological products (e.g., ERA5-Land, NSRDB),representing kilometer-scale spatial averages, and highly localized site-level PV datasets (e.g., PVDAQ). Directly applying these macroscopic variables to predict sitespecific power inevitably smooths out critical microclimate anomalies, inducing significant predictive errors. Furthermore, attempting to resolve these misalignments through simplistic temporal upsampling or spatial interpolation frequently injects artificial noise into the training pipeline.Consequently, effectively bridging this resolution gap necessitates that future benchmarking efforts prioritize joint spatiotemporal downscaling algorithms.
2) Missing Data and Lack of Quality Control Flags
While authoritative meteorological datasets (e.g.,NOAA GML, EUMETSAT, BMS, WRMC-BSRN)maintain rigorous radiometric accuracy, many public power datasets lack transparent quality control flags to identify sensor drift, communication outages, and outlier events. Training models on unmarked hardware failures,such as zero-power readings caused by inverter trips rather than severe shading, erroneously forces algorithms to internalize these anomalies as physical weather phenomena, severely degrading g eneralization. Consequently,advancing reliable forecasting requires future datasets to strictly adhere to FAIR principles(Findability,Accessibility, Interoperability, and Reusability) by mandating standardized, multi-tier quality control protocols to explicitly decouple hardware anomalies from weather-driven fluctuations.
5 Conc lusion
High-fidelity, multi-dimensional open-access data are the cornerstones of advancing PV power forecasting, refining digital twin models, and optimizing modern power system dispatch. This paper has provided a pioneering,structured taxonomy of global open datasets, bridging the information gap between environmental drivers and system outputs. Our review systematically categorizes these resources into three pillar domains: meteorological datasets capturing multi-scale atmospheric dynamics, PV generation datasets encompassing diverse spatiotemporal resolutions, and Static system parameters defining the geospatial and physical constraints of PV infrastructure.
Beyond mere categorization, this review elucidated data utilization strategies tailored to specific forecasting horizons. We demonstrated that effective data fusion ranges from coupling sub-minute sky imagery to resolve ultrashort-term transient cloud kinematics, to synthesizing decadal climate records and socio-economic pathways for long-term capacity expansion. Furthermore, we clarified the data dependencies of diverse modeling paradigms,emphasizing that advanced style="font-size: 1em; text-align: justify; text-indent: 2em; line-height: 1.8em; margin: 0.5em 0em;">Despite the abundance of resources, significant challenges in multi-source data fusion persist,particularly spatiotemporal misalignment and the lack of transparent quality-control flags. Moving forward, future data publications must strictly adhere to the FAIR principles (Findability, Accessibility, Interoperability, and Reusability).Enhancing temporal continuity, ensuring data integrity,and providing standardized metadata with transparent anomaly labels are paramount to decouple hardware failures from weather-driven fluctuations, a prerequisite for the next generation of physics-aware machine learning.Additionally, to effectively bridge the resolution gap between macroscopic climate models and localized PV sites,future benchmarking efforts must prioritize joint spatiotemporal downscaling algorithms.
To overcome the persistent fragmentation of resources,we recommend establishing centralized indexing hubs or open-science platforms that use standardized schemas to foster cross-platform interoperability. While high-quality resources have begun to emerge, expanding coverage to underrepresented climatic zones, complex terrains, and emerging PV technologies remains a priority. The institutionalization of standardized benc hmark datasets will facilitate robust, objective, and comparable assessments of modeling methodologies, ultimately accelerating the transition of advanced forecasting technologies from theoretical innovation to large-scale industrial engineering applications.
Declaration of competing interest
The authors declare that they have no known competing financial interests or personal relationships that could have appeared to influence the work reported in this paper.
Acknowledgments
This work was jointly supported by Smart Grid-National Science and Technology Major Project (No.2025ZD0803600, 2025ZD0803601), National Natural Science Foundation of China (No. 52307133), Tianji n Metrology Science and Technology Project (No.2024TJMT028) and Tianjin Transportation Technology Project (No. 2025-76).
References
[1]V.M. Delmotte, P. Zhai, H.O. Po¨rtner, et al., Global warming of 1.5°C. An IPCC special report on the impacts of global warming of 1.5°C above pre-industrial levels and related global greenhouse gas emission pathways, in the context of strengthening the global response to the threat of climate change,sustainable development,and efforts to eradicate poverty, IPCC (2018).
[2]A. Ja¨ger-Waldau, Snapshot of photovoltaics–March 2025, EPJ Photovoltaics 16 (2025) 22.
[3]M.S. Alam, F.S. Al-Ismail, A. Salem, et al., Hi gh-level penetration of renewable energy sources into grid u tility:challenges and solutions, IEEE Access 8 (2020) 190277–190299.
[4] M.G. Villalva, J.R. Gazoli, E.R. Filho,Comprehensive approach to modeling and simulation of photovolt aic arrays, IEEE Trans.Power Electron. 24 (5) (2009) 1198–1208.
[5]G.K. Singh, Solar power generatio n by PV (photovoltaic)technology: a review, Energy 53 (2013) 1–13.
[6]A. Dhahri, A. Omri, A review of solar chimney power generation technology, Int. J. Eng. Adv. Technol. 2 (3) (2013) 1–17.
[7]R. Ahmed, V. Sreeram, Y. Mishra, et al.,A review and evaluation of the state-of-the-art in PV solar power forecasting: techniques and optimization, Renew. Sustain. Energy Rev. 124 (2020)109792.
[8]D.K. Chaturvedi, I. Isha, Solar power forecasting:a review,Int.J.Comput. Appl. 145 (6) (2016) 28–50.
[9]P. Roy, J.B. He, T.F. Zhao, et al.,Recent advances of wind-solar hybrid renewable energy systems for power generation: a review,IEEE Open J. Industr. Electr. Soc. 3 (2022) 81–104.
[10]D.S. Kumar, G.M. Yagli, M. Kashyap, et al., Solar irradiance resource and forecasting: a comprehensive review, IET Renew.Power Gener. 14 (10) (2020) 1641–1656.
[11]X. Chen, B.J. Li, J.L. Braid, et al., Open data sets for assessing photovoltaic system reliability, Appl. Energy 395 (2025) 126132.
[12]Y.H. Nie, X.T. Li, Q. Paletta, et al., Open-source ground-based sky image datasets for very short-term solar forecasting, cloud analysis and modeling: A comprehensive survey. arXiv:2211.14709. (2022). https://arxiv.org/abs/2211.14709.
[13]Y.H. Nie, X.T. Li, Q. Paletta, et al., Open-source sky image datasets for solar forecasting with deep learning:a comprehensive survey, Renew. Sustain. Energy Rev. 189 (2024) 113977.
[14]NOAA Global Monitoring Laboratory (2026) GML data finder.https://gml.noaa.gov/data/data.php.
[15]EUMETSAT (2026) Data store. https://user.eumetsat.int/dataaccess/ name="ref16" style="font-size: 1em; text-align: justify; text-indent: 2em; line-height: 1.8em; margin: 0.5em 0em;">[16]T. Stoffel, A. Andreas, Nrel solar radiation research laboratory(srrl): baseline measurement system (bms); golden, colorado(data) technical report, National Renew. Energy Lab (1981).
[17]J. Felden, L. Mo¨ller, U. Schindler, et al., PANGAEA - data publisher for earth & environmental science, Sci. Data 10 (2023)347.
[18]Z.Y. Yang, R. Rad, GloSoFarID: Global multispectral dataset for Solar Farm IDentification in satellite imagery. arXiv:2404.05180. (2024). https://arxiv.org/abs/2404.05180.
[19]J.P. Sauer, R. White, K. Munch, CloudCV 10-second sky images and irradiance dataset, NLR Data Catalog (2024).
[20]G. Terrén-Serrano, A. Bashir, T. Estrada, et al., Girasol, a sky imaging and global solar irradiance dataset, Data Brief 35 (2021)106914.
[21]C. Deline, D. Perry, M. Deceglie, Photovoltaic data acquisition(pvdaq) public datasets, DOE Open Energy Data Initiative(OEDI), NREL, 2021.
[22]M. Boyd, Nist weather station for photo- voltaic and building system research, National Institute of Standards and Technology,Gaithersburg, 2016.
[23]Y.B. Chen, J.J. Xu, Solar and wind power data from the Chinese state grid renewable energy generation forecasting competition,Sci. Data 9 (2022) 577.
[24]Z.N. Lin, Q. Zhou, Z. Wang, et al., A high-resolution three-year dataset supporting rooftop photovoltaics (PV) generation analytics, Sci. Data 12 (2025) 63.
[25]Dka solar centre (2020) Desert Knowledge Australia. https://dkasolarcentre.com.au/.
[26]M. Haeffelin, L. Barthe`s, O. Bock, et al.,SIRTA,a ground-based atmospheric observatory for cloud and aerosol research, Ann.Geophys. 23 (2) (2005) 253–275.
[27]S.K. Lien, H.T. Walnum, A˚.L.Sørensen,COFACTOR Drammen dataset - 4 years of hourly energy use data from 45 public buildings in Drammen, Norway, Sci. Data 12 (2025) 393.
[28]R. Trivedi, M. Bahloul, A. Saif, et al.,Comprehensive dataset on electrical load profiles for energy communi ty in Ireland,Sci.Data 11 (2024) 621.
[29]M. Sengupta, Y. Xie, A. Lopez, et al., The national solar radiation data base (NSRDB), Renew. Sustain. Energy Rev. 89(2018) 51–60.
[30]S. Pfenninger, I. Staffell, M. Jansen, Renewables.ninja model for the global output of weather-depend ent renewable energy sources,in: In EMS Annual Meeting Abstracts, 2018, p. 15.
[31]M. Suri, T. Huld, T. Cebecauer, et al., Geographic aspects of photovoltaics in Europe: contribution of the PVGIS website,IEEE J. Sel. Top. Appl. Earth Obs. Remote Sens.1(1)(2008)34–41.
[32]Main G (2025) Weather Spark, le mashup mé téorologique riche en statistiques. https://weatherspark.com/.
[33]S. Sterl, B. Hussain, A. Miketa, et al., An all-Africa dataset of energy model ‘‘supply regions” for solar photovoltaic and wind power, Sci. Data 9 (2022) 664.
[34]Finnish Meteorological Institute (2026) Download observations.https://www.ilmatieteenlaitos.fi/havaintojen-lataus.
[35]National Renewable Energy Laboratory (2026) Solar resource maps. https://www.nlr.gov/gis/solar-resource-maps.
[36]J. Yang, M. Sengupta, A. Habte, et al., (2024), National climate database (ncdb). https://www.osti.gov/biblio/2460455.
[37]Q.H. Qi, J.Y. Wu, C.A. Gueymard, et al., Mapping of 10-km daily diffuse solar radiation across China from reanalysis data and a machine-learning method, Sci. Data 11 (2024) 756.
[38]National Earth System Science Data Center, National Science &Technology Infrastructure of China. http://www.geodata.cn.
[39]Y. Wu, J.J. An, C.X. Gui, et al., A global typical meteorological year (TMY) database on ERA5 dataset, Build. Simul. 16 (6)(2023) 1013–1026.
[40]A. Sparks, Nasapower: a NASA POWER global meteorology,surface solar energy and climatology data client for R, J. Open Sourc. Softw. 3 (30) (2018) 1035.
[41]P. Zippenfenig, Open-meteo. com weather api, Zenodo (2023).
[42]M. Sˇu´ri, T. Cebecauer, A. Skoczek, Solargis: Solar data and online applications for pv planning and performance assessment,in: 26th European photovoltaics solar energy conference. 2011.https://www.researchgate.net/profile/Tomas-Cebecauer/publication/228412622_SolarGIS_solar_data_and_online_applications_for_PV_planning_and_performance_assessment/links/02e7e5350323f758d4000000/SolarGIS-solar- name="ref43" style="font-size: 1em; text-align: justify; text-indent: 2em; line-height: 1.8em; margin: 0.5em 0em;">[43]H. Formayer, I. Nadeem, D. Leidinger, et al., SECURES-Met: a European meteorological data set suitable for electricity modelling applications, Sci. Data 10 (2023) 590.
[44]National Laboratory of the rockies (2026). Renewable resource data. https://www.nlr.gov/grid/solar-resource/renewableresource-data.
[45]X.T. Zheng, N. Xu, L. Trinh, et al., (2021) Psml: A multi-scale time-series dataset for ma- chine learning in decarbonized energy grids. arXiv preprint arXiv:2110.06324.
[46]H.T.C. Pedro, D.P. Larson, C.F.M. Coimbra, A comprehensive dataset for the accelerated developmen t and benchmarking of solar forecasting methods, J. Renew. Sustain. Energy 11(3)(2019)036102.
[47]China Meteorological Data Service Centre (2026) National meteorological information center. https://data.cma.cn/.
[48]J. He, K. Yang, X. Li, W. Tang, et al., China meteorological forcing dataset v2.0(1951-2020)National Tibetan Plateau/Third Pole Environment Data Center. 2024.
[49]J. Mun˜oz-Sabater, E. Dutra, A. Agustı´-Panareda, et al., ERA5-Land: a state-of-the-art global reanalysis dataset f or land applications, Earth Syst. Sci. Data 13 (9) (2021) 4349–4383.
[50] Z. Usman, J. Tah, H. Abanda, et al., A critical appraisal of PVsystems’ performance, Buildings 10 (11) (2020) 192.
[51]R. Bugeja, L. Mule’ Stagno, L. Dexarcis, An offshore solar irradiance calculator (OSIC) applied to photovoltaic tracking systems, Energies 16 (9) (2023) 3735.
[52]M.S. Korkmaz, E.Toker,A.D.S¸ahin, Comprehensive analysis of extreme meteorological conditions for the safety and reliability of floating photovoltaic systems: a case on the Mediterranean coast,Sustainability 15 (19) (2023) 14077.
[53]Z.P. Qu, P. Blanc, M. Lefe`vre, et al.,Study of the possible benefits of cloud products of eumetsat in solar energy,Proceedings of 2011 EUMETSAT Meteorological Satellite Conference, 2011 in Oslo,Norway, 2011, pp s7_03.
[54]O. Tsafarakis, K. Sinapis, W.G.J.H.M. Van Sark, PV system performance evaluation by clustering production data to normal and non-normal operation, Energies 11 (4) (2018) 977.
[55]S. Pfenninger, I. Staffell, Long-term patterns of European PV output using 30 years of validated hourly reanalysis and satellite data, Energy 114 (2016) 1251–1265.
[56]S. Ransome, Validating energy yield modelling with the NREL outdoor dataset [C], in: 2018 IEEE 7th World Conference on Photovoltaic Energy Conversion (WCPEC) (A Joint Conference of 45th IEEE PVSC,28th PVSEC&34th EU PVSEC)Waikoloa,HI, USA, IEEE, 2018. pp. 2713–2718.
[57]L. Mrig, Y. Caiyem, S. Rummel, et al., Photovoltaic module and system performance testing at nrel, Proc. Am. Instit. Phys. Conf.306 (1994) 164–169.
[58]S. Ransome, Improvements to the IEC 61853 matrix energy rating methodology, validated with the NREL dataset, in: Proceedings of 2020 47th IEEE Photovoltaic Specialists Conference (PVSC),2020 in Calgary, Canada, 2020, pp. 0781–0785.
[59]G. Stanhill, S. Cohen, Global dimming: a review of the evidence for a widespread and significant reduction in global radiation with discussion of its probable causes and possible agricultural consequences, Agric. For. Meteorol. 107 (4) (2001) 255–278.
[60]R.A. Rajagukguk, R.A.A. Ramadhan, H.J. Lee, A review on deep learning models for forecasting time series data of solar irradiance and photovoltaic power, Energies 13 (24) (2020) 6623.
[61]G. Terrén-Serrano, M. Martı´nez-Ramo´n, Kernel learning for intra-hour solar forecasting with infrared sky images and cloud dynamic feature extraction, Renew. Sustain. Energy Rev. 175(2023) 113125.
[62]B.J. Li X. Chen A. Jain Enhancing power prediction of photovoltaic systems: Leveraging dynamic physical model for irradiance-to-power conversion.arXiv: 2402.11897.2024.https://arxiv.org/abs/2402.11897.
[63]X.S. Sun, R.V.K. Chavali, M.A. Alam,Real-time monitoring and diagnosis of photovoltaic system degradation only using maximum power point: the Suns-Vmp method, Prog. Photovolt.Res. Appl. 27 (1) (2019) 55–66.
[64]K. Perry, C. Campos, Panel segmentation: a Python package for automated solar array metadata extraction using satellite imagery,in: Proceedings of 2022 IEEE 49th Photovoltaics Specialists Conference (PVSC) Philadelphia, 2022 in PA, 2022, p. 0751.
[65]M.T. Boyd, Comparative performance and model agreement of three common photovoltaic array configurations, J. Sol. Energy Eng. 140 (2018) 014503.
[66]G. Seo, S. Yoon, J. Song, et al.,Label-free fault detection scheme for inverters of PV systems: deep reinforcement learning-based dynamic threshold, Appl. Sci. 13 (4) (2023) 2470.
[67]S. Narayanan, R. Kumar, S. Ramadass, et al., Innovative hybrid approach for enhanced renewable energy generation forecasting using recurrent neural networks and generative adversarial networks, J. Electr. Eng. Technol. 19 (8) (2024) 4847–4864.
[68]Y.J. Li, W.J. Li, L.N. Yu, et al., A novel paradigm for neural computation: X-net with learnable neurons and adaptable structure. arXiv: 2401.01772, 2024. https://arxiv.org/abs/2401.01772.
[69]S.C. Jo, Y.G. Jin, Y.T. Yoon, et al., Methods for integrating extraterrestrial radiation into neural network models for dayahead PV generation forecasting, Energies 14 (9) (2021) 2601.
[70]S.P. Pu, Z.Y. Li, H. Wan, et al., A hybrid prediction model for photovoltaic power generation based on information entropy,IET Generat., Trans. Distribut. 15 (3) (2021) 436–455.
[71]F. Hu, L.H. Zhang, J.Q. Wang, A hybrid convolutional–long short-term memory–attention framework for short-term photovoltaic power forecasting, incorporating data from neighboring stations, Appl. Sci. 14 (12) (2024) 5189.
[72]N. Lindsay, Q. Libois, J. Badosa, et al., Errors in PV power modelling due to the lack of spectral and angular details of solar irradiance inputs, Sol. Energy 197 (2020) 266–278.
[73]F.C. Obaldı´a, Photovoltaic power gen- eration uncertainty forecast for microgrid energy management efficiency enhancement, Sorbonne Université, 2020.
[74]J. Chakar, M. Pavlov, Y. Bonnassieux , et al., Determining solar cell parameters and degradation rates from power production data, Energy Convers. Manage.: X 15 (2022) 100270.
[75]Z.Y. Zhao, Q.R. Li, B. Bo, et al., A domain-adversarial mechanism and invariant spatiotempo ral feature extraction based distributed PV forecasting method for EV cluster baseline load estimation, Electronics 14 (23) (2025) 4709.
[76]F. Aksan, A. Pawlica, V. Suresh, et al., A comparative study of machine learning models for PV energy prediction in an energy community, Energies 18 (22) (2025) 5980.
[77]Y. Xie, A. Habte, M. Sengupta, et al., An evaluation of the spectral irradiance data from the NSRDB, National Renewable Energy Laboratory (2021). https://docs.nrel.gov/docs/fy21osti/80439.pdf.
[78]D. Schwartz, A.A. Batabyal, The decision to install a rooftop photovoltaic system by a small business: a case study, Rev.Regional Stud. 54 (1) (2024) 77–99.
[79]N. Ravi, A. Scaglione, J. Giraldez, et al., Solar photovoltaic systems metadata inference and differentially private publication.arXiv: 2304.03749. 2023. https://arxiv.org/abs/2304.03749.
[80]R. Leppik, Prospects of solar electricity investments in estonia and finland, Aalto University, 2025.
[81]D. Lingfors, J. Widén, Development and validation of a wide-area model of hourly aggregate solar power generation, Energy 102(2016) 559–566.
[82]J. Lo´pez Prol, P.F. de Llano, A. Calvo-Silvosa,et al.,Wind-solar technological, spatial and temporal complementar ities in Europe:a portfolio approach, Energy 292 (2024) 130348.
[83]C.S. Psomopoulos, G.C. Ioannidis, S.D. Kaminaris, et al., A comparative evaluation of photovolt aic electricity production assessment software (PVGIS, PVWatts and RETScreen),Environ. Proc. 2 (1) (2015) 175–189.
[84]D.D. Milosavljevic´, T.S. Kevkic´, S.J. Jovanovic´ , Review and validation of photovoltaic solar simulation tools/software based on case study, Open Phys. 20 (1) (2022) 431–451.
[85]L. Giannuzzo, F.D. Minuto, D.S. Schiera, et al., Reconstructing hourly residential electrical load profiles for Renewable Energy Communities using non-intrusive machine learning techniques,Energy AI 15 (2024) 100329.
[86]S.A. Khan, M.M.H. Chowdhury, U. Nandy, Solar-wind-power hybrid power generation system, J. Eng. Res. Rep. 25(10) (2023)145–152.
[87]E.T. Marcel, J. Mutale, A.T. Mushi, Optimal design of hybrid renewable energy for Tanzania rural communi ties, Tanzania J.Sci. 47 (5) (2021) 1716–1727.
[88]R. Peters, J. Berlekamp, K. Tockner, et al., Electricit y mix from renewable energies can avoid further fragmentation of A frican rivers, Sustain. Energy Res. 11 (1) (2024) 15.
[89] S. Sterl, R. Shirley, M. Githinji, et al.,Leapfrogging the darkness:contextualising the meaning of energy transitions for African countries, Prog. Energy 6 (2) (2024) 023003.
[90]A. Karthick, R. Yamuna, S. Kaliappan, et al., Random forest regression for solar radiation forecasting with meteorological inputs [C], 2025 International Conferen ce on Modern Sustainable Systems (CMSS) Shah Alam, Malaysia, IEEE, 2025.
[91]T.T. Hieu, N.B. Nam, D.M. Quan, et al., Very short-term solar radiation forecasting with all-sky images and meteorological data,Univ. Danang – J. Sci. Technol. (2025) 130–134.
[92]M. Borunda, A. Ramı´rez, R. Garduno, et al.,Photovoltaic power generation forecasting for regional assessment using machine learning, Energies 15 (23) (2022) 8895.
[93]J.M. Canẽte, I.B. Benitez, M.D.A.I. Bauzon, et al., Development of a webgis for solar pv resource and installation assessment using geospatial technologies. The International Archives of the Photogrammetry, Remote Sensing and Spatial Information Sciences, XLVIII-4/W8-2023. 2024. 107–112.
[94]A. Bin Thaneya, A. Horvath, Exploring regional fine particulate matter (PM2.5) exposure reduction pathways using an optimal power flow model: the case of the Illinois power grid,Environ.Sci.Technol. 57 (21) (2023) 7989–8001.
[95]T. Weiss, B. Wehrend, F. Quaium, et al., Implementing a climate database to produce stochastical feed-in curves of renewable energies [C], in: 2015 50th International Universities Power Engineering Conference (UPEC) Stoke on Trent, UK, IEEE,2015, pp. 1–7.
[96]M. Sengupta, A. Habte, A. Gotseff, A Physics-based goes satellite product for use in nrel’s national solar radiation database,National Renewable Energy Laboratory (2014).
[97]R.L. Hulstrom, T.W. Cannon, T. Stoffel, et al., An overview of nrel’s pv solar radiation research task activities and results, Proc.American Instit. Phys. Conf. 268 (1992) 453–461.
[98]M.L. Wu, Z.J. Pang, H.M. Hong, et al., Skip-based combined prediction method for distributed photovolt aic power generation,J. Shenzhen Univ. Sci. Eng. 41 (3) (2024) 293–302.
[99]X.X. Zhang, N. Lu, H. Jiang, et al., Evaluation of reanalysis surface incident solar radiation data in China,Sci.Rep.10(2020)3494.
[100]W.J. Tang, K. Yang, J. Qin, et al., Solar radiation trend across China in recent decades: a revisit with quality-controlled data,Atmos. Chem. Phys. 11 (1) (2011) 393–406.
[101]W.M. Qin, L.C. Wang, M. Zhang, et al., First effort at constructing a high-density photosynthetica lly active radiation dataset during 1961–2014 in China, J. Clim. 32 (10) (2019) 2761–2780.
[102]S. Mohammed Radhi, S. Al-Majidi, M. Abbod, et al., Predicting solar power generation utilized in Iraq power grid using neural network, Misan J. Eng. Sci. 3 (1) (2024) 38–62.
[103]P. Beguery, T. Lagarde, V. Minier, et al., Simulation-based framework for building of the future studies,Proc.Build.Simulat.2023: 18th Conf. IBPSA 18 (2023) 3223–3230.
[104]Y. Patil, T. Shruti, Time-series forecasting using ARIMA and SARIMA models for solar NASA POWER data,in:Proceedings of 2025 3rd International Conference on Intelligent Systems,Advanced Computing and Communication (ISACC), 2025 in Silchar, India, 2025, pp. 946–952.
[105]V. Nou, W.S. Shi, Solar power photovoltaic output forecasting using multiple methods approach, case study: Cambodia, in:Proceedings of 2022 IEEE 4th Eurasia Conference on IOT,Communication and Engineering (ECICE), 2022 in Yunlin,Taiwan, China, pp: 556–561.
[106]P. Kraska, K. Hanzel, Integrating meteorological data for nextday photovoltaic energy prediction using XGBoost, Adv. Sci.Technol. Res. J. 19 (11) (2025) 206–220.
[107]J. Depoortere, J. Driesen, J. Suykens, et al.,SolNet:Open-source deep learning models for photovoltaic power forecasting across the globe, Int. J. Forecast. 41 (3) (2025) 1223–1236.
[108]F.K. Alhousni, F.B.I. Alnaimi, P.C. Okonkwo, et al.,Photovoltaic power prediction using analytical models and Homer-pro: Investigation of results reliability, Sustainability 15(11) (2023) 8904.
[109]O. Stoliarov, Efficient electricity generatio n forecasting from solar power plants using technology: integratio n, benefits and prospects, Bicник Чepкacькoгo дepжaвнoгo тexнoлoгiчнoгo yнiвepcитeтy 29 (1) (2024) 73–85.
[110]C. Killenberger, N. Zielonka, J.P. Sasse, et al.,Weather resilience of the future Swiss electricity system with very high shares of variable renewable energy sources, Environ. Res.: Energy 2 (1)(2025) 015003.
[111]L. Pernigo, R. Sen, D. Baroli, Probabilistic energy forecasting through quantile regression in reproducing kernel Hilbert spaces,ACM SIG Energy Energy Inform. Rev. 4 (4) (2024) 175–186.
[112]Q.S. Dai, X.S. Huo, Y.C. Hao, et al., Spatio-temporal prediction for distributed PV generation system based on deep learning neural network model, Front. Energy Res. 11 (2023) 1204032.
[113]A.M. Assaf, H. Haron, H.N. Abdull Hamed, et al., A review on neural network based models for short term solar irradiance forecasting, Appl. Sci. 13 (14) (2023) 8332.
[114]V. Oliveira Santos, F.P. Marinho, P.A. Costa Rocha, et al.,Application of quantum neural network for solar irradiance forecasting: a case study using the Folsom dataset, California,Energies 17 (14) (2024) 3580.
[115]V.H. Wentz, J.N. Maciel, J.J. Gimenez Ledesma, et al., Solar irradiance forecasting to short-term PV power: accuracy comparison of ANN and LSTM models, Energies 15 (7) (2022)2457.
[116]Y.C. Ou, Z.S. Li, Comparative study on the precision of photovoltaic power generation prediction based on integrated models, Res. Environ. Sci. 100 (2023).
[117]L.R. Camargo, J. Schmidt, Simulation of long-term time series of solar photovoltaic power: is the era5-land reanalysis the next big step? arXiv:2003.04131. 2020.
[118]K. Gruber, L.R. Camargo, J. Schmidt, Pv and wind power simulation with era5 and era5-land-a multi-country analysis,Proceedings of EGU General Assembly Conference Abstracts,2022, pp EGU22–9702.
[119]Lawrence Berkeley National Laboratory (2026) Solar capacity and generation. https://emp.lbl.gov/solar-capacity-andgeneration.
[120]J. Davenport, N. Wayth, Statistical review of world energy,Energy Institute, 2023.
[121]N.D. Jackson, T. Gunda, Evaluation of extreme weather impacts on utility-scale photovoltaic plant performa nce in the United States, Appl. Energy 302 (2021) 117508.
[122]C. Bracken, T. Thurber, N. Voisin, Hourly wind and solar generation profiles at 1/8th degree resolution. Zenodo, 2023.https://www.bing.com/ck/a?!&&p=7effd24eacef734f6645455b521 eea6d74b4090d00625be9378ffd53a88b572bJmltdHM9MTc3Mzg 3ODQwMA&ptn=3&ver=2&hsh=4&fclid=07cb101a-b325-6c7b-2ce6-06ddb20b6d5b&u=a1aHR0cHM6Ly96ZW5vZG8 ub3JnL3JlY29yZHMvMTAyMTQzNDg.
[123]U.S. Energy Information Administration (2026) Re- newable energy. https://www.eia.gov/renewable/.
[124]E.G.A. Antonini, A. Di Bella, I. Savelli, et al., Weather- and climate-driven power supply and demand time series for power and energy system analyses, Sci. Data 11 (2024) 1324.
[125]B. Sergi, W. Cole, A. Lopez, et al., 2024-county-level-hourlyrenewable-capacity-factor-dataset-for-the-reeds-model, National Renewable Energy Laboratory (2025).https://catalog.data.gov/dataset/2024-county-level-hourlyrenewable-capacity-factor-dataset-for-the-reeds-model.
[126]NREL geospatial data science (2023) United states utility-scale pv supply curves 2023. Technical report, DOE Open Energy Data Initiative (OEDI). National Renewable Energy Laboratory.https://data.openei.org/submissions/8319.
[127]A.M. Campbell, C. Bracken, S. Underwoo d, et al., A multidecadal hourly coincident wind and solar power production dataset for the contiguous United States,Sci.Data 11(2024)1121.
[128]Y. Nie, X. Li, A. Scott, et al., 2017–2019 sky images and photovoltaic power generation dataset for short-term solar forecasting, Stanford Digital Repository. (2023). https://purl.stanford.edu/sm043zf7254.
[129]Pecan Street (2019) Pecan street dataport. https://www.pecanstreet.org/dataport.
[130]A. Ruano, R.M. da Grac¸a, From home energy management systems to energy communities: methods and data, Sci. Data 11(2024) 346.
[131]S. Hasan, A. Blinov, A. Chub, et al., Solar Pv generation and consumption dataset of an estonian residential dwelling, Science Data 12 (2025) 481.
[132]M. Matam, R.R. Hernandez, B. Sekulic, et al., High-resolution floating solar pv data, Open Energy Data Initiative (2026).https://data.openei.org/submissions/6179.
[133]B. Sergi, C. Feng, F. Zhang, et al., Arpae perform datasets,Open Energy Data Initiative (2022). https://data.openei.org/submissions/5772.
[134]A.D. Mills, J. Seel, D. Millstein, et al., Solar-to-grid: trends in system impacts, reliability, and market value in the united states with data through 2019, Berkeley Lab (2021). https://emp.lbl.gov/publications/solar-grid-trends-system-impacts-0.
[135]D. Millstein, R. Wiser, A.D. Mills, et al., Solar and wind grid system value in the United States: the effect of transmission congestion, generation profiles, and curtailment, Joule 5(7)(2021)1749–1775.
[136]á. Baran, S. Baran, A two-step machine-learning approach to statistical post-processing of weather forecasts for power generation, Q. J. R. Meteorolog. Soc.150(759)(2024)1029–1047.
[137]V. Koval, Y. Sribna, V. Brednyova, et al., An analysis of the economic and technological potential of solar-driven generation in renewable energy development, Polityka Energetyczna –Energy Policy J. 27 (1) (2024) 157–172.
[138]M. Bosˇnjakovic´, M. Stojkov, M. Katinic´, et al.,Effects of extreme weather conditions on PV systems, Sustainability 15 (22) (2023)16044.
[139]D. Singh, Y.S. Bekris, C.D.W. Rogers, et al.,Enhanced solar and wind potential during widespread temperature extremes across the U.S. interconnected energy grids, Environ. Res. Lett.19(4)(2024)044018.
[140]S.R. Kurtz, Lessons learned from the growth of the solar industry,in: Proceedings of 44th Workshop on Geothermal Reservoir Engineering, 2019, pp. 1–8.
[141]N. Kaufman, Annual energy outlook projections and the future of solar photovoltaic electricity, Institute of Policy and Integrity,2014.
[142]S.H. Iranmanesh, H. Mostafaei, The applicatio n of a grey markov model in forecasting the errors of eia’s projections in gas production and energy intensity, Hyperion Econ. J. 1 (3) (2013)9–17.
[143]H.C. Bloomfield, D.J. Brayshaw, P.L.M. Gonzalez, et al., Subseasonal forecasts of demand and wind power and solar power generation for 28 European countries, Earth Syst.Sci.Data 13(5)(2021) 2259–2274.
[144]T. Polasek, M. Cˇ adı´k, Predicting photovoltaic power production using high-uncertainty weather forecasts, Appl. Energy 339(2023)120989.
[145]L. van der Most, K. van der Wiel,R.M.J.Benders,et al.,Extreme events in the European renewable power system: validation of a modeling framework to estimate renewable electricity production and demand from meteorological data, Renew. Sustain. Energy Rev. 170 (2022) 112987.
[146]F. Kahrl, J. Jorgenson, J.H. Kim, et al., Solar and wind forecast error reserve sharing in a multi-utility region, Berkeley Lab.(2024). https://emp.lbl.gov/publications/solar-and-windforecast-error.
[147]A. Meligrana, A. Fazzone, Weighted reservoir sampling with replacement from data streams. arXiv: 2403.20256. 2024. https://arxiv.org/abs/2403.20256.
[148]V. Kekatos, R. Annin, M.K. Singh, et al.,Solving optimal power flow on a name="ref149" style="font-size: 1em; text-align: justify; text-indent: 2em; line-height: 1.8em; margin: 0.5em 0em;">[149]K. Bot, A. Ruano, R.M. da Grac¸a, Short-term forecasting photovoltaic solar power for home energy management systems,Inventions 6 (1) (2021) 12.
[150]M. Ruano, A. Ruano, A multi-step ensemble approach for energy community day-ahead net load point and probabilistic forecasting, Energies 17 (3) (2024) 696.
[151]A. Kesku¨la, K. Grjaznov, T. Sepp, et al., Optimal sizing of residential PV and battery systems under grid export constraints:an Estonian case study, Energies 18 (16) (2025) 4405.
[152]R. Leppik, Prospects of solar electricity invest- ments in estonia and finland, Aalto University, 2025.
[153]H.S. Jeong, J. Choi, H.H. Lee, et al., A study on the power generation prediction model considering environmental characteristics of floating photovoltaic system, Appl. Sci. 10 (13)(2020) 4526.
[154]M. Ludkovski, G. Swindle, E. Grannan, Large scale probabilistic simulation of renewables production. arXiv: 2205.04736. 2022.https://arxiv.org/abs/2205.04736.
[155]S. Karimi-Arpanahi, S. Ali Pourmousavi, N. Mahdavi,Quantifying the predictability of renewable energy data for improving power systems decision-making, Patterns 4 (4) (2023)100708.
[156]K.S. Fujita, Z.H. Ancona, L.A. Kramer, et al., United states large-scale solar photovolt aic database (v3.0, april 2025). USGS Asset Identifier Service. 2023. doi: 10.5066/P9IA3TUS.
[157]A. Ortiz, D. Negandhi, S.R. Mysorekar, et al., An artificial intelligence dataset for solar energy locations in India[J],Sci.Data 9 (1) (2022) 497.
[158]Y. Yang, S.F. Lin, R.T. Lu, et al., CPVPD-2024: a Chinese photovoltaic plant dataset derived via a topography-enhanced deep learning framework, Sci. Data 12(1)(2025)1601,[PubMed].
[159]M. Mooney, K. Waechter, Pv rooftop database for puerto rico(pvrdb-pr), Open Energy Data Initiative (OEDI), 2020.
[160]G. Kasmi, Y.M. Saint-Drenan, D. Trebosc, et al., A crowdsourced dataset of aerial images with annotated solar photovoltaic arrays and installation metadata, Sci. Data 10(2023) 59.
[161]Irena. International renewable energy agency (2020) Indicative scale of Contributions for 2017. https://mzv.gov.cz/public/aa/9d/10/1959964_1522921_Priloha_4___Indicative_Scale_of_Contributions_2017.pdf.
[162]Homer Energy (2016) Homer®pro v3.7 user manual.Boulder,https://homerenergy.com/homer-pro.
[163]N. Blair, N. DiOrio, J. Freeman, et al., System advisor model(sam) general description(version 2017.9.5).National Renewable Energy Laboratory (NREL). (2017). https://docs.nrel.gov/docs/fy18osti/70414.pdf.
[164]B. Byford, J. Braid, M. Theristis, et al., Photovoltaic module current-voltage and electroluminescence image data (pv-iv-el),Open Energy Data Initiative (2025). https://data.openei.org/submissions/8378.
[165]B. Sigrin, M. Gleason, R. Preus, et al., Distributed generation market demand model (dgen): Docu- mentation, National Renewable Energy Laboratory (2016). https://docs.nrel.gov/docs/fy16osti/65231.pdf.
[166]M. Howells, H. Rogner, N. Strachan, et al., OSeMOSYS: the open source energy modeling system, Energy Policy 39(10)(2011)5850–5870.
[167]P. Westacott, C. Candelise, A novel geographical information systems framework to characterize photovoltaic deployment in the UK: initial evidence, Energies 9 (1) (2016) 26.
[168]Y. Wang, R.M. Zou, F. Liu, et al., A review of wind speed and wind power forecasting with deep neural networks,Appl. Energy 304 (2021) 117766.
[169]J. Antonanzas, N. Osorio, R. Escobar, et al., Review of photovoltaic power forecasting, Sol. Energy 136 (2016) 78–111.
Received 18 March 2026; accepted 19 March 2026
Peer review under the responsibility of Global Energy Interconnection Group Co. Ltd.
* Corresponding author at: State Key Laboratory of Smart Power Distribution Equipment and System, Tianjin University, Tianjin 300072,P.R. China.
E-mail addresses: bochaozhao@tju.edu.cn (B. Zhao), yaqingwang@tju.edu.cn (Y. Wang), wenpeng.luan@tju.edu.cn (W. Luan), caihanju@tju.edu.cn (H. Cai).
https://doi.org/10.1016/j.gloei.2026.03.001
2096-5117/© 2026 Global Energy Interconnection Group Co. Ltd. Publishing services by Elsevier B.V. on behalf of KeAi Communications Co. Ltd.
This is an open access article under the CC BY-NC-ND license(http://creativecommons.org/licenses/by-nc-nd/4.0/).

Bochao Zhao (Member, IEEE) received the B.Eng. (Hons.) and Ph.D. degrees in electronic and electrical engineering from the University of Strathclyde, Glasgow, U.K., in 2014 and 2020, respectively.He is currently an Associate Professor with the School of Electrical and Information Engineering, Tianjin University,Tianjin, China. His research interests include demand response, energy trading in virtual power plants, energy disaggregation,and graph signal processing applications.