
0 Intr oduction
The rapid advancement of new energy technologies and growing environmental demands have positioned electric vehicles (EVs) as a critical component in the transportation sector due to their eco-friendly and energy-efficient characteristics. However, the large-scale adoption of EVs presents new challenges for power grid operation and load management [1]. The inherent uncertainty [2] and complexi ty[3] of EV charging loads – particularly their temporal fluctuations in charging periods and power demand –impose significant pressure on grid load dispatching and operational security. To address these challenges, the Chinese government has actively implemented policies to promote the integration of new energy vehicles with power grids. For instance, the New Energy Vehicle Industry Development Plan (2021–2035) explicitl y mandates accelerated EV adoption and deepened vehicle-grid integration,while the Implementation Guidelines for Strengthening NEV-Grid Interaction provides a concrete operational framework for such integration.
As a key technology for next-generation power systems,vehicle-to-grid (V2G) enables EV to participate in electricity markets through optimized charging load scheduling.In electricity spot markets, where trading occurs at minute-level intervals, high-resolution forecasting of EV charging and discharging profiles is essential to ens ure accurate capacity bids and system reliability [4]. Additionally, in demand response and ancillary service markets,EVs are treated as flexible resources. They can be aggregated into a virtual power plant (VPP) for coordinated dispatch. In such cases, accurate foreca sting of charging and discharging behavior is also essential to ensure reliable market participation and system balance [5].
Existing research on EV charging load forecasting primarily employs two methodologies: traditional statistical approaches and deep learning techniques. Conventional methods include: Li et al. [5] using Monte Carlo simulation for new energy vehicle chargi ng load prediction;Feng et al. [6] proposed a prediction model for electric vehicle charging load considering traffic conditio ns and environmental temperature; Wang et al. [7] applying time-of-day charging probability models; Chen et al. [8] extracting charging probability distributions via K-means clustering;and studies by Long et al. [9] and Zhang et al. [10] developing transportation-distribution network coupling models based on user behavior. While dependent on historical data, these methods suffer from model complexity and limited accuracy. Yang et al. [11] proposed a spatiotemporal distribution prediction model for electric vehicle charging loads in a transportation power coupling network(TPCN),Zhang et al.[12] utilized origin–destination (OD) matrices for load foreca sting, and Buzna et al.[13] established hierarchical models using gradientboosted regression trees. Travel-chain-based approaches include Li et al. [14] and Lu et al. [15] integrating traffic networks with user behavior modeling. Traditional statistical approaches offer clear interpretability of the causal or associative relationships between input variables an d prediction outcomes. However, they struggle to capture highly nonlinear patterns and complex feature interactions within the data.
In deep learning, Zhang et al. [16] extracted load features via convolutional neural networks (CNNs),Aduama et al. [17] conducted three separate charging load (energy demand) forecasts for electric vehicles (EVs) using different multi-feature input configurations, aiming to improve the accuracy of deep learning models for EV charging station load prediction,Xu[18] enhanced accuracy through CNNLSTM hybrids, and Pham et al. [19] optimized noise processing using singular spectrum analysis (SSA) with LSTM.Emerging methodologies feature Luo[20] developing graph neural network (GNN)-based collaborative prediction, Feng et al. [21] combining multivariate grey models with LSTM, Cheng et al. [22] proposed an electric vehicle charging load forecasting method based on Variational Mode Decomposition (VM D) and a hybrid Prophet-LSTM model, and Yi et al. [23] achieving superior multi-step prediction via sequence-to-sequence (Seq2-Seq) models. Xu et al. [24] proposed a spatiotemporal forecasting method for electric vehicle charging load on highways, which integrates a deep learning model capable of capturing spatiotemporal features with a Monte Carlo approach. This deep learning approach possesses strong nonlinear modeling capabilities. However, its black-box nature makes the results difficult to interp ret directly,which limits its applicability in engineering control and decision support.
Despite these advancements, current research exhibits notable limitations: traditional methods demonstrate constrained generalization capabilities and high data dependency, while deep learning approaches often overlook behavioral heterogeneity across EV types and lack scenario-specific adaptability. Furthermore, many studies fail to adequately incorporate real-world charging demand characteristics under diverse operational scenarios. This study addresses these gaps by categorizing EVs into six distinct types – private vehicles, ride-hailing cars, taxis,shared rental vehicles, logistics trucks, and public buses –and employing Monte Carlo simulation to analyze their unique charging load patterns. Through comprehensive consideration of behavioral modes and load characteristics, providing actionable insights for grid dispatching and EV charging infrastructure planning.Fig. 1 illustrates the major workflow from BEV classification to charging load prediction via Monte Carlo simulation.
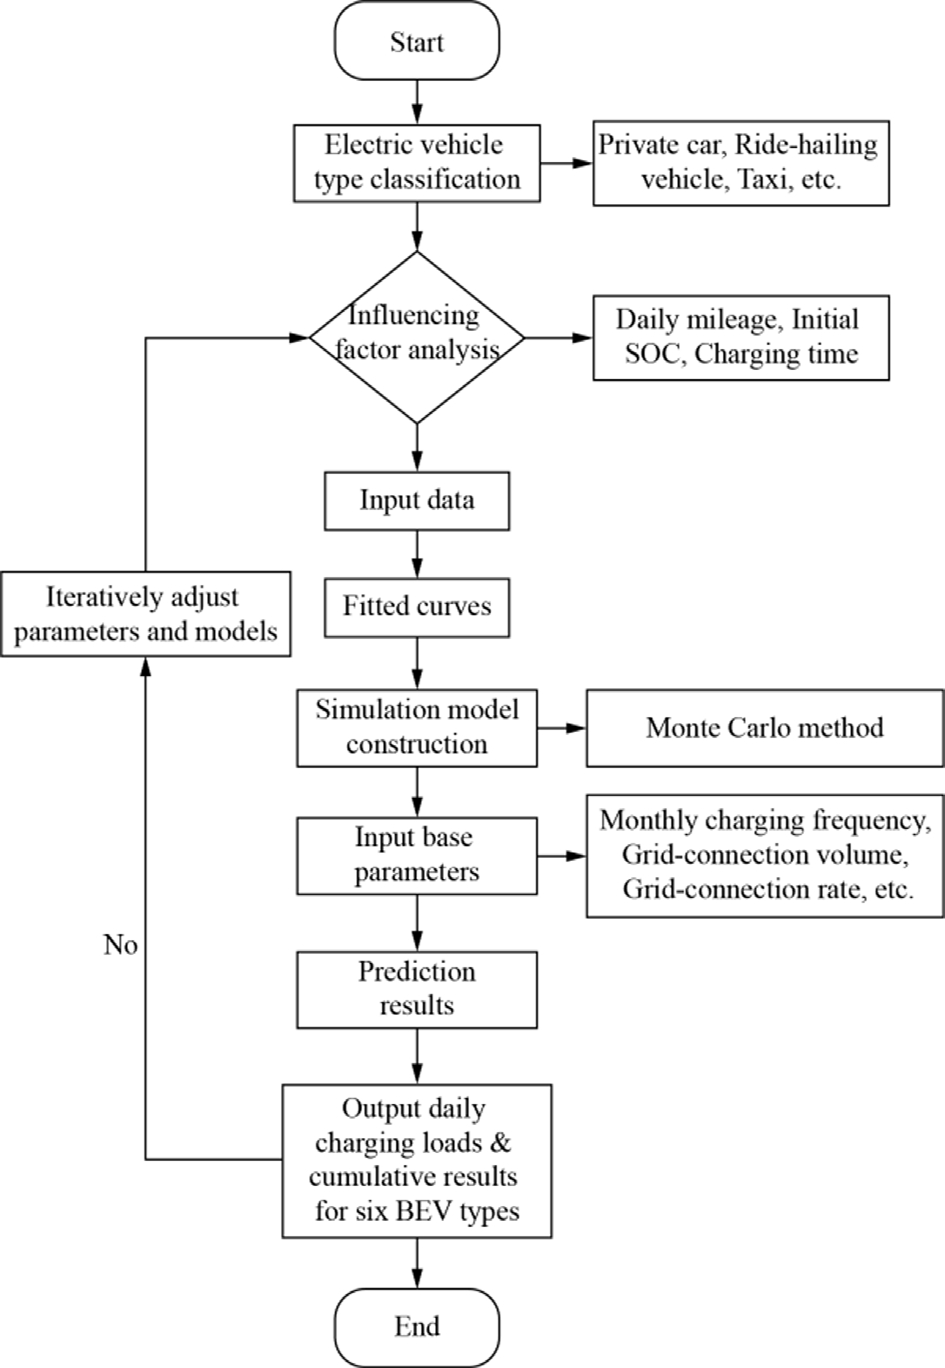
Fig. 1. Optimization process.
1 Analysis of influencing factors and indicator s for EV charging loads
1.1 Analysis of charging load influencing factors
With the large-scale development of EVs, the characteristics of their charging loads have increasingly significant impacts on power grid operations. Existing studies show that charging load modeling requires comprehen sive consideration of multi-dimensional factors such as user behavior characteristics, battery properties, and charging infrastructure[25]. Among these, daily mileage, as a direct determinant of energy demand, has been proven to be a fundamental variable affecting charging power requirements. Zhang et al. [26] found through big data analysis that the daily mileage of private vehicles follows a Weibull distribution, with its probability density function peaking in the 40–60 km range, directly influencing daily fluctuations in charging demand.
To maximize battery lifespan, the optimal state of charge (SOC) range for battery usage is between 20%and 85%. Based on this, when the SOC is 20–40%, charging scheduling is recommended; when the SOC is 40–60%,battery usage becomes more flexible, allowing both charging and discharging, with moderate charge–discharge strategies advised to protect the battery; when the SOC is 60–80%, discharging scheduling is more suitable [27].The adoption of smart charging strategies not only extends battery life but also provides economic benefits approximately twice the energy cost savings. Therefore, the battery status of EV users—including degradation level,cycle count, and remaining charge—is a critical factor influencing the grid-connected load of clustered EVs.
The initial SOC serves as the starting condition for charging, while the charging timing is constrained not only by individual user behavior preferences but also by complex interactions with traffic activity patterns and elect ricity pricing incentives. Empirical studies indicate a strong correlation between the timing of users’ final daily trip completion and charging initiation [28]. For example,commuting groups exhibit distinct ‘‘dual-peak clustering”in charging behavior due to the spatiotemporal separation between workplaces and residences: charging demand surges occur after arriving at workplaces (8:00–9:00) and after returning home (18:00–20:00). This temporal clustering effect can be quantitatively characterized, where the probability density function of charging timing shows a negative exponential relationship with dwell time at destinations [29].
These three core factors exhibit coupled interactions:daily mileage determines SOC consumption through energy calcul ations, while user travel patterns constrain charging timing [30]. Existing research predominantly focuses on single-factor analysis and lacks integrated modeling of these factors, potentially leading to systematic errors in load forecasting. Therefore, this study incorporates daily mileage, initial SOC, and charging timing into a unified framework to improve charging load prediction accuracy.
1.2 Analysis of charging load impact indicators
Distinguished from Shenzhen’s four-category framework for urban mid-long term planning [31], our provincial six-category taxonomy with multi-source probability fusion enables intraday load dynamics profiling, delivering finer-grained decision support for real-time grid dispatch.The data used in this study are sourced from the China New Energy Vehicle Big Data Research Report (2023)and the official government information website of the Hebei Provincial Development and Reform Commission.
1) Daily Mileage
As shown in Tables 1 an d 2, statistical analysis of daily mileages across different EV types reveals adherence to a log-nor mal distribution. The data fitting results are illustrated in Fig. 2, with the probability density function expressed as:

Notations:
μD,i,σD,i:log-mean and log-standard deviation of daily mileage for the i-th vehicle category; s: daily mileage.
2) Initial SOC
As shown in Table 3, statistical analysis of initial SOC values across BEV types indicates compliance with a lognormal distribution, with fitting results presented in Fig. 3. The probability density function is:

Notations:
σSOC,i,σSOC,i:log-mean and log-standard deviation of initial SOC for the i -th vehicle category; S: initial SOC.
3) Charging Start Time
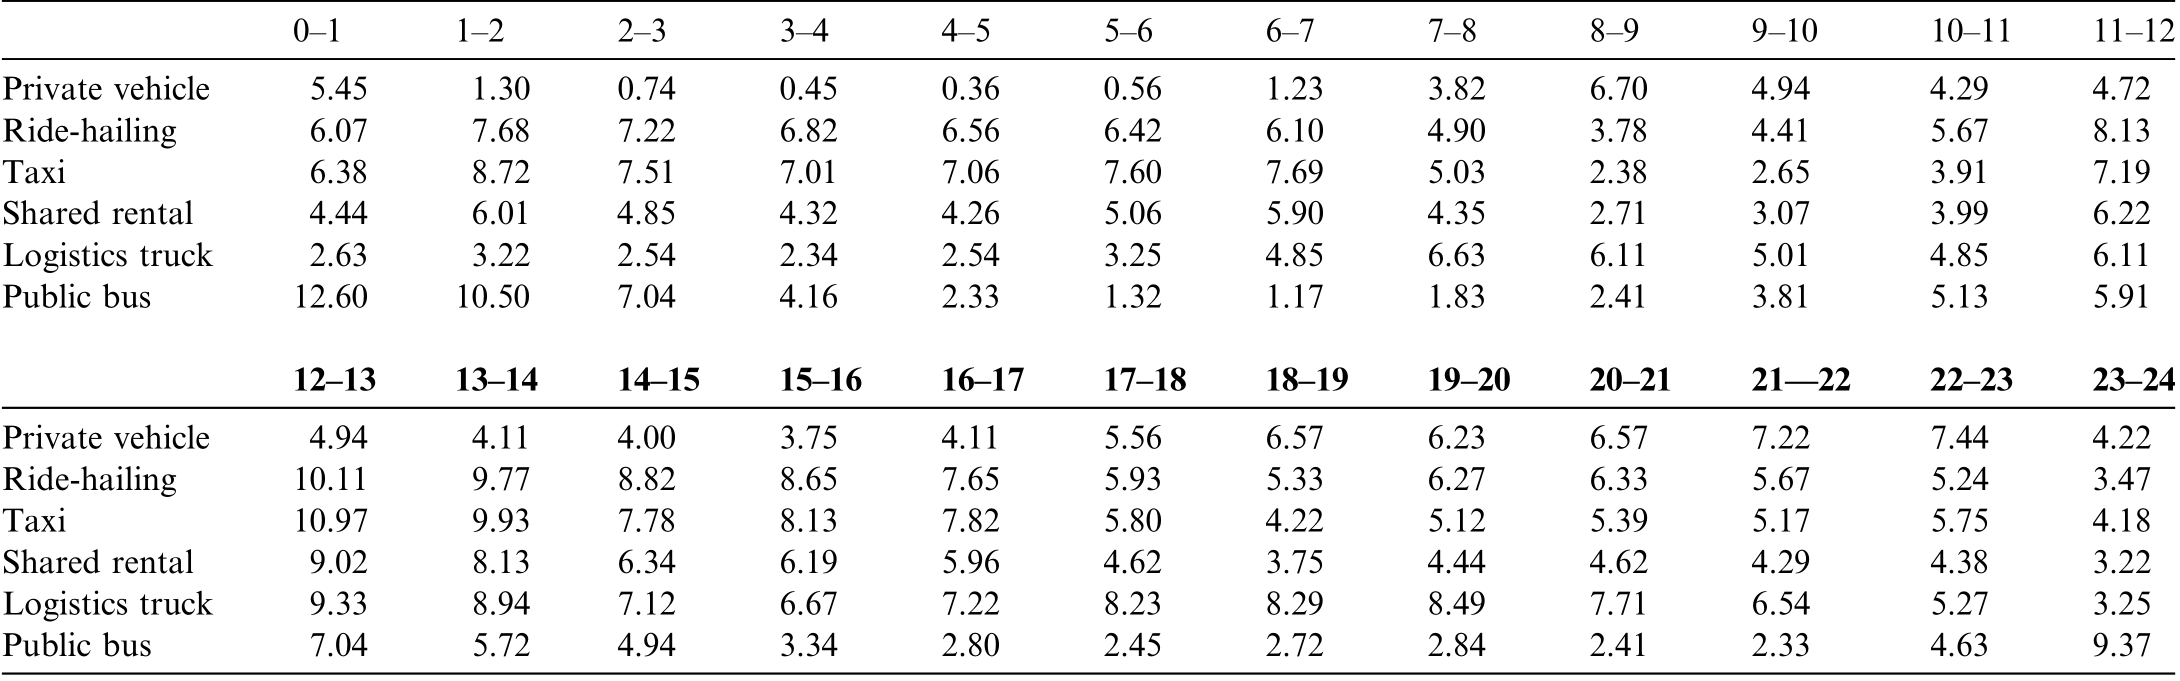
As shown in Table 4, statistical analysis of charging start times across BEV types reveals a tri-moda l normal distribution, with fitting results illustrated in Fig. 4. The composite probability density function is:

Table 1 Daily average driving distance by BEV type (Private BEVs).

Table 2 Daily average driving distance by BEV type (Other Categories).

Notations:
w i1, w i2, w i3:weighting factors for three peaks of the i-th vehicle category; μT,i1,μT,i2,μT,i3:mean values of three charging time peaks; σT,i1,σT,i2,σT,i3:standard deviations of three peaks; t: charging start time.
2 Development of Monte Carlo-based electric vehicl e charging load simulation model
2.1 Fundamental principles of Monte Carlo method
The Monte Carlo method, also known as statistical simulation, is a computational approach based on probability and statistical theories. Currently, it is widely used to solve stochastic multidimensional mathematical problems. Its core principle lies in simulating the be havior of complex systems through random sampling.The foundation of this method is to approximate the probability distribution of system variables by simulating a large number of random events.
The basic steps of the Monte Carlo method can be summarized as follows:First,define independent random variables Xi ( i = 1,2,3, ∙ ∙∙ ,k ),and specify their probabil ity density functions f ( X1 ),f ( X2 ) , ∙ ∙∙ ,f ( Xk ),then, generate random numbers x 1, x 2, ∙ ∙∙ , x k,according to these probability density functions. Subsequently, use these random numb ers as inputs to calculate the function value Z = g ( X 1,X2, ∙ ∙∙ ,Xk )( i = 1,2 ∙∙∙ ,N ).When N is suffi-ciently large, the mean of these sample function values can approximate a reliable numerical solution.
The Monte Carlo method is particularly suitable for addressing complex problems that are difficult to solve analytically, as it can approximate optimal solutions through extensive random sampling. The advantages of this method include its ability to avoid rapid increases in system complexity even when dealing with highdimensional data. Due to the large sample size, the accuracy of results generally improves with the number of samples, while effectively reducing systematic errors.
2.2 Calculation workflow
The EV charging load calculation in this study follows these sequential steps:
1) Actual Vehicle Population Calculation

Notations:
Ni: Actual number of online vehicles in category i;Nt:Total EV populati on;p i:Proportion of category i vehicles;λi:Online rate of categor y i vehicles.
2) Daily Energy Consumption Calculation

Notations:
Ed,i:Daily energy consumption of category i vehicles(kWh); Di:Daily mileage of category i vehicles (km);W 100:Energy consumption per 100 km (kWh/100 km).3) Per-Charge Energy Demand

Notations:
Ec,i:Average energy demand per charging session for category i(kWh); ki:Daily charging frequency of category i vehicles.
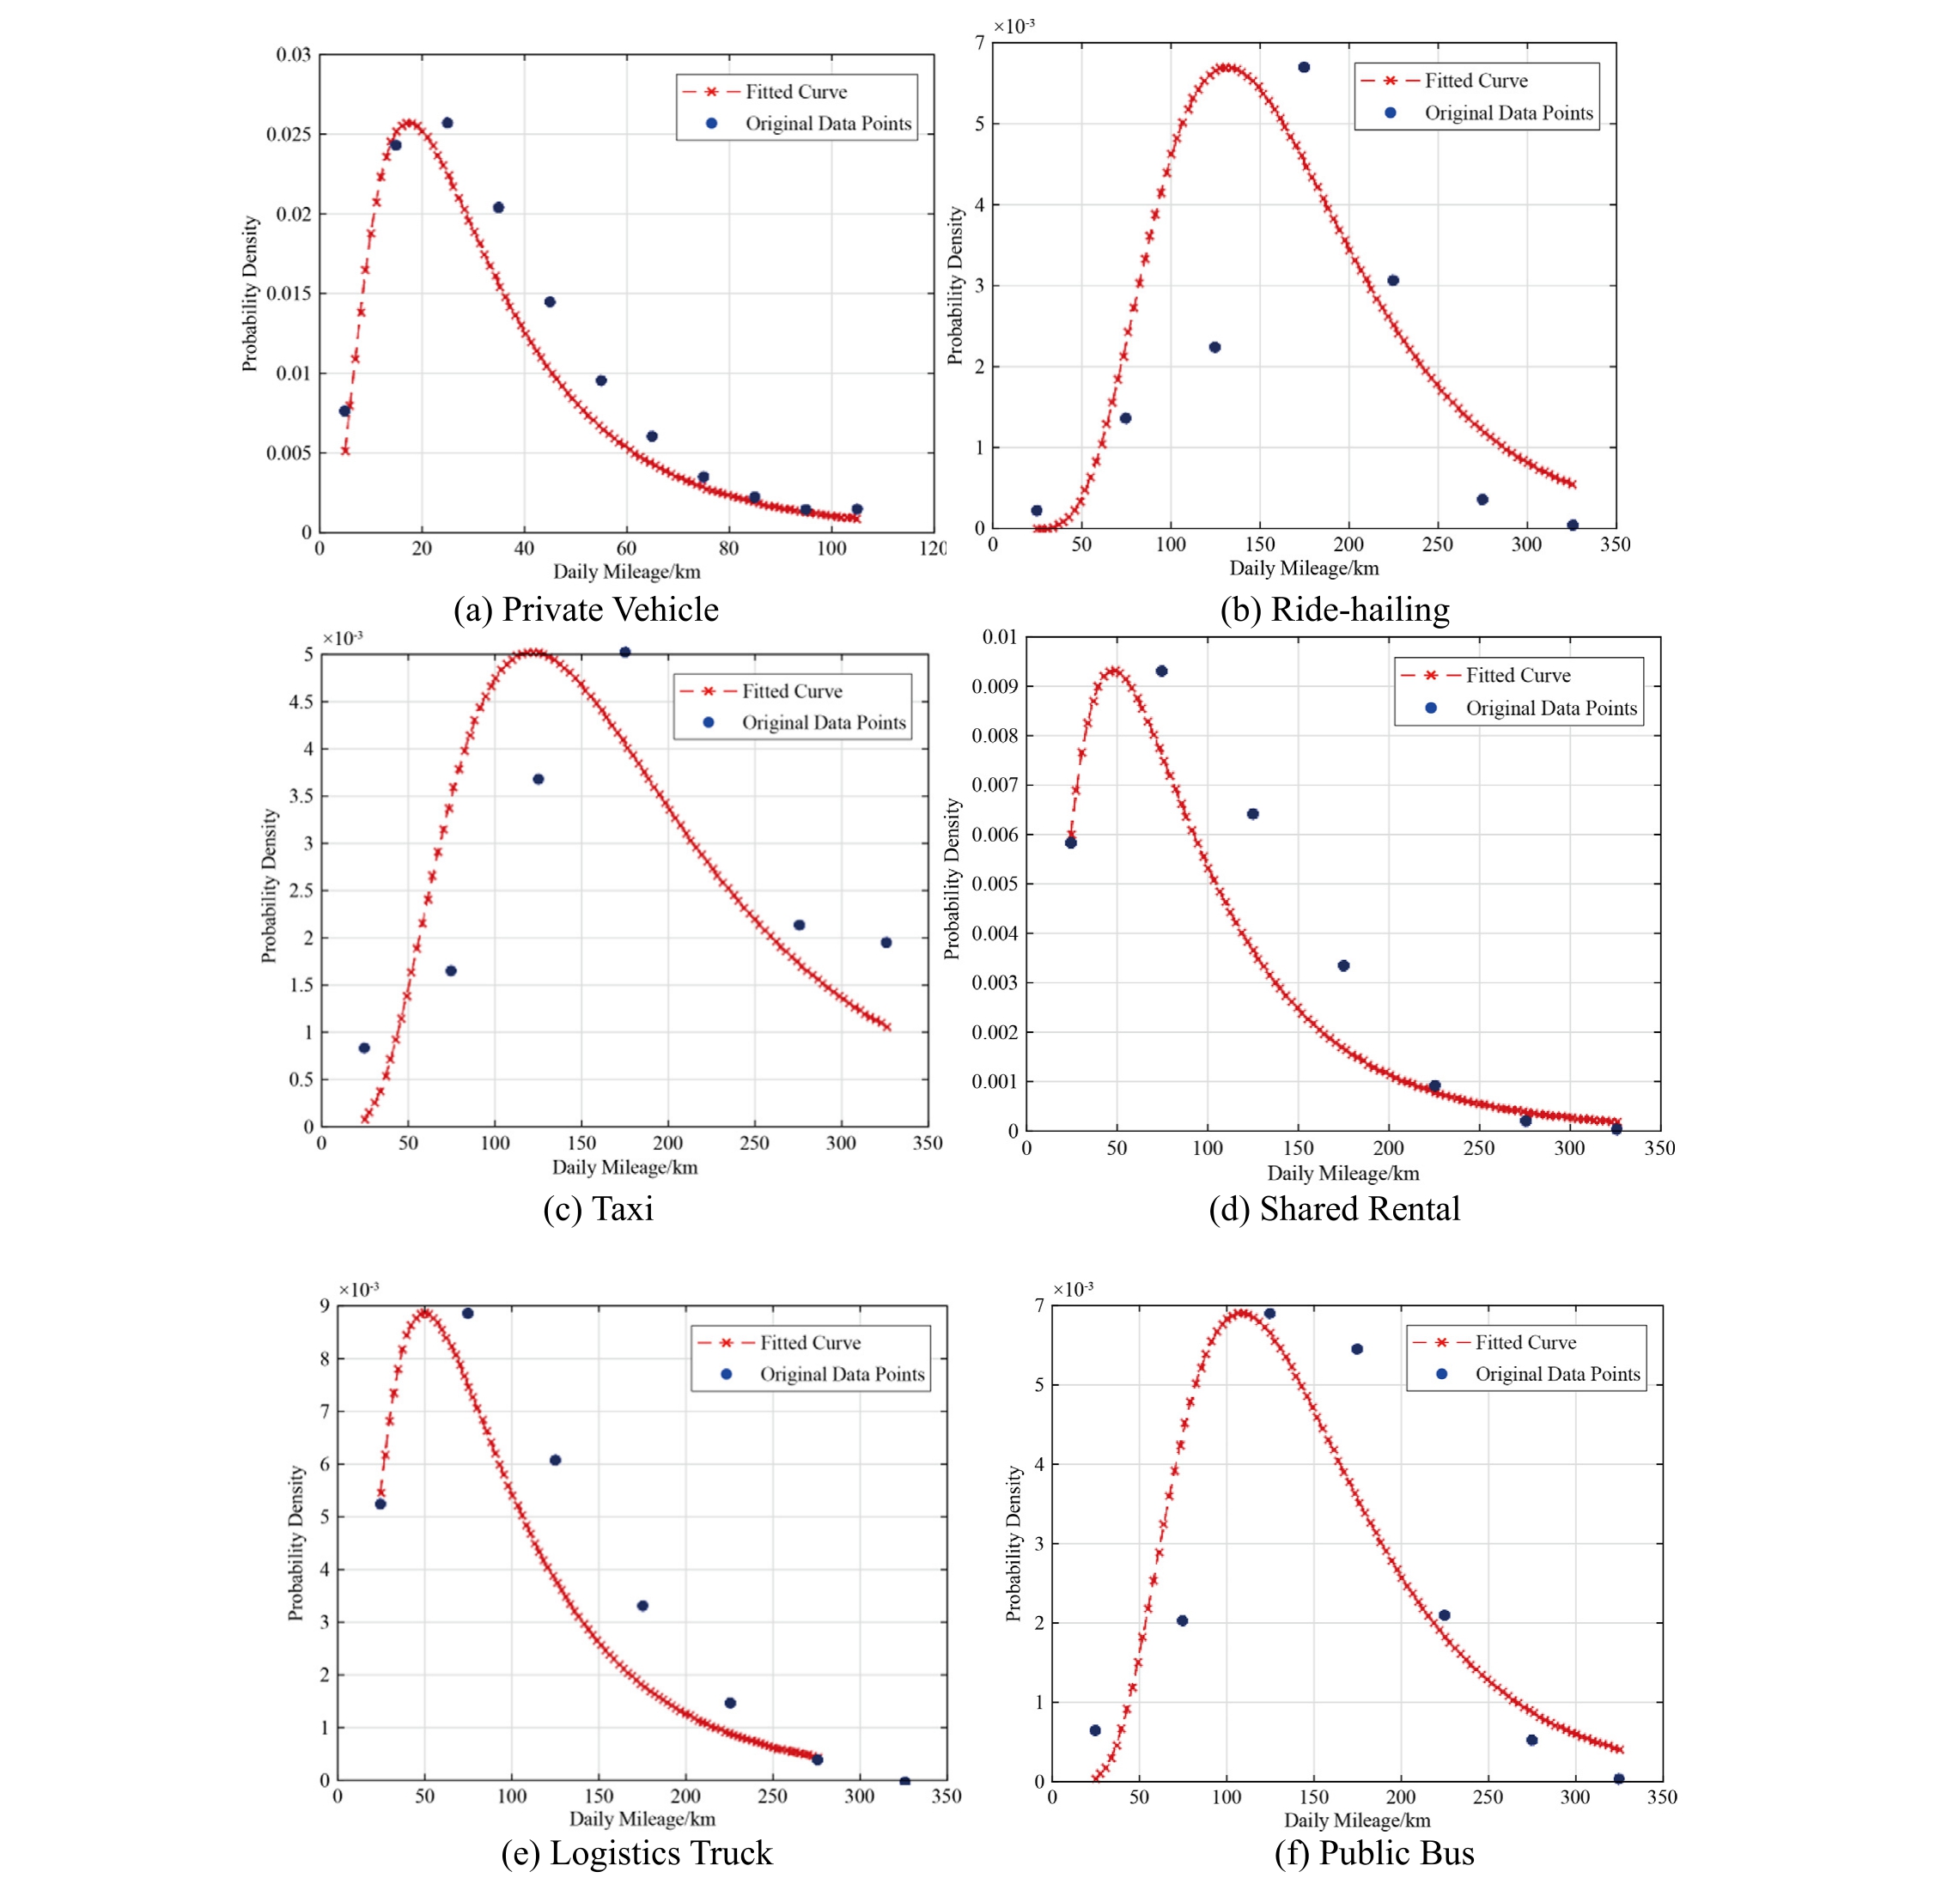
Fig. 2. Data fitting results of daily mileage.
Table 3 Initial SOC distribution by BEV type (%).

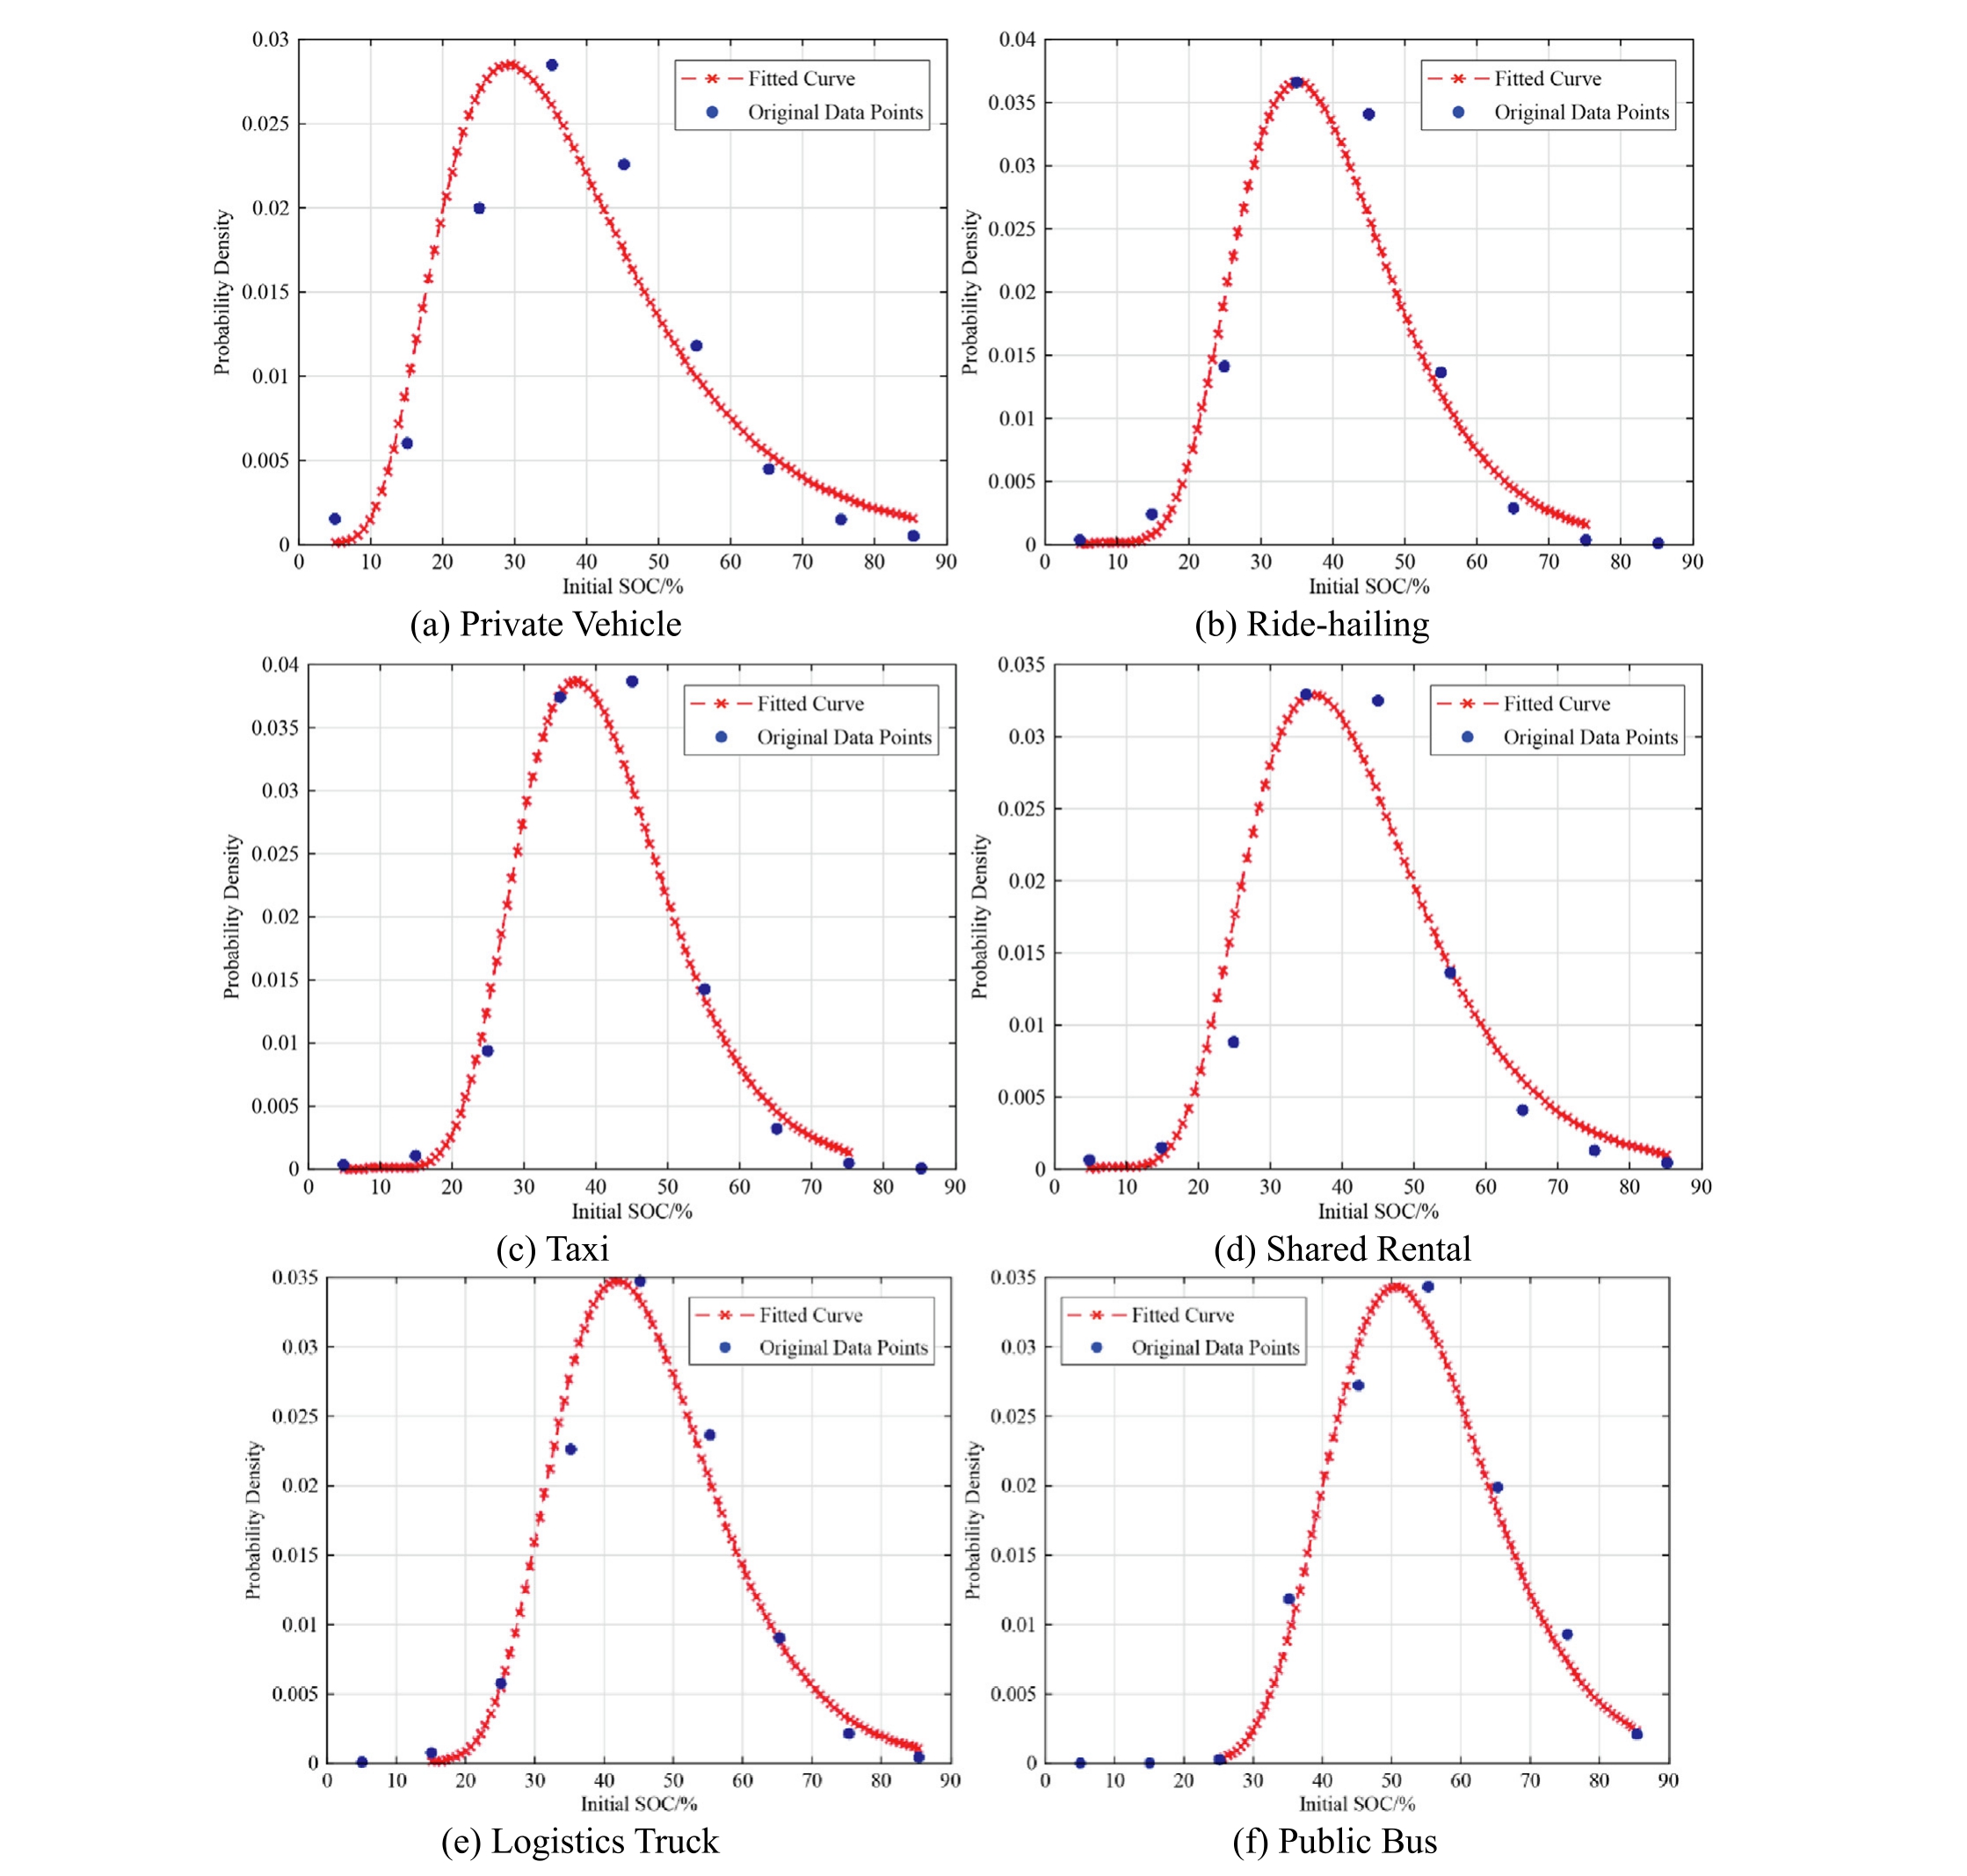
Fig. 3. Data fitting results of initial SOC.
4) Actual Energy Demand Based on SOC

Notations:
En,i:Actual energy demand per charging session(kWh);SOCi:Initial state of charge for category i vehicles (%).
5) Charging Power Calculation

Notations:
Pi: Charging power of category i vehicles (kW);fi:Fast-charging adoption rate for category i; Pf:Fastcharging power (kW); Ps:Slow-charging power (kW).
Table 4 Temporal distribution of charging vehicles by BEV type.
6) Charging Duration Calculation

Notations:
tc,i: Charging duration of category i vehicles (h);η:Charging efficiency (%).
7) Load Aggregation

Notations:
Li,t:Load contribution of category i at time step t(kW);Δt:Temporal resolution (h).
2.3 Basic parameters
Table 5 presents the monthly average charging frequency and proportion by BEV type,while Table 6 shows the fundamental parameters obtained from fitting results for the six BEV categories.
As of March 2024, China’s national regulatory platform has cumulatively registered 19.746 million new energy vehicles (NEVs), including 700,000 in Hebei Province. Among them, BEVs accounted for 15.189 million units (76.9%), plug-in hybrid electric vehicles (PHEVs)reached 4.541 million units (23.0%), and fuel cell electric vehicles (FCEVs) exceeded 16,000 units. By combining the proportion of registered BEV types and their online rates in Hebei Province (Table 7), the estimated registration volumes and online rates for each BEV type in Hebei Province can be calculated.
This study employs a probability distribution-based Monte Carlo method to simulate daily charging load profiles for BEVs in Hebei. Key input parameters include:Statistical descriptors (mean ± SD) of charging start time,initial SOC, and daily mileage; BEV population by category and chargin g power specifications. Fast or slow charging modes are determined according to Table 5,while charging start time, initial SOC, and daily drivi ng mileage are extracted based on Table 6. Finally, the cumulative load is calculated using relevant form ulas,with simulation results presented in Section 3.
3 Analysis and recommendations on electric vehicle charging load prediction results
3.1 Analysis
Fitting curves of average daily charging loads for six categories of battery electric vehicles are shown in Fig. 5.Fig. 5(a) presents the charging load profile of private battery electric vehicles. The first minor charging peak occurs around 9:00–10:00 midday, reaching nearly 500 MW. This is attributed to the predominance of weekdays throughout the year, during which private vehicle owners charge their EVs while at work. The second peak concentrates in the evening, aligning with commuting patterns, particularly reaching 600 MW between 22:00 and 24:00 and gradually tapering offafter midnight.
Fig. 5(b) (ride-hailing vehicles) and 5(e) (logistics trucks) exhibit primary charging peaks during midday breaks (12:00–14:00) and evening hours (19:00–20:00).The midday peak corresponds to ride-hailing drivers’ rest periods when service demand declines, enabling energy replenishment for afternoon and evening operations. The 19:00–20:00 peak coincides with post-commuting downtime, where drivers recharge after completing rush-hour orders to meet nighttime demand. Similarly, logistics trucks charging patterns reflect daily delivery schedules:midday charging follows morning distribution tasks to ensure afternoon operational continuity, while evening charging prepares vehicles for next-day operations after completing daily deliveries.Fig. 5(f) (public buses) demonstrates concentrated charging loads around 24:00, as buses undergo intensive daytime operations with limited charging opportunities, making nighttime downtime the primary charging window. Minor midday fluctuations relate to partial supplemental charging during operational breaks.
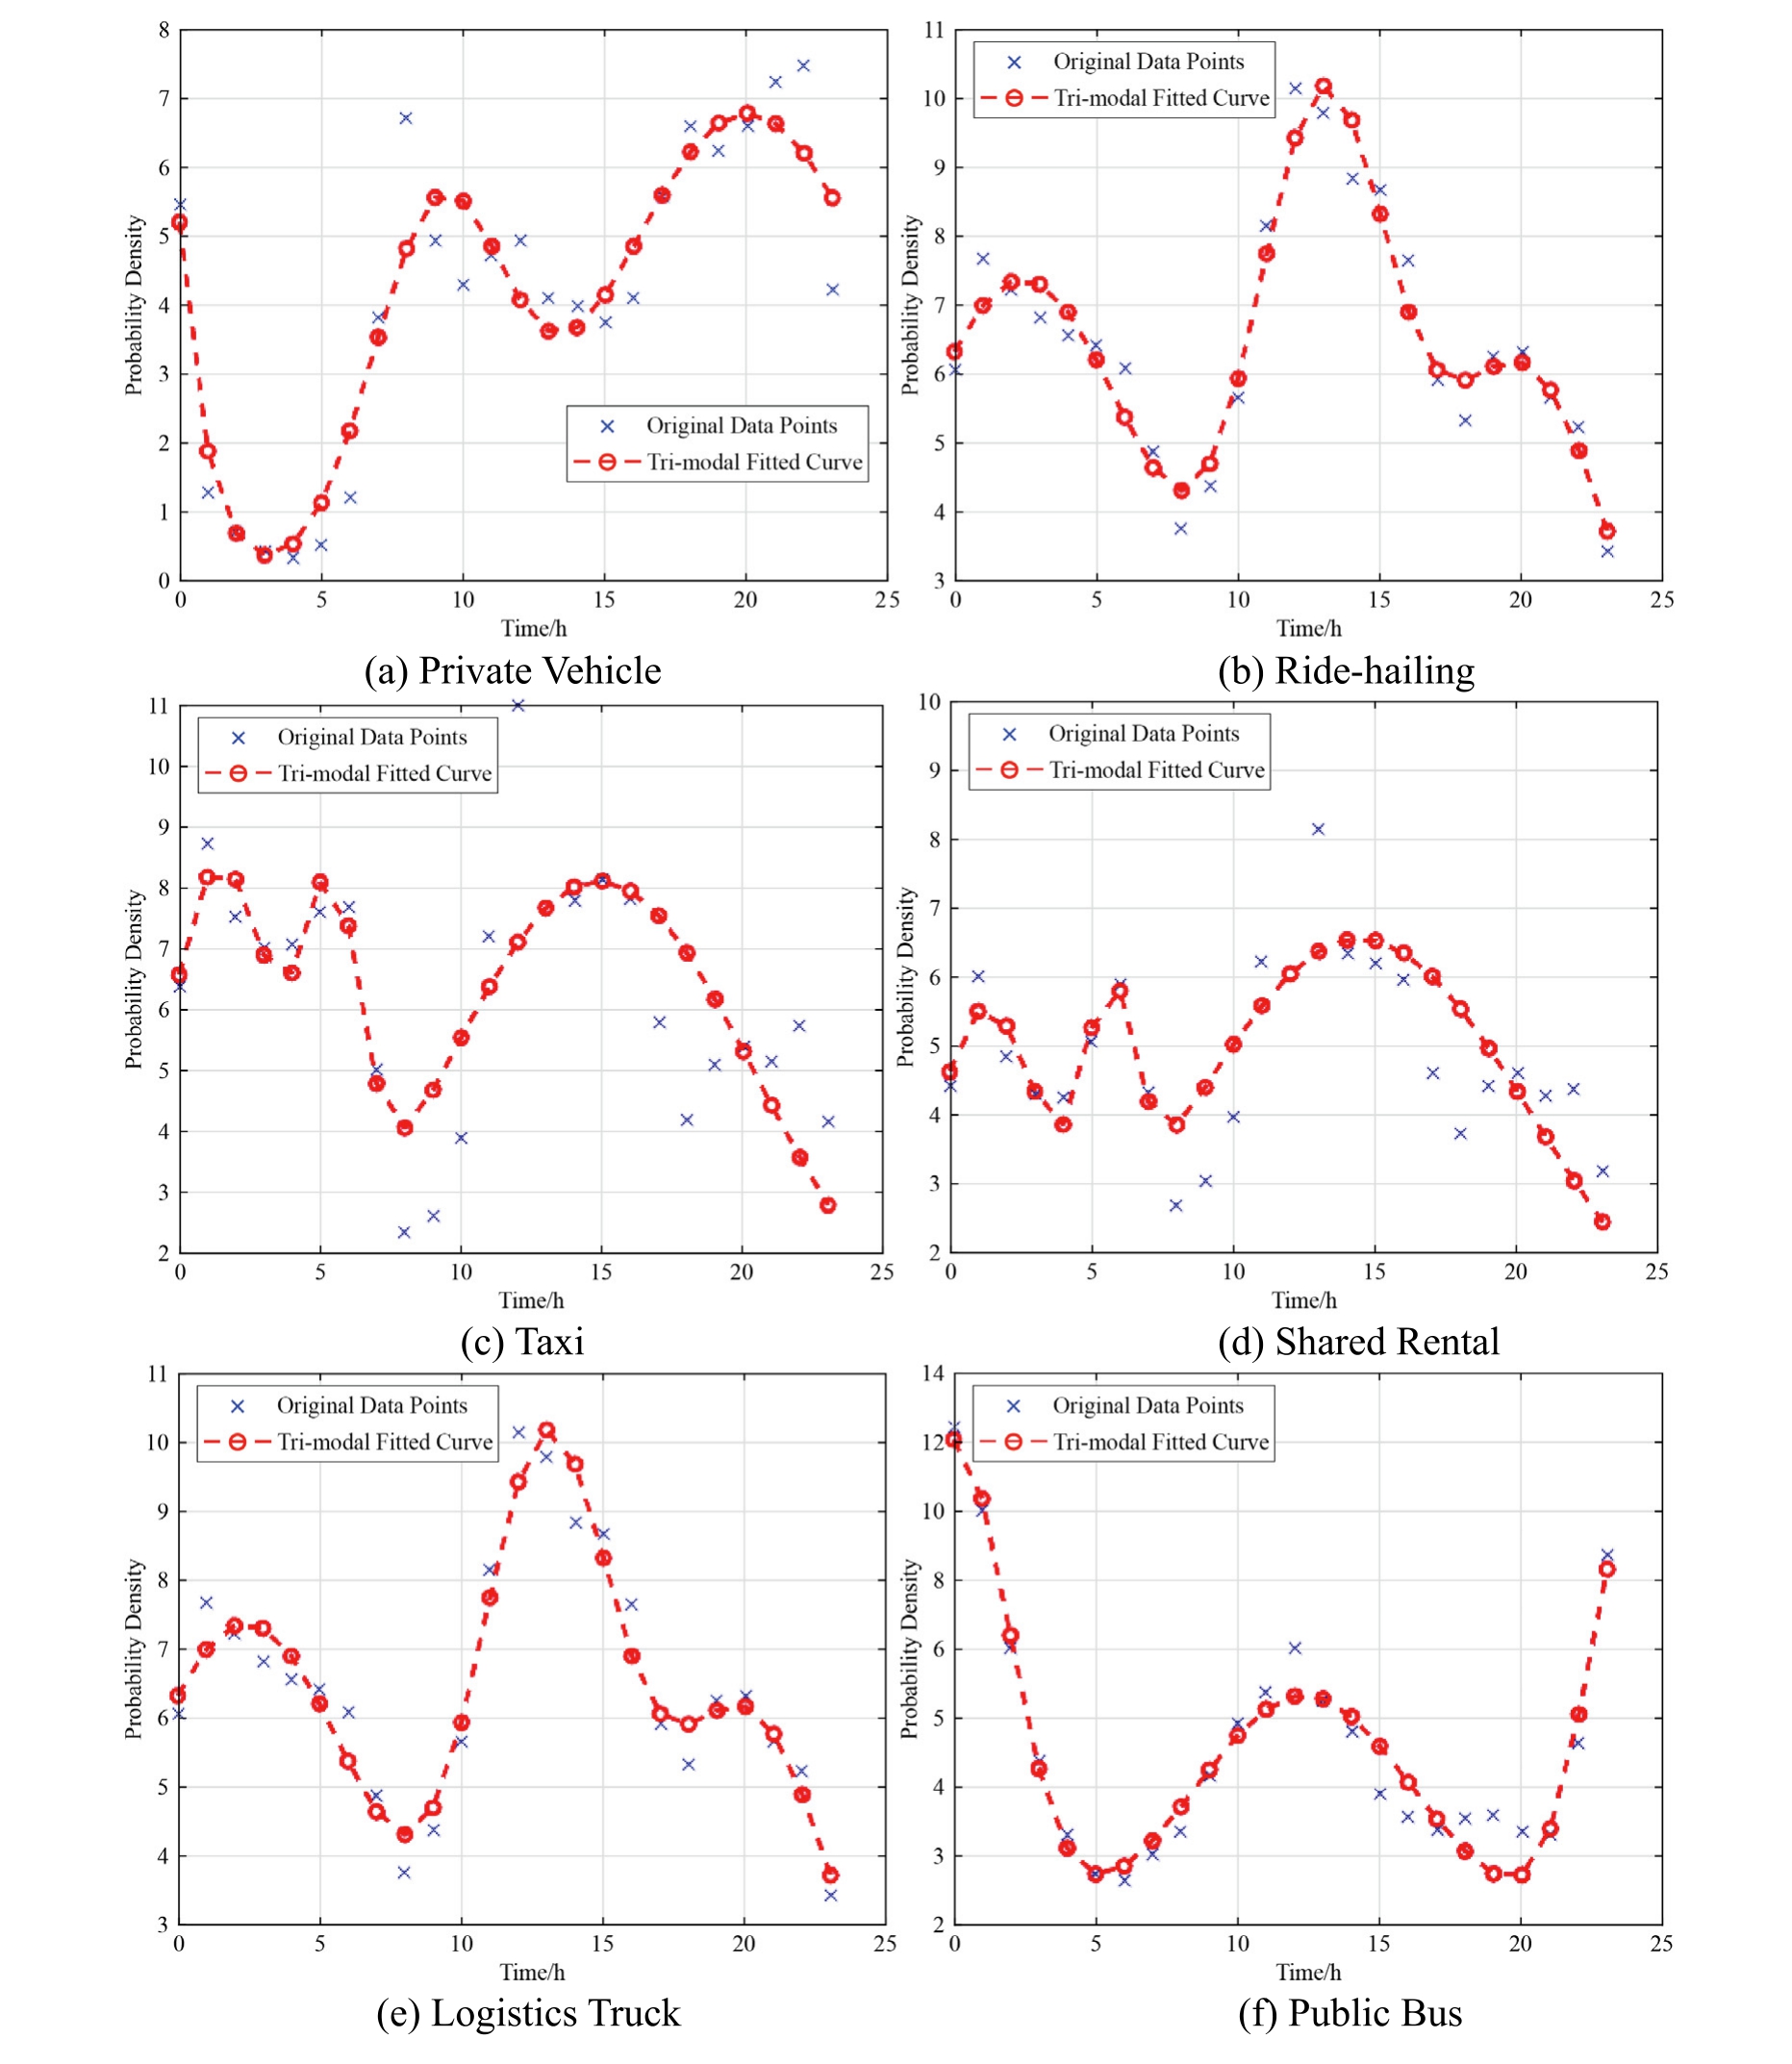
Fig. 4. Data fitting results of charging start time.
Fig. 5(d) (shared rental vehicles) and Fig. 5(c) (taxis)display highly similar load simulation curves, with triple peaks occurring around 5:00, 15:00, and nighttime. This pattern reflects shared charging demand characteristics under high utilization rates and temporal user mobility patterns. Specifically, the 5:00 peak aligns with premorning rush hour preparation; the 15:00 peak corresponds to afternoon usage and high-frequency daytime operations; nighttime peaks associate with reduced operational demand and centralized post-service charging.Notably, significant differences exist in peak magnitudes and distributions between these two categories.Traditional taxis exhibit nearly identical peak loads(~70 MW) across all three periods, resulting from their 24/7 operational model and professional drivers’ regulated charging behaviors. This equilibrium demonstrates taxis’adaptive charging patterns across temporal demand variations, effectively avoiding concentrated load pressures.
Table 5 Monthly average charging frequency and mode distribution by BEV type.
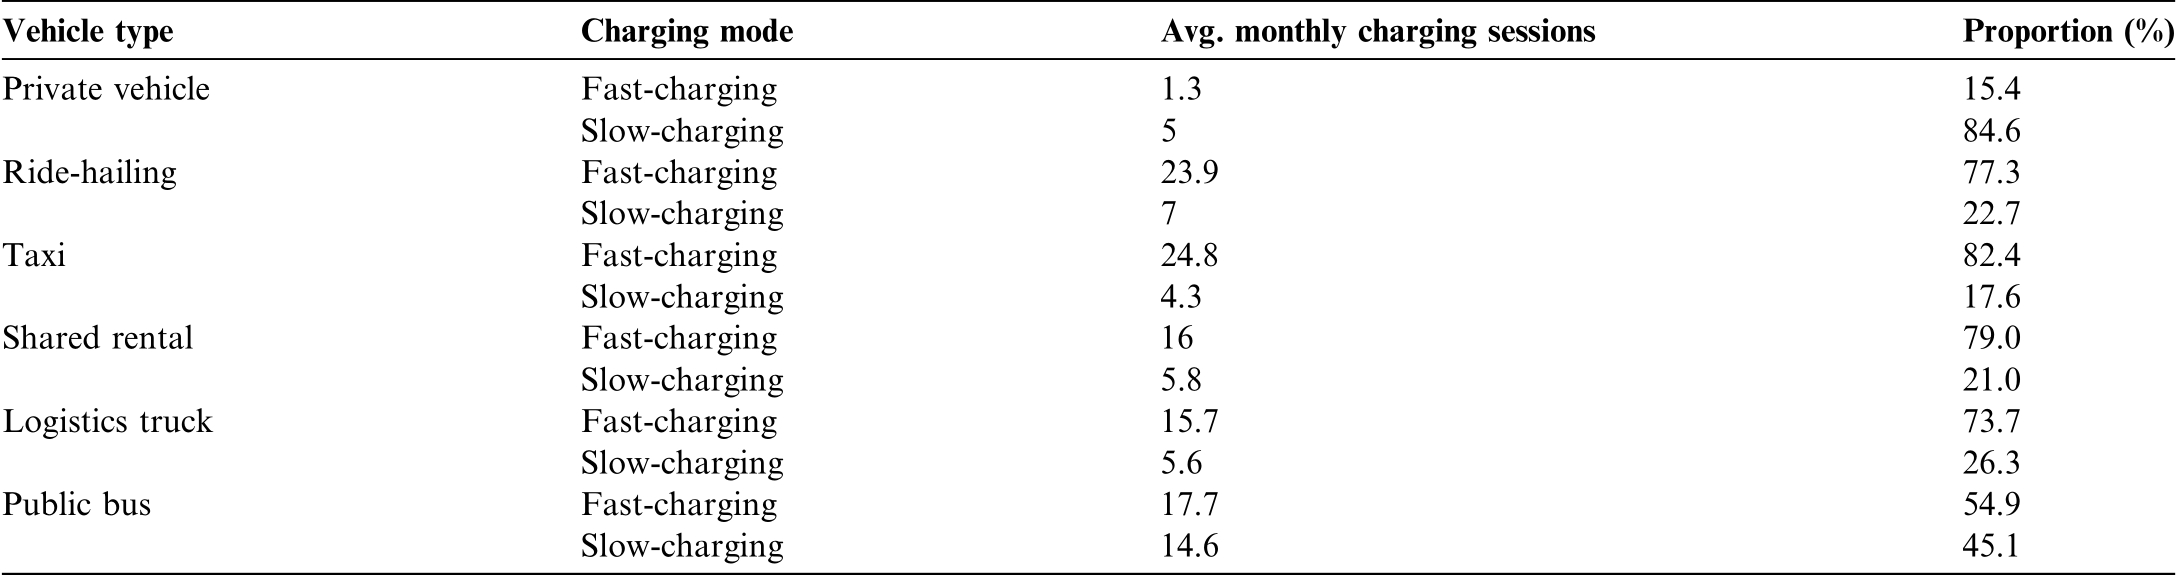
Table 6 Key parameters of six BEV categories.
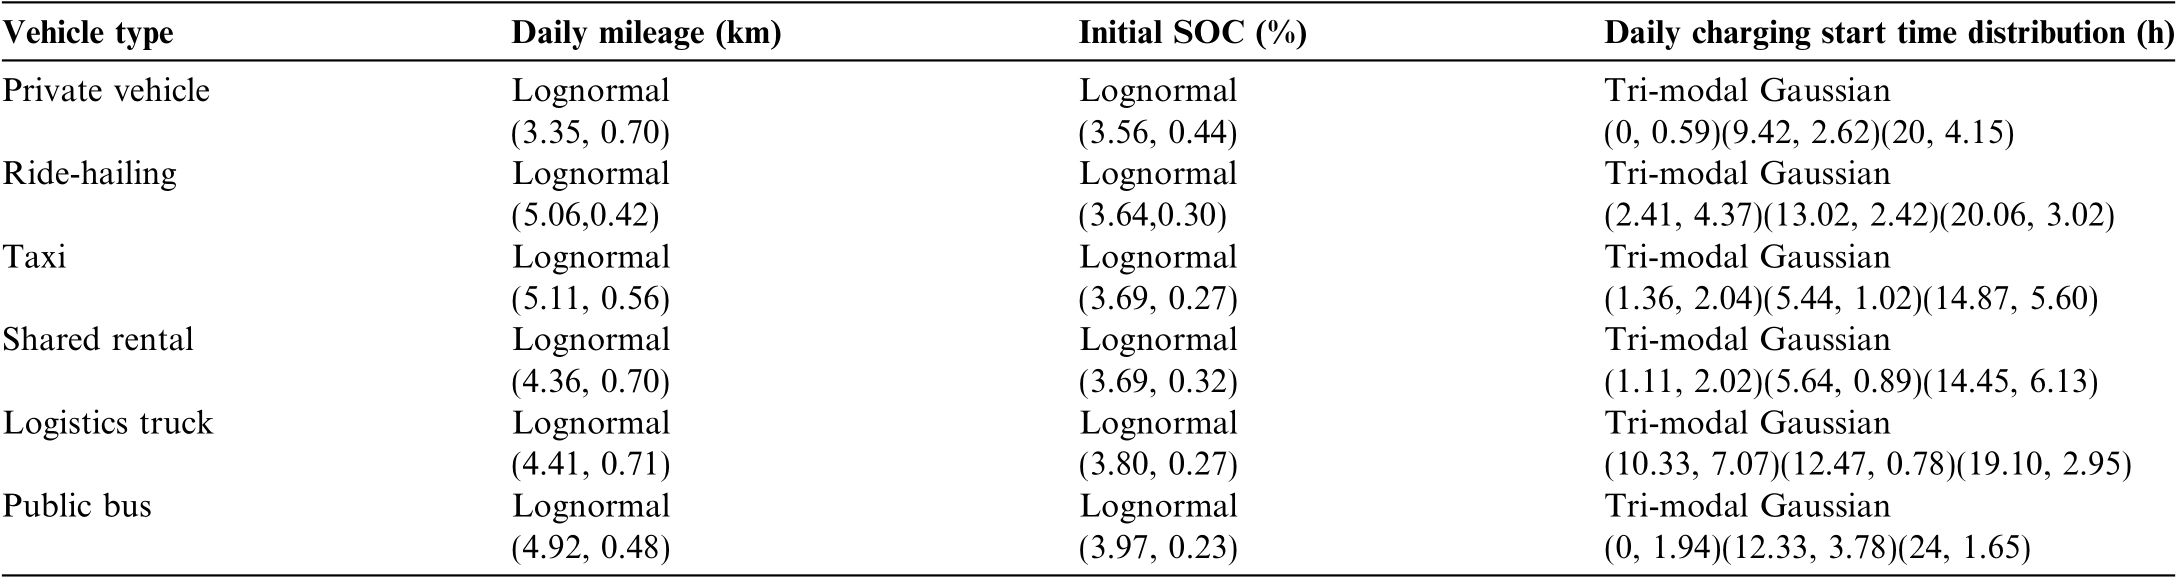
Table 7 Estimated cumulative registrations and online rates of BEVs in Hebei province.

In contrast, the charging load of shared rental vehicles shows a significantly higher peak at 5:00 (reaching 20 MW) compared to other periods, with relatively lower load levels at 15:00 and nighttime. This characteristic primarily reflects the operational model and user behavior impacts on shared rental vehicles. As shared rental vehicles are predominantly used by general consumers, their charging behaviors heavily depend on users’ return times and rental demand distribution. The 5:00 peak may correlate with concentrated vehicle returns before morning rush hours, coupled with operators’ centralized vehicle dispatching and charging during this period, which further intensifies charging load concentration. Additionally, differences in charging infrastructure utilization patterns between the two vehicle types contribute to load distribution variations. Traditional taxis, often equipped with dedicated charging facilities, exhibit charging behaviors controlled by operational schedules, thereby reducing load unevenness.Conversely, shared rental vehicles predominantly rely on public charging networks, making their charging patterns more susceptible to public infrastructure layouts and temporal user demand fluctuations, leading to concentrated loads during specific periods.
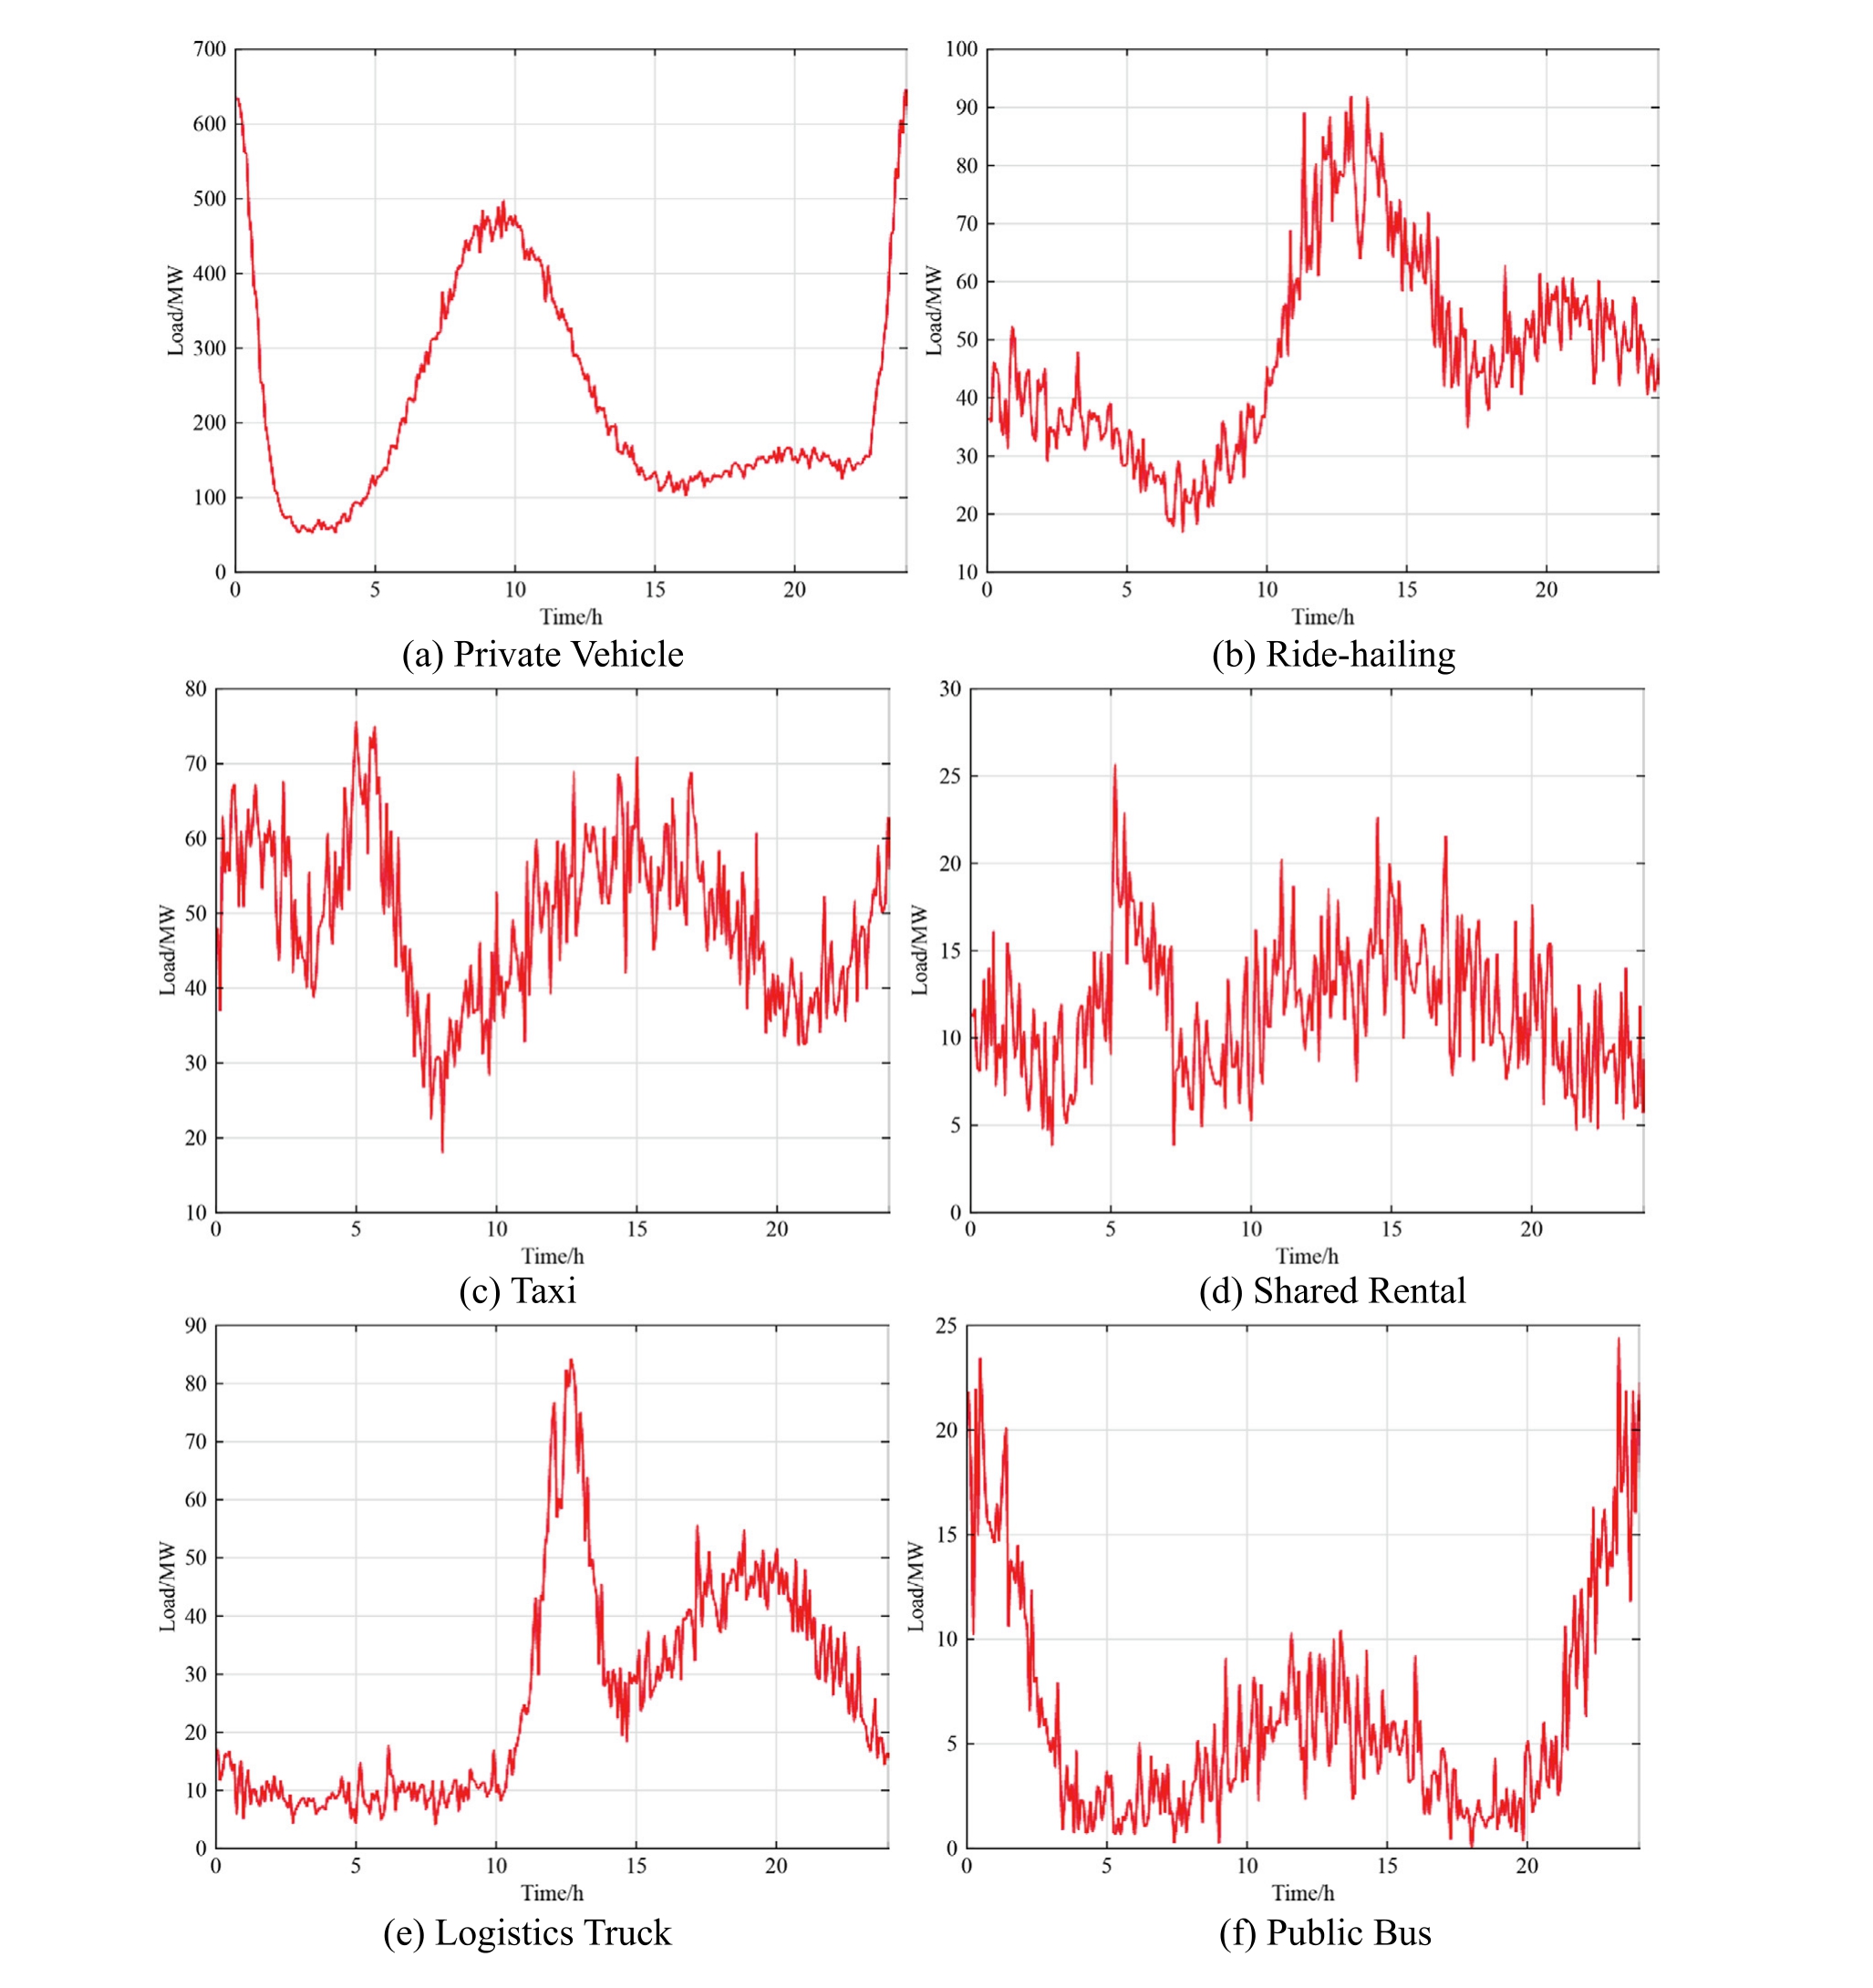
Fig. 5. Daily charging load simulation by BEV type.
Fig. 6 displays the daily load simulation results for six categories of battery electric vehicles. It is evident that private vehicles constitute the primary contributor to the total load, followed by ride-hailing vehicles and taxis.The overall load curve exhibits distinct dual-peak characteristics, with two major peaks occurring near midday and nighttime, reaching 600 MW and 800 MW respectively. Additionally, the difference between the lowest valley load and peak loads exceeds 600 MW.Such significant peak-valley disparities substantially intensify grid load fluctuations, posing considerable challenges to grid stability and operational security.
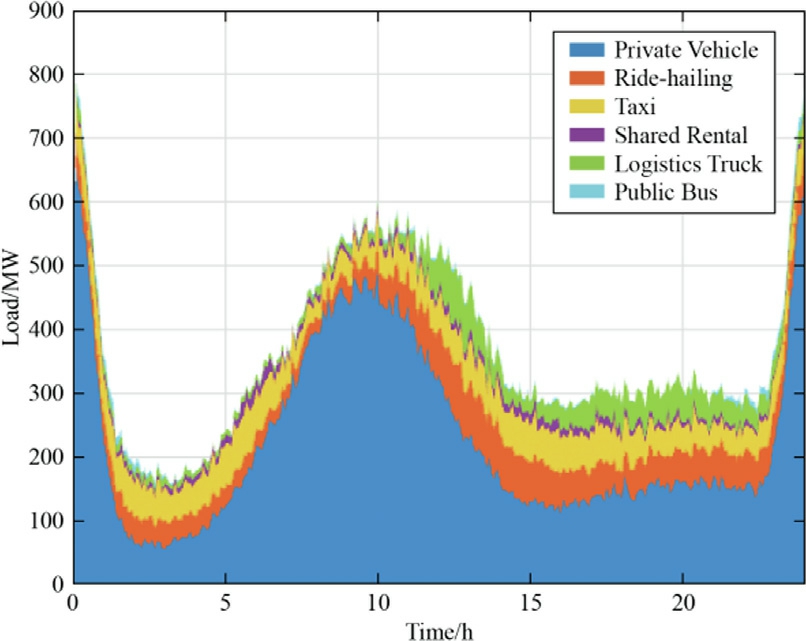
Fig. 6. Aggregated daily charging load of Six BEV categories.
3.2 Recommendations
1)Optimizing Charging Infrastructure Layout and Peak Load Management
EV charging loads exhibit pronounced temporal peaks during midday and nighttime. To alleviate grid stress, governments should enhance charging infrastructure planning in high-demand zones such as residential areas, commercial districts, and transportation hubs. Big data analytics can predict regional charging demands to strategi cally deploy charging stations and piles. Time-of-use charging management should be implemented to incentivize off-peak charging,mitigating load concentration and improving grid dispatching efficiency.
2)Promoting Differentiated Pricing and Smart Charging Technologies
A tiered electricity pricing mechanism with peak/off-peak rates should be adopted to guide users toward lowdemand periods. This approach balances grid loads while optimizing charging facility utilization. Concurrently,smart charging systems sho uld be widely deployed,enabling real-time monitoring and adaptive adjustments of charging schedules and power levels to distribute loads evenly across 24-h cycles.
3) Accelerating Smart Grid Development for Enhanc ed Load Dispatching
Increasing EV penetration intensifies grid load volatility and dispatching complexity. To address this, smart grid modernization must prioritize advanced load forecasting and dispatching technologies. Integrating big data, cloud computing, and artificial intelligence will strengthen realtime load monitoring and adaptive dispatching capabilities. Intelligent grids can dynamically adjust power supply based on demand fluctuations, ensuring stable operations during EV charging peaks while minimizing grid congestion and energy waste.
4 Conc lusions
This study conducted a detailed analysis of charging load characteristics for six categories of BEVs using a Monte Carlo simulation model integrated with probability distribution functions. By defining key parameters including charging start time, initial SOC, daily mileage,and charging duration, a statistical model was developed to characterize EV users’ charging behaviors.Probability distribution fitting for the six BEV categories was performed in MATLAB, with mathematical expectations and variances calculated under each parameter for simulation. Using Hebei Province as a case study, cumulative daily average load curves and aggregated load profiles were derived for all vehicle types. The results demonstrate significant heterog eneity in charging loads across vehicle categories: private vehicles dominate total load contributions, exhibiting pronounced peaks during nighttime and midday periods;ride-hailing vehicles and logistics trucks display concentrated load peaks, particularly during midday intervals;shared rental vehicles and taxis exhibit relatively stable load fluctuations despite temporal clustering; public buses show exclusive nighttime charging loads, reflecting centralized replenishment needs after high-frequency daytime operations.
This research provides quantitative foundations for understanding grid-connected EV load characteristics,offering critical insights for grid dispatching and charging infrastructure optimization. Future studies should focus on charging load regulation strategie s, smart charging technology applications, and intelligent grid management to enhance grid resilience and facilitate efficient vehiclegrid coordination.
CRediT authorship contribution statement
Kun Wei: Conceptualization. Guang Tian: Writing –original draft, Methodology, Software. Yang Yang: Writing – review & editing, Project administration, Investigation, Formal analysis. Xufeng Zhang: Formal analysis,Investigation, Methodology, Software. Yuanying Chi:Writing – review & editing, Funding acquisition, Conceptualization. Yi Zheng: Writing – original draft, Data curation.
Funding
This research was funded by Humanities and Social Sciences of Ministry of Education Planning Fund of China, grant number 21YJA790009; National Natural Science Foundation of China, grant number 72140001.
Declaration of competing interest
The authors declare the following financial interests/personal relationships which may be considered as potential competing interests: Kun Wei, Guang Tian and Yang Yang are currently employed by State Grid Hebei Electric Power Co., Ltd.
References
[1]Y. Chen, X. Lei, S. Niu, et al., Trustworthy V2G scheduling and energy trading: a blockchain-based framewor k,eTransportation 22(2024) 100376.
[2]F. Renhai, W. Khan, A. Tariq, et al., Adaptive non-parametric kernel density estimation for under-frequency load shedding with electric vehicles and renewable power uncertainty, Sci. Rep. 15 (1)(2025) 11499.
[3]S. Shen, R. Habeeb, N. Alirezaei, et al., A heuristic for bidirectional charging of fleet EVs, in: 2024 IEEE Sustainable Power and Energy Conference, ISPEC, 2024, pp. 595–601.
[4]Y. Meng, Y. Sun, L. Zhao, et al.,A hierarchical robust scheduling framework for electric vehicle aggregators in coupled spot and ancillary service markets, Energy 332 (2025) 137113.
[5]Q. Li, F. Dong, G. Zhou, et al., Co-optimization of virtual power plants and distribution grids: emphasizin g flexible resource aggregation and battery capacity degradation, Appl. Energy 377(2025) 124519.
[6]J.P. Feng, X.Q. Chang, Y. Fan, et al.,Electric vehicle charging load prediction model considering traffic conditions and temperature,Processes 11 (8) (2023) 2256.
[7]H.L. Wang, Y.J. Zhang, H.P. Mao, Electric vehicle charging load forecasting method based on temporal charging probability,Electr.Power Autom. Equip. 39 (3) (2019) 207–213.
[8]Z.H. Chen, J. Zhu, Y.F. Wang, et al.,Electric vehicle charging load modeling method based on consistent K-means clustering,Modern Electric Power 39 (3) (2022) 338–348.
[9]X.M. Long, J. Yang, F.Z. Wu, et al.,Electric vehicle charging load forecasting considering road-grid interaction and user psychology,Autom. Electr. Power Syst. 44 (14) (2020) 86–93.
[10]M.X. Zhang, Q.J. Sun, X. Yang, Electric vehicle charging load forecasting considering multi-source real-time interaction and user regret psychology, Power Syst. Technol. 46 (2) (2022) 632–645.
[11]X.L. Yang, J.W. Yun, S. Zhou, et al.,A spatiotemporal distribution prediction model for electric vehicles charging load in transportation power coupled network, Sci. Rep.15(1)(2025)4022.
[12]L.J. Zhang, C.Q. Xu, L.L. Wang, et al., Spatiotemporal distribution prediction of EV charging load based on OD matrix,Power Syst. Prot. Control 49 (20) (2021) 82–91.
[13]L.Buzna,P.De Falco,G.Ferruzzi,et al., An ensemble methodology for hierarchical probabilistic electric vehicle load forecasting at regular charging stations, Appl. Energy 283(2021)116337.
[14]H.Y. Li, Z.B. Du, L.D. Chen, et al., EV charging load forecasting model based on travel simulation and V2G evaluation, Autom.Electr. Power Syst. 43 (21) (2019) 88–96.
[15]S.P. Lu, L.M. Ying, X. Wang, et al., Fast-charging station load forecasting and optimal dispatch based on user travel simulation,Electr. Power Construct. 41 (11) (2020) 38–48.
[16]X. Zhang, K.W. Chan, H. Li, et al., Deep-learning-based probabilistic forecasting of electric vehicle charging load with a novel queuing model, IEEE Trans. Cybern. 51 (6) (2020) 3157–3170.
[17]P. Aduama, Z.B. Zhang, A.S. Al-Sumaiti, Multi-feature data fusion-based load forecasting of electric vehicle charging stations using a deep learning model, Energies 16 (3) (2023)1309.
[18]L.T.L. Xu, Research on V2G optimal dispatch strategy for electric vehicles based on power load prediction, Shenzhen University,2022 (PhD Dissertation).
[19]M.H. Pham, M.N. Nguyen, Y.K. Wu, A novel short-term load forecasting method by combining the deep learning with singular spectrum analysis, IEEE Access 9 (2021) 73736–73746.
[20]Q.S. Luo, Charging station load forecasting and V2G pricing strategy based on spatiotemporal information, University of Chinese Academy of Sciences, 2022 (PhD Dissertation).
[21]J. Feng, J. Yang, Y. Li, et al., Load forecasting of electric vehicle charging station based on grey theory and neural network,Energy Rep. 7 (S6) (2021) 487–492.
[22]N. Cheng, P. Zheng, X.F. Ruan, et al., Electric vehicle charging load prediction based on variational mode decomposition and Prophet-LSTM, Front. Energy Res. 11 (2023) 1297849.
[23]Z. Yi, X.C. Liu, R. Wei, et al., Electric vehicle charging demand forecasting using deep learning model, J. Intell. Transp. Syst.(2021) 1–14.
[24]X.F. Xu, J.H. Wu, Y. Lu, et al., A spatio-temporal prediction approach for charging load of clustered electric vehicles in dynamic traffic flow environment of highway, Sustain. Energy Grids Netw.40 (2024) 101593.
[25]S. Rahman, I.A. Khan, A.A. Khan, et al.,Comprehensive review&impact analysis of integrating projected electric vehicle charging load to the existing low voltage distribution system, Renew.Sustain. Energy Rev. 153 (2022) 111756.
[26]J. Zhang, J. Yan, Y. Liu, et al.,Daily electric vehicle charging load profiles considering demographics of vehicle users, Appl. Energy 274 (2020) 115063.
[27]H.X. Luo, Analysis of grid-connected impacts and application suggestions for large-scale EV V2G, Popular Electr. 39 (5) (2024)33–34.
[28]B. Williams, D. Bishop, G. Hooper, et al.,Driving change:Electric vehicle charging behavior and peak loading, Renew. Sustain.Energy Rev. 189 (2024) 113953.
[29]J. Tian, Y. Lv, Q. Zhao, et al., Electric vehicle charging load prediction considering the orderly charging, Energy Rep. 8 (2022)124–134.
[30]H. Dong, in: Cluster electric vehicle grid-connected load simulation prediction and peak-shaving optimization model, North China Electric Power University, 2023, https://doi.org/10.27140/d.cnki.ghbbu.2023.000009 (PhD Dissertation).
[31]Y. Zheng, Z. Shao, Y. Zhang, L. Jian, A systematic methodology for mid-and-long term electric vehicle charging load forecasting:the case study of Shenzhen, China, Sustain. Cities Soc. 56 (2020)102084.

Received 9 March 2025;revised 4 July 2025; accepted 15 December 2025
Peer review under the responsibility of Global Energy Interconnection Group Co. Ltd.
* Corresponding authors.
E-mail addresses: day.day@126.com (K. Wei), soltian@126.com(G. Tian), yyang8958@126.com (Y. Yang), xufengzhang@bjut.edu.cn(X. Zhang), goodcyy@bjut.edu.cn (Y. Chi), zy444763866@163.com(Y. Zheng).
https://doi.org/10.1016/j.gloei.2025.12.003
2096-5117/© 2026 Global Energy Interconnection Group Co. Ltd. Publishing services by Elsevier B.V. on behalf of KeAi Communications Co. Ltd.
This is an open access article under the CC BY-NC-ND license(http://creativecommons.org/licenses/by-nc-nd/4.0/).
Kun Wei received a Bachelor’s degree in Electrical Engineering and Automation from Shanghai Jiao Tong University, and an inservice Master’s degree in Electrical Engineering from North China Electric Power University. He is currently Director of the Secretariat,Party Committee Office, State Grid Hebei Electric Power Company Limited.