
0 Introduction
With the rapid development of renewable energy in China, the share of renewable energy in the power system continues to grow, which imposes higher demands on the system’s flexibility. A photovoltaic–storage–charging station (PSCS) consists of three types of controllable resources: photovoltaics (PV), energy storage systems(ESS), and electric vehicle (EV) charging facilities.Through appropriate control strategies, such stations can improve the utilization of renewable energy,reduce operational costs and carbon emissions [1,2], and they can also participate in power system optimizat ion to obtain additional economic benefits[3]. To fully leverage the potential of PSCSs, it is necessary for an aggregator or a virtual power plant (VPP) operator to establish an aggregation model to assess the total adjustable capability of these resources.
Currently, research on PSCSs mainly focuses on siting and sizing planning as well as operation and co ntrol strategies [4], whereas systematic evaluation methods for their adjustable capability remain to be further developed. As one of the primary user-oriented flexible resources in such stations, EV charging facilities have already been widely studied in terms of controllability modeling and aggregation assessment. References [5,6] established timesequential controllability models for parked EVs and EV battery swapping stations using clustering and recursive approaches, deriving the time-sequential controllable power boundaries of EV clusters. Reference [7] developed an EV aggregation model based on Monte Carlo simulation and Markov chains, considering user randomness and socio-economic diversity. Reference [8] proposed a time-varying storage model to describe the flexibility of large-scale EV charging facilities and applied it to forecasting and control problems. Reference [9] simplified the computation of EV cluster flexibility by applying affine transformations to the flexibility polytope of individual EVs and reformulated the maximum volume innerapproximation problem into a tractable linear problem.
Regarding the aggregation modeling of more general distributed flexible resources, from the perspective of whether geographic distribution and network constraints are considered, the published methods can be categorized into station-level aggregation and network-level aggregation. The purpose of station-level aggrega tion is typically to obtain the total adjustable capability of a single station.Main approaches include polytope-based methods,Monte Carlo simulations, and style="font-size: 1em; text-align: justify; text-indent: 2em; line-height: 1.8em; margin: 0.5em 0em;">For network-level aggregation, common approaches include random sampling, mathematical optim ization,and polytope contraction methods. Reference [14] compared the feasible regions of distribution networks with network constraints obtained by random sampling and optimal power flow methods, showing that the former is more suitable for small-scale grids. Reference [15] proposed a robust capability curve model to describe the maximum active and reactive power outputs of VPP,estimating parameters using the convex hull of boundary points. Reference [16] developed a two-stage optimization model: in the first stage, constraints of distributed resources were aggregated to their connected nodes; in the second stage, an optimization model incorporating nodal constraints, branch capacities, and network constraints was formulated.Reference[17] employed adaptive robust optimization to obtain the active–reactive elliptical feasible region of VPP. Reference [18] established a stochastic flexibility evaluation model for VPP, which can be directly ap plied to unit commitment and economic dispatch problems.
In summary, the current evaluation methods of adjustable capability for PSCSs face issues such as computational complexity, inaccuracy of evaluation results, and the neglect of local constraints. In particular, most existing aggregation approaches only provide overly simplified approximations of the feasible region, which cannot accurately capture the actual decomposability of aggregated power. Moreover, few studies explicitly incorporate local transformer or substation capacity limits into the flexibility evaluation framework. To address these gaps, this paper develops an improved evaluation method that embeds low-dimensional boundaries into highdimensional models to obtain tighter outer approximations. In addition, a two-stage aggregation framework is proposed to consider local security constraints, ensuring both accuracy and practical applicability in real-world operations.
The remainder of this paper is organized as follows.Section 1 introduces the modeling framework for the adjustable capability of a single PSCS based on power–energy boundaries.Section 2 establishes the improved aggregate feasible region (AFR) model and develops the alternating optimization algorithm for solving it.Section 3 extends the method to multi-station aggregation considering local security constraints.Section 4 provides case studies. Finally, Section 5 concludes the pa per.
To improve readability, key terms and abbreviations used throughout the paper are summarized in Table 1.
1 Modeling of adjustable capability of a single PSCS based on power-energy boundaries
1.1 Modeling of individual resource adjustable capability
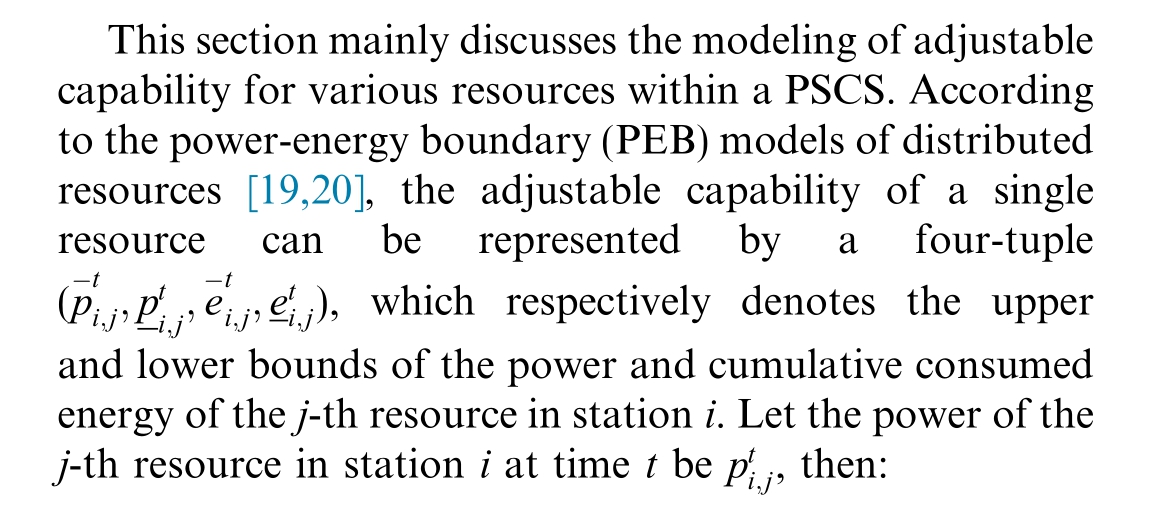
Table 1 Key terms and abbreviations.

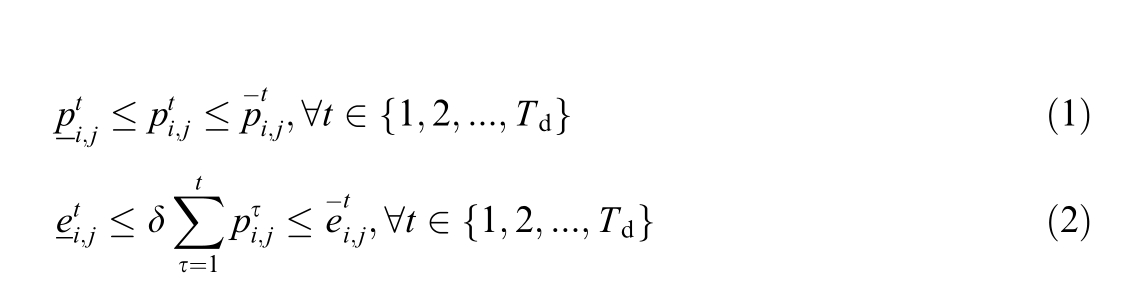
where T dTd is the total number of time intervals in a day,and δis the length of one interval. Next, the resources within a PSCS are modeled by converting their adjustable capabilities into the four-tuple form.
1.1.1 PV
The PV resource can be regarded as negative stochastic loads, where the power can be adjust ed between 0 and the actual generated power. Therefore, the upper bound of power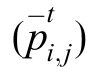 is 0, and the lower bound
 is the negative of its output curve. In this paper, a unified description is adopted using the four-tuple of power-energy boundaries,with cumulative energy upper and lower bounds calculated as follows:
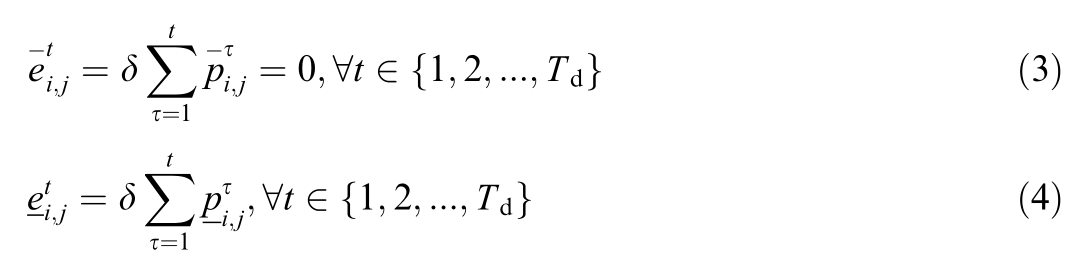
1.1.2 ESS
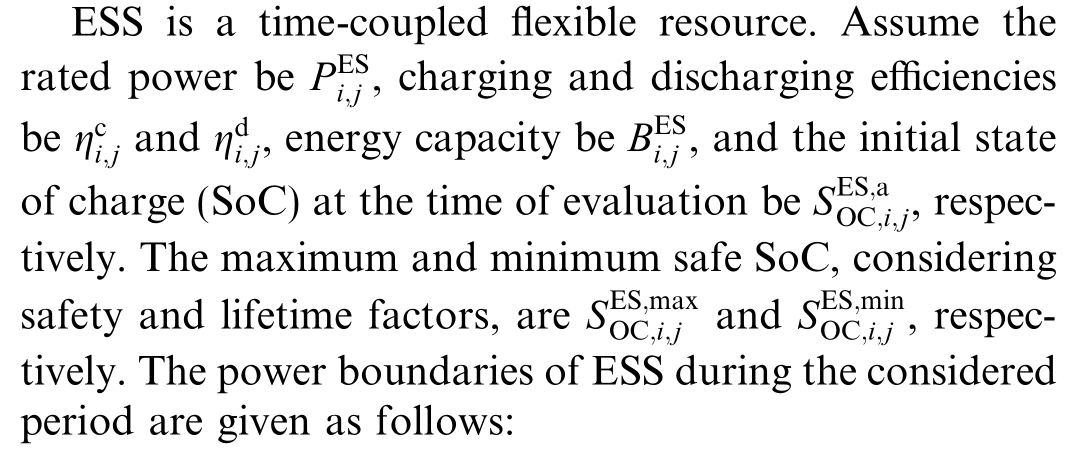

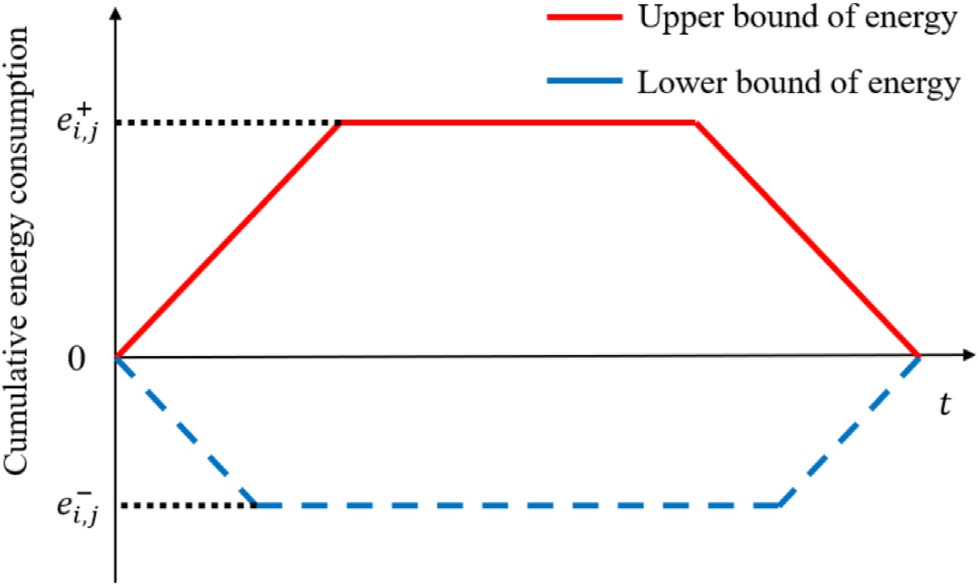
Fig. 1. Cumulative energy boundarie s of ESS.
The cumulative energy boundaries of ESS are illustrated in Fig. 1. The upper boundary represents the fastest charging traj ectory: continuous charging from the initial period until the maximum safe energy is reached, followed by discharging at maximum power to ensure the endperiod energy level matches that of the initial period.The lower boundary represents the fastest discharging trajectory: continuous discharging from the initial period until the minimum safe energy is reached, followed by charging at maximum power to maintain the end-period energy at the same level as the initial period. The maximum and minimum cumulative consumed energy are given by (7) and (8).

1.1.3 EV
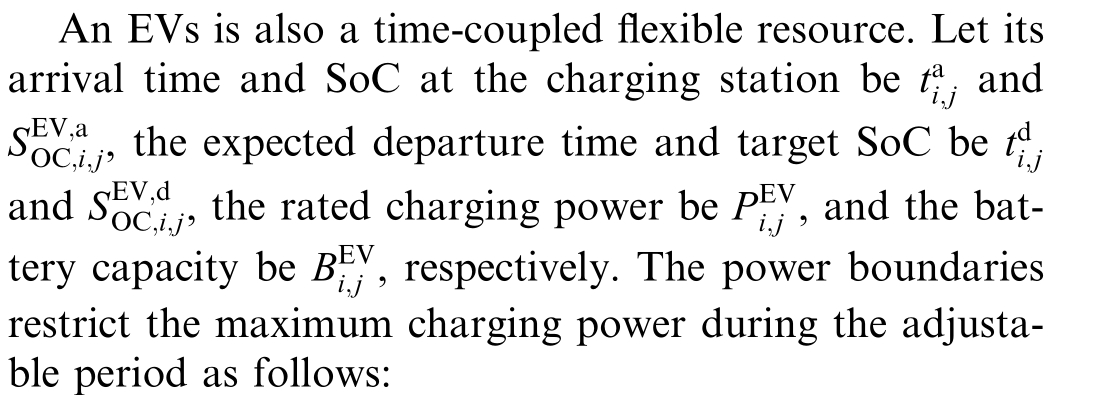
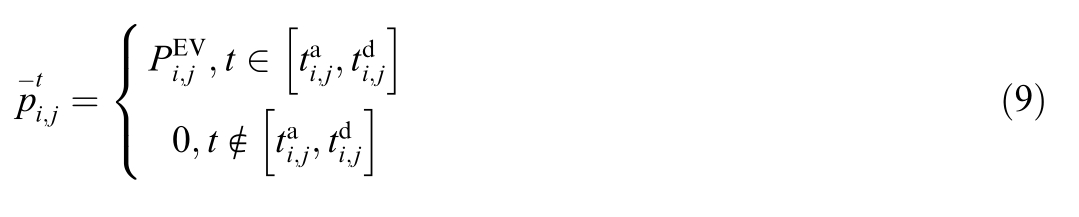
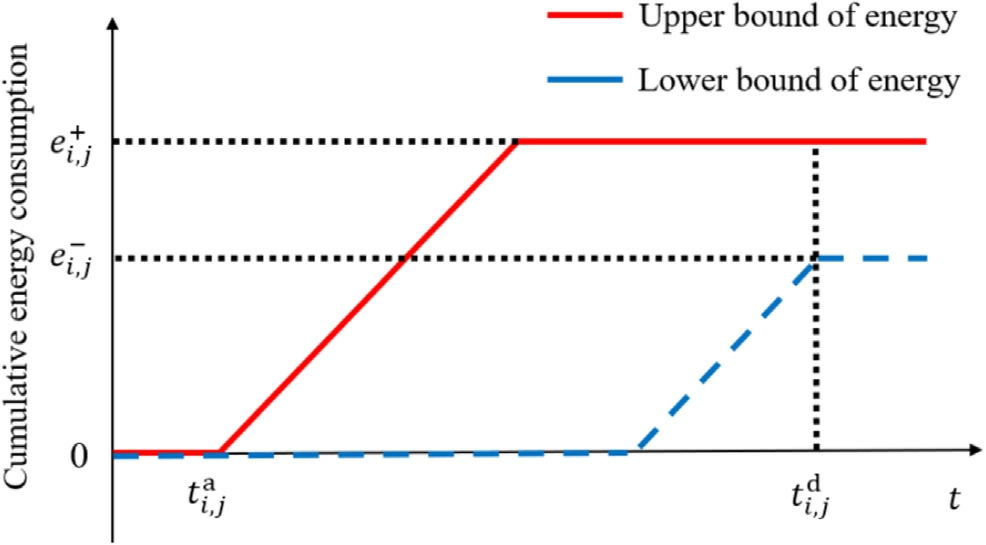
Fig. 2. Cumulative energy boundaries of EV.

The cumulative energy boundaries are shown in Fig. 2.The upper boundary represents the fastest charging trajectory: continuous charging from the connection time until the maximum capacity is reached. The lower boundary represents the slowest charging trajectory: no charging immediately after connection, followed by charging star ting at a certain time, so that the target SoC is reached exactly by the departure time.The energy consumed under these two trajectories is calculated by (11) and (12).

1.2 Adjustable capability model of a single PSCS
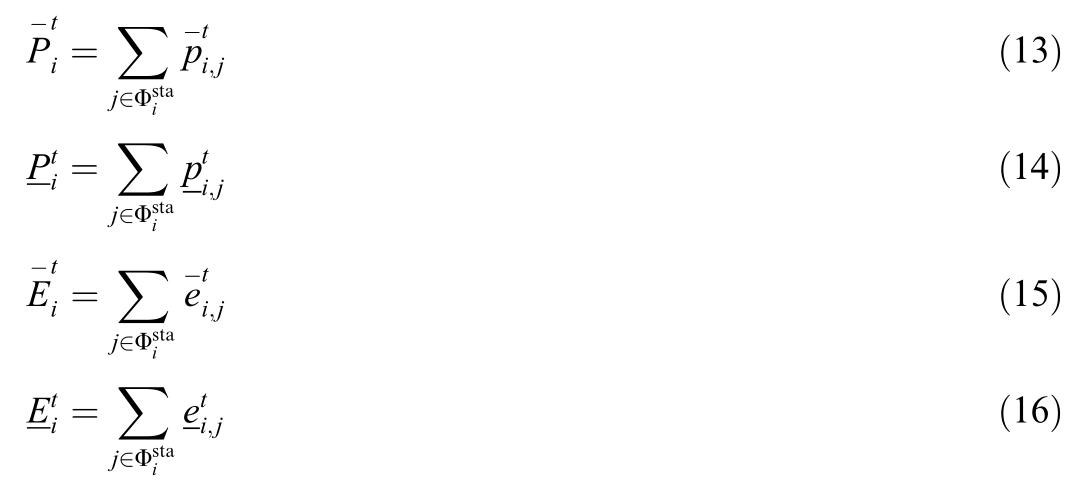
Let  denote the set of resources connected to the i-th PSCS. By summing the four-tuple parameters of all resources at station i, the aggregated power and energy boundaries of station i can be obtained by(13)–(16), which corresponds to the AFR-1 model in[21]. This model provides an outer approximation of the exact feasible region,with the advantages of simple computation. However, it may contain a certain proportion of infeasible poi nts,which prevents the total power from being successfully allocated to individual resources,thereby limiting its practical applicability.
2 Improved model of adjustable capability for a single PSCS
2.1 Improved model based on set inclusion
To reduce the infeasible region of aggregated adjustable capability evaluation at a single station by AFR-1 model,this paper adopts the more accurate AFR-2 model from[21] to improve the performance of the AFR-1 model.The AFR-2 model is formulated as follows:
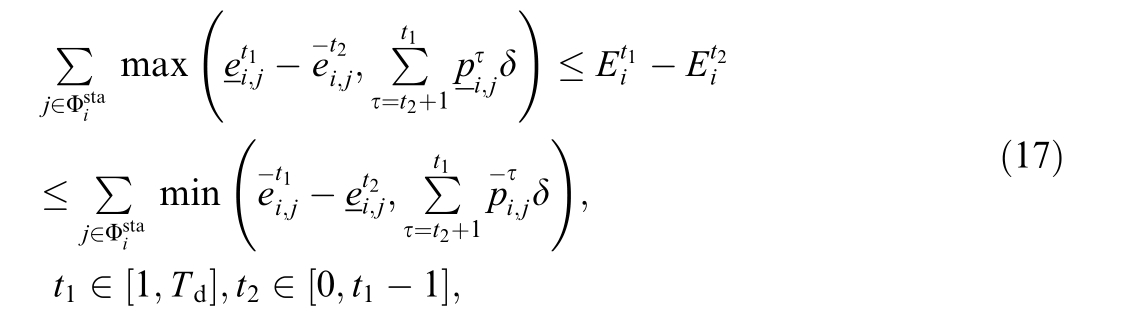
First, both the AFR-2 model and the AFR-1 model are rewritten into linear inequality systems with as the variable:

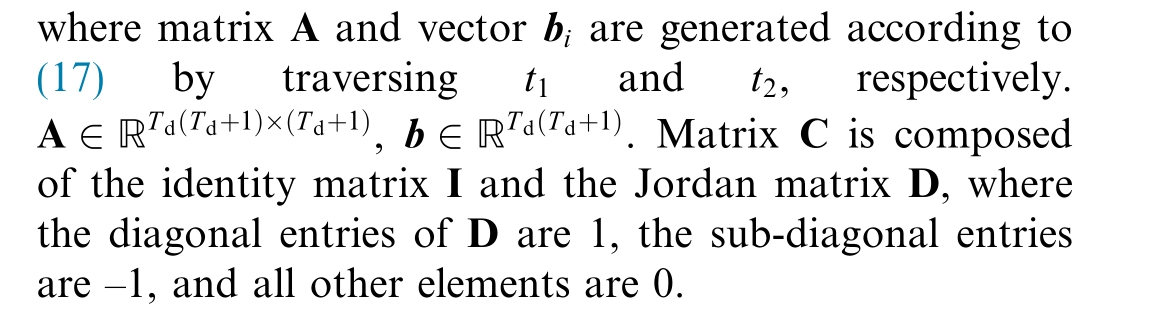
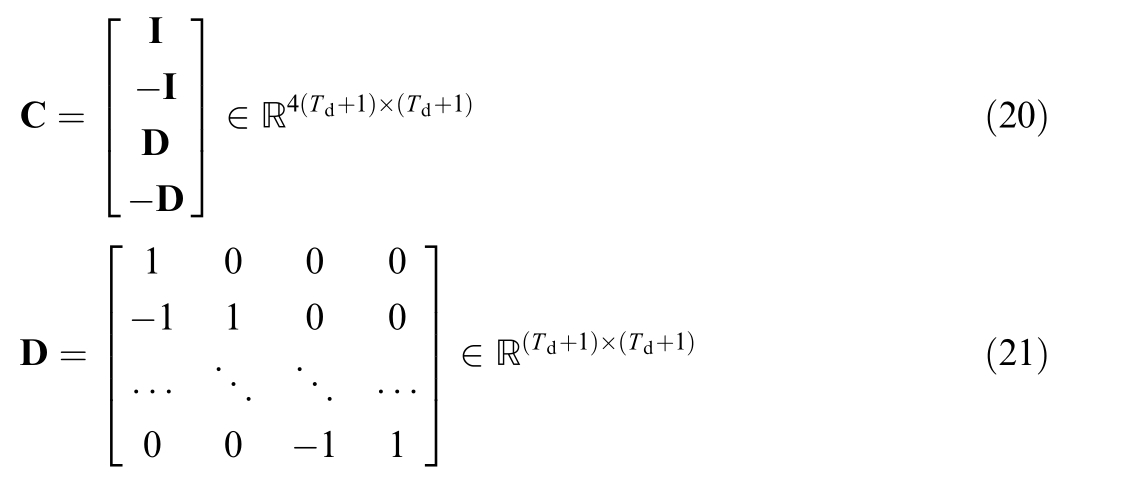
In (19), vector diis the variable to be optimized. When matrix C takes the form of (20), the meaning of is asdi follows:
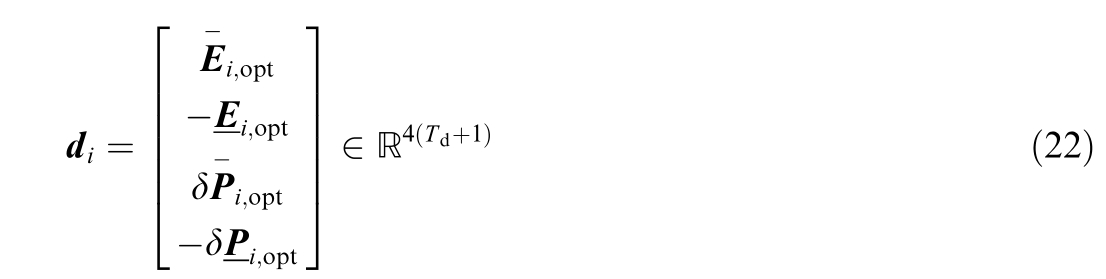
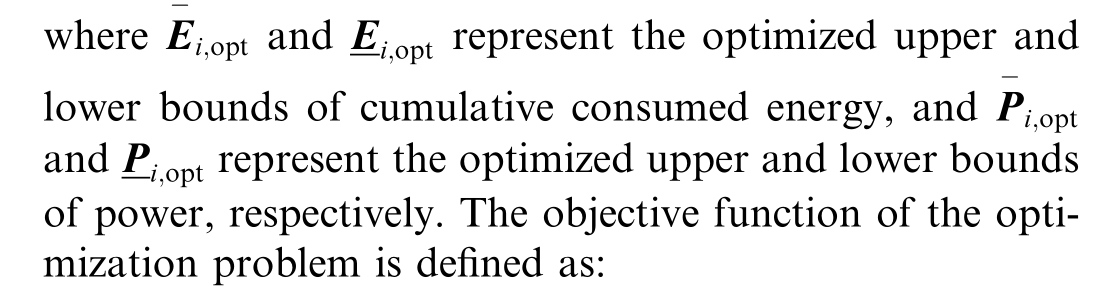
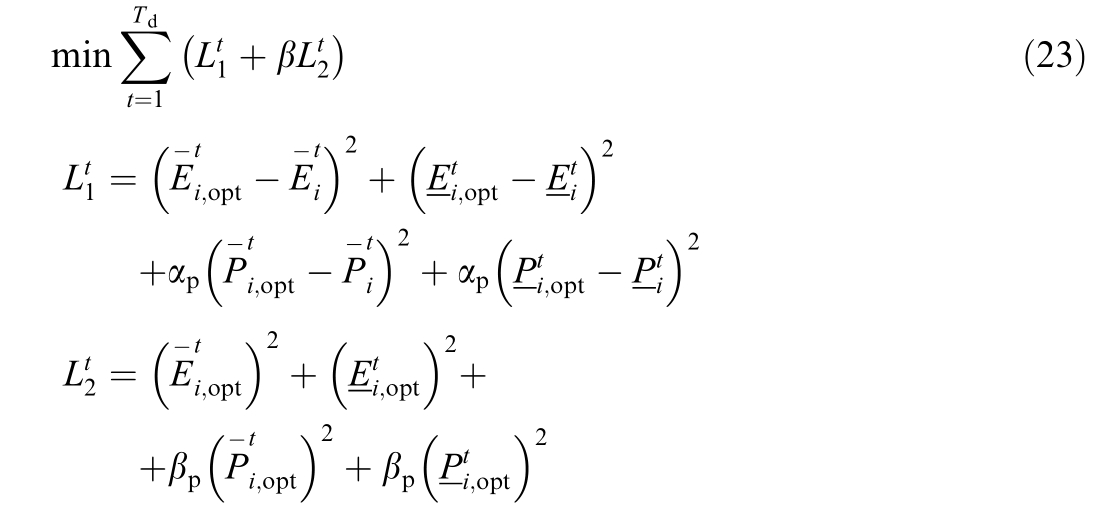
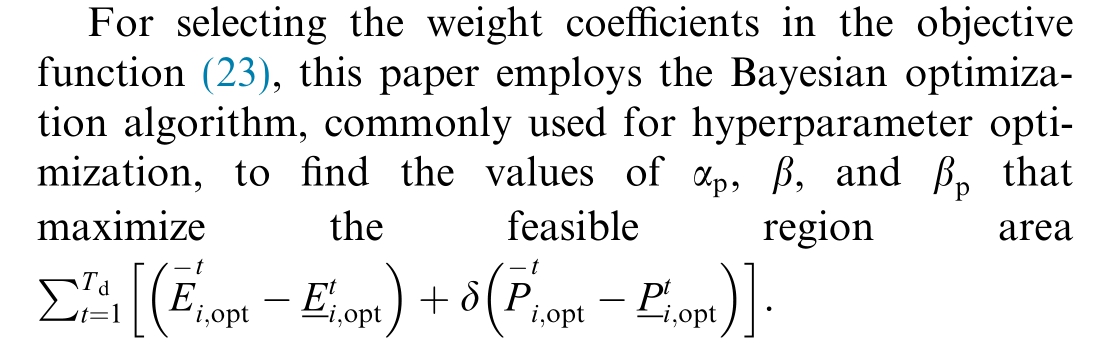
The first term minimizes the distance between the optimized boundaries and the original AFR-1 boundaries,while the second term minimizes the fluctuation of the optimized boundaries. Parameters αp, β, an dβ pare all constant c oefficients.
The constraints of the optimization problem are as follows:
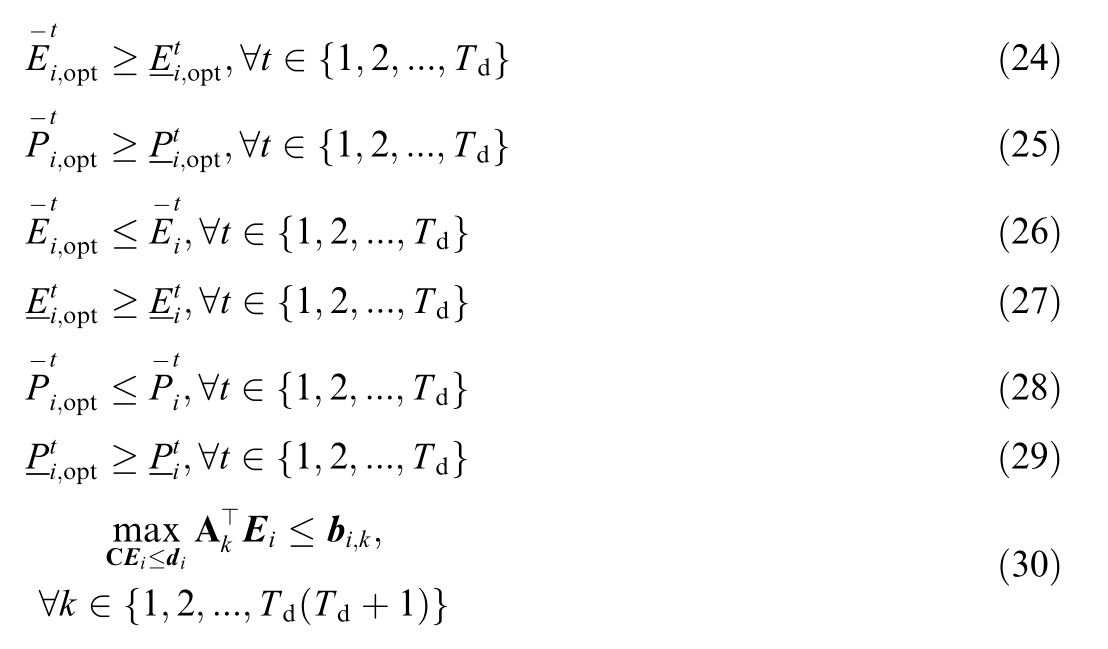
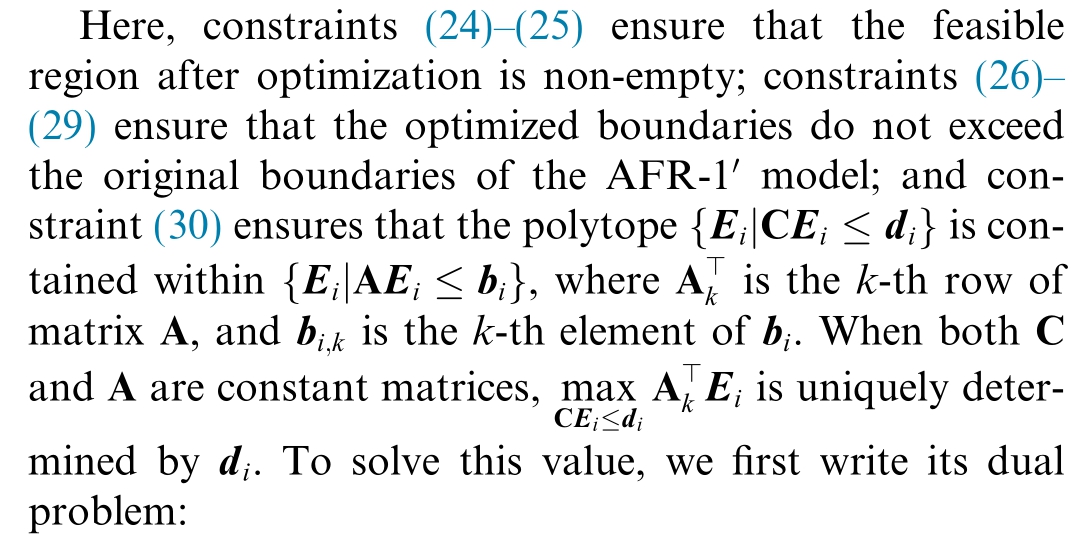


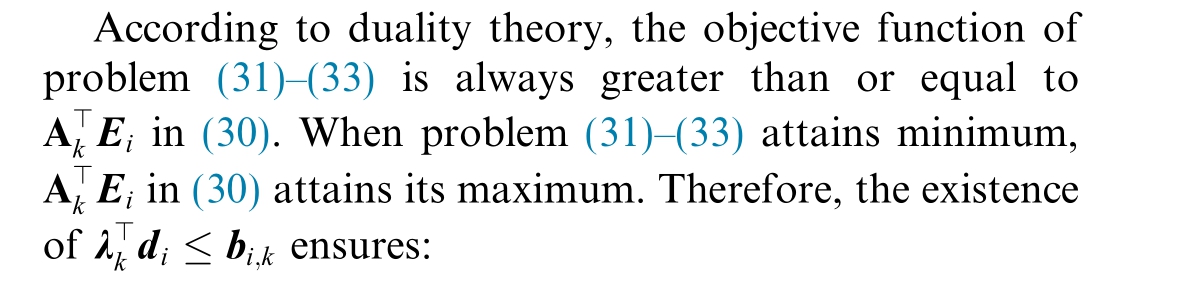

Thus, (30) is equivalent to:
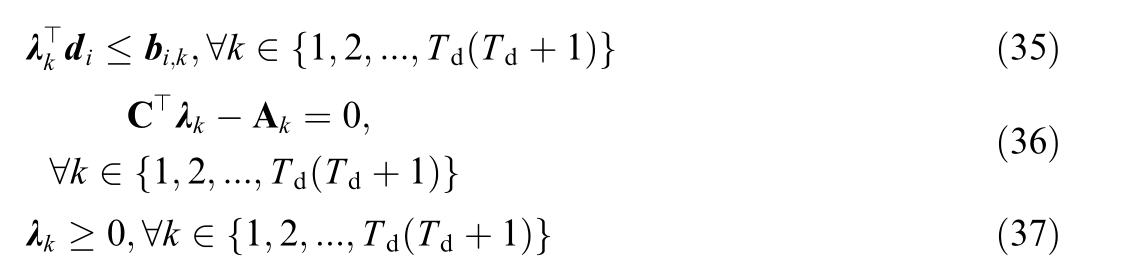
Let:
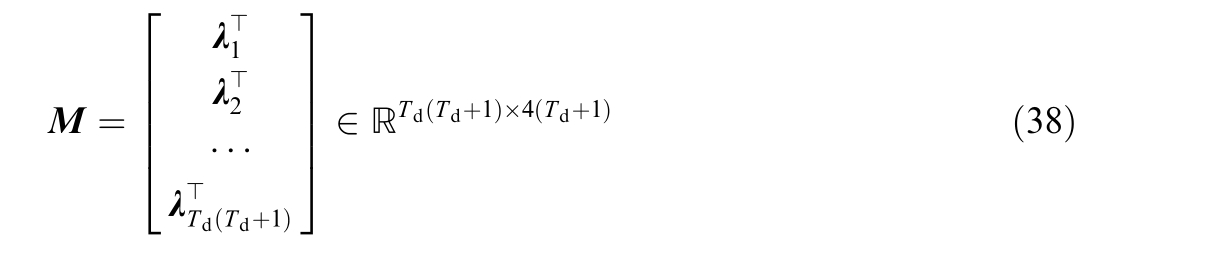
Then, (35)–(37) can be rewritten as:

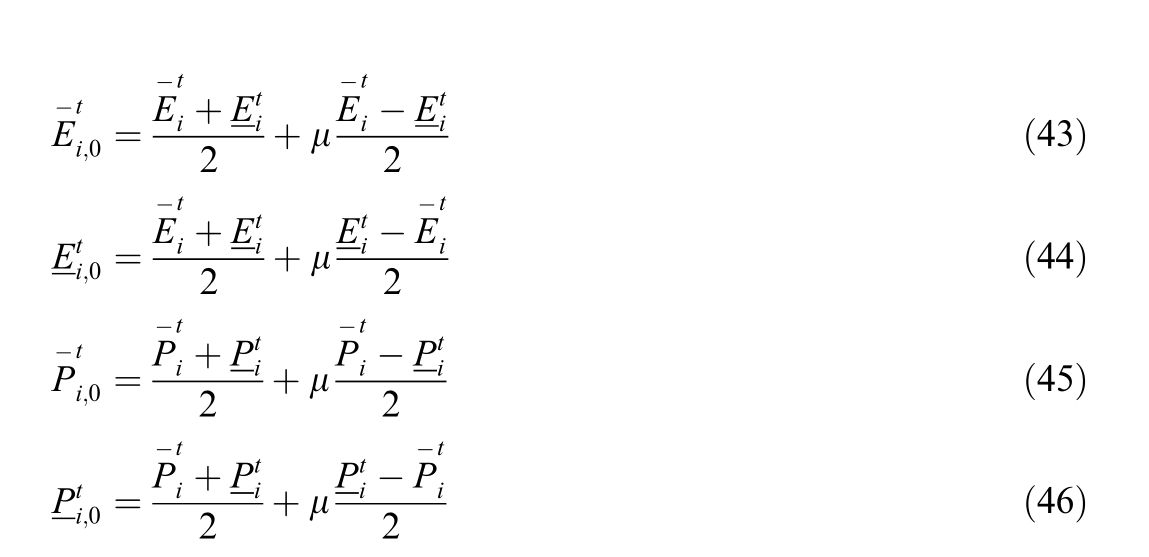
2.2 Solution method through alternating optimization
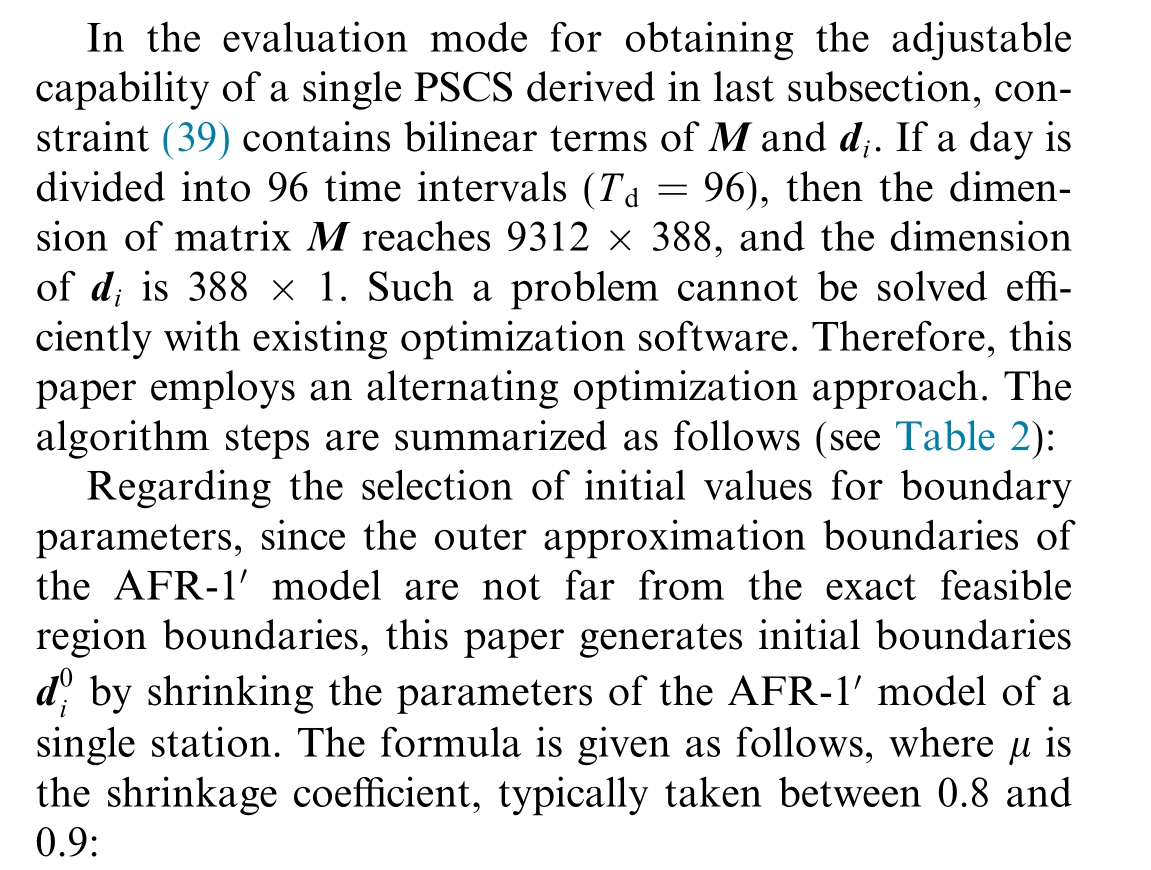
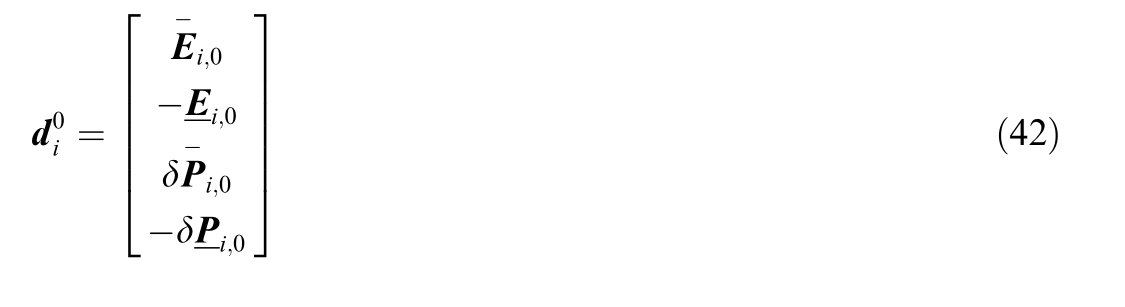
Table 2 Steps of the alternating optimization.

3 Multi-station adjustable capability model considering local security constraints
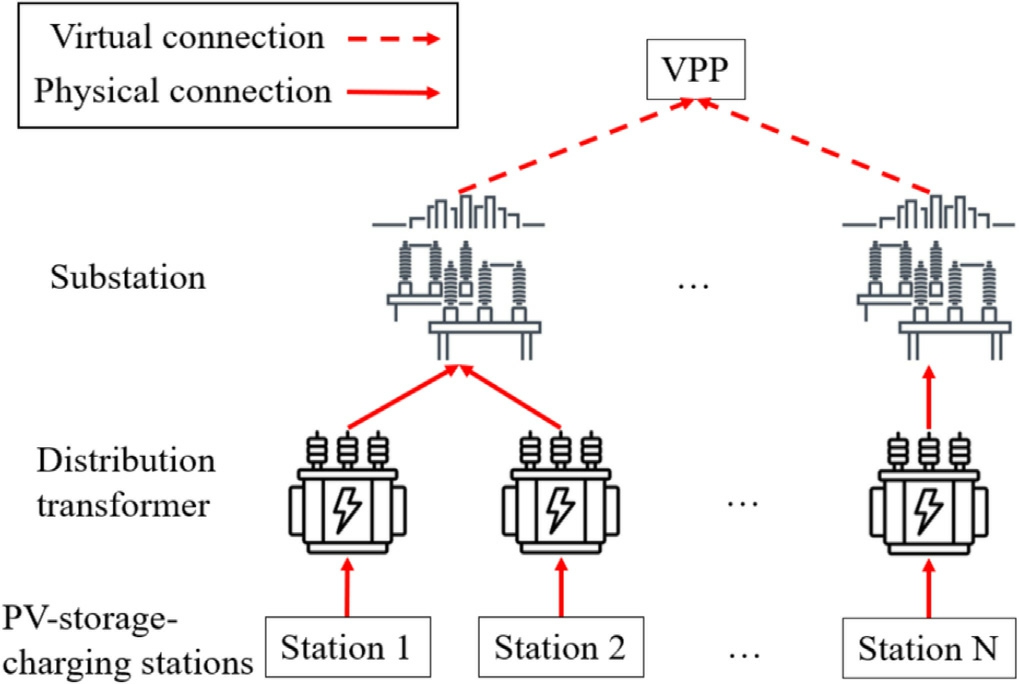
Fig. 3. Illustration of aggregating multiple stations by a VPP.
As shown in Fig. 3, when a VPP (or an aggregator) regulates its aggregated PSCSs, it must ensure local grid security at each station. Spe cifically, the power at each station must not exceed the capacity limit of its local distribution transformer and line. In addition, stations under the control of a VPP may be geographically proximate and connected to the same substation, resulting in power coupling. At the VPP level, there may also be a maximum total power constraint,such as the capacity limit set by the electricity market trading rules.
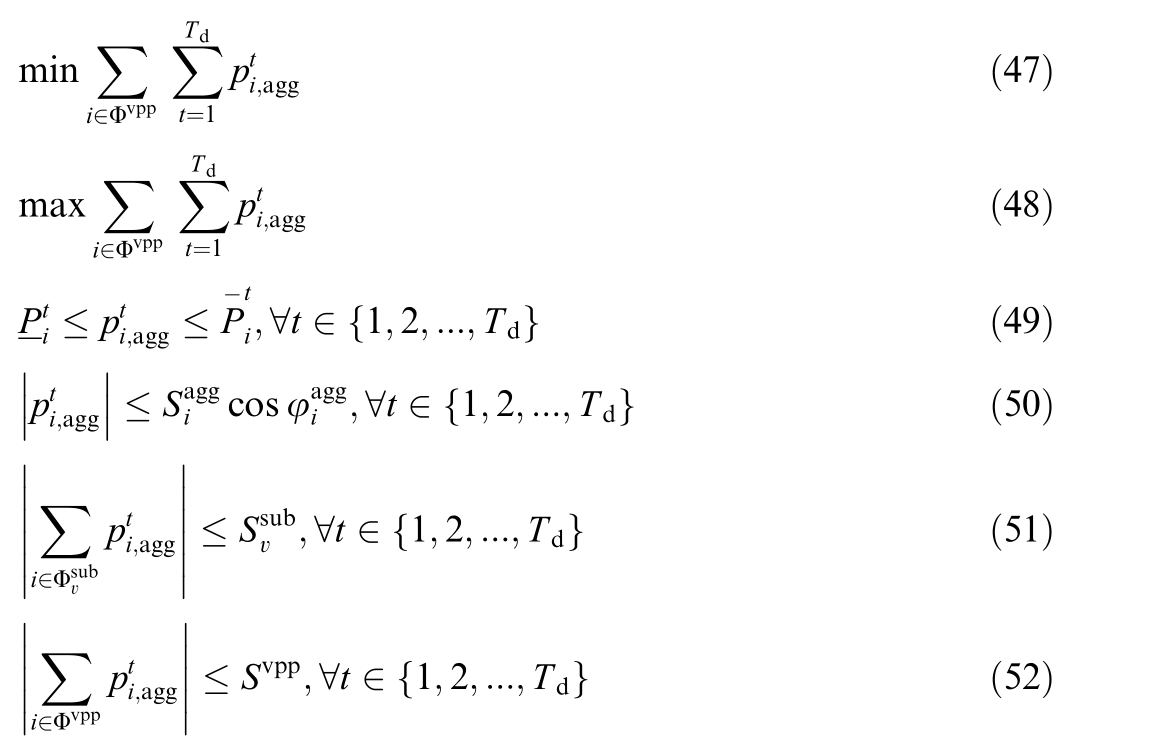
This paper formulates a two-stage optimization problem to solve for the aggregated power boundaries of a VPP. In stage 1, under the conditions of each station’s adjustable bounda ries and local security constraints, the upper boundary of the total power across multiple stations is obtained by maximizing(47), and the lower boundary is obtained by minimizing (48).
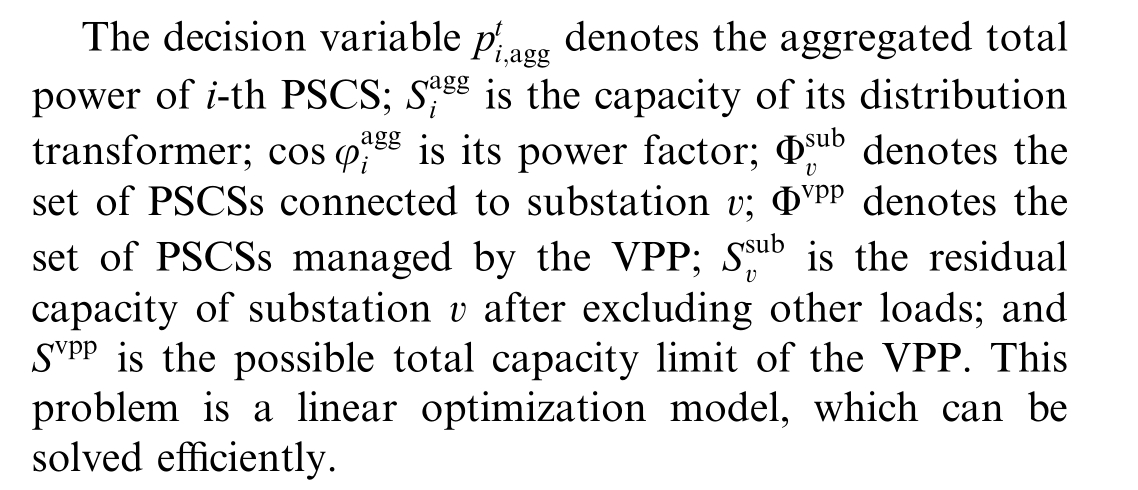
In stage 2, using the optimization results from Stage 1 as benchmarks, the second-stage optimization reduces power fluctuations at each station.The objective is to minimize the sum of squares of power across all time periods:

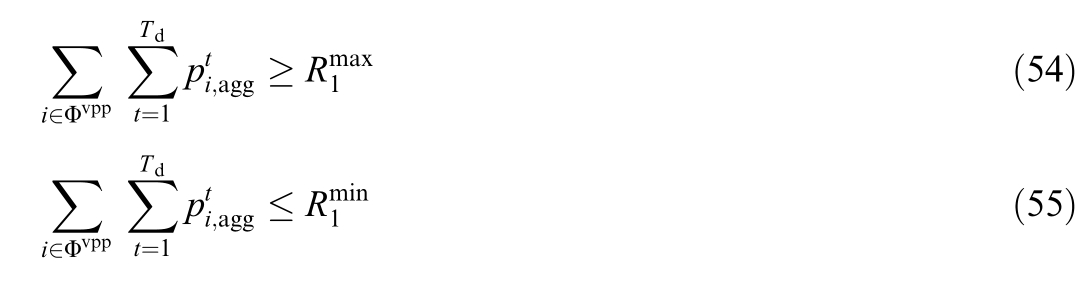
In addition to constraints (49)–(52), the second-stage problem also includes non-inferiority constraints relative to the first-stage resul ts. Specifically, for the upper power boundary, constraint (54) is imposed, and for the lower power boundary, constraint (55) is imposed. Here, and
and  denote the objective values obtained in the first stage for the upper and lower boundaries, respectively.
4 Case study
4.1 Parameter settings
Assume that each day is divided into 96 time intervals,with a convergence tolerance of 10 5. Based on actual infor mation from existing PSCS projects, the capacities of equipment and transformers at each station are set as shown in Table 3. Regarding the station connections, it is assumed that stations A and B are connected to the same substation, whereas station C is connected to another substation. The remaining capacities of substations and the total capacity of the VPP are listed in Table 4.
4.2 Simulation results and analyses
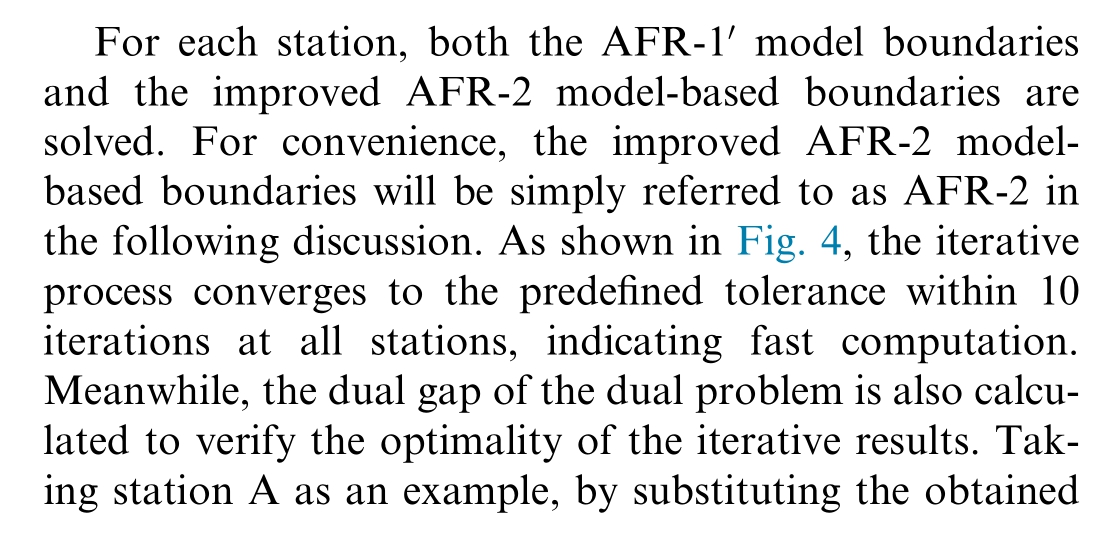
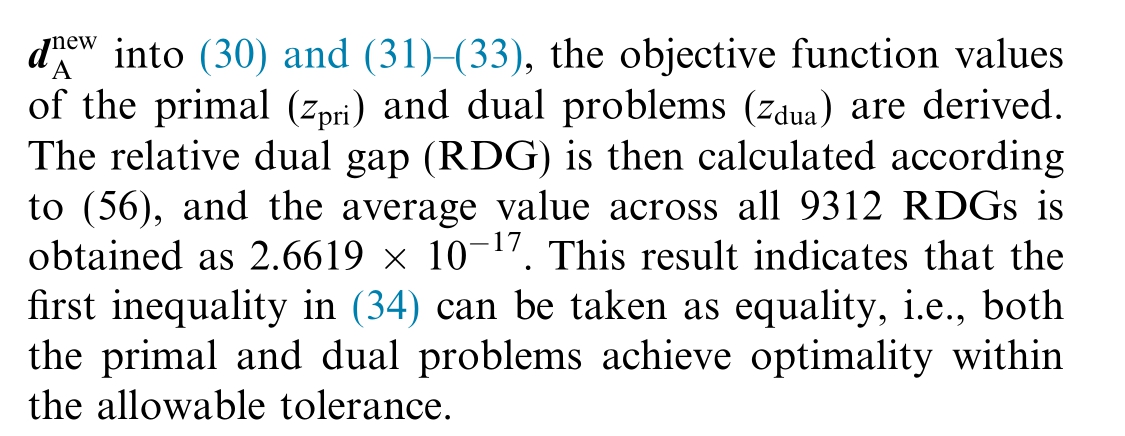

The boundary curves obtained from the iteration are shown in Fig. 5. Table 5 summarizes the feasible region sizes before and after adjustment. The contraction ratio is defined as the compressed area divided by the original area. It can be seen that the feasible region sizes after correction are approximately 80 % of the original values.
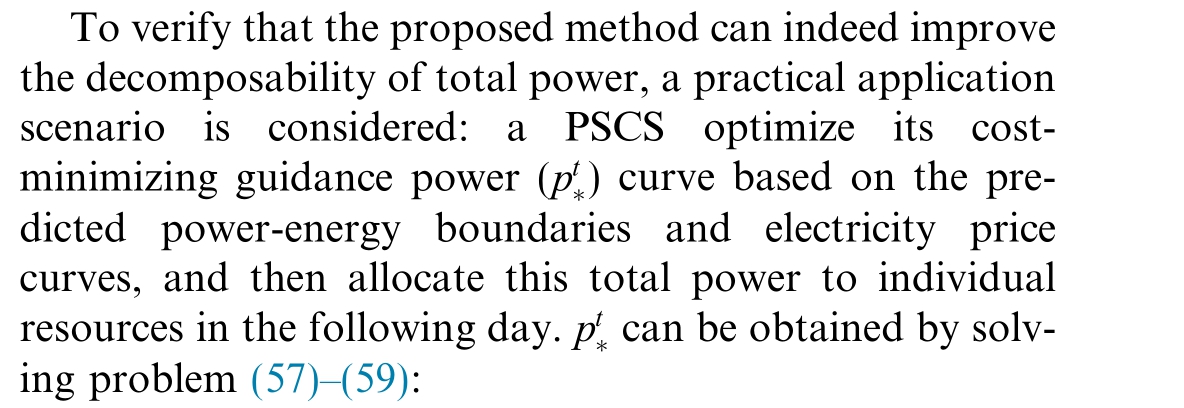
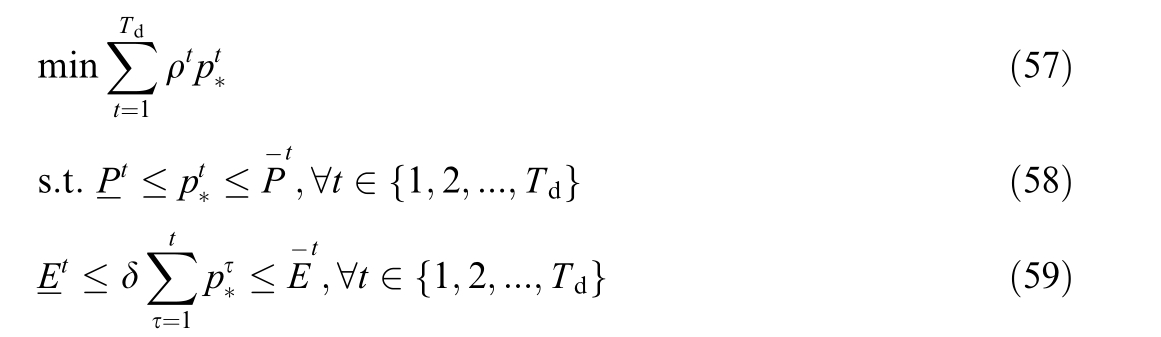
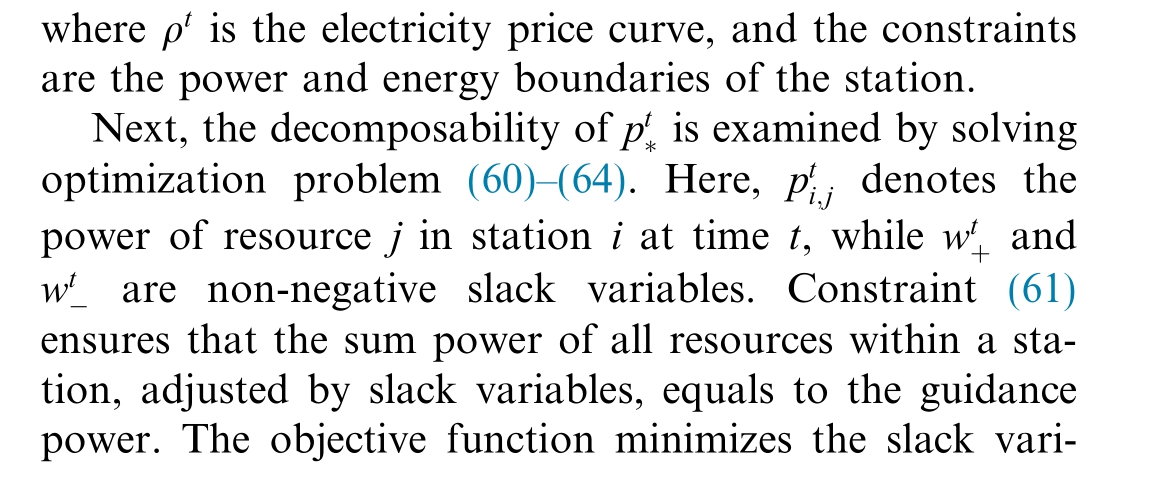
Table 3 Station settings.

Table 4 Substations and VPP capacity settings.
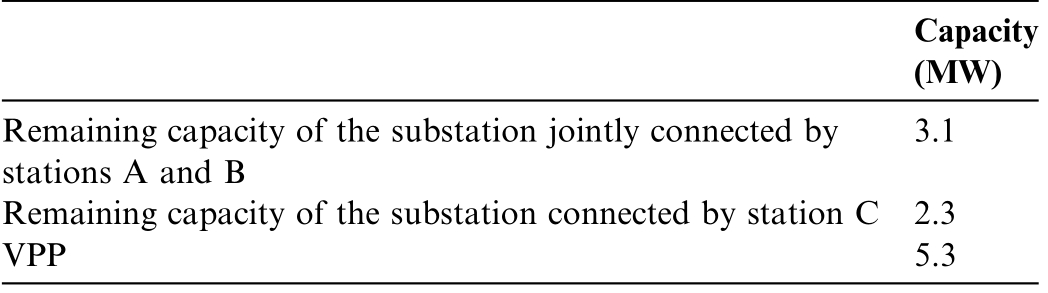
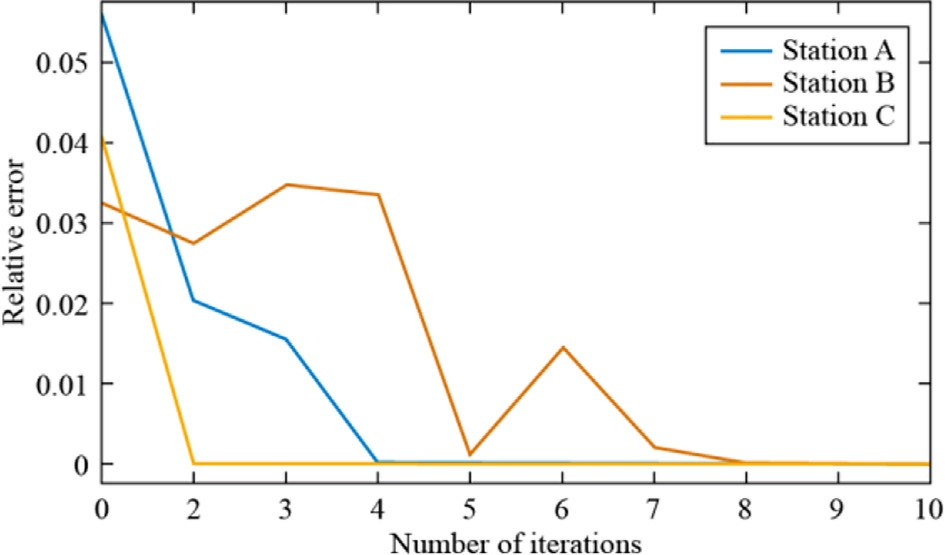
Fig. 4. Iterative convergence process.
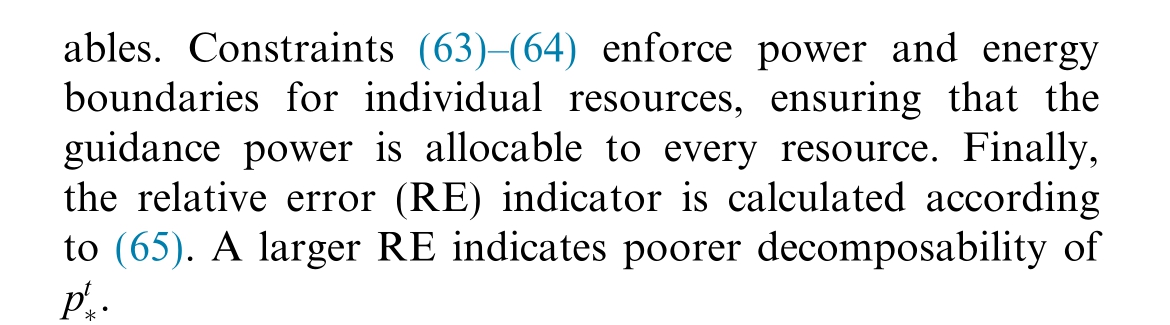
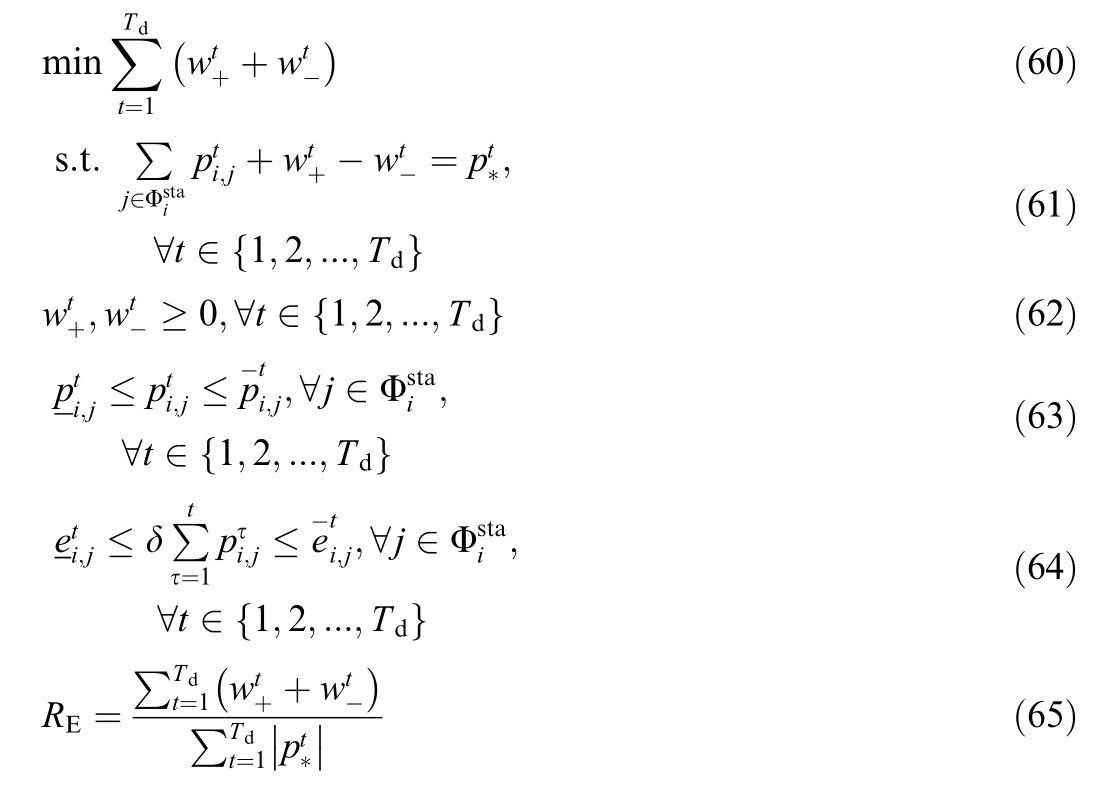
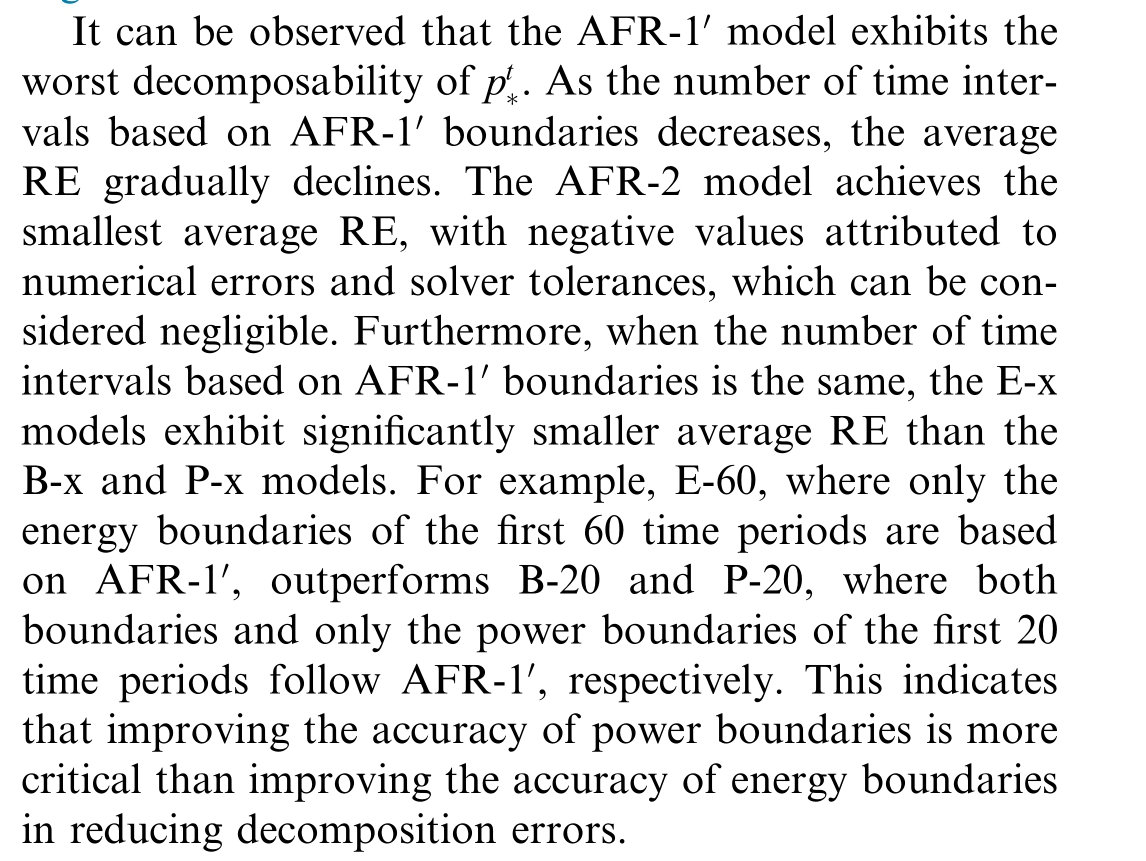
Taking station A as an example, the decomposability of obtained from the AFR-1 boundaries and AFR-2 model-based boundaries is compared. In addition, a series of ‘‘intermediate” models are considered for comparison.Their names and meanings are shown in Table 6. For electricity price data, this paper selects ten day-ahead price curves from the Liaoning electricity spot market during August 1st to 10th,2025[22]. The RE values are calculated for each curve and then averaged, with results shown in Fig. 6.
After obtaining the improved power and energy boundaries of each station, the multi-station adjustable capability model considering securi ty constraints is solved. The results of Stage 1 and Stage 2 are shown in Fig. 7. Comparison reveals that the fluctuation of power boundaries is significantly reduced after Stage 2 optimization. In addition, for both Stage 1 and Stage 2, the number of time intervals where the upper power boundary reaches the capacity limit is greater than that of the lower boundary.This is due to the charging demand of EV resources,where the overall charging power exceeds the discharging power.
5 Conc lusion
This paper focuses on PSCSs and introduces PEB models for individual resources, including PVs, ESS, and EV charging facilities. An aggregated approximation model based on power and energy boundaries at a single station is analyzed. By embedding low-dimensional models into high-dimensional models, the decomposability of evaluation results is improved. Furthermore, a multi-station aggregation method considering local transformer capacity constraints is proposed.
Through case studies, the effectiveness of the proposed contraction-correction model in enhancing decomposability is verified. Finally, the aggregated power and energy boundaries of multiple stations under security constraints are analyzed,and it is shown that the two-stage model significantly reduces the fluctuation of power boundaries across stations.
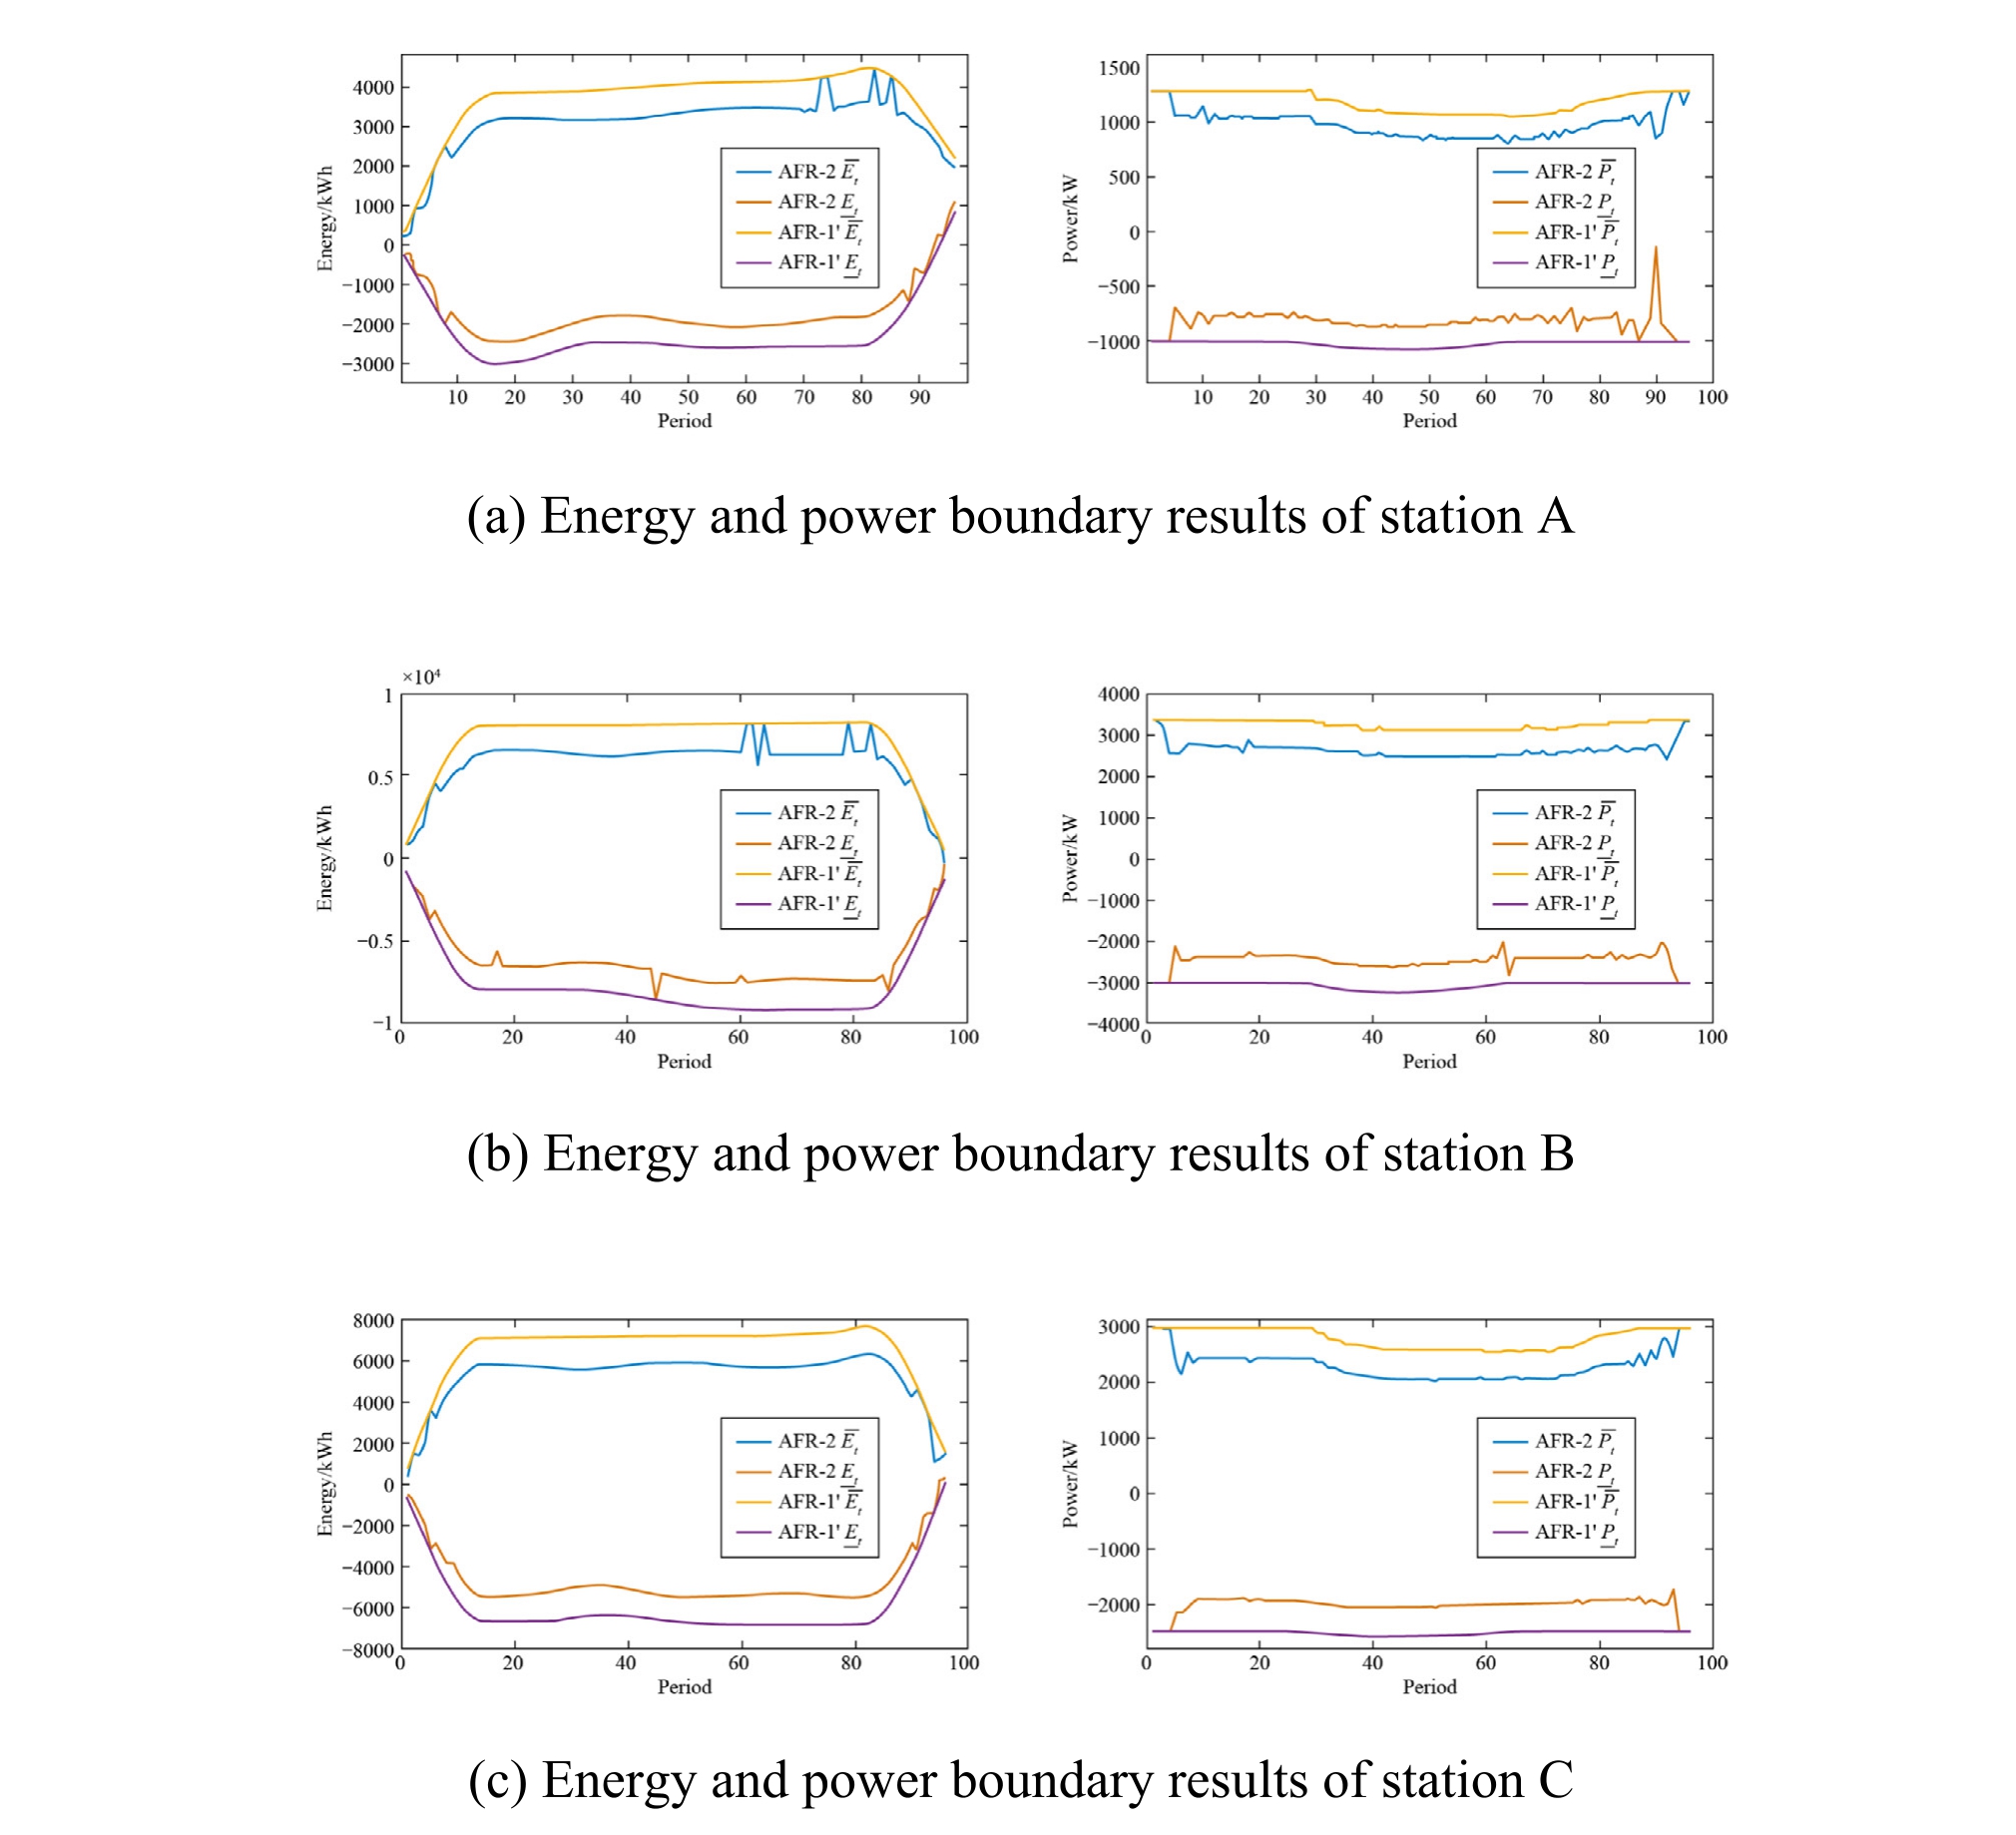
Fig. 5. Energy and power boundary results of each station.
Table 5 Feasible region area parameter s of each station.

Nevertheless, this study has several limitations that should be acknowledged. First, the randomness of EV behavior and PV generation is not considered. Second,the alternating optimization algorithm adopted in this study can guarantee optimality for each iteration but cannot ensure convergence to a global optimum. Third, the security constr aints in the multi-station aggregation model are relatively simplified and do not include network-level power-flow constraints. These limitations indicate potential directions for future work, such as constructing AFRs under different confidence levels using historical data,employing relaxation-based techniques to directlyapproach global optimality, and incorporating linearized power-flow models to better consider network constraints.
Table 6 Names and meaning s of intermediate models.

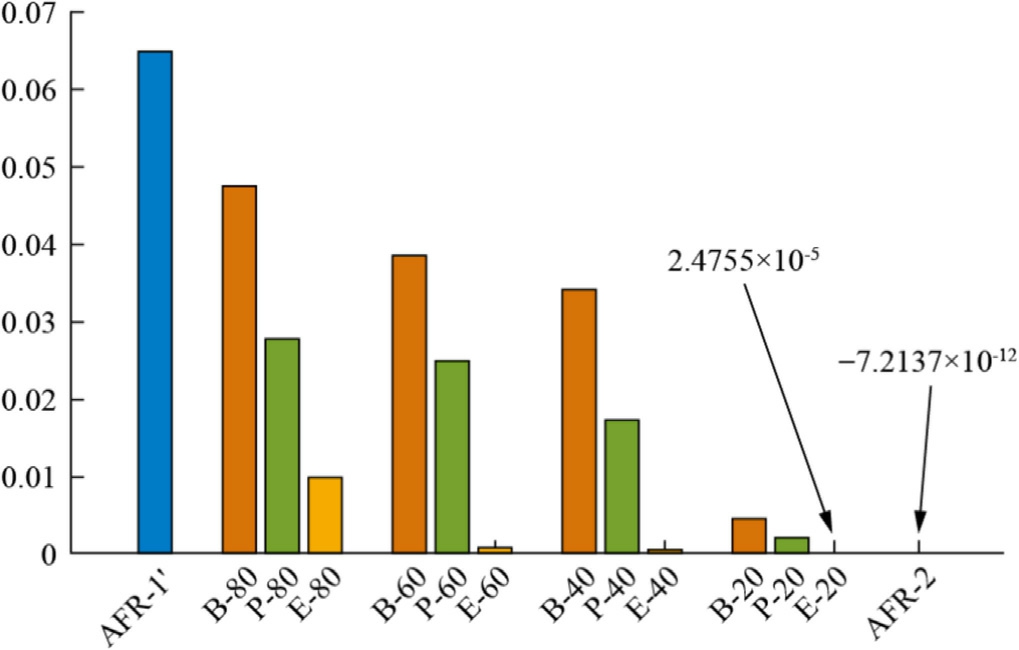
Fig. 6. Average relative error of different models.
CRediT authorship contribution statement
Chao Li: Formal analysis, Data curation, Conceptualization. Jiawei He: Writing – original draft, Methodology.
Tingzhe Pan: Resources. Zijie Meng: Data curation.Xinlei Cai: Resources. Xin Jin: Supervision. Zechun Hu: Writing– review & editing, Methodology.
Declaration of competing interest
The authors declare the following financial interests/personal relationships which may be considered as potential competing interests: Chao LI, Zijie MENG and Xinlei CAI are currently employed by Power Dispatching Control Center of Guangdong Power Grid Co.,LTD;Tingzhe PAN and Xin JIN are currently employed by CSG Electric Power Research Institute.
Acknowledgement
This work was supported by Science and Technology Project of China Southern Power Grid Company (03600 0KK52222007(GDKJXM20222121)).
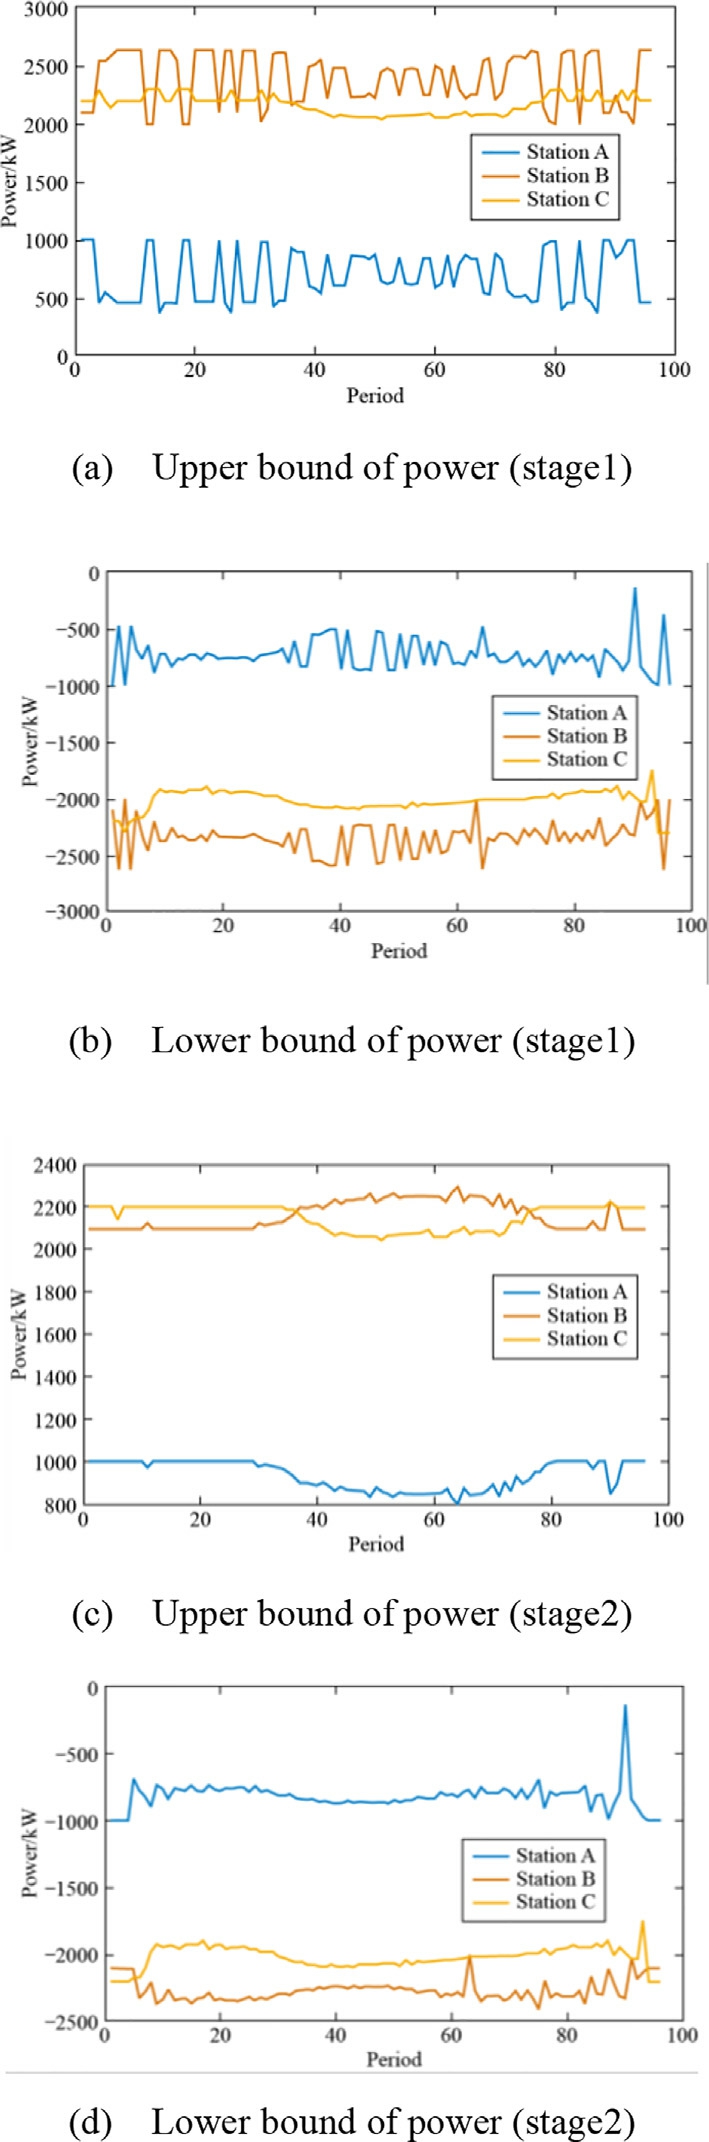
Fig. 7. Power boundaries of PSCSs considering security constraints.
References
[1]Q. Yan, B. Zhang, M. Kezunovic, Optimized operational cost reduction for an EV charging station integrated with battery energy storage and PV generation, IEEE Trans. Smart Grid 10 (2) (2019)2096–2106.
[2]M. Alizadeh, A.M. Amani, L. Meegahapola, M. Jalili, O. Hill,Optimal integration of EV charging stations into distribution network planning and operation, IEEE Trans. Ind. Inf. 21 (9)(2025) 7120–7130.
[3]M. Azimi Nasab, M. Alizadeh, R. Nasimov, M. Zand, M. Azimi Nasab, S. Padmanaban, Planning with the electricity market one day ahead for a smart home connected to the RES by the MILP method, Renew. Energy Focus 50 (2024) 100606.
[4]M. Alizadeh, L. Meegahapola, A.M. Amani, M. Jalili, A.Seilsepour, Optimal planning framework for battery energy storage systems and electric vehicle charging stations in distribution networks, in: Proceedings of the IEEE International Conference on Industrial Technology (ICIT), Bristol, United Kingdom, 2024, pp. 1–6.
[5]S.Y. Ge, H.H. Lian, H. Liu, et al., Timing response capability model and control method of electric vehicle, Automat. Electr.Power Syst. 40 (3) (2016) 33–38.
[6]H. Liu, H.H. Lian, S.Y. Ge, et al., Timing response capability model of electric vehicle battery swapping station and strategy formulation of charging plan, Automat Electr. Power Syst. 41 (8)(2017) 91–97.
[7]M. Jenkins, I. Kockar, Electric vehicle aggregation model: a probabilistic approach in representing flexibility, Electr.Pow.Syst.Res. 213 (2022) 108484.
[8]M. Pertl, F. Carducci, M. Tabone, et al., An equivalent timevariant storage model to harness EV flexibility: forecast and aggregation, IEEE Trans. Ind. Inf. 15 (4) (2019) 1899–1910.
[9]F. Al Taha, T.L. Vincent, E. Bitar, An efficient method for quantifying the aggregate flexibility of plug-in electric vehicle populations, IEEE Trans. Smart Grid 16 (4) (2025) 3142–3154.
[10]Z. Yi, Y. Xu, W. Gu, et al., Aggregate operation model for numerous small-capacity distributed energy resources considering uncertainty, IEEE Trans. Smart Grid 12 (5) (2021) 4208–4224.
[11]X.U. Tianyun, C. Tao, Z. Xin, et al., Zonotope based wide-area aggregation and regulation method for distributed resources in virtual power plant, Automat. Electr. Power Syst. 48 (18) (2024)139–148.
[12]Y. Wen, Z. Hu, J. He, et al., Improved inner approximation for aggregating power flexibility in active distribution networks and its applications, IEEE Trans. Smart Grid 15 (4) (2024) 3653–3665.
[13]R. Lyu, H. Guo, G. Strbac, et al., name="ref14" style="font-size: 1em; text-align: justify; text-indent: 2em; line-height: 1.8em; margin: 0.5em 0em;">[14]D.A. Contreras, K. Rudion, Computing the feasible operating region of active distribution networks: comparison and validation of random sampling and optimal power flow based methods, IET Generat., Trans. Distribut. 15 (10) (2021) 1600–1612.
[15]Z. Tan, H. Zhong, Q. Xia, et al., Estimating the robust P–Q capability of a technical virtual power plant under uncertainties,IEEE Trans. Power Syst. 35 (6) (2020) 4285–4296.
[16]L. Chen, Z. Tang, S. He, et al., Feasible operation region estimation of virtual power plant considering heterogeneity and uncertainty of distributed energy resources, Appl. Energy 362(2024) 123000.
[17]X. Chen, N. Li, Leveraging two-stage adaptive robust optimization for power flexibility aggregation, IEEE Trans. Smart Grid 12 (5)(2021) 3954–3965.
[18]S. Wang, W. Wu, Q. Chen, et al., Stochastic flexibility evaluation for virtual power plants by aggregating distributed energy resources, CSEE J. Power Energy Syst 10 (3) (2024) 988–999.
[19]J.L. Mathieu, M. Kamgarpour, J. Lygeros, et al., Arbitraging intraday wholesale energy market prices with aggregations of thermostatic loads, IEEE Trans. Power Syst.30(2)(2015)763–772.[20] Z. Xu, D.S. Callaway, Z. Hu, et al., Hierarchical coordination of heterogeneous flexible loads, IEEE Trans. Power Syst.31(6)(2016)4206–4216.
[21]Y. Wen, Z. Hu, S. You, et al., Aggregate feasible region of DERs:exact formulation and approximate models, IEEE Trans. Smart Grid 13 (6) (2022) 4405–4423.
[22]Liaoning Provincial Development and Reform Commissio n(2025)Spot electricity price. https://fgw.ln.gov.cn/fgw/xxgk/xhdj/index.shtml. Accessed 14 Sep 2025.
Received 14 September 2025;revised 31 October 2025; accepted 11 November 2025
Peer review under the responsibility of Global Energy Interconnection Group Co. Ltd.
* Corresponding author.
E-mail addresses: lx_lichao47@163.com (C. Li), hejw24@mails.tsinghua.edu.cn (J. He), pantz@csg.cn (T. Pan), meteordk@163.com(Z. Meng), 517665114@qq.com (X. Cai), jinxin1@csg.cn (X. Jin),zechhu@tsinghua.edu.cn (Z. Hu).
https://doi.org/10.1016/j.gloei.2025.11.002
2096-5117/© 2026 Global Energy Interconnection Group Co. Ltd. Publishing services by Elsevier B.V. on behalf of KeAi Communications Co. Ltd.
This is an open access article under the CC BY-NC-ND license(http://creativecommons.org/licenses/by-nc-nd/4.0/).

Chao Li received the Ph.D. degree in electrical engineering and Automation from Huazhong University of Science and Technology, Wuhan,China, in 2020. He is currently an engineer with the Power Dispatching Control Center of Guangdong Power Grid Co., Ltd., Guangzhou,China. His research interests include optimal operation and control of power systems.