
0 Introduction
Since the advent of industrialization, green-house-gas emissions have been primary drivers of global warming,with carbon dioxide accounting for the vast majority of these emissions [1]. As the impacts of global climate change are becoming increasingly pronounced, nations worldwide are actively exploring pathways to reduce emissions by leveraging policy innovations and market mechanisms to transition energy systems toward lowcarbon and green paradigms [2]. As the world’s secondlargest economy and a major carbon emitter, China has put forward its ‘‘dual carbon goals” of achieving carbon peak by 2030 and carbon neutrality by 2060, and has elevated these targets a s a cornerstone of its national strategy[3]. To realize these ambitions, China has intensified efforts in renewable-energy development, energy-structure optimization, and adoption of market-based emission reduction tools, gradually establishing a policy framework centered on carbon-trading markets and gre en-certificatetrading mechanisms [4–6]. These initiatives not only provide fresh impetus for the clean and low-carbon development of the power sector but also lay a critical foundation for energy transformation and the attainment of carbon-reduction objectives [7–9].
Hydrogen energy, as a clean energy, is characterized by high energy density, substantial capacity, long operational lifespan, and ease of storage and transmission, making it a superior green regulatory resource. The ‘‘Blue Book on the Development of New Power Systems” indicates that by 2060,renewable-energy sources will constitute the primary generation mix,with electric power and secondary energies such as hydrogen being extensively integrated through deep energy-system coupling [10]. The electro–hydrogen coupling system (EHCS) facilitates long-term energy transmission and short-term power regulation, and is becoming an important pathway for the integration of renewable energy and low-carbon transformation of energy. Ref. [11] proposed a generalized optimization model for hydrogen supply-chain networks based on off-grid wind–hydrogen coupling systems.Ref.[12] introduced an integrated EHCS planning model that considered hydrogen production and storage technologies. Ref. [13]developed an electric–hydrogen coupling power generation and expansion planning model, utilizing planning and economic analyses to determine a low-carbon transition pathway for the East China region. Existing studies relying solely on a one-time comprehensive mitigation plan are insufficient to ensure sustained achievement of emissionreduction targe ts; therefore, it is essential to decompose the overall mitigation objectives into distinct phases,delineate specific emission-reduction tasks for each stage, and implement a phased, incremental decarbonization strategy.
In the realm of carbon reduction, carbon-trading markets have gained international recognition as an effective tool for promot ing emission reduction by optimizing resource allocation through market-driven approaches[14]. China’s carbon-market journey began in 2011 with regional pilot programs that selected seven provinces and cities—Beijing, Tianjin, Shanghai, Chongqing, Guangdong, Hubei, and Shenzhen—for initial experimentation,with trading commencing progressively from 2013. In 2016, Fujian joined as the eighth pilot, complet ing the roster of pilot carbon markets. The announcement of the‘‘dual carbon”goals in September 2020 significantly accelerated the development of a national carbon market [15].On July 16, 2021, the national carbon market was officially launched, with the power sector as its pilot industry,establishing the world’s largest carbon-trading system in terms of emission coverage[16]. By quantifying carbon emissions and assigning economic value, this market provided a groundbreaking institutional framework for advancing low-carbon energy transitions.
Concurrently, the rapid expansion of renewable energy became a vital pillar in China’s pursuit of ‘‘dual carbon”goals. However, the swift growth of wind and solar power generation brought the issue of subsidy shortfalls to the forefront. Since 2006, China has supported renewableenergy development through a renewable-energy surcharge on electricity prices, which has now risen fivefold from 0.1 fen per kilowatt-hour to 1.9 fen per kilowatt-hour—a 19-fold increase. Despi te these efforts,the subsidy gap reached over 260 billion yuan by 2019, imposing a severe constraint on the sustainable growth of the renewableenergy sector [17]. To address this challenge, the government introduced the green-certificate (green cert) trading system, which shifted renewable-energy projects that exceeded their full lifecycle or designated operational years from fiscal subsidies to market-based trading [18]. This mechanism not only alleviated subsidy pressures but also incentivized renewable-energy consumption through market premiums, fostering a virtuous cycle of sustainable development.
Numerous scholars have investigated the role of carbon and green-certificate markets in faci litating the low-carbon transition of power systems [19,20]. Ref. [21] established an optimal dispatch model for a virtual power plant unde r carbon and green-certificate trading mechanisms.Ref.[22]proposed a low-carbon synergistic planning framework that accounted for coal-fired power plant retirement and the combined carbon–green certificate market mechanism,facilitating the power system’s ‘‘security–economy–low-ca rbon” triple-objective transformation. Incorporating multimarket synergies into the planning of EHCS not only enhanced the effective utilization of green and lowcarbon energy but also enabled the system to rapidly adapt to market fluctuations and policy changes.
This study develops an electric–hydrogen energy recycling model, considering the coupling relationship of electric–hydrogen bidirectional conversion. A capacityoptimization-configuration model for an EHCS is established, considering multistage emission reduction. A joint mechanism of carbon–green-certificate market is incorporated into the model to explore the role of multimarket coupling mechanisms in promoting the ‘‘dual carbon”goals and to identify potential optimization pathways.The aim is to provide theoretical insights and practical guidance for China’s green-energy transition.
1 Theoretical foundation of electro–hydrogen coupled system planning
Hydrogen, as a high-quality secondary energy source complementary to electricity, is poised to play an increasingly significant role in the future energy systems. This brings us to the focal point of this study—the EHCS,which is defined as a low-carbon, sustainable, and innovative energy system that utilizes electricity and hydrogen as energy carriers (spanning generation/production, storage,transmission, distribution, and utilization). It aims to achieve a high proportion of renewable-energy integration and meet the diverse energy demands associated with human production and daily life, including electrici ty,heat, cooling, and hydrogen [23–25]. Depending on the system scale, the EHCS can be categorized into regionallevel and cross-regional-level EHCSs, the latter being an interc onnected network of multiple regional-level EHCSs linked through electricity transmission and hydrogentransportation networks.
In the analysis of the coupling mechanisms within the EHCS, the electricity and hydrogen systems exhibit complementary potentials across system operation, network operation, and end-user demand. At the systemoperation level, the electricity system can leverage its widely distributed power grid to flexibly produce hydrogen, supply power to critical hydrogen supply-chain components such as compressors and facilitate diverse hydrogen applications. While the electricity system must maintain real-time supply–demand balance, the hydrogen system offers inherent buffering capacity across its production, transmission, distribution, and utilization stages, providing greater flexibility. Thi s allows the hydrogen system to effectively support the electricity system with services such as primary,secondary,and tertiary frequency regulation, reserve power generation, black-start capabilities,and large-scale long-term energy storage. At the network-operation level, the power grid can transmit energy over distances exceeding 5000 km, whereas hydrogen pipeline networks are generally optimized for energy transmissions within 1500 km [26]. Consequently, longdistance cross-regional energy transmission predominantly relies on electricity as the carrier. However, establishing a hydrogen transmission and distribution network with pipeline storage attributes can alleviate the transmission pressure on the power grid, particularly at low voltage levels. At the end-user demand level, an electricity system with a high proportion of renewable-energy integrati on can produce highly pure, low-carbon hydrogen through electrolysis technologies.Meanwhile,the hydrogen system,which utilizes electricity–hydrogen conversion equipment,can provide load-management services to the electricity system, thereby enhancing the power quality and supply reliability.
Because the EHCS studied in this work is established in view of the future large-scale hydrogen transportation and utilization and because the best method for large-scale hydrogen transportation is hydrogen-pipeline transportation, this paper analogizes a natural-ga s system model to establish a hydrogen system model. Hydrogen is mainly transported through hydrogen pipelines. The structure of the EHCS is presented in Fig. 1.
1) Model of hydrogen-transmission system
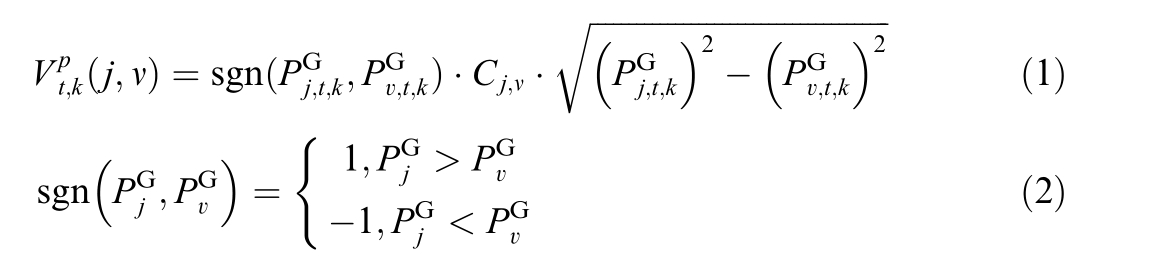
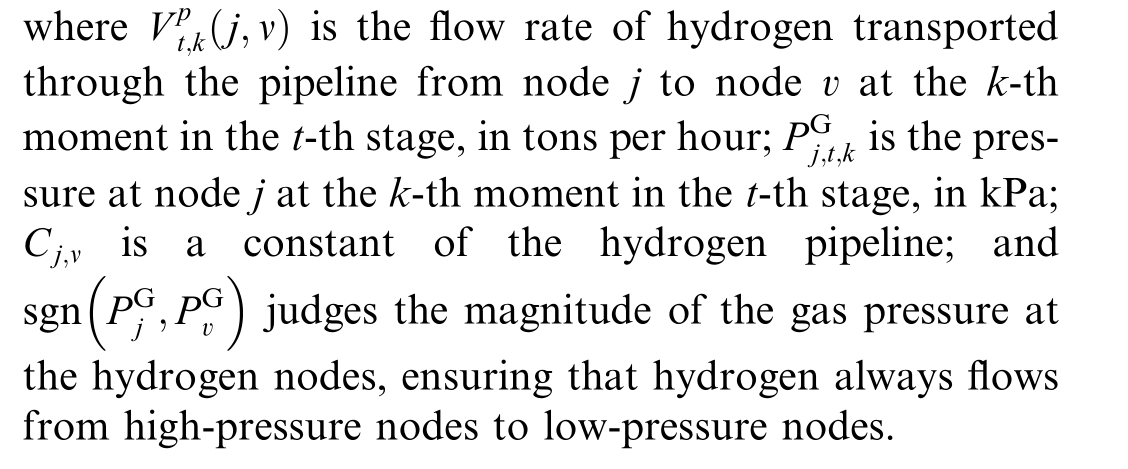
In the hydrogen system, hydrogen flows out from the gas source node and is transported to the load node through hydrogen pipelines. Considering the relatively long planning horizon, the real-time dynamic processes inside the hy drogen pipelines are rather complex and have little impact on the results[27,28]. Therefore, the dynamic characteristics inside the pipelines are temporarily neglected, and only the basic steady-state model of the hydrogen system is adopted to represent the relationship between the gas-flow rate inside the hydrogen pipelines and pipeline pressure. The operating model of the hydrogen system is as follows:
2) Model of electricity-to-hydrogen equipment
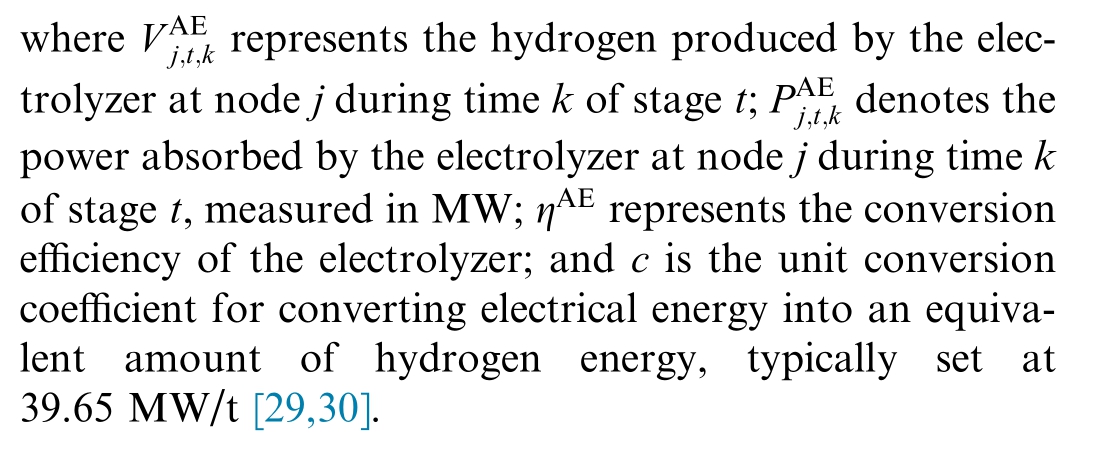
This study focuses on long-term planning and adopts a simplified operational model for the electrolyzer. It overlooks factors such as efficiency variations due to temperature and power changes, as well as the start-up and shutdown losses of the electrolyzer itself. The operational model of the electrolyzer is formulated as follows:

3) Model of hydrogen-to-electricity equipment
The operational mod el of the fuel cell is formulated as follows:

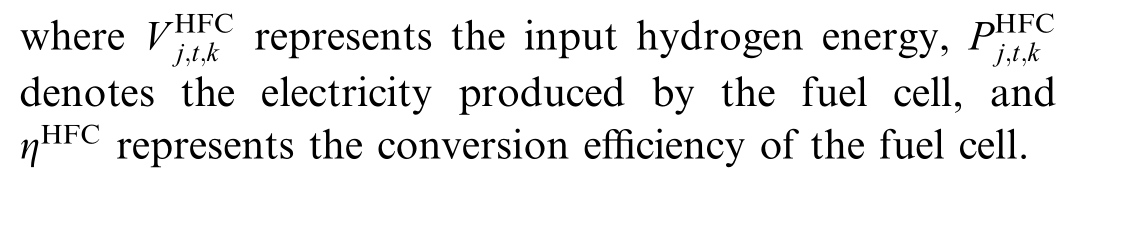
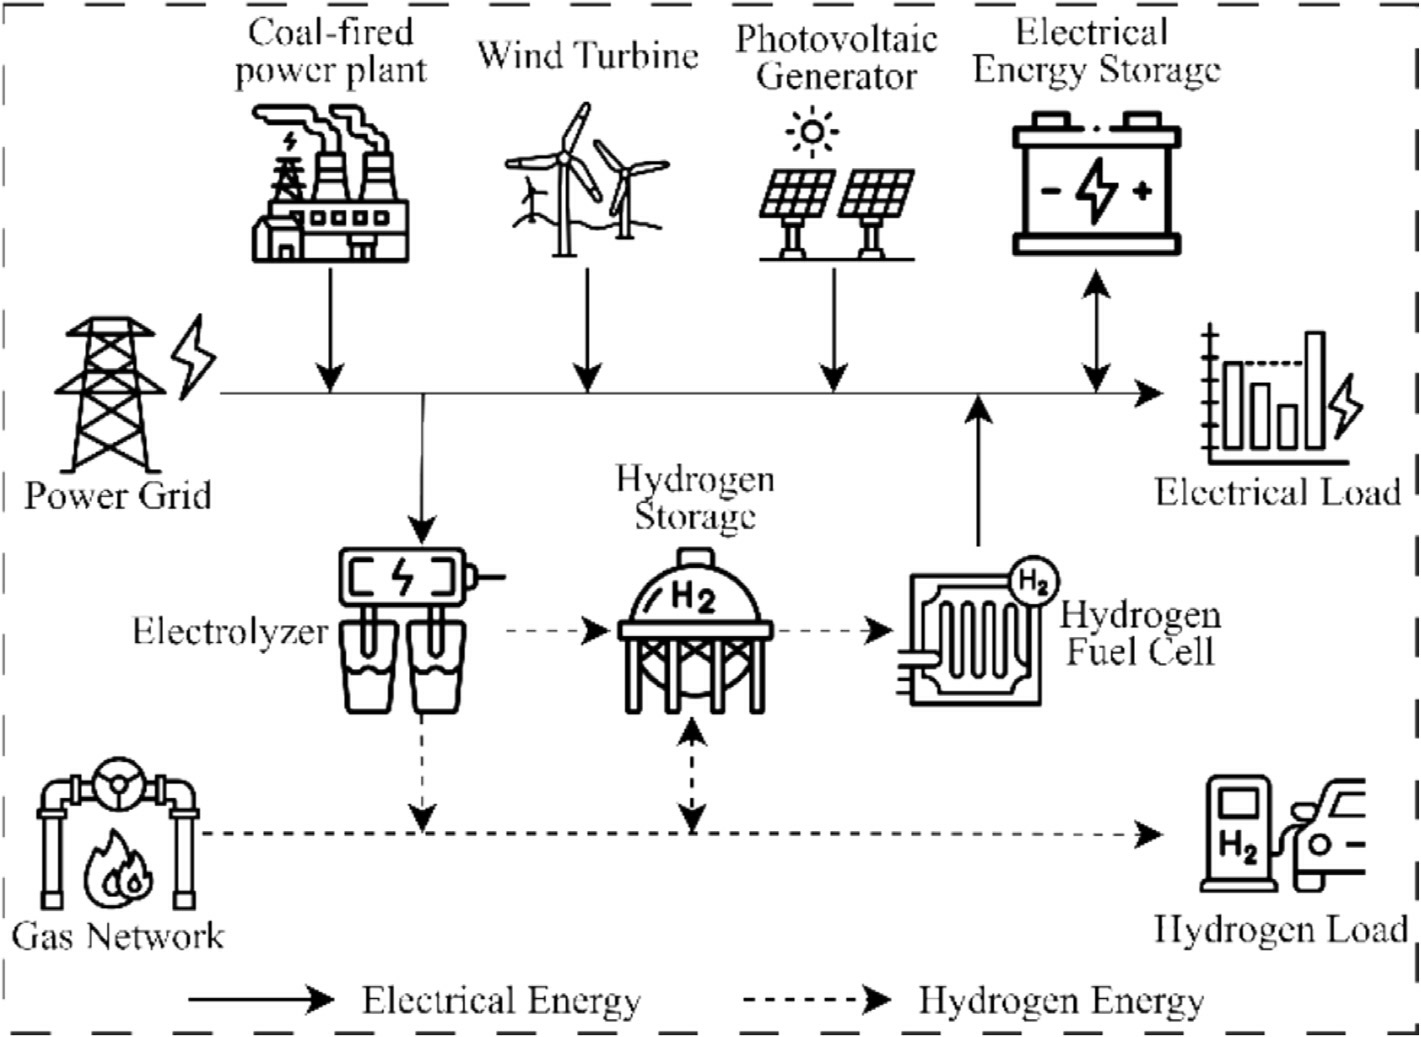
Fig. 1. EHCS structure.
4) Model of hydrogen-storag e equipment
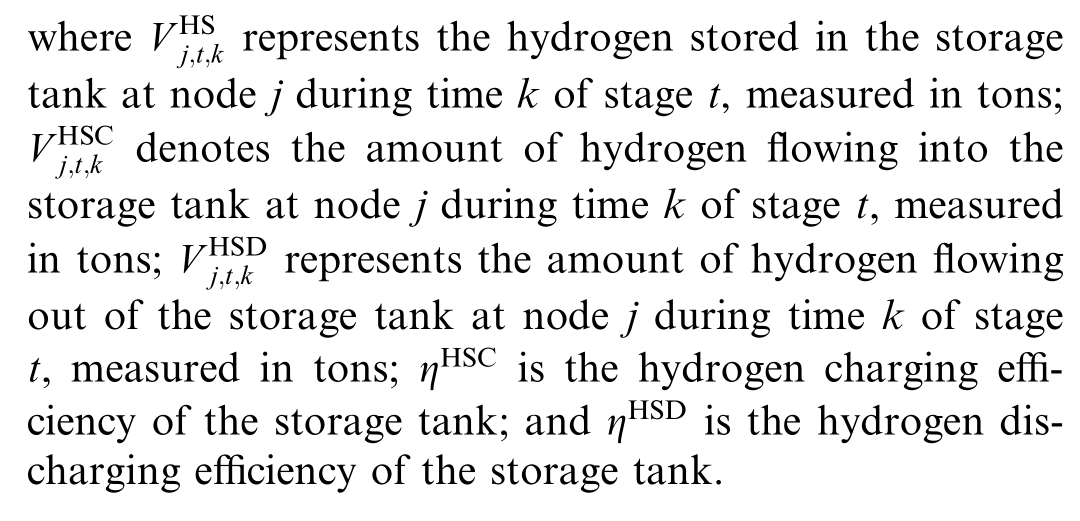
This study considers high-pressure gaseous-hydrogenstorage technology. The operation of the hydrogenstorage equipment mirrors that of batteries in an electricity system, where the state of the hydrogen-storage tank at a given moment is primarily determined by the hyd rogen inflow and outflow rates at that moment, as well as the remaining hydrogen stored from the previous moment.The operational model is expressed as follows:

2 Carbon-trading and green-certific ate markets
2.1 Carbon-trading market
Currently, free allocation, auction allocation, and hybrid allocation are three commonly used methods for carbon-allowance distribution, both nationally and internationally. Among them, free allocation is the most common and is also the main method adopted in China.
After the government distributes carbon allowances to enterprises through free allocation, these carbon allowances are considered equivalent to the emission limits of enterprise carbon emissions. If an enterprise’s carbon emissions exceed the limit, it needs to purchase the excess carbon-emission rights from other enterprises in the carbon-trading market to account for the excess carbon emissions. If an enterprise has relatively low carbon emissions,achieves good energy-saving and emission-reduction effects, and does not use up all of its carbon-emission rights, it can sell its surplus carbon allowances in the carbon market and thus obtain benefits.
The carbon emissions within the EHCS mainly come from thermal power units and traditional ind ustrial hydrogen production; the carbon emission amounts are presented in Eq. (6). In this study, the free-allocation method is adopted, and the free carbon allowances for each stage are calculated according to the multistage emission-reduction method. The carbon trading cost can be expressed as follows:


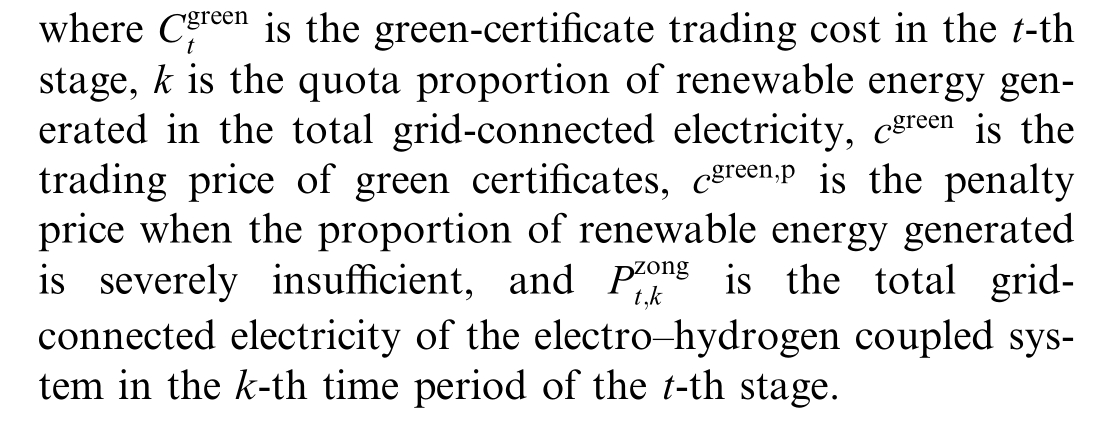
2.2 Green-certificate-trading market
The principle of green-certificate trading is based on the market supply–demand relationships. Renewable energy generation enterprises can prove the renewable energy generation volume per megawatt-hour that they produce through green certificates. These green certificates can be traded in the market. Enterprises purchasing green certificates can use them to prove their environmental co ntributions when using renewable energy, while meeting the requirements of the government’s renewable-energy quota system, thereby enhancing their corporate social image and brand value.
This study divides the green-certificate-trading market cost model into three stages:
Stage One: When the actual proportion of renewable energy generated in the system is greater than the specified proportion of renewable-energy quotas, the system will consume more new energy. The number of green certificates corresponding to the excess renewable energy electricity volume beyond the quota can be calculated and sold in the green-certificate market to obtain market returns.
Stage Two: When the actual proportion of renewable energy generated in the system fails to meet the requirements of the government-specified quota proportion, the system must purchase green certificates from the greencertificate market to make up for the insufficient renewable-energy-generation volume corresponding to the renewable-energy quota proportion.
The specific calculation formulas are presented in Eqs.(7) and (8):

2.3 Carbon–green-certificate market linkage mechanism
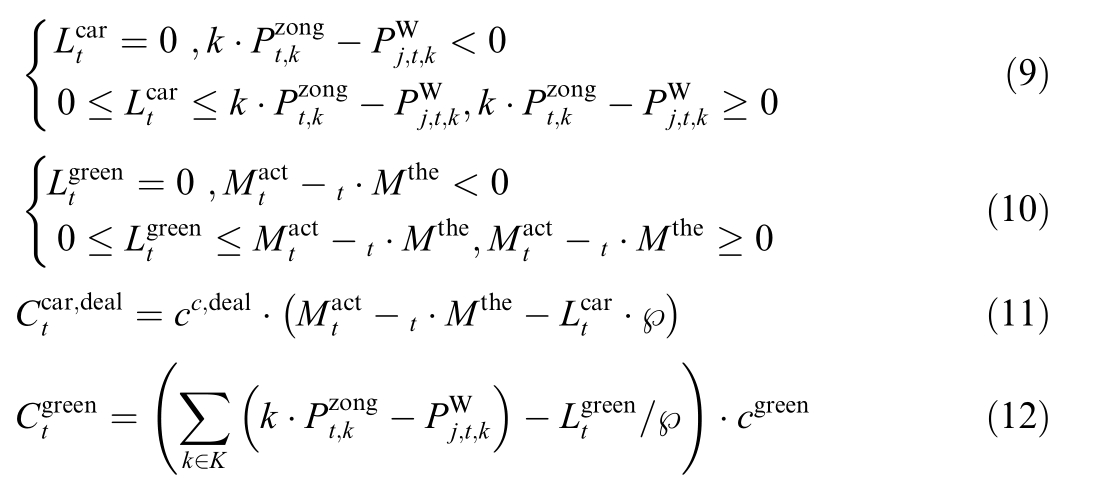
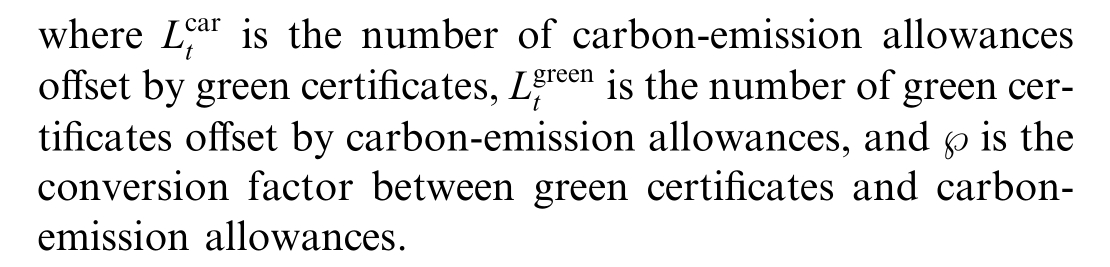
Green certificates contain all relevant information regarding renewable energy generation and consumption,while the carbon emissions from traditional thermal power generation can be quantitatively calculated. Therefore, the carbon reduction achieved through the use of green electricity can be determined through green certificates. The portion of green certificates used to offset carbon emissions can indirectly participate in the carbon-trading market,effectively interacting with prices and quotas. By increasing the storage and use of renewable energy, green certificates can be obtained to offset carbon quotas, thereby reducing the carbon trading costs. This incentivizes companies to expand clean energy-storage capacity, reduce reliance on fossil fuels, lower carbon emissions, promote clean-energy integration, and enhance the overall environmental benefits of the energy system, thus driving lowcarbon economic growth. The conversion relationship between green certificates and carbon quotas can be determined through the benchmark trading prices of both, by calculating the number of green certificates and carbon quotas that need to be offset. The calculation method is shown in Eqs. (9)–(12).
3 Planning model for electro–hydrogen coupling system considering multistage emissions and carbon–greencertificate market
3.1 Objective
With the booming development of the hydrogen-energy industry, the social demand for hydrogen energy is increasing. It is necessary to plan EHCSs and utilize clean hydrogen produced from renewable-energy sources. However,considering the continuous changes in hydrogen-energy development and the adjustment of national policies, traditional single-stage planning methods are no longer applicable to EHCSs. Therefore, it is of great significance to adopt a multistage planning method, comprehensively considering the load changes and carbon-emission reduction requirements within the planning horizon, for EHCS planning.
The EHCS studied in this works aims to meet the demands of electric and hydrogen loads with clean renewable energy, with the lowest possible economic investment and carbon emissions. The planning scheme mainly includes alkaline electrolyzers, fuel cells, hydrogenstorage tanks, and wind farms. For the convenience of calculation, this study assumes that the capacities and effi-ciencies of all devices to be planned are the same. The total cost of the EHCS is mainly composed of operating costs, investment costs, carbon-market costs, and greencertificate-market costs. This study considers a multistage planning method to calculate the life-cycle cost of the system. The objective function of this planning model is:


1) Investment cost
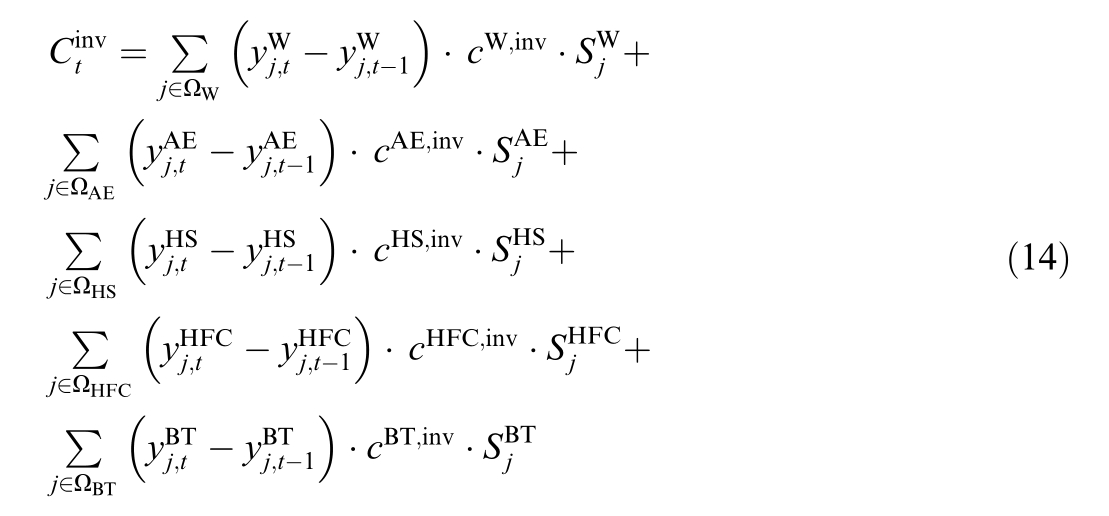
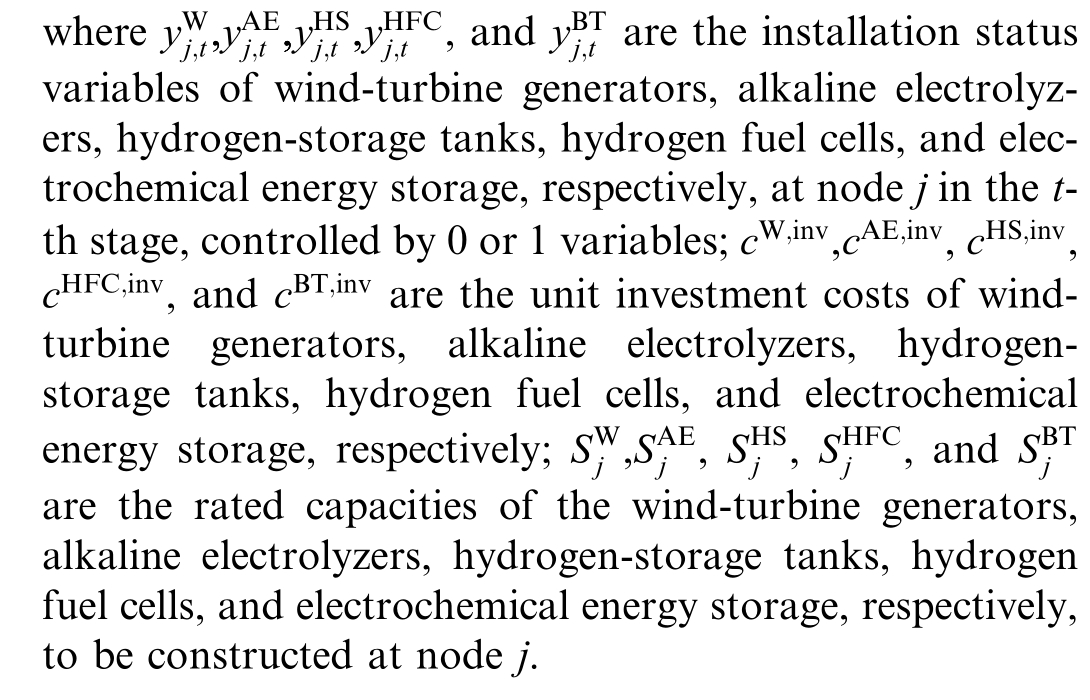
Under a low-carbon background, the main considerations are the investment costs of wind-turbine generators,alkaline electrolyzers, hydrogen-storage tanks, hydrogen fuel cells, and electrochemical energy storage. The equipment investment cost of the system in the t-th stage is:
2) Operating Cost
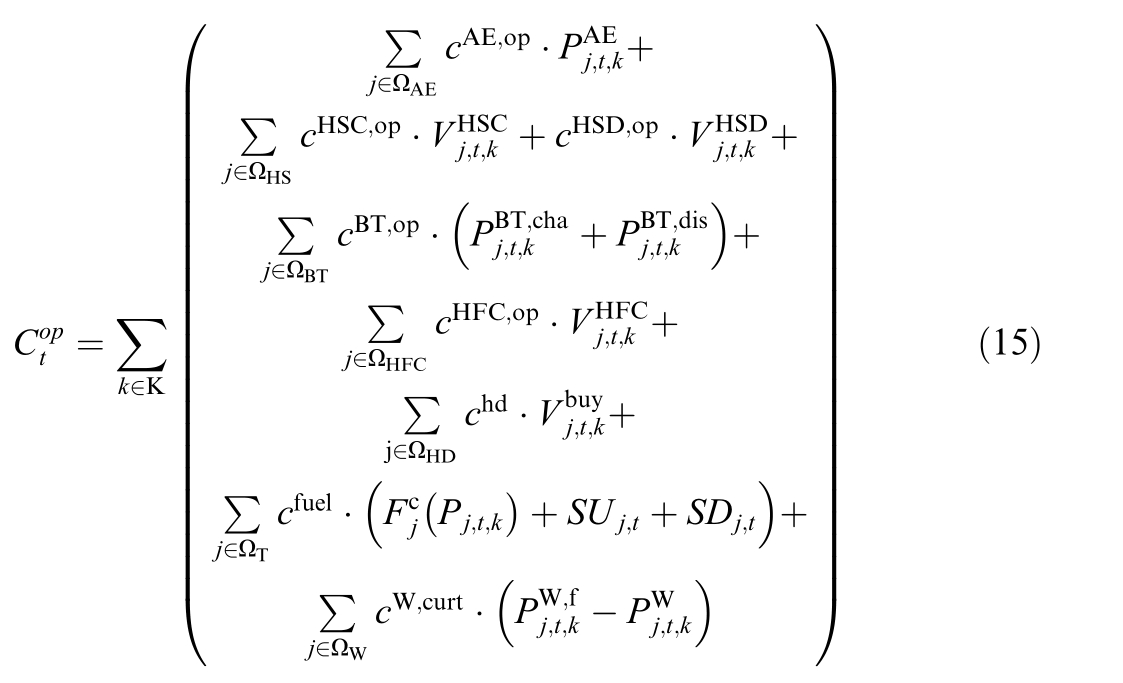
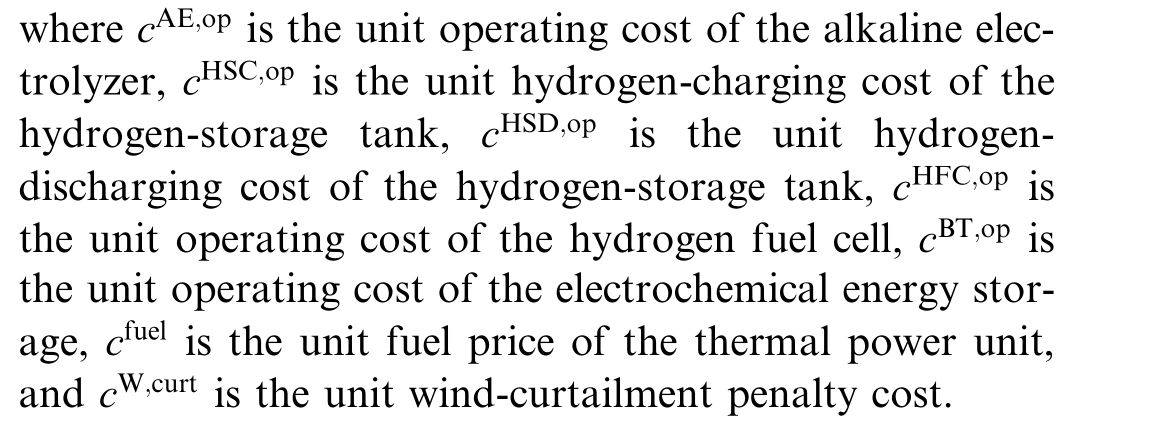
The operating costs mainly include the operating costs of electrolyzers, fuel cells, hydrogen-storage tanks and electrochemical energy storage; cost of traditional industrial hydrogen production; fuel cost and start–stop cost of thermal power units;and wind-curtailment penalty cost of wind-turbine generators. The equipment operating cost of the system in the t-th stage is:
3.2 Constraints
1) Equipment Installation Const raints
For the convenience of planning, this study does not consider the equipment-selection issue. That is, for each type of equipment to be planned, the capacity and effi-ciency of each individual piece of equipment are considered the same. The planning scheme is determined solely by the number of installed units. A 0–1 variable is used to control whether the equipment is installed at node j; 0 indicates that no equipment is installed, and 1 indicates that equipment is installed.
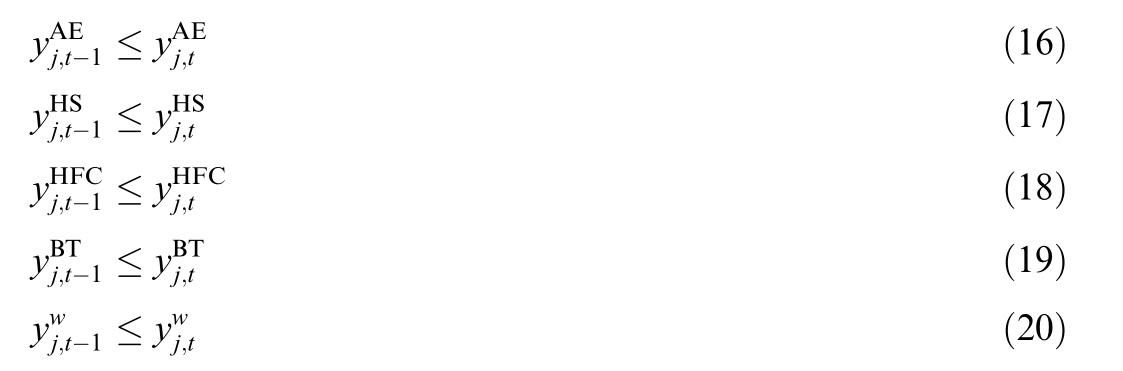
The coordinated optimization and expansion model of the EHCS considers the construction of alkaline electrolyzers, hydrogen-storage tanks, hydrogen fuel cells,electrochemical energy-storage systems, and wind-turbine generators. Once a facility is constructed, its construction status will be fixed as 1 for the remaining time, as shown in following formulas.
2) Operating Constrai nts
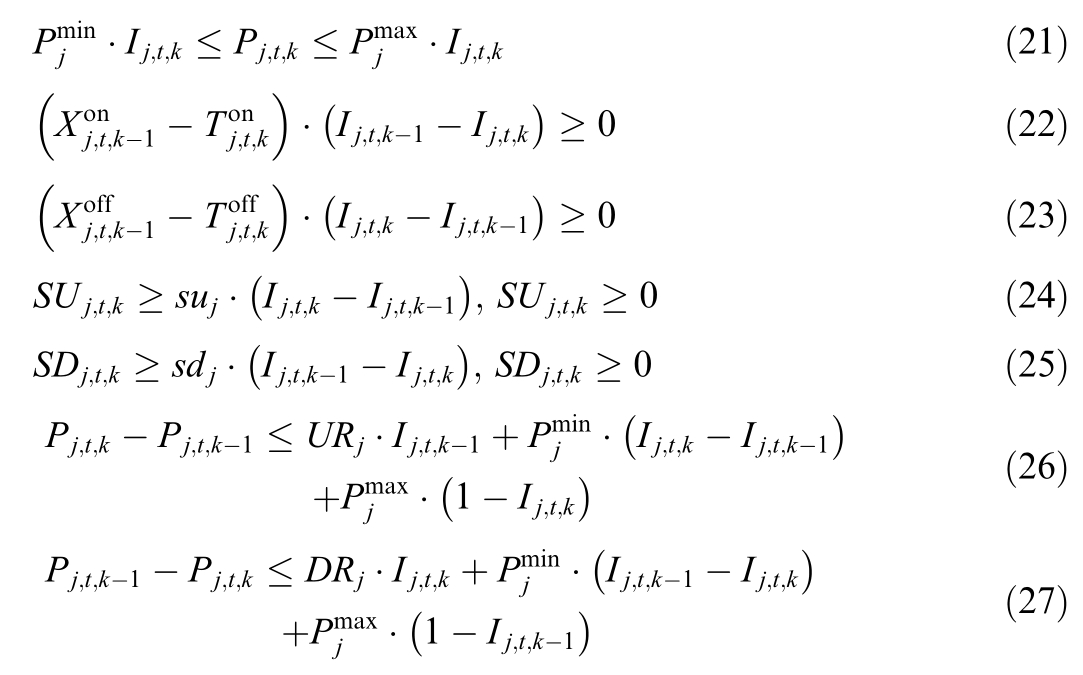
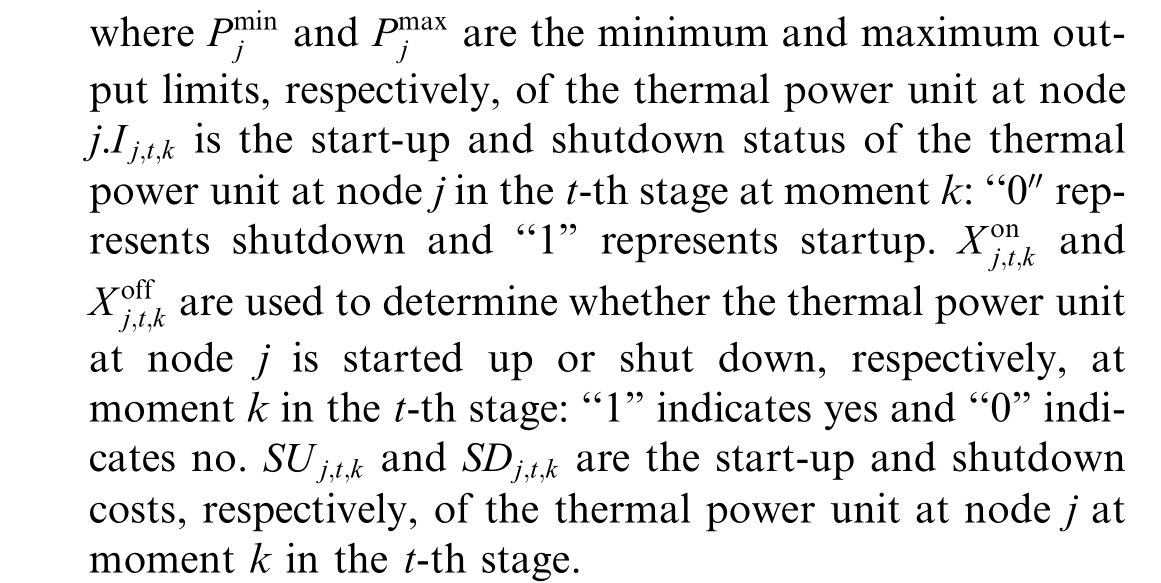
The constraints of thermal power units include the generator-capacity constraint(21), minimum start-up time constraint (22), minimum shutdown time constraint (23),start/stop constraints (24) and (25), and the ramp-up and ramp-down constraints (26) and (27), respect ively:
To ensure that the wind power output does not exceed the real-time forecast value of wind power,the constraints on wind power output are as follows:

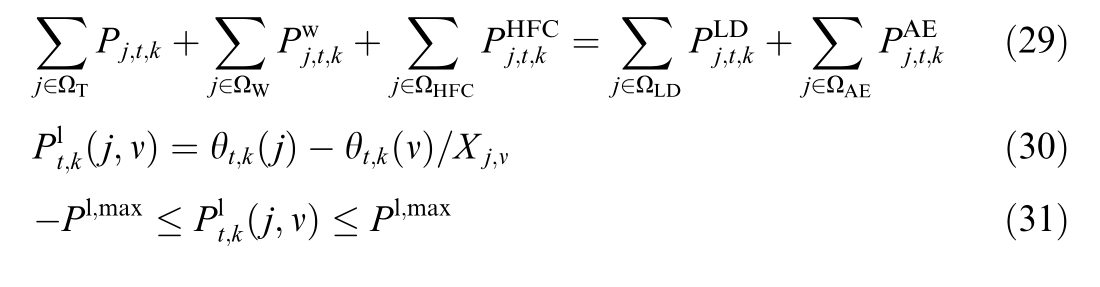
Flexible supply–demand balance constraints (29)–(32).The operational constraints of the power system include the supply–demand balance constraint (29), line flow calculated by the DC power-flow method (30), power-flow constraint (31), and phase-angle constraint (32), as shown below.

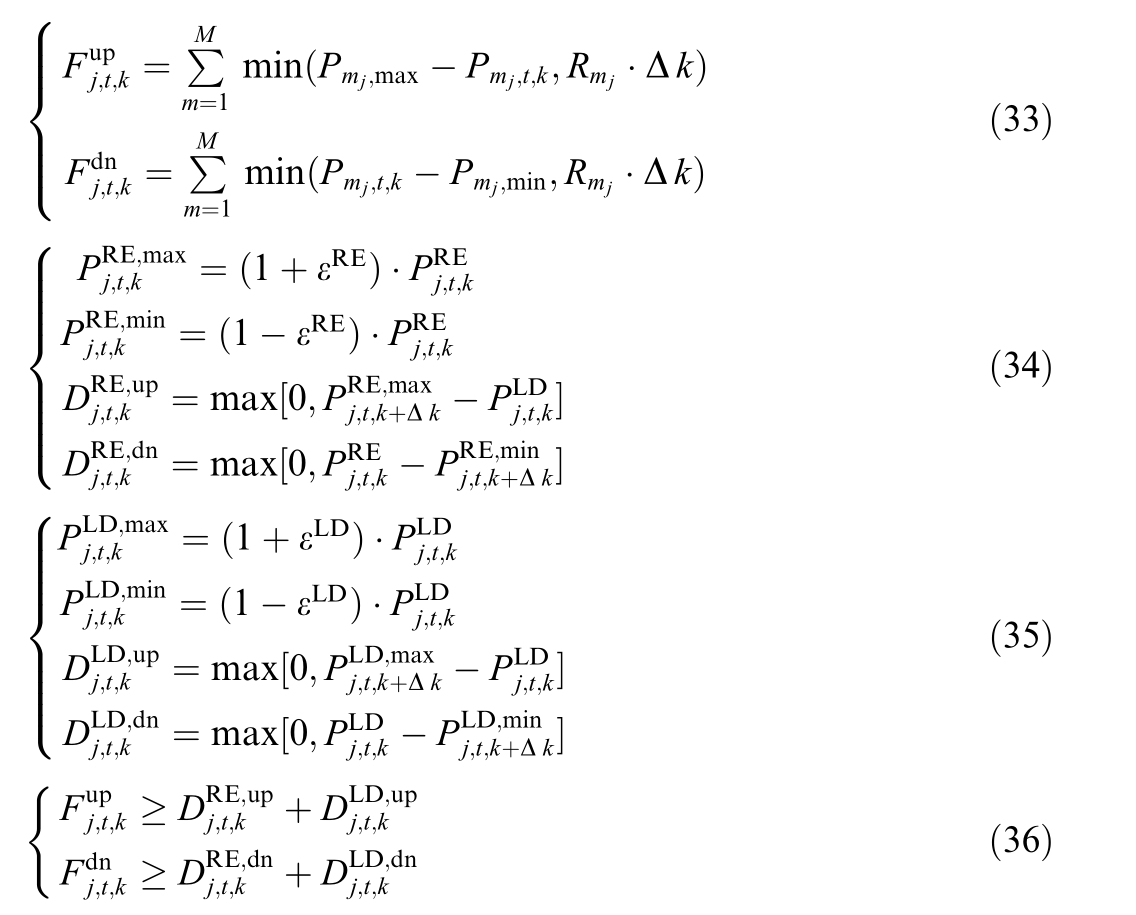
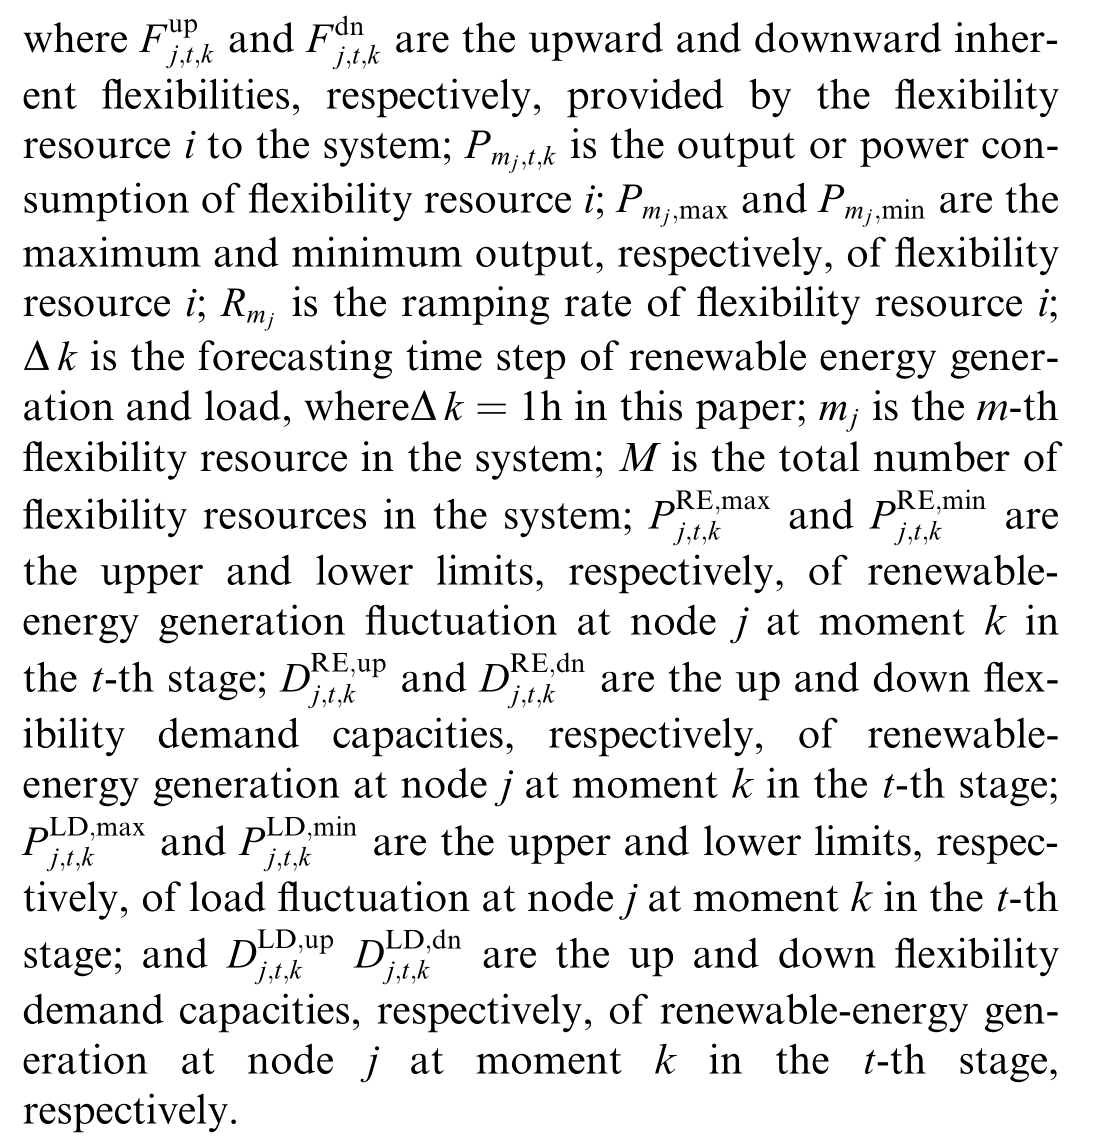
Various flexibility resources can provide upward and downward flexibility to the system, within their respective output ranges. Flexibility resources can offer dynamic flexibility within a certain time period. How ever, their supply range depends on their inherent flexibility, and they can only provide upward or downward flexibility within one time period.
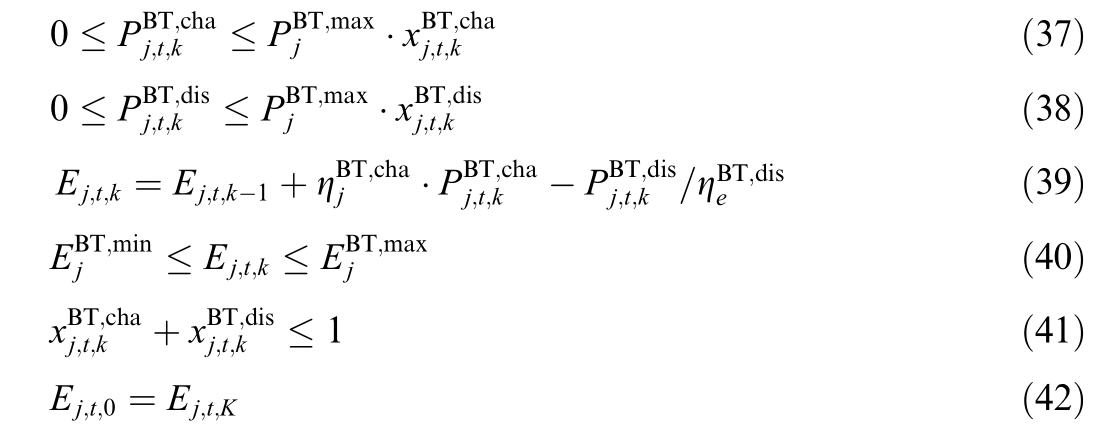
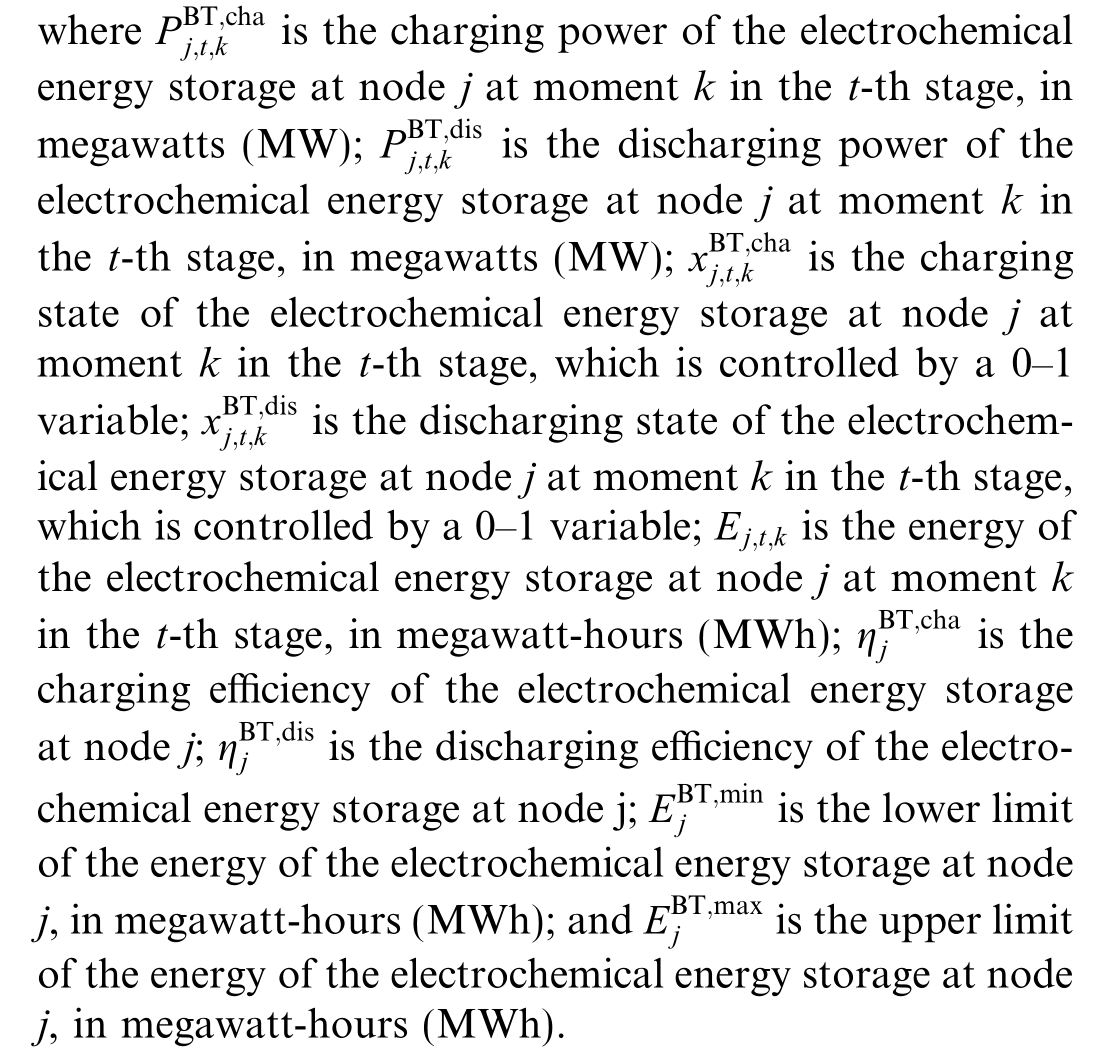
The energy model of electrochemical energy storage is shown in (37)–(42). The hourly charging and discharging powers are constrained by their corresponding upper and lower bounds, as shown in (37)–(48). The energy e volution equation is presented as Eq. (39). The energy is further restricted by the upper and lower capacity limits presented in Eq. (40). Constraint (41) prohibits simultaneous charging and discharging. Constraint (42) forces the initial energy level to be equal to the final energy level.
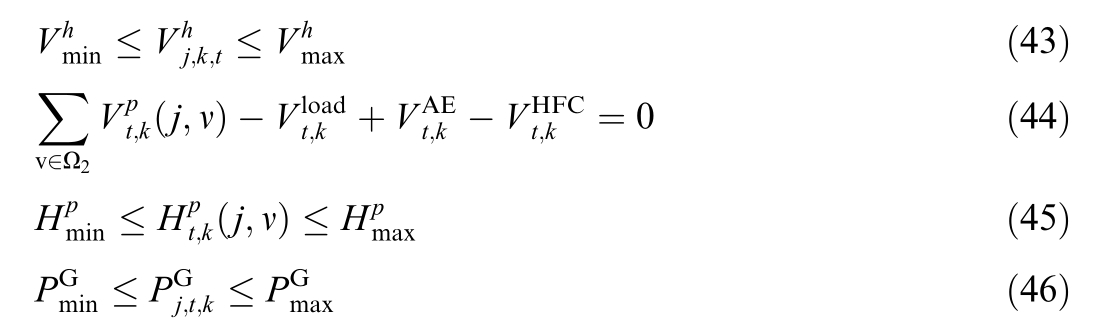
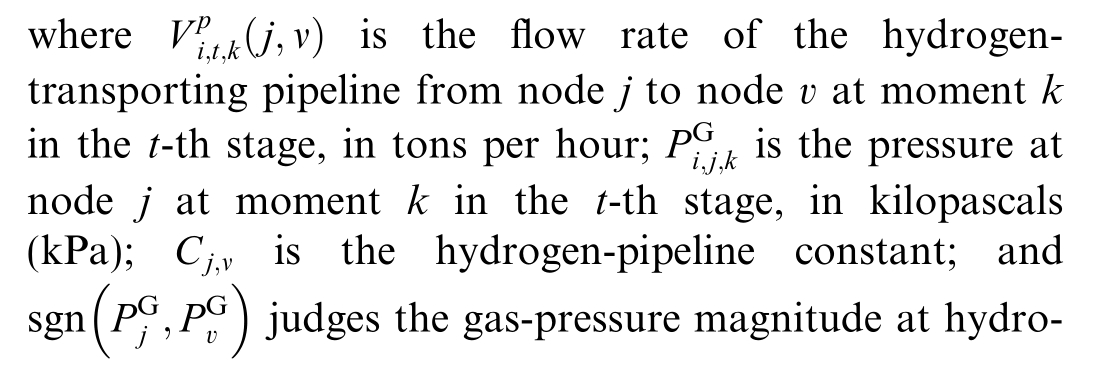
In the hydrogen system, the output of the gas source point is subject to the output limit constraint. During the operation process, it should be ensured that the pressure at each node and pipeline flow do not exceed the limits,and that the power balance constraints at each node of the hydrogen system are met, as shown in Eqs. (43)–(46).

The amount of hydrogen output by the electrolyzer is mainly determined by the electric power of the DC power supply input to the electrolyzer and conversion efficiency of the electrolyzer, as shown in Eq. (47). The upper and lower limit constraints of the input power of the electrolyzer are as shown in Eq. (48).

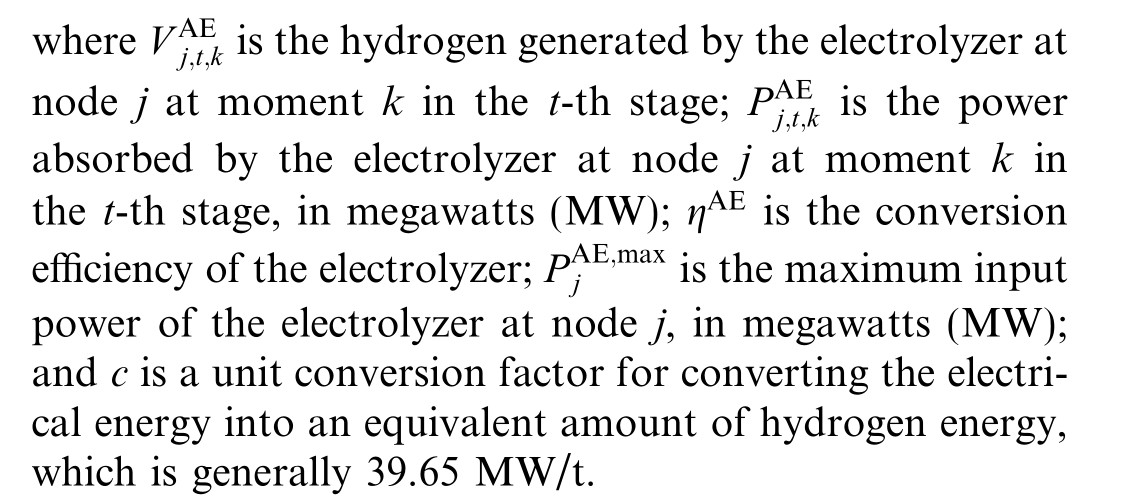
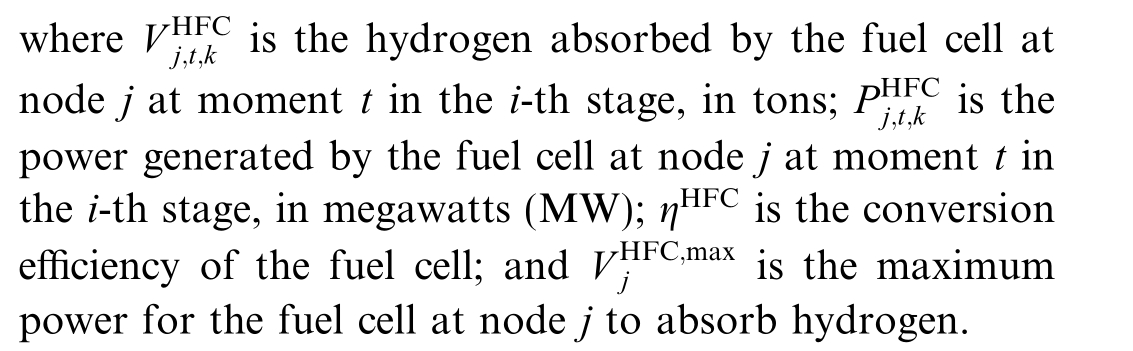
The output electric power of the proton-exchangemembrane fuel cell is mainly determined by the input hydrogen and conversion efficiency. Its simplified method of operation mechanism is the same as that of the electrolyzer, as shown in Eq. (49). The efficiency of hydrogen consumption per hour is constrained by its uppe r and lower bounds, as shown in Eq. (50).

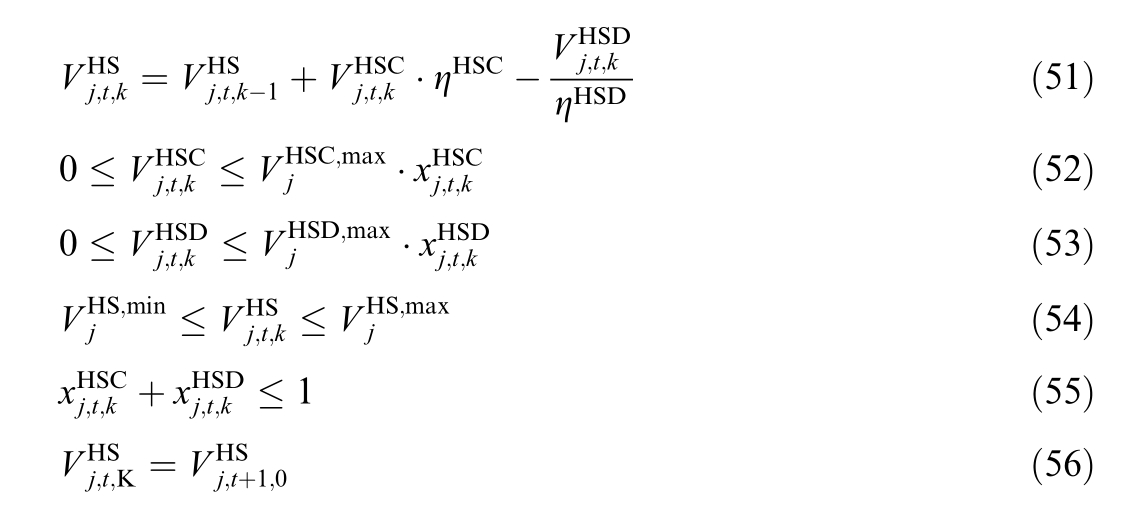
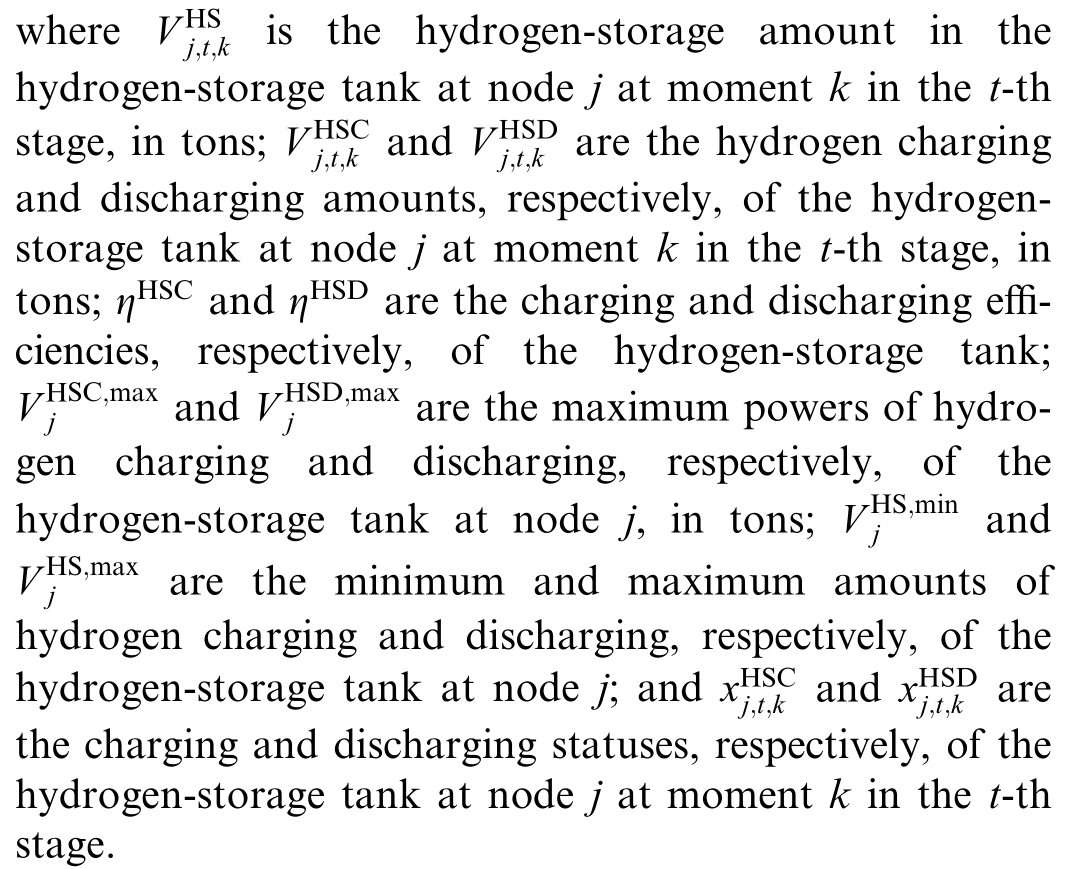
The operation of the hydrogen-storage tank is the same as that of the electrochemical energy storage in the power system. The current state of the hydrogen-storage tank is mainly determined by the hydrogen inflow and outflow rates at that moment and the remaining hydrogen stored in the tank in the previous moment, as shown in Eq.(51) The hourly hydrogen charging and discharging amounts are constrained by their corresponding upper and lower bounds, as shown in Eqs. (52) and (53). The hydrogen-storage amount is further restricted by the upper and lower limits of the capacity, as shown in Eq. (54).Constrai nt(55) prohibits simultaneous hydrogen charging and discharging. Constraint (56) enforces that the initial hydrogen-storage capacity of each stage equals the terminal capacity of the previous stage.
The output of the hydrogen-source point must meet the output limit constraint value, as shown in Eq. (57).

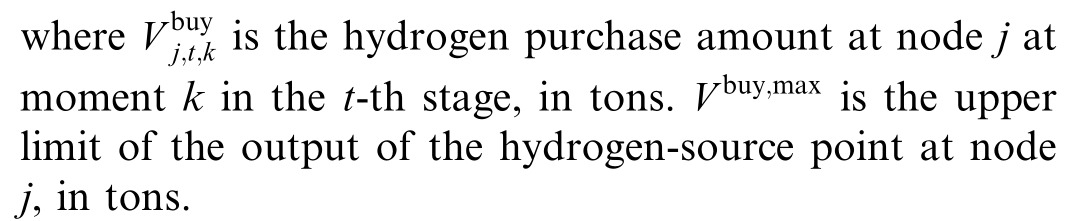
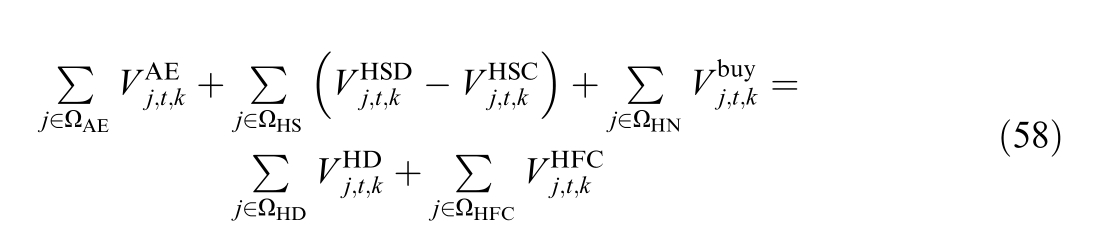
The EHCS also needs to meet the energy supply–demand balance constraint of hydrogen; that is, within each time stage, the pro duction, storage, and consumption of hydrogen must be kept in balance, as shown in Eq. (58).

3) Carbon emission reduction constraint
The traditional multistage planning approach for integrated energy systems typically prioritizes economic performance, with the planning horizon divided into stages based on the rate of load growth.In contrast,the planning model for the EHCS studied in this paper aims to not only ensure economic efficiency but also maintain low carbon emissions, in alignment with the evolving national carbon-reduction policies. Therefore, this study introduces a modified multistage planning method that uses carbon tax levels as the basis for stage division, segmenting the total planning period into N stages to facilitate step-bystep planning of the EHCS.
To constrain the system’s carbon emissions, a carbonreduction coefficient is introduced. The reduction in emissions resulting from this constraint is defined as the carbon-reduction index. Given that China’s carbonreduction policies and hydrogen-energy development are still in their early stages, different phases may impose different carbon emission requirements on the EHCS.Consequently, the carbon-reduction index is proportionally distributed across the planning stages to reflect these shifting targets.
The carbon-reduction targets for each planning stage are influenced by multiple factors, including the carbon tax levels, maturity of coupling technologies, and load growth. However, the overall trend reflects an increasing requirement for carbon reduction, over time. To facilitate modeling, this paper assumes that the growth rate of carbon-reduction targets across stages follows an exponential distribution, guided by a technology maturity factor.Let N represent the number of planning stages.For example, if the planning horizon is divided into five stages, the corresponding shares of the total carbon-reduction target can be assumed to be 6.76%, 13.44%, 20.07%, 26.62%,and 33.11%, respectively.
Considering real-world uncertainties, a certain degree of fluctuation is allowed in the stage-wise carbonreduction targets, while ensuring that the total carbonreduction target remains unchanged. In this study, a fluctuation margin of 5% is adopted. By applying constr aints on the carbon emissions for each stage based on these targets, a multistage planning model for the EHCS, which incorporates phased carbon reduction can be formulated.
The main sources of carbon emissions are traditional thermal power units and traditional industrial hydrogen production. In this study, the carbon emissions generated by supplying electricity and hydrogen loads entirely in traditional ways are regarded as theoretical carbon emissions.The carbon-emission-reduction amount at each stage is the difference between the theoretical and actual carbon emissions at that stage, which are presented in Eqs. (59) an d(60), respectivel y.
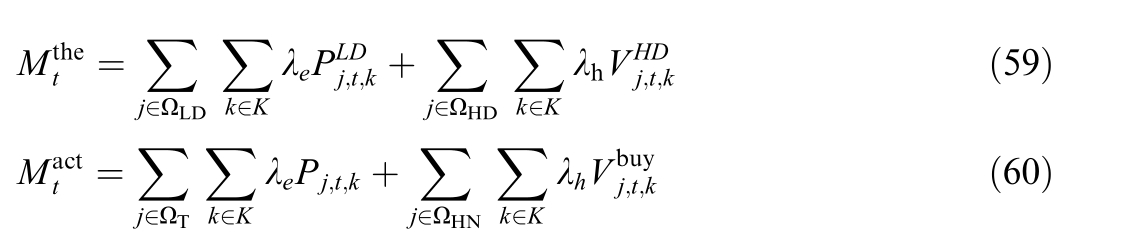
where λeis the carbon-emission coefficient per unit power of the thermal power units,in tons per megawatt-hour and λh isthecarbon-emission coefficient per unit power of the hydrogen-source point.
According to the annual electricity and hydrogen-load conditions, the total carbon-emission-reduction index of the EHCS system within the total planning period can be calculated, as shown in Eq. (61). Meanwhile, the carbon-emission-reduction amount at each stage should be greater than the carbon-e mission-reduction index decomposed to that stage, that is, Eq. (62).

where Mtheis the total carbon-emission-reduction index of the EHCS, in tons and σdecis the reduction coefficient.
4 Res ults
This section presents an improved IEEE 24-bus power system coupled with a 7-node hydrogen system, as a case study for the EHCS. The improved IEEE 24-bus system has a coal-fired generation capacity of 3650 MW, windfarm capacity of 500 MW, and peak load of 2850 MW[31,32]. The peak hydrogen load is 12.28 tons. According to the cost-based pricing method, using 2021 as the base year, the price of a green certificate is determined as the difference between the renewable-energy generation price and coal-fired power generation price. The renewableenergy generation price is obtained by calculating the weighted average of different types of renewable-energy generation proportions and their respective grid feed-in tariffs. The initial price of a green certificate is 50 CNY per certificate, and the initial price of carbon trading is 60 CNY per ton. The carbon-emission-reduction coeffi-cient is set to 0.7. The typical daily hydrogen load, electric load and wind-power output is shown as in Figs. 2–4.
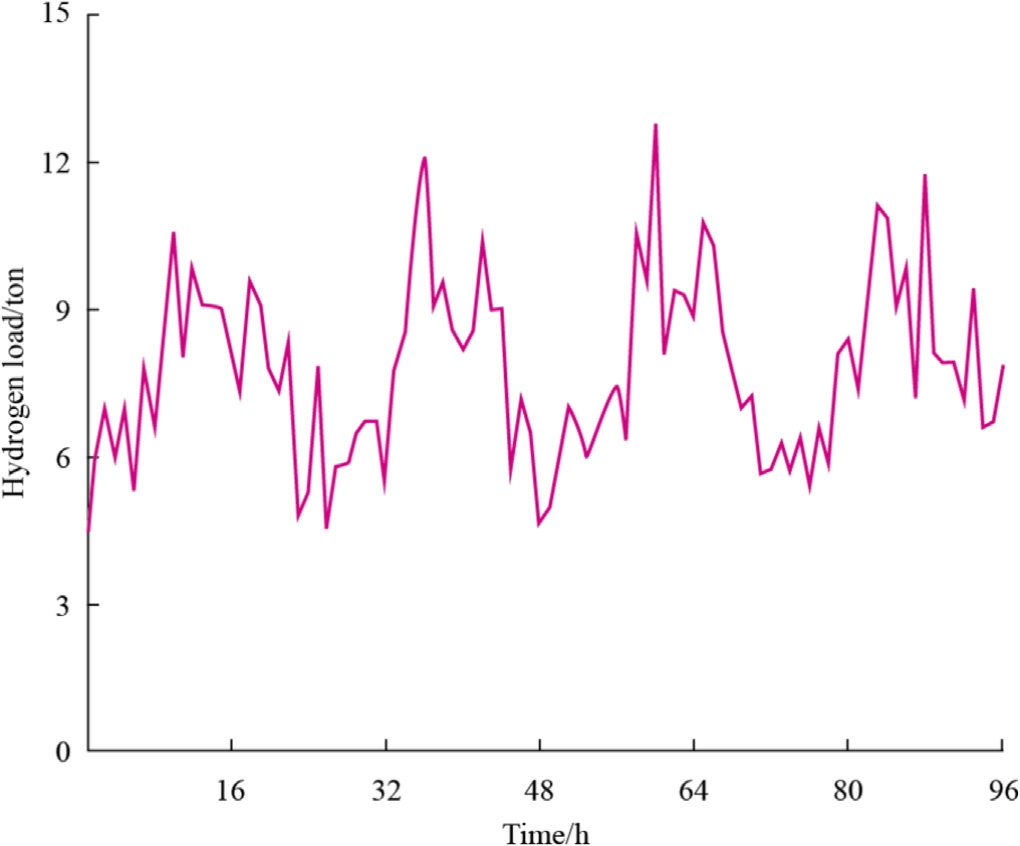
Fig. 2. Typical daily hydroge n load curve.
To validate the effectiveness of the proposed model,four planning cases for the EHCS are designed as follows:
Case 1: A multistage planning approach is adopted by dividing the planning horizon into five stages. However,the carbon-emission-reduction constraints, investments in power-to-hydrogen coupling equipment, and uncertainties in hydrogen load are not considered. The system is planned with the objective of minimizing the total cost.
Case 2: Based on Case 1, investments in electricity–hydrogen coupling equipment are incorporated. The system is planned with the objective of minimizing the total investment cost.
Case 3: Building upon Case 2, total carbon-emissionreduction constraints are introduced. The planning objective remains the minimization of the total investment cost.
Case 4: Based on Case 2, multistage carbon-emissionreduction constraints are considered. The syst em planning objective is to minimize the total investment cost.
The simulation results of each planning case are illustrated in Figs. 5–7.
Case 1: This case does not consider the deployment of electrici ty–hydrogen coupling equipment. As shown in Figs. 6–8, the system invests in 2100 MW of wind power and 5340 MW of electrochemical energy storage. The total cost amounts to 71.14 billion yuan and total carbon emissions reach 210 million tons.
Case 2: Building upon Case 1, this scenario incorporates the deployment of electricity–hydrogen coupling equipment. The system invests in 2900 MW of wind power, 970 MW of electrolyzers, 691 MW of hydrogen fuel cells, 1021 tons of hydrogen storage, and 1610 MW of electrochemical energy storage. The total cost is 45.37 billion yuan and total carbon emissions are 191 million tons.Compared to Case 1, the wind-power capacity increases by 800 MW, electrochemical storage capacity decreases by 3730 MW, total investment cost is reduced by 36%, and carbon emissions are reduced by 9.04%. The deployment of electricity–hydrogen coupling equipment enhances the system’s renewable energy penetration, provides a clean hydrogen-production pathway,improves economic performance, and contributes to carbon reduction.
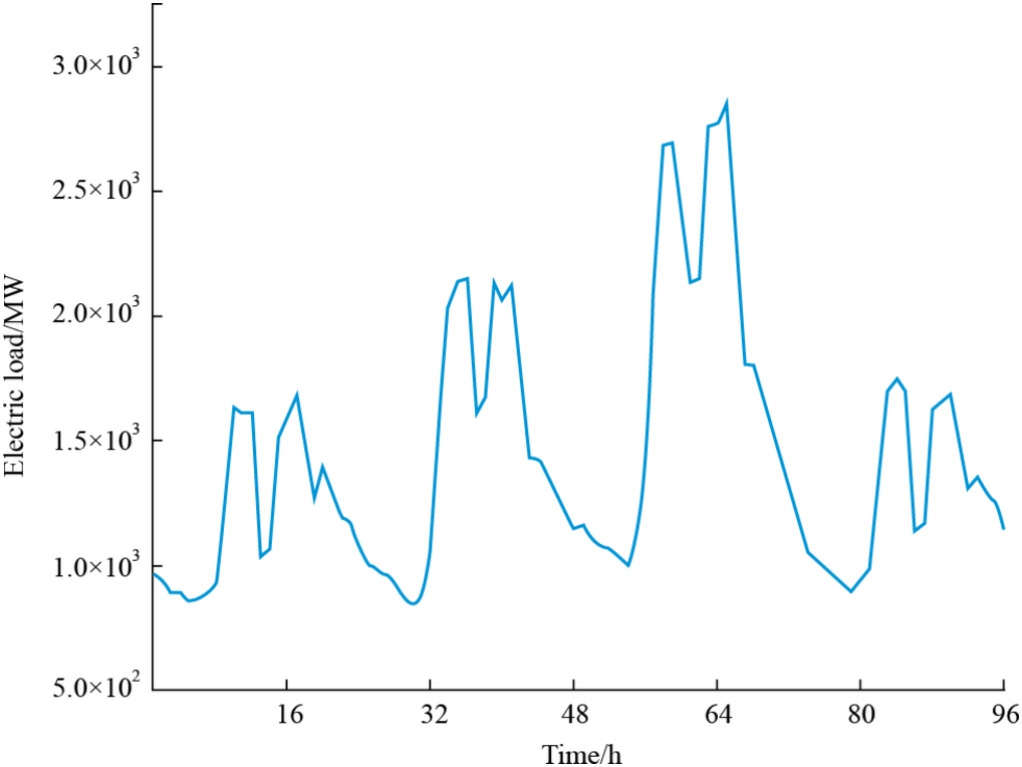
Fig. 3. Typical daily electric load curve.
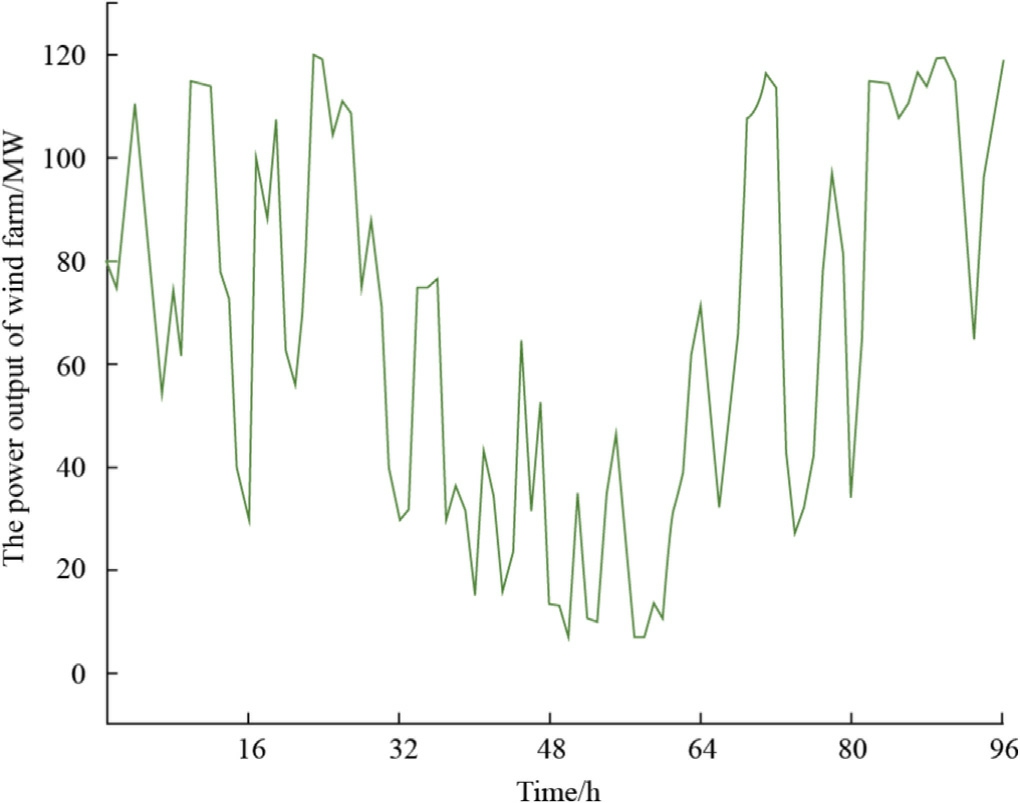
Fig. 4. Typical daily wind-power output curve.
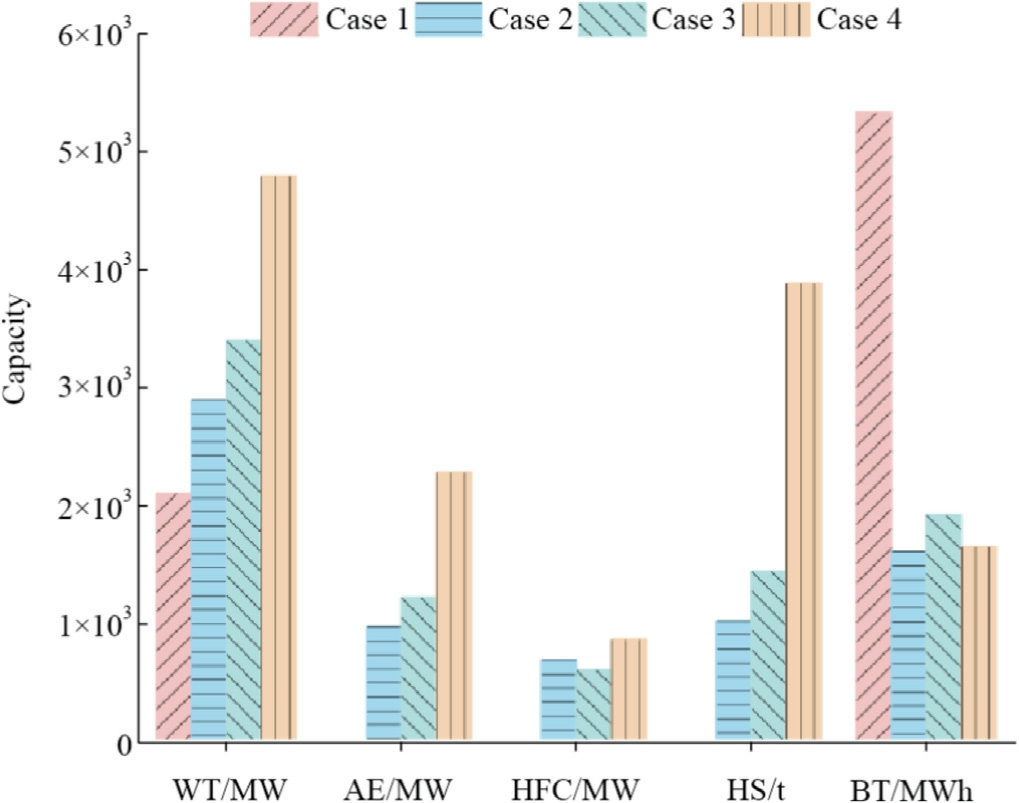
Fig. 5. Deployment of equipm ent in Cases 1–4.
Case 3: To further reduce carbon emissions, a total carbon emissions constraint is introduced. Compared to Case 2, the wind-power capacity increases by 500 MW, electrolyzer capacity increases by 250 MW, hydrogen storage expands by 423 tons, and electrochemical energy storage increases by 310 MW.As a result,the total investment cost rises by 1.38%,while carbon emissions drop by 24.35%.To meet the total carbon emissions constraint, the system sacrifices some economic efficiency to enhance energy utilization and reduce carbon emissions.
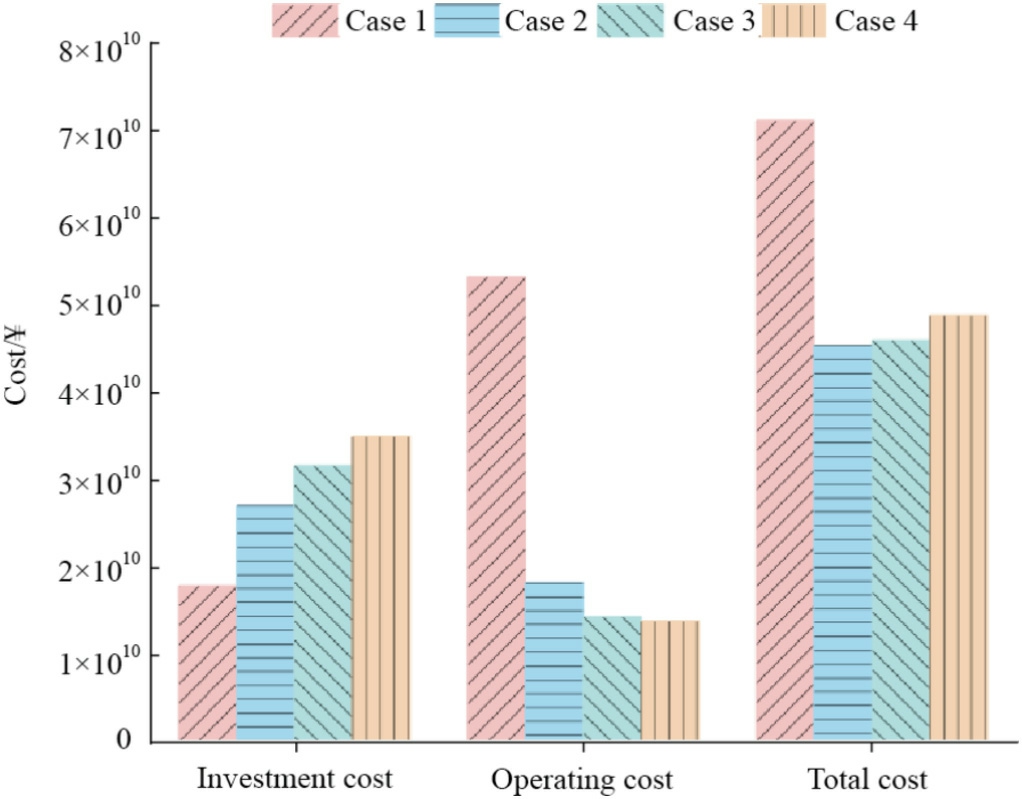
Fig. 6. Planning costs for Cases 1–4.
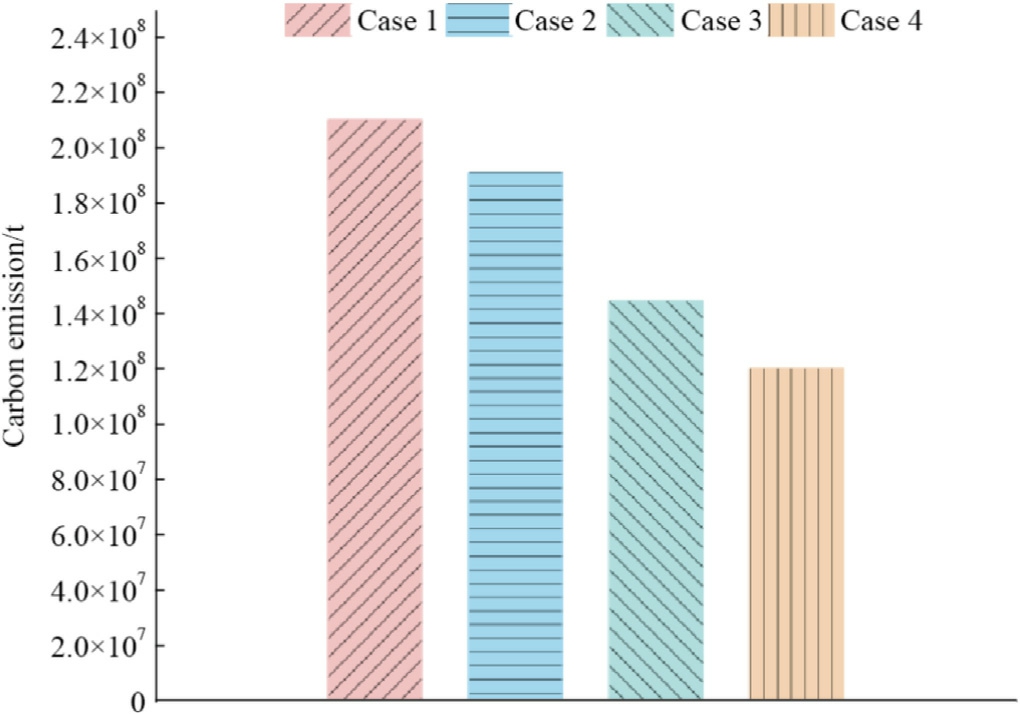
Fig. 7. Carbon emissions for Cases 1–4.
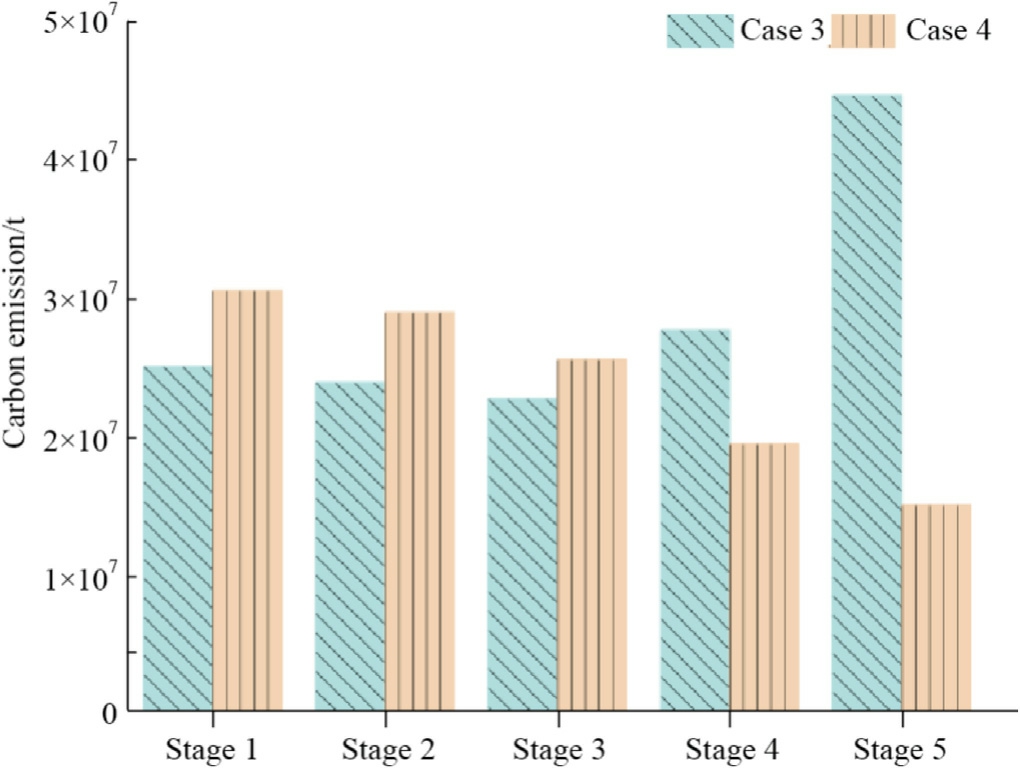
Fig. 8. Comparison between Case 3 and Case 4.
Case 4: This case further incorporates multistage carbon-reduction constraints, aligning more closely with China’s emission-reduction trends and policy objectives,and better addressing the current carbon-mitigation needs.The system invests in 4800 MW of wind power, 2280 MW of electrolyzers, 866 MW of hydrogen fuel cells, 3888 tons of hydrogen storage, and 1650 MW of electrochemical energy storage. Compared to Case 1, the total investment cost is reduced by 31.35% and carbon emissions are cut by 42.77%. The inclusion of electricity–hydrogen coupling equipment and multistage emission constraints significantly enhances the economic benefits while reducing emissions. Compared to Case 3, Case 4 achieves even greater emission reductions, with a more stable and policyaligned carbon-reduction trajectory across all planning stages, shown as in Fig. 8.
The above comparison demonstrates that the EHCS planning model with multistage emission-reduction constraints offers superior economic performance. By decomposing the total emission-reduction target across multiple stages, this model facilitates a more optimized distribution of carbon emissions over time, incurring only a minor economic trade-off.As a result,the proposed planning framework is better aligned with China’s emission-reduction policies and can more effectively meet the current policy requirements.
In the EHCS planning model with multistage emissionreduction constraints, the total carbon emission target directly determines the planning outcome. Therefore, different emission-reduction coefficients have different impacts on the overall system configuration and total carbon emissions. Based on Case 4, this study conducts a comparative analysis under different emission-reduction coefficients, the results of which are presented in Table 1.
In the multistage emission reduction planning of an EHCS, the carbon-reduction coefficient is a critical factor that directly affects both the total system cost and carbon emissions. As shown in Table 1, increasing the carbonreduction coefficient significantly chan ges these two metrics.
For example, when the reduction coefficient is set to 0.5,the system exhibits a relatively low total cost of 45.60 billion yuan, but with a higher carbon-emission level of 172.97 million tons. As the coefficient increases to 0.6and 0.7, the total system cost rises to 46.53 and 48.83 billion yuan, respectively, while the carbon emissions decrease to 154.29 and 120.07 million tons, respectively.This indicates that achieving stricter emission targets requires a trade-off in economic efficiency. This trend reflects the inherent cost–benefit trade-offs in system planning and implementation, when striving to meet higher environmental standards.
Table 1 Total system costs under differen t carbon reduction coefficients.

To verify the effectiveness of the model established in this study, four schemes are selected to plan the EHCS system:
Case 5: Without considering the carbon and greencertificate trading markets, multistage planning is performed with the minimum investment cost as the objective.
Case 6: Considering the carbon trading market, multistage planning is perfor med with the minimum investment cost as the objective.
Case 7: Considering the green-certificate trading market, multistage planning is performed with the minimum investment cost as the objective.
Case 8: Considering the carbon–green-certificate market linkage mechanism, multistage planning is performed with the minimum investment cost as the objective.
The cases obtained from simulation are listed in Tables 2–5.
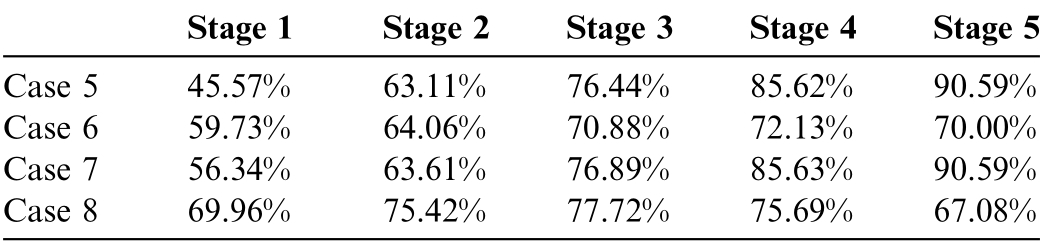
Table 2 summarizes the total number of equipment installed; Table 3 presents the construction, maintenance,operation, carbon-trading, and green-certificate-trading costs of each case, so as to compare the economy of each case. Table 4 shows the carbon-emission amount of each case. Table 5 resents the proportion of renewable energy output in each case.
Tables 2 and 3 indicate that the investment cost of Case 6 has a significant economic advantage over that of Case 5.By leveraging the carbon-trading market to flexibly manage carbon emissions, the planning scheme of Case 6 reduces the investment and construction costs by 14.59%.Although its operating costs increa se by 8.37% and it incurs additional carbon-trading expenses,the total investment cost is still 9.39% lower than Case 5 s 41.397 billion yuan.Moreover,the carbon-trading cost accounts for only 1.45% of the total cost.
As shown i n Table 4, Case 5 is constrained by a fixed carbon quota, preventing it from exceeding its emission cap, resulting in total carbon emissions of 1417.8 million tons. In contrast, Case 6 takes advantage of the carbontrading market to purchase additional carbon allowances,enabling it to exceed its initial carbon-emission limits. As a result, its total emissions increase by 22.51%, compared to that of Case 5. However, while ensuring compliance with environmental policies, Case 6 achieves greater economic efficiency. In summary, by flexibly managing carbon emissions through the carbon-trading market, Case 6 reduces the overall costs, despite an increase in emissions, making it the more economically beneficial option.
Table 2 Total planning scale of each equipment.

Table 3 Costs of each case.

Table 4 Carbon emissions of various cases.

Table 5 Proportion of renewable energy output in each case.
Compared to Case 5, Case 7 offers greater advantages in terms of both economic efficiency and flexibility. By participating in the green-certificate-trading market, the operation costs are reduced by 56.11%, relative to that of Case 5. Although its investment and construction costs increase by 3.75%, the overall cost is further reduced through green-certificate transactions, resulting in a total cost that is 9.25% lower than that of Case 5.
As shown in Table 5, in the final phase, the share of renewable-energy generation in Case 7 reaches 90.59%,exceeding the expected 70% threshold. Selling surplus green certificates further enhances the system’s economic performance. Additionally, Case 7 achieves a 6.76% reduction in carbon emissions, compared to that of Case 5,while successfully reducing costs and improving economic efficiency. In summary, Case 7 not only provides a cost advantage but also facilitates more flexible energystructure adjustments through participation in the greencertificate-trading market.
Case 8 adopts a flexible cost-management strategy by leveraging both the carbon and green-certificate trading markets. Compared to Cases 5, 6, and 7, its total investment cost is reduced by 18.19%, 9.7%, and 9.85%, respectively. Its carbon emissions increase by 9.31% and 15.45%,compared to that of Cases 5 and 7. Although its share of renewable-energy generation falls short of the expected target, Case 8 effecti vely reduces both the investment and total costs by strategically participating in carbon and green-certificate trading to generate revenue. The costs of carbon and green-certificate trading account for 2.29%and 12.09%, respectively, of the total cost, demonstrating the efficiency of market mechanisms in optimizing cost management.
In conclusion, Case 8 demonstrates clear advantages owing to its flexible cost management, support for largescale investment, and superior adaptability, making it an effective choice for addressing future energy-market challenges. By integrating carbon and green-certificate trading into its planning strategy, Case 8 achieves cost reduction while ensuring system effici ency and sustainability through market flexibility and optimized investment allocation.These combined advantages position Case 8 as an economically viable and adaptable solution, well-equipped to respond to future market fluctuations and policy adjustments.
5 Disc ussion
By considering a multistage emission-reduction constraint in the electro–hydrogen coupling system planning scheme, carbon emissions are reduced while ensuring both operational safety and economic performance. The multistage emission targets align each phase’s allowable emissions more closely with China’s evolving emissionreduction policies and trajectories, thereby better meeting current decarbonization requirements. Incorporating multiple market factors significantly enhances economic outcomes and decision-making flexibility. The introduction of the green-certificate and carbon trading markets enables the system to rapidly adapt to market fluctuations and policy shifts, thereby improving the consumption and utilization efficiency of renewable energy and providing effective strategic support for achieving China’s ‘‘dual carbon”goals.
Although the presented cases have demonstrated the effects of incorporating multistage emission reduction targets and market factors on the economic performance and low-carbon characteristics of the EHCS, they have not yet accounted for market and policy uncertainties. In future works, sensitivity analyses should introduce hydrogen price fluctuations and subsidy-phase-out scenarios to quantify their impacts on the payback period, total cost,and carbon-r eduction benefits. Cost-decline curves for electrolyzers and fuel cells should be integrated to dynamically optimize equipment investments within the multistage planning framework. Static- and dynamic-subsidy scenarios should be compared to explore the synergistic effects of combined uncertainties on the planning schemes.
6 Conc lusions
The development of EHCS, a crucial pathway for clean hydrogen production, is poised to be a key component of China’s energy transition. This paper introduced a multistage emission-reduction–based planning model for EHCS. Compared to the cases without emissionreduction considerations and those without electro–hydrogen coupling, the proposed model achieved 10.39% reduction in the total cost and 31% reduction in carbon emissions. The multistage emission-reduction constraints aligned the system’s carbon emissions with China’s evolving emission-reduction policies, thereby better adapting to current decarbonization demands. By incorporating a carbon–green-certificate market linkage mechanism, the system could rapidly adap t to market fluctuations and policy changes, enhancing the absorption and utilization effi-ciency of renewable energy. Compared to cases that did not consider market factors,the planning scheme considering the carbon–green-certificate market linkage mechanism reduced costs by 33.88%. Overall, the proposed model provides a robust strategic tool to support China’s‘‘dual carbon” goals, emphasizing the critical role of multimarket mechanisms in the development of EHCS.
CRediT authorship contribution statement
Jingbo Zhao: Writing – original draft, Methodology,Investigation, Formal analysis, Conceptualization. Zhengping Gao: Validation, Resourc es, Investigation. Tianhui Zhao: Writing – original draft, Visualization,Methodology, Investigation, Formal analysis. Cheng Huang: Validation, Resources. Zhe Chen: Writing – review& editing, Writing – original draft, Supervision,Conceptualization. Dajiang Wang: Writing – review & editing,Validation.
Declaration of competing interest
The authors declare the following financial interests/personal relationships which may be considered as potential competing interests: Jingbo Zhao, Tianhui Zhao, Zhe Chen, and Dajiang Wang are currently employed by State Grid Jiangsu Electric Power Co., Ltd. Research Institute.Zhengping Gao and Cheng Huang are currently employed by State Grid Jiangsu Electric Power Co., Ltd.
Acknowledgments
This study was supported by State Grid Jiangsu Electric Power Co., Ltd. Technology Project (Research on Planning and Operation Technology of Electric–Hydrogen Coupling System Driven by the Electric–Carbon–Green Certificate Market): J2024005.
References
[1]M. Filonchyk, M.P. Peterson, L. Zhang, V. Hurynovich, Y. He,Greenhouse gases emissions and global climate change: examining the influence of CO2, CH4, and N2O, Sci. Total Environ. 935(2024) 173359.
[2]M.K. Saraji, D. Streimikiene, Challenges to the low carbon energy transition: a systematic literature review and research agenda,Energy Strateg. Rev. 49 (2023) 101163.
[3]X. Qi, Y. Han, Research on the evolutionary strategy of carbon market under ’dual carbon’ goal: from the perspective of dynamic quota allocation, Energy 274 (2023) 127265.
[4]Z. Yang, H. Liu, Y. Yuan, Q. Wang, X. Zhao, Can renewable energy development facilitate China’s sustainable energy transition? Perspective from energy trilemma, Energy 304 (2024)132160.
[5]P. Martin and G. Aeria, ‘‘China’s carbon emissions may have peaked thanks to renewables push,” ABC News, 26 Jul. 2025.[Online]. Available: https://www.abc.net.au/news/chinas-co2-emissions-may-have-peaked-thanks-to-renewable-energy/105549598.
[6]Council of the EU, ‘‘Joint EU–China press statement on climate,”Press Release 638/25, European Council, Brussels, 24 Jul. 2025.[Online]. Available: https://www.consilium.europa.eu/en/press/press-releases/2025/07/24/joint-eu-china-press-statementon-climate/pdf.
[7]J. Wen, S. Wang, S. Yu, H. Li, Z. Chen, Low-carbon transition paths and benefits for the power sector at city level:a case study in Zhengzhou, China, J. Clean. Prod. 450 (May 2024) 141852.
[8]C. Ling, Q. Yang, Q. Wang, J. Zhang, M. Li, A comprehensive consumption-based carbon accounting framewor k for power system towards low-carbon transition, Renew. Sustain. Energy Rev. 206 (2024) 114866.
[9]Y. Bai, T. Zhang, Y. Zhai, L. Wang, H. Chen, Str ategies for improving the environmental performance of nickel production in China: insight into a life cycle assessment,J.Environ.Manage.312(2022) 114949.
[10]The National Energy Administration organized the release of the‘‘Blue Book on the Development of New Power Systems,iEnergy 2(2) (2023) 87–88.
[11]G. Yang, Y. Jiang, S. You, Planning and operation of a hydrogen supply chain network based on the off-grid wind-hydrogen coupling system, Int. J. Hydrogen Energy 45 (41) (2020) 20721–20739.
[12]G. Pan, W. Gu, Y. Lu, et al., Optimal planning for electricityhydrogen integrated energy system considering power to hydrogen and heat and seasonal storage, IEEE Trans.Sustain.Energy 11(4)(2020) 2662–2676.
[13]C. Wang, Z. Lu, J. Zhang, et al.,Planning and economic analysis of low-carbon transition of East China power system considering electricity-hydrogen coupling, Renew. Energy (2025) 123244.
[14]B. Lin, C. Huang, Analysis of emission reduction effects of carbon trading: market mechanism or government intervention?, Sustain.Prod. Consum. 33 (2022) 28–37.
[15]S. Yang, A. Jahanger, J. Hu, Y. Li,M.U.Khan,Impact of China’s carbon emissions trading scheme on firm-level pollution abatement and employment: evidence from a national panel dataset, Energy Econ. 136 (2024) 107744.
[16]State Council of China, ‘‘China’s national carbon market starts online trading,” Jul. 17, 2021. [Online]. Available: https://english.www.gov.cn/statecouncil/ministries/202107/17/content_WS60f210bfc6d0df57f98dd212.html.
[17]S. Schuman, A. Lin, China’s renewable energy law and its impact on renewable power in China: progress, challenges and recommendations for improving implementat ion, Energy Policy 51 (2012) 89–109.
[18]H. Wang, T. Feng, J. Kong, Z. Liu,Y.Zhang,Grappling with the trade-offs of carbon emission trading and green certificate:achieving carbon neutrality in China, J. Environ. Manage. 360(2024) 121101.
[19]Y. Hu, J. Li, Y. Chi, et al., Optimization of regional power lowcarbon transition pathways in China under differentiated tradable green certificates trading models, Renew. Energy 237 (2024)121845.
[20]Y. Liu, M. Chen, P. Wang, et al., A review of carbon reduction pathways and policy–market mechanisms in integrated energy systems in China, Sustainability 17 (7) (2025).
[21]L. Zhang, D. Liu, G. Cai, et al., An optimal dispatch model for virtual power plant that incorporates carbon trading and green certificate trading, Int. J. Electr. Power Energy Syst. 144 (2023)108558.
[22]Z. Tang, Y. Yin, C. Chen, C. Liu, Z. Li, B. Shi, A synergistic planning framework for low-carbon power systems: integrating coal-fired power plant retrofitting with a carbon and green certificate market coupling mechanism, Energies 18 (2025) 2403.
[23]A. Boretti, B.G. Pollet, Hydrogen economy: paving the path to a sustainable, low-carbon future, Int. J. Hydrogen Energy 93 (2024)307–319.
[24]Q. Hassan et al., Green hydrogen: a pathway to a sustainable energy future, Int. J. Hydrogen Energy 50 (Jan. 2024) 310–333.
[25]D. Bogdanov et al., Low-cost renewable electricity as the key driver of the global energy transition towards sustainability, Energy 227(Jul. 2021) 120467.
[26]M. Linke, T. Meßmer, G. Micard, G. Schubert, Power grid operation in distribution grids with convolutional neural networks,Smart Energy 17 (Jan. 2025) 100169.
[27]M. Urbina and Z. Li, ‘‘A combined model for analyzing the interdependency of electrical and gas systems,” in: Proc. 39th North Amer. Power Symp., Las Cruces, NM, 2007, pp. 468–472.
[28]M. Ni, M.K.H. Leung, K. Sumathy, Progress in hydrogen production from water electrolysis, Energy Environ. Prot. 5(2004) 5–9.
[29]S.Y. Ding, X.N. Lin, Z. Chen, et al., Design and dispatch strategy of a storage–hydrogen–cooling combined renewable energy consumption system for resource-rich islands, Proc. Chin. Soc.Electr. Eng. 39 (16) (2019) 4659–4673, 4969.
[30]P. Wang, W. Liu, Z. Lin, et al., Scenario analysis based collaborative site selection planning of wind farms and power-togas plants, Autom. Electr. Power Syst. 41 (6) (2017) 20–29.
[31]Y. Yin, C. He, T. Liu, et al., Risk-averse stochastic midterm scheduling of thermal-hydro-wind system: a network-constrained clustered unit commitment approach, IEEE Trans.Sustain.Energy 13 (3) (2022) 1293–1304.
[32]Y. Du, E. Wang, Z. Tan, et al.,Operation optimization of electrohydrogen coupling system under coupling of electricity,carbon,gas and green card market, Power Syst. Technol. 47 (8) (2023) 3121–3135.
Received 19 May 2025;revised 30 July 2025; accepted 11 September 2025
Peer review under the responsibility of Global Energy Interconnection Group Co. Ltd.
* Corresponding author.
E-mail addresses: zhaojingbo_sgcc@163.com (J. Zhao), zpgao@js.sgcc.com.cn (Z. Gao), tianhuizhaosgcc@163.com (T. Zhao),chenghuangsgcc@163.com (C. Huang), chenzhesgcc@163.com (Z. Chen),dajiangwangsgcc@163.com (D. Wang).
https://doi.org/10.1016/j.gloei.2025.09.003
2096-5117/© 2025 Global Energy Interconnection Group Co. Ltd. Publishing services by Elsevier B.V. on behalf of KeAi Communications Co. Ltd.
This is an open access article under the CC BY-NC-ND license(http://creativecommons.org/licenses/by-nc-nd/4.0/).

Jingbo Zhao received the B.S. degree from Sichuan University, Sichuan, China, in 2006 and the M.S. degree from Zhejiang University,Zhejiang, China, in 2008. He is currently a Professor-level Senior Engineer at the State Grid Jiangsu Electric Power Co., Ltd, Research institute. His research interests include power system stability analysis and control, FACTS/HVDC, electricity market mechanisms, and planning and operation of electro-hydrogen coupling systems.