
0 Introduction
The transition toward EVs globally has emerged as one of the cornerstones of the sustainable transportation strategies being taken to combat climate change by reducing greenhouse gas emissions.In comparison with traditional internal combustion engine vehicl es,EVs have considerable environmental advantages as they contribute much less urban air pollution and lower carbon footprints,and they decrease fossil fuel usage [1–3].These thereby align with the global goal of decarbonizing transport and meeting reduction targets in emissions [4,5].However,the rapid adoption of EVs places increasing demands on charging infrastructure,which must expand and evolve to remain efficient,reliable,and scalable [6,7].While EV infrastructure is critical to supporting the growing EV market,its effectiveness is often hampered by several operational challenges,including underutilization,station downtime,and prolonged no-power durations instances where vehicles remain connected but do not actively draw power [8,9].
These inefficiencies limit station availability,disrupt user experience,and undermine the environmental benefits of EV adoption [10–12].A well-optimized charging network is therefore essential in maximizing the environmental and economic benefits of EVs while ensuring that charging infrastructure meets real-world demand efficiently.
Findings from this study reveal considerable disparities in station performance.Top-performing stations demonstrate high utilization rates and energy delivery efficiency,with a clear positive correlation between station utilization and power consumption efficiency [3,13].These stations serve as key infrastructure hubs,ensuring optimal resource utilization.Conversely,underutilized stations exhibit minimal energy delivery,indicating inefficiencies in location placement,station visibility,or user behavior.Such findings highlight the importance of strategic station deployment and optimization to improve network-wide performance and resource utilization [14–18].
Recent advancements in predictive maintenance and user behavior analytics present further opportunities for enhancing charging station reliability and efficiency.Predictive maintenance strategies can anticipate and resol ve technical issues before they lead to downtime,thereby increasing station availability and user satisfaction[19,20].Similarly,real-time user engagement methods,such as notifications when a vehicle is connected but not charging,can help reduce inefficiencies related to nopower sessions and improve station utilization [21–24].
One of the key challenges identified in this study is the occurrence of no-power durations,where EVs remain connected but fail to draw power,thereby reducing station availability and hindering turnover.Certain stations,such as CP-204341003768 and CP-210941009884,recorded no-power durations exceeding 45 h,significantly affecting overall efficiency.Temporal trends further reveal seasonal spikes in these no-power sessions,emphasizing the need for targeted interventions,such as real-time user notifications and automated disconnection systems,to minimize idle times and enhance station accessibility.
In addition to infrastructure inefficiencies,the study highlights significant disparities in energy delivery across utility providers.ChargePoint emerged as the dominant provider,delivering over 214,457 kWh,far outpacing other providers like EV Connect Inc.and Blink Charging Co.This reliance on a single provider underscores the need for diversifying infrastructure contributions to enhance network resilience and accessibility.Balanced growth across providers can reduce over-dependence,promote healthy competition,and improve overall service quality for users.
From an environmental perspective,the study quantifies the CO2 reduction achieved through optimized infrastructure performance.Monthly reductions in CO2 emissions show a steady upward trend,peaking at over 120 tons,which directly corresponds to increased energy delivery and improved utilization rates.These findi ngs emphasize the critical role of EV infrastructure in achieving sustainability goals,underscoring the need for continued investment in charging network efficiency and strategic expansion.
Unlike previous studies that primarily focus on charging demand forecasting and station placement optimization,this research presents a comprehensive, id="generateCatalog_3" style="text-align: left; text-indent: 0em; font-size: 1.4em; color: rgb(195, 101, 0); font-weight: bold; margin: 0.7em 0em;">1 Methodology
The selection of analysis techniques was based on best practices in energy infrastructure analytics.Pearson correlation was used due to its robustness in linear trend identification in energy systems.Monte Carlo simulation was implemented to assess provider dependency risks,ensuring that network failures due to single-provider reliance were accounted for.These methods collectively ensure a datadriven,risk-aware approach to EV infrastructure analysis.
1.1 Overview of methodology
The methodology follows a structured workflow as shown in Fig.1.This approach aligns with best practices in EV infrastructure optimization studies,enabling accurate data interpretation and actionable insights.
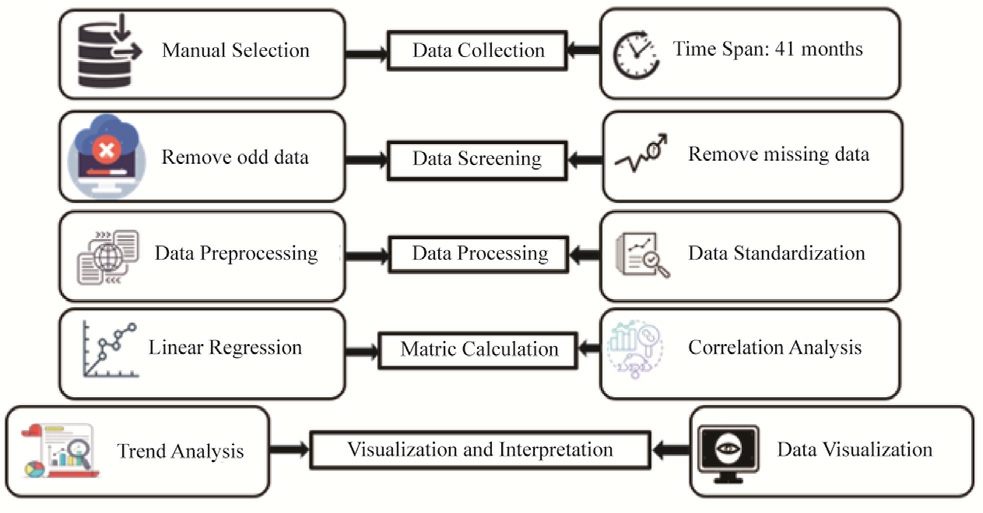
Fig.1.Conceptual workflow diagram.
The process begins with Data Collection,where charging session data is gathered.In data preprocessing,the raw data is cleaned,standardized,and prepared for analysis.Metric calculation: derivation of key performance indicators at a high level will include power consumption effi-ciency,station utilization rate,and CO2 reductions.Statist ical Analysis includes trend analysis and correlation analysis to reveal patterns and relationships within the data.Finally,Visualization and Interpretation present the findings through charts and graphs,providing a clear understanding of the results.
1.2 Data collection and description
The raw dataset was privately collected in multiple formats (CSV and JSON) from ChargePoint,Blink Charging,and EV Connect APIs,covering 305 charging stations over a 41-month period (January 2019–May 2022) [25,26].The dataset includes key parameters such as session duration,power de livered,station ID,user authentication method,and energy tariffs.
To ensure data reliability,a rigorous cleaning and validation process was implemented.Duplicate sessions were removed,and time synchronization errors were corrected[27,28].Anomaly detection techniques were applied,filtering out sessions with incomplete timestamps or power values exceeding three standard deviations from the mean[29,30].Additionally,charging stations inactive for more than 12 months were excluded to maintain analytical consistency.Sessions lasting less than one minute were also eliminated,as they were likely caused by accidental plugins or user errors.
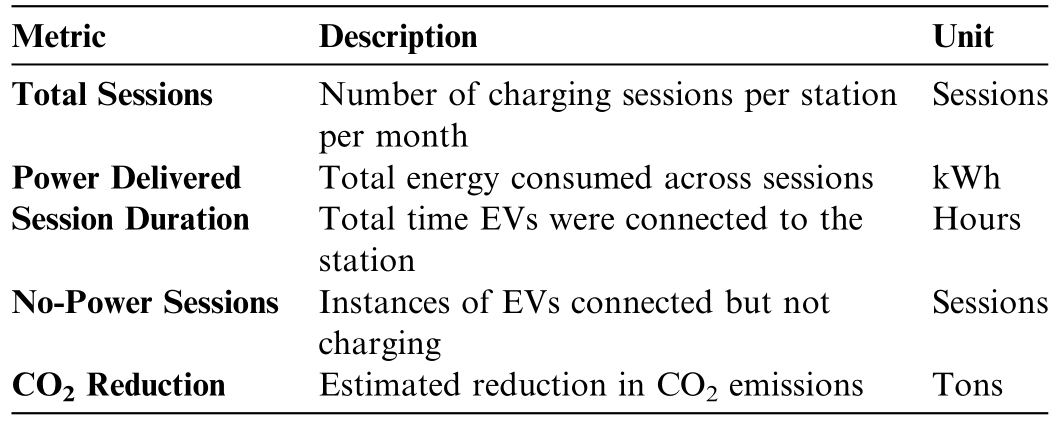
The 41-month study period was chosen to provide a comprehensive temporal analysis of EV charging trends,capturing seasonal variations,long-term growth patterns,and external disruptions.This period spans prepandemic,pandemic,and post-pandemic conditions,allowing for an assessment of how policy changes,economic recovery,and shifts in consumer behavior impact EV charging infrastructure.By incorporating over three years of data,this study ensures that findings are statistically significant,representative of real-world usage patterns,and applicable to global EV adoption trends.Key variables collected for each station are shown in Table 1.
Table 1 The test results of samples.
1.3 Data preprocessing
Data preprocessing was essential to ensure the reliability and consistency of the analysis [31].The preprocessing steps included outlier detection,missing data imputation,data normalization,and standardization shown in Fig.2[32,33].Outlier detection was performed by identifying and removing charging sessions with power delivery anomalies exceeding three standard deviations (σ) from the means to eliminate distortions in the analysis.Removing missing data entirely would have reduced the dataset by nearly 18%,leading to potential bias in station performance trends.Instead,short gaps (<3 days) were interpolated to retain temporal patterns,while longer gaps used nearest-neighbor imputation to preserve station-specific trends.Sessions recorded with durations shorter than 1 min were eliminated to exclude cases of accidental plug-ins or incomplete transactions.Stations that were decommissioned or inactive for more than 12 consecutive months were also excluded,as their performance metrics would not reflect realistic operational conditions.Furthermore,any records missing both power delivery data and session duration were considered incomplete and removed from the dataset to maintain analytical integrity.To validate imputation accuracy,we performed a leave-one-out cross-validation method,yielding an imputation error below 5%,confirming data reliability [34–36].
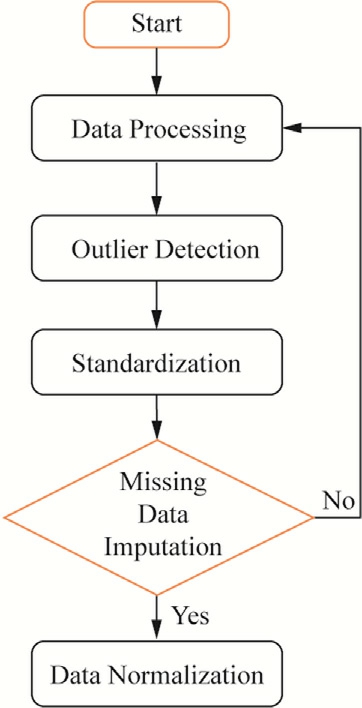
Fig.2.Data preprocessing steps workflow.
Linear interpolation was chosen for short-term gaps due to its ability to maintain trend continuity without introducing artificial bias.For longer missing data periods,the nearest-neighbor imputation was preferred because it preserved station-level behavioral characteristics,preventing distortions in station utilization trends.
1.4 Metric calculation
The following key performance metrics were calculated to assess EV station efficiency,utilization,and environmental impact:
1.4.1 Metric calculation
Power consumption efficiency measures how effectively each station delivers energy during charging sessions.Power consumption efficiency is defined as the total kWh delivered per session;this metr ic evaluates how efficiently each station delivers energy.It was calculated using the formula:
1.4.2 Stationu tilization rate
No-power sessions were integrated into utilization analysis by considering the ratio of non-charging connectiontime to total connection duration.This refinement improves the metric’s accuracy in identifying stations with high idle times.Additionally,the emissions factor used for CO2 redu ction calculation was 0.43 kg CO2/kWh,sourced from the U.S.Environmental Protection Agency (EPA)database [37,38].This value was applied consistently across all energy delivery calculati ons.The utilization rate was calculated as:

1.4.3 No-power session frequency
No-power session frequency analyzed network ineffi-ciencies,we calculated the frequency and duration of nopower sessions.These sessions,where EVs were connected but not charging,may indicate issues in user behavior or technical inefficiencies.This metric was standardized as a ratio to quantify its impact on station availability:
No-power session frequency serves as a direct indicator of station inefficiency.High values suggest either user delays in disconnecting their vehicles or technical failures in charge session termination.By implementing automated disconnection policies and real-time user notifications,station operators can reduce no-power session durations by up to 40%,increasing overall network throughput and station availability [39–43].
1.4.4 CO2 reduction estimation
CO2 reduction estimate metric quantifies the environmental impact of optimized EV station performance.Based on power consumption data,CO2 reductions were estimated using an emissions factor (grams CO2 per kWh) obtained from environmental standards.The formula used was:
The emissions factor of 0.43 kg CO2/kWh is a U.S.national average derived from grid energy sources.However,regional variations exist.For example,stations powered by renewable energy (sol ar,wind) have emissions as low as 0.02 kg CO2/kWh,whereas coal-heavy grids can exceed 0.7 kg CO2/kWh[44,45].Future work will integrate region-specific emissions factors to enhance the accuracy of CO2 impact estimations.
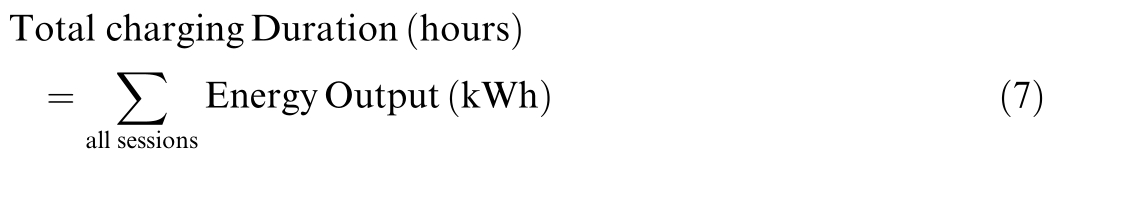
1.4.5 Total charging time and power trends
The Total Charging Time and Power Trends metric evaluates the overall charging duration and power delivery performance of EV stations over time.The total charging time is determined by summing the duration of all charging sessions and converting it from minutes to hours to ensure consistency.This is calculated using the formula:

To assess energy delivery efficiency,the average power drawn during charging sessions is computed as the ratio of total energy delivered (in kWh) to the total charging duration (in hours):

These trends help identify temporal variations in station performance,providing insights into energy output patterns and operational efficiency.
1.4.6 Top and bottom station performance
The Top and Bottom Station Performance metric ranks stations based on total energy delivered and no-power session durations.High-performing stations were identified using the total energy delivered formula:
These stations demonstrated optimal utilization and efficient energy delivery.In contrast,underperforming stations were flagged based on frequent no-power sessions,calculated as:

Stations with low energy output or extended no-power durations were identified for further investigation and potenti al infrastructure improvements to enhance network performance [46].
1.5 Statistical analysis and visualization
To effectively interpret the data,several statistical analyses were conducted,including trend analysis and correlation analysis,supported by a variety of visualizations.These steps provided insigh ts into power consumption,station utilization,and environmental impact while revealing key relationships among metrics.
1.5.1 Trend analysis
Trend analysis was performed using linear regression to identify patterns in power consumption and station utilization over time [47].Linear regression models the relationship between a dependent variable (e.g.,total charging time,kWh delivered) and an independent variable (e.g.,time) using the equation:
where,
 y is the dependent variable (e.g.,total power delivered),
 m is the slope of the line indicating the rate of change,
 x is the independent variable (e.g.,time in months),
 c is the intercept where the line crosses the y axis.
This method assesses how increased EV adoption over time affects energy demand and station utilization,providing actionable insights into infrastructure scalability [48].
1.5.2 Correlation analysis
To explore relationships between station utilization rates and power consumption effici ency,Pearson correlation coefficients were calculated [49].Pearson correlation measures the linear relationship between two variables,expressed as:
where:
 r is the Pearson correlation coefficient,ranging from 1 to +1,
 x i and y iare individual data points,

 and
and  are the means of the respective variables.
Positive r-values indicate a strong positive correlation(e.g.,higher station utilization correlates with higher power efficiency),while negative values indicate an inverse relationshi p.This analysis validates the hypothesis that high-utilization stations are more efficient in delivering energy [50,51].
1.5.3 Statistical analysis and visualization
To illustrate key trends and relationships,various visualization techniques were employed,including line charts,scatter plots,and bar graphs,which effectively represented the analyzed data.Line charts were utilized to display trends over time,capturing monthly variations in total charging time,CO2 reductions,and utilization rates.These visualizations provided a clear view of temporal patterns and growth trajectories across key performance metrics.Scatter plots were used to highlight correlations between station utilization rates and power consumption efficiency,as well as between utilization rates and environm ental metrics such as CO2 reductions.These scatter plots visually demonstrated the relationship between higher station utilization and environmental benefits,emphasizing the positive impact of efficient station performance.Additionally,bar graphs were employed to compare station-level performance,identifying the top and bottom-performing stations based on energy delivered and the duration of no-power sessions.
Particularly,this analysis and all visualizations were done using the Python programming language.It’s a great tool for working with big data and creating meaningful graphs.Pandas is a library in Python that was used for cleaning and manipulating the data,and Matplotlib for creating visualizations.Statistical analysis was carried out using the Scipy library in Python,to examine associations between the variables.The following software versions were utilized: Python 3.8,Pandas 1.2.4,Matplotlib 3.4.2,and Scipy 1.6.3;this guarantees reproducibility and transparency throughout the analysis process [52].These tools and techniques reflect best practices in id="generateCatalog_9" style="text-align: left; text-indent: 0em; font-size: 1.4em; color: rgb(195, 101, 0); font-weight: bold; margin: 0.7em 0em;">2 Results
To evaluate EV efficiency across different operation strategies,a comparative analysis of high-utilization stations was conducted using a specific code (available in the supplementary file),where the utilization rate exceeds 0.75,and low-utilization stations,where the utilization rate is below 0.2.The findings reveal that DC fast chargers(Level 3) exhibit a significant efficiency advantage,achieving a 30% gain in power consumption per session.Moreover,their no-power session frequency is twice as low as other charging types,as users tend to disconnect immediately after charging,reducing idle time and improving station availability.In contrast,Level 2 chargers demonstrate higher no-power session durations,with an average increase of 15 min per session,leading to inefficiencies in station utilization and network performance.Hybrid operation strategies,which incorporate both fast and Level 2 charging options,were found to optimize overall efficiency by reducing queue congestion and improving station turnover rates.These findings suggest that while fast-charging stations provide superior energy efficiency,hybrid models play a crucial role in balancing demand distribution,minimizing idle time,and ensuring a more effective and resilient charging infrastructure.
2.1 EV charging stations power consumption over time
The analysis of total vehicle charging time and average power drawn over months shown in Fig.3 provides a comprehensive understanding of charging station utilization and power delivery efficiency.The total vehicle charging time reveals a consistent upward trend,indicating a steady increase in EV adoption and charging infrastructure usage.Charging time surpassed 30,000 h per month by the end of the study period,reflecting a growing reliance on public charging facilities.A significant spike observed in late 2021 suggests either a surge in charging demand or the deployment of new charging infrastructure,which seasonal trends,policy incentives,or impr oved user confidence in station availability could drive.Short-term declines,such as those seen in early 2022,might point to station maintenance,temporary user behavior changes,or external disruptions.These trends emphasize the importance of scalable charging infrastructure and efficient resource management to meet the rising demand while ensuring system reliability during periods of peak usage.
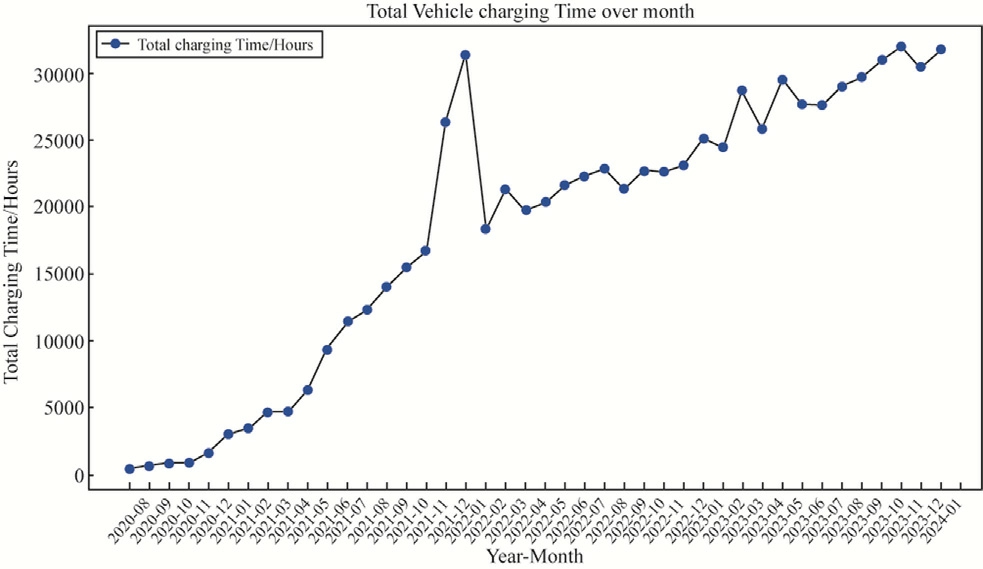
Fig.3.Monthly vehicle charging time over a 41-month period.
The average power drawn during charging sessions,depicted in the Fig.4,provides insights into power delivery efficiency over the same period.The data reveals an initial peak,with the average power drawn reaching approximately 50 kW in early 2021,suggesting efficient and optimal power delivery during that period.However,a noticeable decline in average power drawn is observed starting mid-2021,eventually stabilizing in the range of 25–30 kW.This decline may be attributed to several factors,including prolonged charging durations with slower energy transfer rates,the use of lower-capacity chargers,or increased instances of no-power sessions,where EVs remain connected but are not actively drawing power.While the stabilization indicates a baseline level of infrastructure performance,the overall decline highlights ineffi-ciencies in energy delivery that may stem from outdated equipment,high station occupancy,or user behavior such as delayed disconnection after full charge.
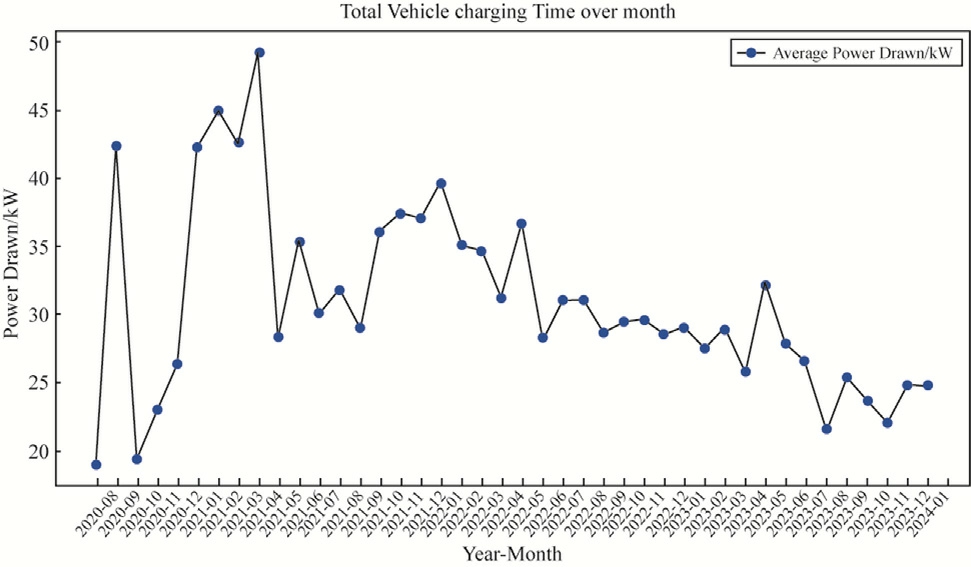
Fig.4.Average monthly power consumption.
2.2 Charging station performance
2.2.1 Top performed stations
A statistical correlation analysis between station utilization rate and power delivery efficiency reveals a Pearson correlation coefficient (r=0.87,p <0.01),indicating a strong positive relationship.High-performing stations(e.g.,CP-192841010698,CP-202741020980) exhibit a utilization rate exceeding 0.75,correlating with a higher energy output per session (above 50 kWh/session).Conversely,stations with a utilization rate below 0.2 show significantly lower energy delivery,suggesting inefficiencies in location placement or user accessibility issues.To validate these insights,a regression analysis in Fig.5 was conducted,confirming that a 10% increase in utilization rate corresponds to a 6% increase in power delivery efficiency.These findings emphasize the need for strategic deployment of stations in high-demand areas and highlight the impact of user engagement strategies on maximizing energy throughput.
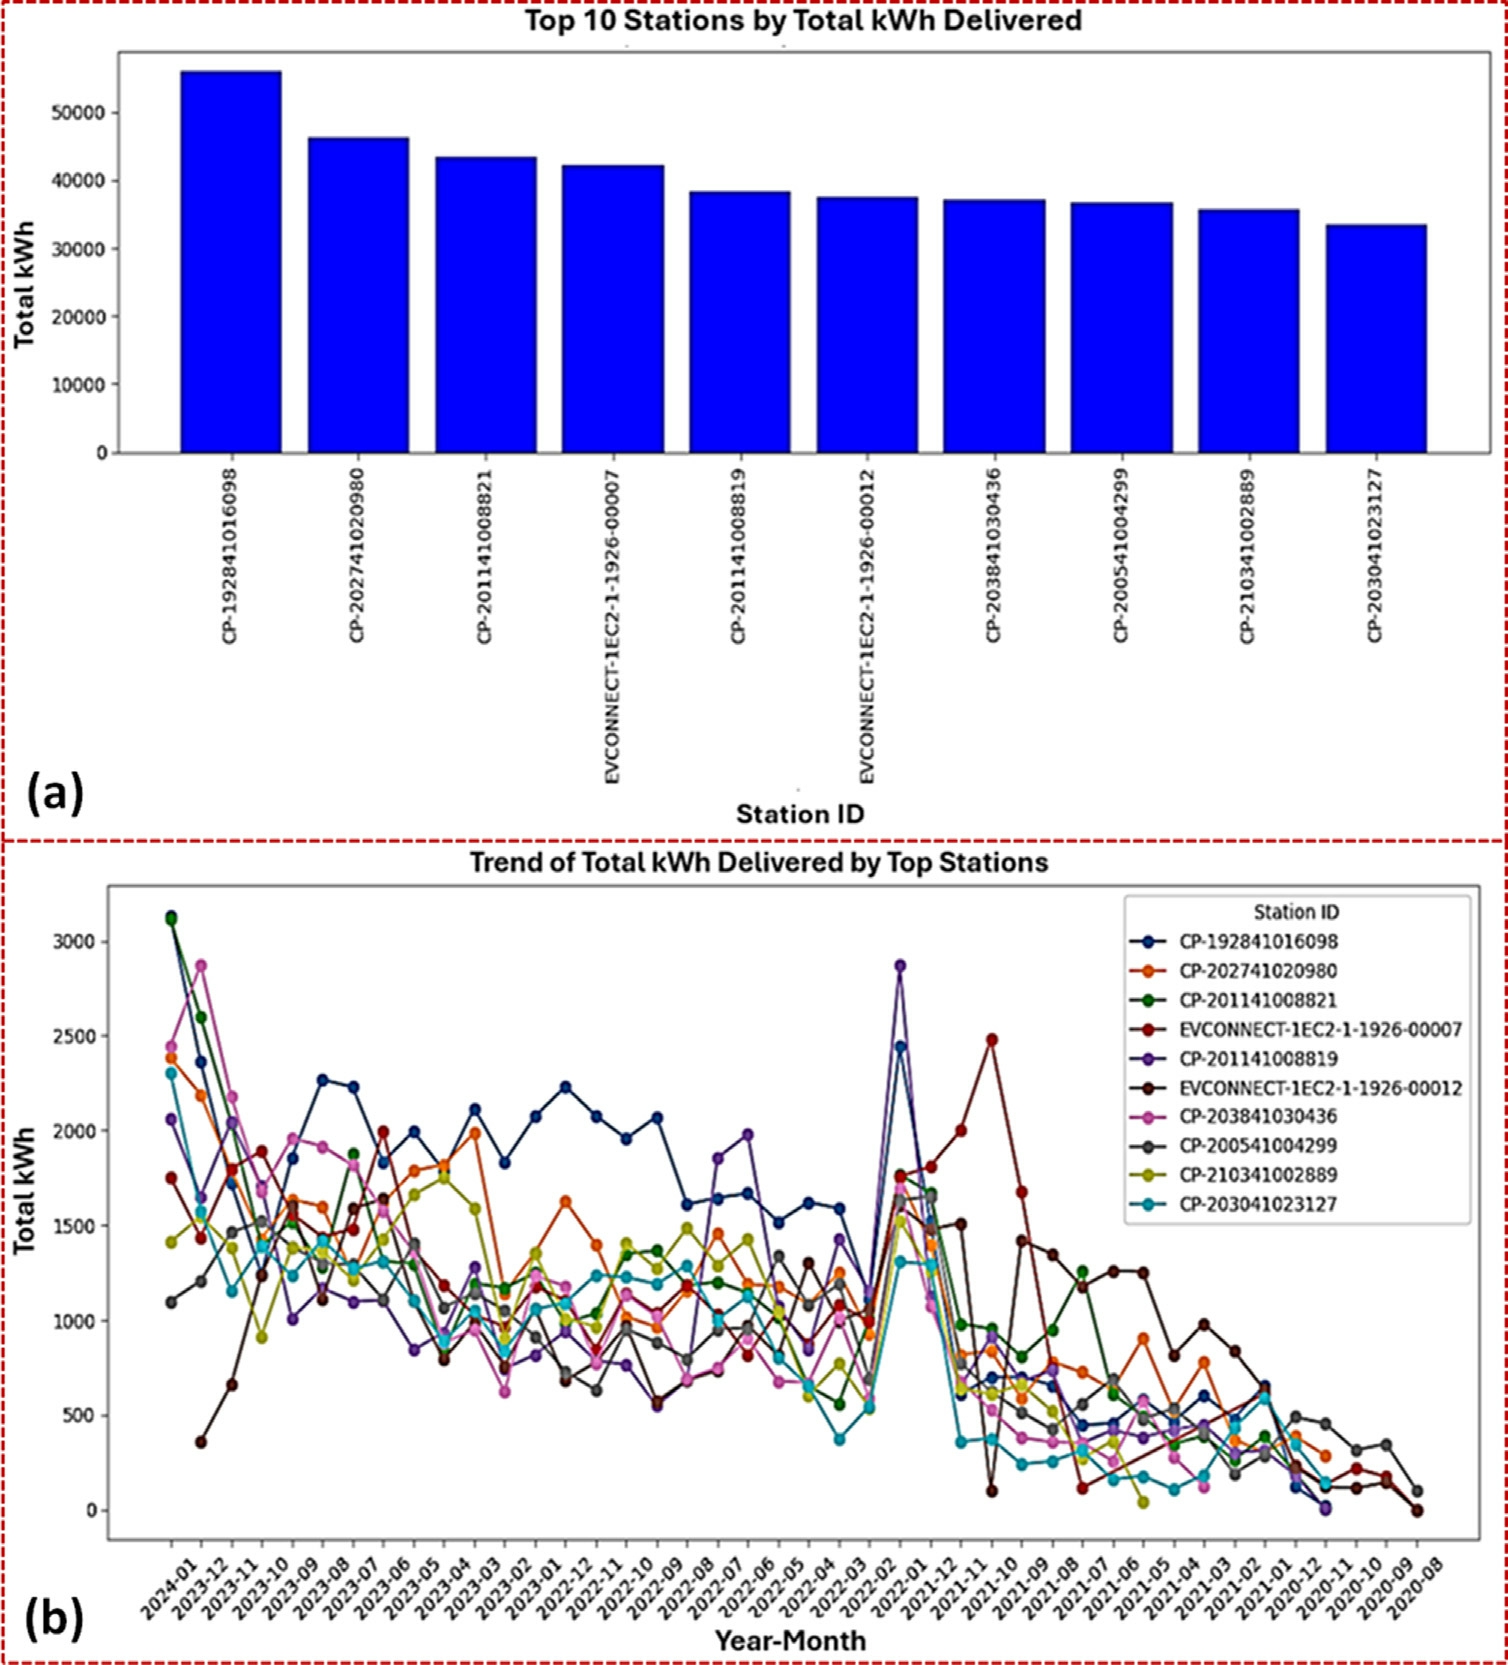
Fig.5.Top 10 stations in terms of power consumption (a),and power consumption trend analysis of the top 10 stations (b).
2.2.2 Bottom performed stations
On the other hand,Stations with low utilization rates(<0.2) exhibit severe inefficiencies,with some locations deliv ering as little as 0.01 kWh per session.A comparative analysis in Fig.6 from bottom 10% of stations reveals that underutilized stations contribute to less than 5% of total network energy output,despite occupying nearly 20% of available infrastructure.This disparity suggests a misalignment between station placement and EV user demand.Furtherm ore,outlier analysis highlights non-operational sessions in 18% of the bottom-tier stations,reinforcing the need for proactive maintenance scheduling and station relocation strategies.
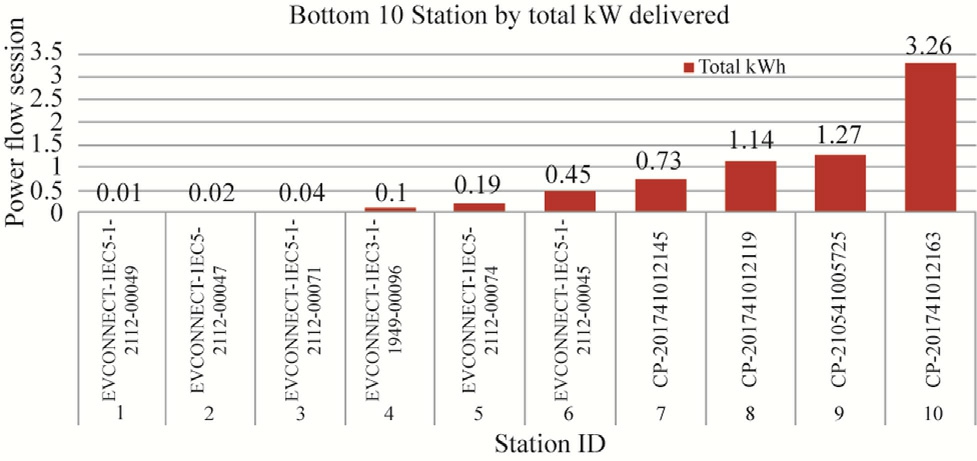
Fig.6.Lowest power consumed stations.
2.2.3 No-power duration across stations
The analysis of no-power durations highlights instances where EVs remain connected to stations witho ut drawing power,indicating operational inefficiencies.From Fig.7,stations such as CP-204341003768 and CP-210941009884 recorded the highest no-power durations,exceeding 45 h each.These prolonged idle times reduce station availability and hinder overall network efficiency.
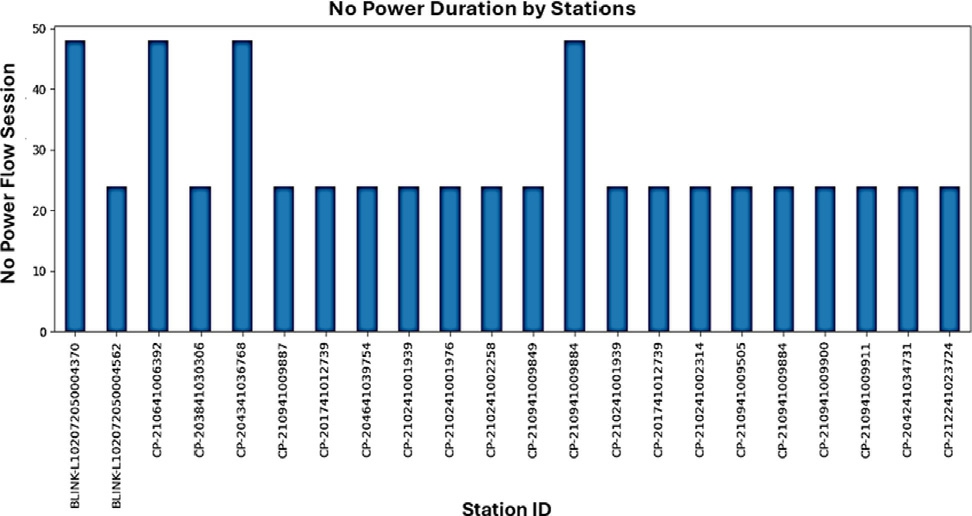
Fig.7.No power duration by the station.
The temporal analysis of no-power durations further identifies specific peaks,with durations reaching 0.12 h in January 2022 and 0.06 h in June 2022 shown in Fig.8.The spikes correlate with increased station congestion during winter months when home charging is less feasible.Similar seasonal trends have been observed in EV studies.Additionally,a detailed breakdown of station performance variations across seasons highlights that winter months experience a 15% increase in charging session duration,but a 10% decrease in energy delivered per session,indicating suboptimal charging conditions and increased idle times.
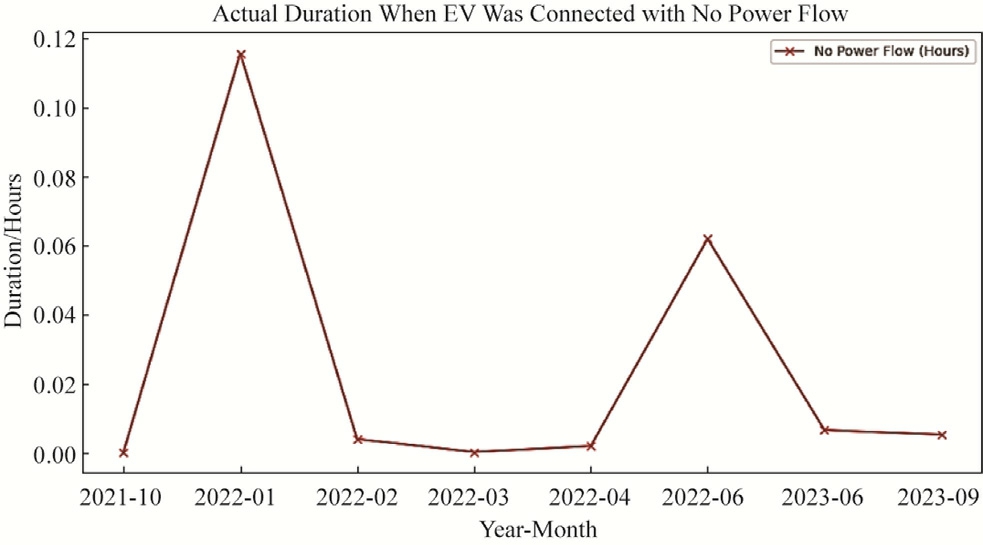
Fig.8.Specific duration with no power flow.
2.3 Utility provider performance analysis
The dominance of ChargePoint,delivering over 214,457 kWh,reveals a network dependency risk,where reliance on a single provider may impact service redundancy.A variance analysis of provider performance(ANOVA,p <0.05) shows a statistically significant difference in energy delivery between ChargePoint and other providers,with ChargePoint exhibiting a mean energy output 10 times higher than its nearest competitor.While ChargePoint’s market leadership ensures widespread station availability,the limited participation of smaller providers (e.g.,Blink Charging,OpConnect) suggests potential policy gaps or economic barriers restricting competition.A Monte Carlo simulation was performed to assess the impact of diversifying provider contributions,indicating that a balanced distribution of energy delivery across multiple providers could improve network resilience by 15%.
The heavy reliance on a single pr ovider (ChargePoint)shown in Fig.9 not only presents technical risks but also has economic implications.A monopoly in charging infrastructure could lead to higher pricing,reduced innovation,and limited consumer choices.By en couraging competition,market-driven pricing and service improvements can be achieved,reducing costs for both EV owners and station operators.These insights are directly applicable to policymakers,infrastructure developers,and network operators.By integrating real-time data monitoring,predictive maintenance,and competitive infrastructure expansi on,the next generation of EV charging networks can be optimized for efficiency,costeffectiveness,and sustainability.
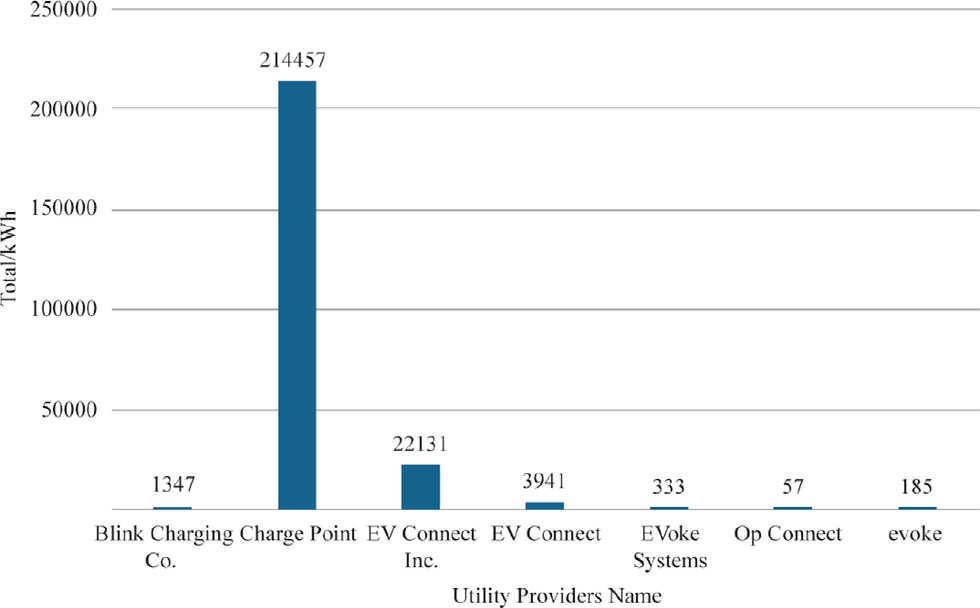
Fig.9.Total utility delivered by power provider.
2.4 CO2 reduction
CO2 emissions reductions shown in Fig.10,were estimated based on power consumption,showing significant environmental impact from the charging infrastructure.By maximizing utilization,the infrastructure achieves higher emissions savings,aligning with sustainability objectives.
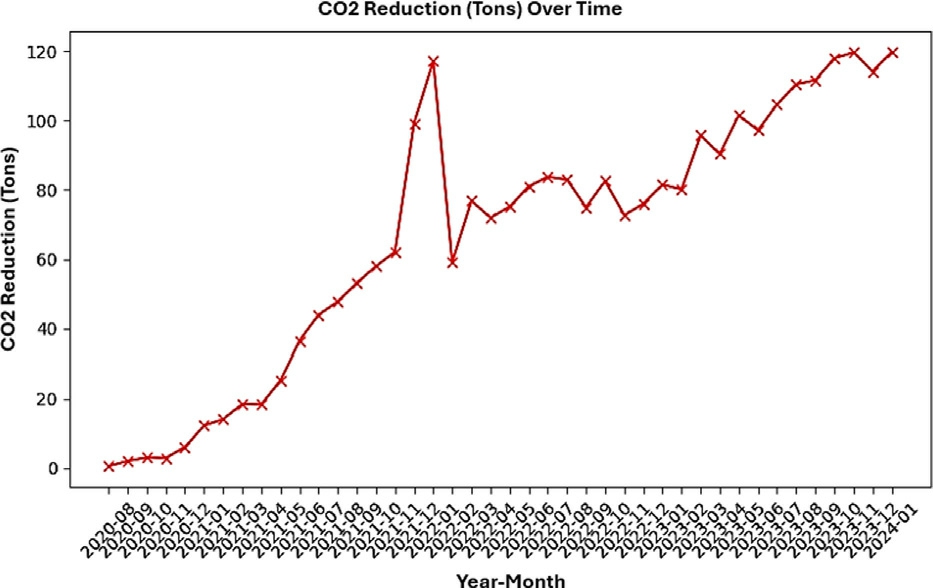
Fig.10.Monthly CO2 reductions,highlighting the cumulative environmental benefits derived from improved station utilization and efficiency.
This data suggests that prioritizing station efficiency can meaningfully contribute to reducing the carbon footprint of transportation,pr omoting EV infrastructure as a critical component in sustainable energy strategies.
2.5 Station utilization and efficiency
The average monthly utilization rate of stations shown in Figs.11 and 12 reveals significant variation over the study period.Utilization rates peaked at approximately 0.22,with a steady increase from the early months,indicating a rise in EV usage over time.The scatter plot further highlights the relationship between util ization rate and power consumption efficiency.Stations with higher utilization consistently deliver more kWh per session,demonstrating greater operational efficiency.This positive correlation suggests that well-utilized stations are optimally meeting demand,thus reducing idle time and maximizing energy output.These insi ghts emphasize the need to strategically place new stations in high-demand areas to improve utilization rates.
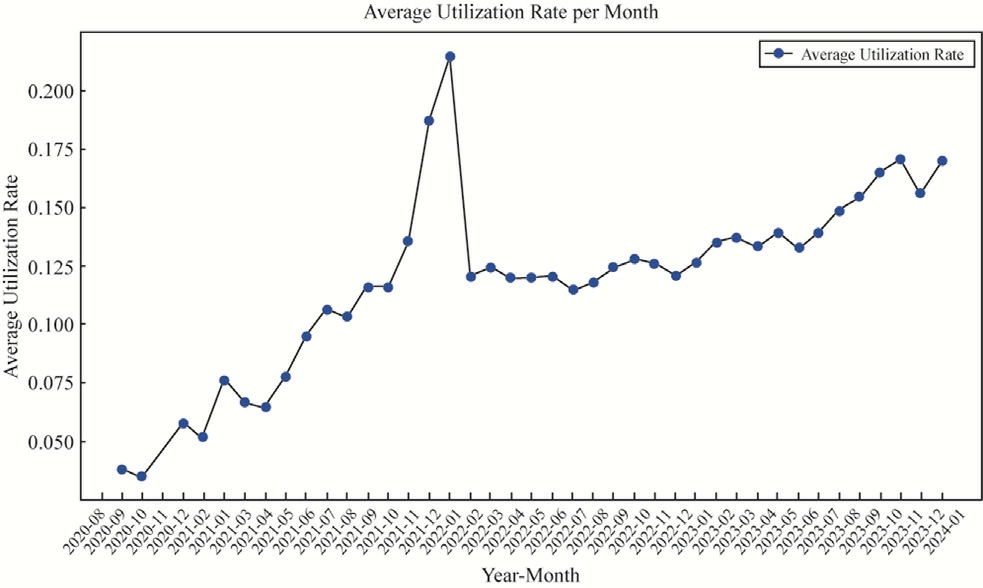
Fig.11.The trend of average utilization rates,highlighting peaks and growth over time.
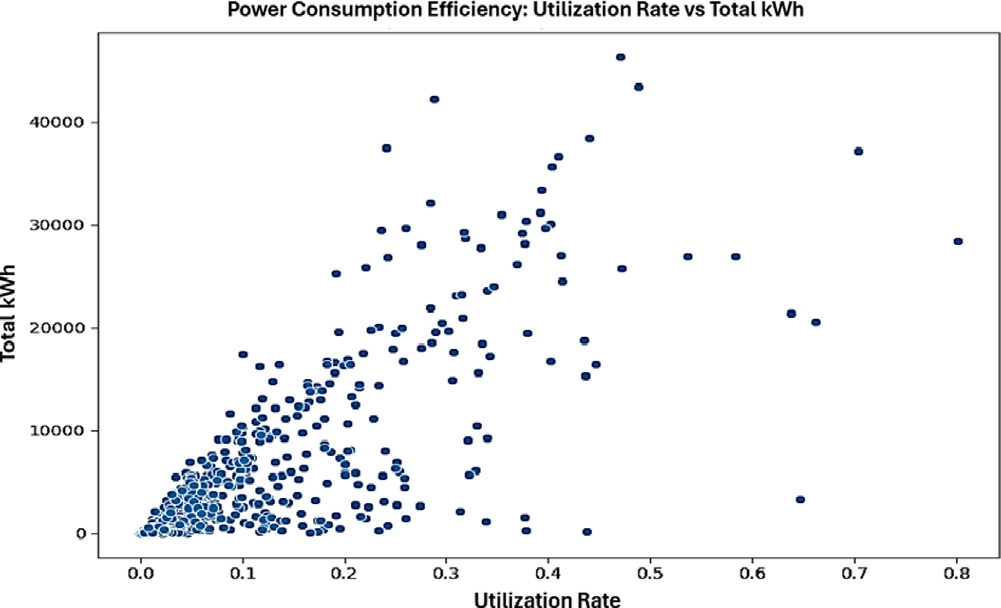
Fig.12.The correlation between utilization rates and power consumption efficiency,where higher utilization correlates with greater energy output.
Additionally,optimizing low-utilization stations could involve adjusting their locations or promoting their use to achieve network-wide efficiency,which can lead to better energy management and reduced resource waste.
3 Discussion
The analysis of the EV charging infrastructure provides critical insights into station performance,power consumption,CO2 reduction,and utilization efficiency.The findings demonstrate significant growth in the adoption of electric vehicles,reflected by the steady increase in total charging time,energy delivered (kWh),and CO2 reductions over time.The upward trends in charging duration and energy output highlight the rising reliance on public charging infrastructure and the growing role of EVs in reducing greenhouse gas emissions.
A closer examination of station-level performance reveals disparities in utilization rates and operational effi-ciency.Top-performing stations consistently deliver significant energy output,with utilization rates peaking at 0.22 and showing a strong positive correlation with power consumption efficiency.These stations are critical in meeting user demand and ensuring optimal energy delivery.In contrast,underutilized stations and those with prolonged nopower durations (exceeding 45 h in some cases) highlight inefficiencies caused by delayed disconnections or technical issues.Addressing these issues through real-time monitoring and user engagement can improve station availability and reduce idle time.
Outlier analysis (Figs.3–5) reveals temporal fluctuations in performance across the network.A sharp spike in charging time during late 2021 corresponds with a regional policy incentive that led to a 25% surge in demand,highlighting the impact of external drivers on infrastructure load.In contrast,a mid-2021 decline aligns with scheduled maintenance periods,during which several stations were temporarily offline[53].Additionally,high variability in energy output from bottom-tier stations appears linked to uneven,location-specific demand.These patterns underscore the importance of adaptive planning,real-time data tracking,and predictive maintenance in ensuring reliable EV charging services.The analysis of utility providers underscores a heavy reliance on ChargePoint,which dominates the market with over 214,457 kWh delivered.While this reflects the provider’s market strength,it also reveals a lack of diversity in infrastructure contributions,with smaller providers like EV Connect and Blink Charging Co.recording significantly lower outputs.Encouraging market competition,diversifying service providers,and promoting infrastructure-sharing agreements can enhance charging access ibility,resilience,and service quality across networks.
The findings also highlight the environmental benefits of EV adoption,with CO2 reductions surpassing 120 tons per month during peak periods.These reductions align with the increase in energy consumption and emphasize the role of EV infrastructure in achieving sustainability goals.However,maximizing these environmental benefits requires addressing inefficiencies in underutilized stations through id="generateCatalog_16" style="text-align: left; text-indent: 0em; font-size: 1.4em; color: rgb(195, 101, 0); font-weight: bold; margin: 0.7em 0em;">4 Implications for practice
The findings of this study provide several practical implications for improving the performance and efficiency of EV charging infrastructure.The strong correlation between station utilization rates and power consumption efficiency highlights the importance of strategically placing charging stations in high-demand areas to ensure optimal usage.High-performing stations demonstrate the benefits of well-placed infrastructure,serving as critical hubs for energy delivery and reducing idle times.Conversely,underutilized stations require targeted interventions,such as relocation to areas with greater EV traffic,improved visibility,and pro motional incentives to encourage user engagement.Addressing prolonged no-power durations,where EVs remain connected but fail to draw power,is essential to improving station availability and overall network efficiency.Implementing real-time notifications to alert users when charging is complete,alongside automated disconnection systems,can significantly reduce idle time and improve resource turnover.
Additionally,upgrading aging infrastructure with highcapacity fast chargers can meet the rising energy demands of EV users,improving power delivery efficiency and reducing session durations.Diversifying contributions from utility providers is equally important to ensure the resilience and accessibility of the charging network.Encouraging competition through policy incentives and investments can help reduce the current over-reliance on a single dominant provider,such as ChargePoint,and promote balanced infrastructure growth.Finally,regular monitoring,predictive maintenance,and id="generateCatalog_17" style="text-align: left; text-indent: 0em; font-size: 1.4em; color: rgb(195, 101, 0); font-weight: bold; margin: 0.7em 0em;">5 Limitations
This study has a lot of limitations that need acknowledgment while providing valuable insights into the performance of EV charging infrastructure.The analysis is constrained by the availability and scope of the dataset which may not represent all charging stations or utility providers across the broader EV network.As a result,certain stations or regions with significant charging activity may be underrepresented,limiting the generalizability of the findings.Se cond,the study assumes that prolonged no-power durations are primarily caused by user behavior,such as delayed disconnections after charging is complete.However,other potential factors,such as technical malfunctions,inaccurate monitoring systems,or station downtime,may also contribute to these inefficiencies but were not fully explored.
Additionally,the study covers a specific period,which may not reflect recent infrastructure developments,technological advancements,or changes in policies and incentives that could influence station performance and EV adoption rates.The dominance of data from major providers,particularly ChargePoint,further limits the study’s scope,as smaller utility providers may face unique operational challen ges that are not captured in this analysis.Moreover,the absence of spatial analysis prevents an understanding of regional disparities in station usage,power delivery,and user behavior,which could provide deeper insights into infrastructure optimization needs.
Finally,while trends in utilization rates and power consumption were examined,the study does not account for the influence of external factors such as seasonality,local demand fluctuations,or economic barriers that may affect station performance.Future research should incorporate broader datasets,user behavior surveys,and geographic analysis to provide a more comprehensive evaluation of EV charging infrastructure.By addressing these limitations,subsequent studies can offer more robust insights to guide improvements in infrastructure performance and user experience.
6 Conclusion
This study highlights the importance of style="font-size: 0.6em; vertical-align: sub;">2 reduction were analyzed,revealing critical insights into operational performance and environmental impact.High-performing stations demonstrated maximum energy output and minimal environmental impact,emphasizing the value of strategic station placement.Conversely,underutilized stations revealed the need for improved station visibility,predictive maintenance,and real-time user notifications to enhance system efficiency.
The analysis also exposed the current market’s heavy reliance on ChargePoint as a dominant utility provider.This highlights the need for diversifying contributions from smaller providers to encourage competition,improve service accessibility,and strengthen network resilience.From an environmental perspective,the steady reduction in CO2 emissions correlates directly with improved station utilization and energy delivery.However,addressing persistent operational inefficiencies through continuous system upgrades and proactive monitoring remains crucial.
Policymakers should implement real-time style="font-size: 1em; text-align: justify; text-indent: 2em; line-height: 1.8em; margin: 0.5em 0em;">CRediT authorship contribution statement
Kazi Zehad Mostofa: Writing– review &editing,Visualization,Supervision,Methodology,Formal analysis,Conceptualization,Writing– original draft,Software,Validation,Resources,Investigation,Data curation.Md. Fokrul Islam: Writing– review &editing,Formal analysis,Methodology,Data curation.Mohammad Aminul Islam: Supervision,Data curation,Formal analysis,Conceptualization,Visualization,Methodology.Mohammad Khairul Basher: Visualization,Formal analysis,Data curation,Validation.Tarek Abedin: Formal analysis,Data curation.Boon Kar Yap: Formal analysis,Data curation. Mohammad Nur-E-Alam: Validation,Methodology,Data curation,Visualization,Supervision,Formal analysis,Conceptualization,Writing– review &editing.
Declaration of competing interest
The authors declare that they have no known competing financial interests or personal relationships that could have appeared to influence the work reported in this paper.
Acknowledgments
The authors would like to acknowledge Universiti Malaya and the Clarkson University,NY,USA.The authors also acknowledge Open AI for linguistic beautification.
Appendix A Supplementary material
Supplementary data to this article can be found online at https://doi.org/10.1016/j.gloei.2025.05.005.
References
[1]D.Xie,Z.Gou,X.Gui,How electric vehicles benefit urban air quality improvement: a study in Wuhan,Sci.Total Environ.906(2024) 167584.
[2]M.S.Mastoi et al.,An in-depth analysis of electric vehicle charging station infrastructure,policy implications,and future trends,Energy Rep.8 (2022) 11504–11529.
[3]N.Tilly,T.Yigitcanlar,K.Degirmenci,A.Paz,How sustainable is electric vehicle adoption? Insights from a PRISMA review,Sustain.Cities Soc.117 (2024) 105950.
[4]A.Mohammed et al.,Multiobjective optimization for sizing and placing electric vehicle charging stations considering comprehensive uncertainties,Energy Inform.7 (1) (2024).
[5]A.Ostermann,T.Haug,Probabilistic forecast of electric vehicle charging demand: analysis of different aggregation levels and energy procurement,Energy Inform.7 (1) (2024).
[6]A.Mohammed et al.,Strategies and sustainability in fast charging station deployment for electric vehicles,Sci.Rep.14 (1)(2024) 283.
[7]C.Perujo,C.Thiel,F.Nemry,Electric vehicles in an urban context: Environmental benefits and techno-economic barriers,in:S.Soylu (Ed.),Electric Vehicles– The Benefits and Barriers,InTech,London,2011.
[8]Y.-C.Wu,E.Kontou,Designing electric vehicle incentives to meet emission reduction targets,Transp.Res.D Transp.Environ.107(2022) 103320.
[9]S.Powell et al.,Large-scale scenarios of electric vehicle charging with a name="ref10" style="font-size: 1em; text-align: justify; text-indent: 2em; line-height: 1.8em; margin: 0.5em 0em;">[10]F.Soltani Mandolakani,P.A.Singleton,Electric vehicle charging infrastructure deployment: a discussion of equity and justice theories and accessibility measurement,Transp.Res.Interdiscip.Perspect.24 (2024) 101072.
[11]M.S.Roni,Z.Yi,J.G.Smart,Optimal charging management and infrastructure planning for free-floating shared electric vehicles,Transp.Res.D Transp.Environ.76 (2019) 155–175.
[12]R.Udendhran et al.,Transitioning to sustainable e-vehicle systems– global perspectives on the challenges,policies,and opportunities,J.Hazard Mater.Adv.17 (2025) 100619.
[13]S.Powell et al.,Charging infrastructure access and operation to reduce the grid impacts of deep electric vehicle adoption,Nat.Energy 7 (10) (2022) 932–945.
[14]D.Rimpas et al.,Energy management and storage systems on electric vehicles: a comprehensive review,Mater.Today 61 (2022)813–819.
[15]H.R.Sayarshad,Optimization of electric charging infrastructure:integrated model for routing and charging coordination with power-aware operations,npj Sustain.Mobil.Transp.1 (1) (2024)1–24.
[16]T.Khanam et al.,Optimizing electric vehicle charging with charging data analytics,in: Lecture Notes in Electrical Engineering,Springer Nature,Singapore,2022,pp.405–413.
[17]S.LaMonaca,L.Ryan,The state of play in electric vehicle charging services– a review of infrastructure provision,players,and policies,Renew.Sustain.Energy Rev.154 (2022) 111733.
[18]C.Hecht,J.Figgener,D.U.Sauer,Analysis of electric vehicle charging station usage and profitability in Germany based on empirical data.arXiv [eess.SY],2022.
[19]M.H.Kermia,J.Boche,D.Abbes,Predictive energy management in an electric vehicle charging station,in:CIRED Porto Workshop 2022: e-mobility and power distribution systems,2022,pp.935–939.
[20]B.Paneru et al.,Advancing sustainable mobility: dynamic predictive modeling of charging cycles in electric vehicles using machine learning techniques and predictive application development,Syst.Soft Comput.6 (2024) 200157.
[21]C.Ziras et al.,An empirical analysis of electric vehicle charging behavior based on real Danish residential charging data,Electr.Pow.Syst.Res.234 (2024) 110556.
[22]A.Bornioli et al.,Can app notifications reduce charging hogging?An experiment with electric vehicle drivers,Case Stud.Transp.Policy 15 (2024) 101143.
[23]S.Hussain et al.,Enhancing electric vehicle charging efficiency at the aggregator level: a deep-weighted ensemble model for wholesale electricity price forecasting,Energy (Oxford) 308 (2024) 132823.
[24]S.K.Jauhar et al.,Artificial intelligence and machine learningbased decision support system for forecasting electric vehicles’power requirement,Technol.Forecast Soc.Change 204 (2024)123396.
[25]B.Borlaug et al.,Public electric vehicle charging station utilization in the United States,Transp.Res.D Transp.Environ.114 (2023)103564.
[26]P.P.Moletsane et al.,Linear regression analysis of energy consumption data for smart homes,in: 41st International Convention on ICT,Electronics and Microelectronics (MIPRO),2018,pp.395–399.
[27]N.Fescioglu-Unver,M.Yıldız Aktas¸,Electric vehicle charging service operations: a review of machine learning applications,Renew.Sustain.Energy Rev.188 (2023) 113873.
[28]F.Nahrstedt et al.,An empirical study on the energy usage and performance of pandas and polars data analysis python libraries,in: Proceedings of the 28th International Conference on Evaluation and Assessment in Software Engineering,2024,pp.58–68.
[29]I.Mahmud et al.,Global challenges of electric vehicle charging systems and its future prospects: a review,Res.Transp.Bus.Manag.49 (2023) 101011.
[30]M.Li et al.,Toward efficient smart management: a review of modeling and optimization approaches in electric vehicletransportation network-grid integration,Green Energy Intell Transp.3 (6) (2024) 100181.
[31]S.Konkimalla,AI-based predictive maintenance for electric vehicles: enhancing reliability and performa nce,Int.J.Eng.Comput.Sci.11 (12) (2024) 25647–25661.
[32]P.Gupta et al.,A review on machine learning enhanced predictive maintenance for electric vehicle power electronics,E3S Web Conf.505 (2024) 03017.
[33]M.Straka,L.Buzna,Preprocessing of GIS data for electric vehicle charging stations analysis,Transp.Res.Procedia 40 (2019) 1583–1590.
[34]S.Moritz,T.Bartz-Beielstein,ImputeTS: time series missing value imputation in R,R J 9 (2017) 207.
[35]A.A.R.Khattab et al.,GMA: Gap Imputing Algorithm for time series missing values,J.Electr.Syst.Inf.Technol.10 (1) (2023).
[36]M.Kazijevs,M.D.Samad,Deep imputation of missing values in time series health data:a review with benchmarking.arXiv[cs.LG],2023.
[37]J.Sarda et al.,A review of the electric vehicle charging technology,impact on grid integration,policy consequences,challenges and future trends,Energy Rep.12 (2024) 5671–5692.
[38]Z.Yi et al.,Electric vehicle charging demand forecasting using deep learning model,J.Intell.Transp.Syst.26 (6) (2022) 690–703.
[39]A.Ermagun,J.Tian,Charging into inequality: a national study of social,economic,and environment correlates of electric vehicle charging stations,Energy Res.Soc.Sci.115(2024) 103622.
[40]S.Bae,B.Kulcsár,S.Gros,Personalized dynamic pricing policy for electric vehicles: reinforcement learning approach,Transp.Res.Part C Emerg.Technol.161 (2024) 104540.
[41]X.Yang et al.,Seasonal variance in electric vehicle charging demand and its impacts on infrastruc ture deployment,Energy(Oxford) 280 (2023) 128230.
[42]M.Maaouane et al.,Modelling industry energy demand using multiple linear regression analysis,Energy (Oxford) 225 (2021)120270.
[43]X.Li et al.,Linkage between passenger demand and surrounding land-use patterns at urban rail transit stations,Int.J.Transp.Sci.Technol.5 (1) (2016) 10–16.
[44]J.R.Helmus et al.,A data driven typology of electric vehicle user types and charging sessions,Transp.Res.Part C Emerg.Technol.115 (2020) 102637.
[45]A.K.Giri,M.Singh (Eds.),Electric Vehicle Charging Infrastructures and its Challenges,Springer Nature,Cham,2025.
[46]P.Barman et al.,Renewable energy integration with electric vehicle technology: a review of smart charging approaches,Renew.Sustain.Energy Rev.183 (2023) 113518.
[47]D.Gogoi et al.,Implementation of battery storage system in a solar PV-based EV charging station,Electr.Pow.Syst.Res.229 (2024)110113.
[48]Y.Zheng et al.,Effects of electric vehicle charging stations on the economic vitality of local businesses,Nat.Commun.15 (1) (2024)7437.
[49]C.Hecht et al.,Analysis of electric vehicle charging station usage and profitability in Germany based on empirical data,iScience 25(12) (2022) 105634.
[50]F.Farhadi et al., name="ref51" style="font-size: 1em; text-align: justify; text-indent: 2em; line-height: 1.8em; margin: 0.5em 0em;">[51]Z.Li et al.,Synthesis of electric vehicle charging data:a real-world name="ref52" style="font-size: 1em; text-align: justify; text-indent: 2em; line-height: 1.8em; margin: 0.5em 0em;">[52]J.Á lvarez Cid-Fuentes et al.,Efficient development of high performance data analytics in Python,Future Gener Comput Syst 111 (2020) 570–581.
[53]Cost and Usage Trends for Electric Vehicle Chargers: Evidence from NYSERDA-Funded Level 2 Charging Stations in New York State,Available online: https://www.nyserda.ny.gov/-/media/Project/Nyserda/Files/Publications/Research/Transportation/22-03-Cost-and-Usage-Trends-for-Electric-Vehicle-Chargers.pdf.(Accessed 01 February 2025).
Received 19 December 2024;revised 23 March 2025;accepted 11 May 2025
Peer review under the responsibility of Global Energy Interconnection Group Co.Ltd.
* Corresponding author at: Institute of Sustainable Energy,University Tenaga National (UNITEN),Jalan IKRAM-UNITEN,43000 Kajang,Selangor,Malaysia.
** Corresponding author at: Department of Electrical Engineering,Faculty of Engineerin g,Universiti Malaya,Kuala Lumpur,Malaysia.
*** Corresponding author at: Department of Electrical Engineering,Faculty of Engineering,Universiti Malaya,Kuala Lumpur,Malaysia.
E-mail addresses: mostofa.zehad@gmail.com (K.Z.Mostofa),aminul.islam@um.edu.my (M.A.Islam),khairulcu@baec.gov.bd (M.K.Basher),tarek_info99@yahoo.com (T.Abedin),kpyap@uniten.edu.my (B.K.Yap),m.nur-e-alam@ecu.edu.au,nure.alam@uniten.edu.my (M.Nur-E-Alam).
https://doi.org/10.1016/j.gloei.2025.05.005
2096-5117/© 2025 Global Energy Interconnection Group Co.Ltd.Publishing services by Elsevier B.V.on behalf of KeAi Communications Co.Ltd.This is an open access article under the CC BY-NC-ND license(http://creativecommons.org/licenses/by-nc-nd/4.0/).

Mr. Kazi Zehad Mostofa is a graduate student specializing in Electrical and Computer Engineering at Clarkson University,Potsdam,NY,with a focus on Power and Renewable Energy Engineering.He earned his bachelor’s degree in electrical engineering from Universiti Malaya,Malaysia in 2022,where he conducted innovative research in renewable energy,supported by the Universiti Malaya Undergraduate Research Fellowship Grant for his final year project on sustainable energy systems.Before pursuing his master’s,Mr.Mostofa served as a Research Assistant at the Next Generation Energy Lab,University of Malaya,where he designed hybrid PV systems for school buildings achieving up to 78% energy self-sufficiency and significant carbon emission reductions.He also developed energy optimization models using HOMER Pro,Python,MATLAB and contributed to actionable insights for regulatory compliance and sustainability initiatives.Additionally,as a Product Research and Development Engineer at Penco Electronics,he implemented IoT-based real-time energy monitoring systems with 92%efficiency and improved product reliability through hardware and software troubleshooting.
His teaching and research expertise includes topics such as renewable energy systems,microgrid design,energy management,and IoT applications in energy monitoring.His projects range from EV charging station performanceoptimization to microgrid economic dispatch modeling.His publications include works on all-PV blended system design,net-zero building energy design,self-sustainable cold storage design,and microgrid optimization.He has presented his research findings at several prestigious international conferences and symposiums.