
0 Introduction
The optimal power flow (OPF) method is a valuable tool for optimizing the design and operation of electric power systems.Since its introduction,OPF has beco mea promising research topic in power network optimization[1–4],with a substantial body of literature spanning several decades.This interest stems from the complexity of OPF,which involves solving large-scale optimization problems characterized by nonconvexity and nonlinearity.OPFis typically formulated as a minimization problem,in which decision variables––mainly generator outputs,bus voltages,and transformer tap settings––are optimized.Moreover,OPF can be formulated as either single-ob jective or multi-objective,optimization problem,with objectives such as minimizing fuel-based generation costs,transmission losses,and pollutant emissions [5–9].Traditionally,OPF focused on power plants fueled by fossil resources.Over the past two decades,growing energy demand,the need to reduce emissions of greenhouse gases,the restructuring of electricity markets,and the decreasing costs of renewable power generation have collectiv ely contributed tothe significant penetration of RESs [10–13].Among these,solar and wind energy sources are considered the most promising alternatives to conventional fuels in the generation sector.The rapidly increasing deployment of RESs has been facilitated by the utilization of improved WT and PV systems,leading to a decline in system installation costs [14–16].For instance,Salkuti [17]applied the Glowworm Swarm Optimization (GSO) algorithm to solve the OPF problem incorporating wind power generation,using a multi-objective framework aimed at minimizing fuel cost,transmission losses,and simulation time.The approach was tested on IEEE 30-bus and IEEE 300-bus systems under various operational scenarios.
Elattar et al.[18]focused on the mathematical modeling of the OPF problem in a combined heat and power system incorporating intermittent wind power generation.In this context,a modified Mo th Swarm Algorithm (MSA) was employed,demonstrating superior performance compared toexisting approaches.Similarly,Biswas et al.[19]applied various multi-objective evolutionary algorithm (MOEA)variants to solve the OPF problem involving both conventional and RES-based units.A new Adaptive Gaussian Teaching–Learning-Based Optimization (AGTLBO)method was utilized in [20],and the results confirmed its superiority.Kathiravan et al.[21]employed the Flower Pollination Algorithm (FPA) to solve the OPF problem insystems containing both conventional and RES-based generating units.A hybrid metaheuristic algorithm called the Cross Entropy–Cuckoo Search Algorithm (CE-CSA)was introduced in [22],while [23]proposed a Differential Evolution–Particle Swarm Optimization hybrid (DEPSO)toaddress OPF with RES integration.In [24],a hybrid PSO–GWO (Grey Wolf Optimizer) was adopted and benchmarked against other metaheuristic methods,showing competitive performance.The Turbulent Flow Water-Based Optimizer (TFWO) was proposed in [25]to minimize the operating cost of OPF,for errors in forecasting RES outputs.Reference[26]applied a parallel Genetic Algorithm termed EPGA for combined economic and environmental dispatch.To address GWO’s potential to get trapped in local optima due to limited diversity,a Developed Grey Wolf Optimizer(DGWO)was introduced in[27],which demonstrated improved search capabilities and better overall performance.Other algorithms include the Chaotic Invasive Weed Optimization (CIWO) [28],the Slime Mold Algorithm (SMA) [29],a Modified Bacterial Foraging Algorithm(MBFA)[30],and a hybrid ICA–TLBO (Imperialist Competitive Algorit hm–Teaching–Lea rning-Based Optimization) [31].Several other effective algorithms have also been proposed for OPF optimization,such as the Depth Information–Enhanced Differential Evolution Algorithm [32],a hybrid of Mutational Northern Goshawk Optimizer and Elite Oppo sition-Based Artificial Rabbit Optimizer[33],the Lévy Chaotic Horizontal–Vertical Crossover-Based Artifici al Hummingbird Algorithm [34],the Cooperative Strategy-Based Differential Evolution Algorithm [35],and the Quick Crisscross Sine Cosine Algorithm (QCSCA) [36].Related research on OPF algorithms is also presented in [37–39].
Extensive literature clearly demonstrates that the integration of metaheuristic methods into OPF solutions has garnered significant research interest.In this context,an enhanced Coulomb’s and Franklin’s laws physicsinspired algorithm (ECFA),based on the original CFA introduced by Ghasemi et al.[40,41],is presented in this paper to address the RES-based OPF.Although the CFA is capable of fast convergence,it is prone to getting trapped in local minima.The proposed framework was evaluated using a modified version of the IEEE 30-bus system.Furthermore,a comparative analysis was conducted tovalidate the superior performance of ECFA over several well-known optimization algorithms,including SSA,BA,SCA,ABC,and CFA.
The key contributions of this paper are summarized as follows:
-Application of the developed ECFA to the OPF problem incorporating solar power generation.
-Comprehensive statistical and performance compariso ns with well-established optimization algorithms to validate the proposed approach.
-Consideration of four common objectives in the OPF problem,including the minimization of generation cost,power losses,VD,and emissions.
The remainder of this pa per is organized as follows:Section 1 provides an introduction to the OPF problem.Section 2 presents a detailed description of the ECFA.Section 3 discusses the application of ECFA to the OPF problem.Section 4 presents the simulation results and performance analysis.Finally,Section 5 provides the concluding remarks.
1 Mathematical modeling of OPF
The OPF problem determines the optimal values of decision variables to optimize a specified objective function,subject to a set of system constraints.In this study,five objective functions are selected to address the OPF problem in a system comprising thermal units,small hydropower generation units,and intermittent RESbased units.A typical optimization problem is formulated as follows [42]:
It is worth noting that ![]() defines the objecti ve functions,where χ and φ repres ent the dependent and independent variables,respectively.As shown in Eq.(2),several equality constraints
defines the objecti ve functions,where χ and φ repres ent the dependent and independent variables,respectively.As shown in Eq.(2),several equality constraints ![]() must be satisfie d.Additionally,a set of inequality constraints
must be satisfie d.Additionally,a set of inequality constraints ![]() must also be fulfilled.
must also be fulfilled.
1.1 Dependent variables
The dependent variables related to the OPF problem can be represented as follows:
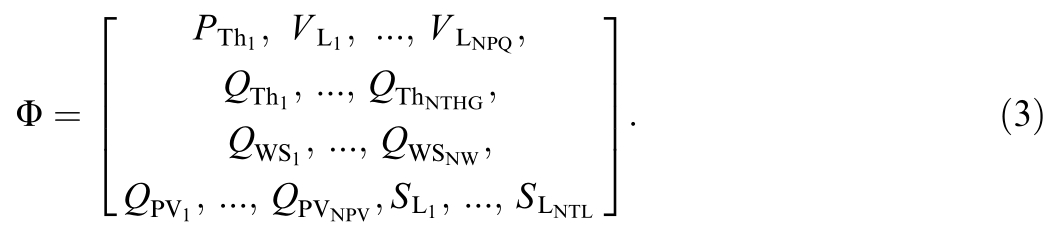
The variables PTh1,Q..,P..,and SL..,represent the acti ve power of the slack generator,reactive power,voltage of PQ buses,and apparent power flowing through transmission lines,respectively.The subscripts Th,WS,and PV denote therm al,wind,and solar PV systems,respectively.Furthermore,NPQ,NTHG,NW,NPV,and NTL refer to the sets of PQ nodes,thermal units,wind sites,solar sites,and transmission lines.
1.2 Independent variables
The independent variables of the OPF problem are expressed as follows:
that the terms![]() represent the real power generation of all thermal units except the slack unit.NG denotes the set of generation nodes encompassing all technologies.
represent the real power generation of all thermal units except the slack unit.NG denotes the set of generation nodes encompassing all technologies.
1.3 Mathematical modeling of the system
The data for the IEEE 30-bus system with integrated RESs are descri bed as follows: the system comprises 30 buses and 41 transmission lines [43].Three thermal generation units are installed at buses 1,2,and 8,with the swing generator located at bus 1.Two wind farms are locatedat buses 5 and 11,while a solar farm is connected at bus 13.Transformers are installed at buses 11,12,15,and 36,and shunt capacitors are placed at buses 10 and 24.The total active and reactive load demands are 283.4 MW and 126.2 MVAr,respectively.The minimum and maximum voltage limits of the PQ bus are 0.95 p.u.and 1.05 p.u.
1.3.1 Cost function of thermal units
The fuel cost of thermal units,as a function of their power generation,is represented by a quadratic polynomial function,as shown in Eq.(5).Eq.(6) models the fuel cost for thermal generators with valve-point effects(VPEs).Here,mi,ni,and oi denote the fuel cost co efficients of unit i.
1.3.2 Emission modeling
The emission function for thermal units responsible for greenhouse gas emissions such as SOx,NO x,and CO2.The minimization of emissions is represented by Eq.(8).Notably,σi,βi,τi,ωi,and μi represent the emission coefficients of thermal unit i.Additionally,FE denotes the total emissions,CE represents the emission cost,and Ctax refers to the emission tax [41,44].
1.3.3 Prohibited operating zones
The operation of the thermal units involves significant challenges,as it is not feasible to operate them at just any point within the interval bounded by their minimum and maximum limits.In this context,certain restricted operating regions,known as prohibited operating zones(POZs),are identified and characterized as follows:
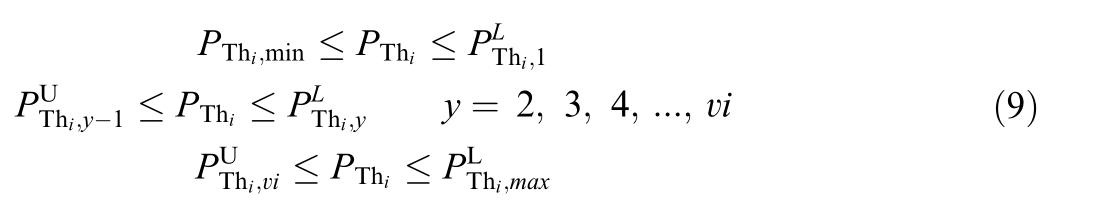
Notably,vi denotes the set of POZs,and y represents the POZs index.Furthermore,![]() indicate the lower and upper bounds of POZy-1,respectively,for thermal unit i.The fuel cost curves incorpora ting the VPE and POZs are illustrated in Fig.1(a) and Fig.1(b),respectively.
indicate the lower and upper bounds of POZy-1,respectively,for thermal unit i.The fuel cost curves incorpora ting the VPE and POZs are illustrated in Fig.1(a) and Fig.1(b),respectively.

Fig.1.Typical fuel cost curves of thermal units.
1.3.4 Direct cost models of RESs
By utilizing the direct cost model,a linear cost function can be employ ed to model the cost of power generation using WTs [44,45].
Notably,DCWPi denotes the direct cost function associat ed with wind power generation,wsh irepresents the direct cost coefficient,and PWSiindicates the dispatched wind po wer generation for wind unit i.
The same methodology can be applied to the cost function of the solar system.Equation (11) can be used as the di rect cost function,where DCPVi represents the direct cost function,pvshi is the direct cost coefficient,and PPVS i de notes the dispatched solar power [46,47].
1.3.5 Uncertainty cost models of RESs
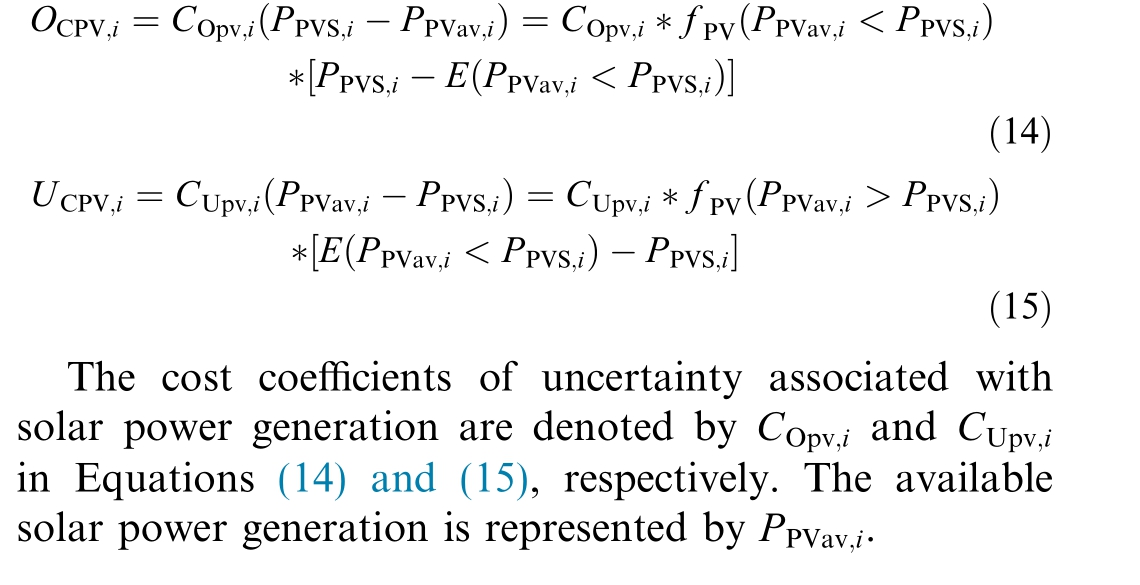
Several cost terms are included in the objective function toaccount for uncertainty,specifically the costs associated with overestimation and underestimating renewable power generation.Here,the uncertainty cost functions for wind power generation are presented in Eqs.(12) and (13)[45,48].
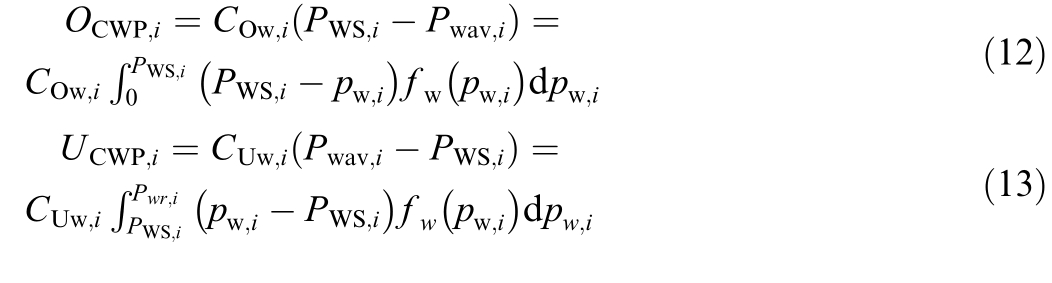
Notably,the overestimation cost of wind power generation is denoted by OCWP i with the coefficient COw i,and the underestimation cost is denoted by UCWP iwith the coefficient CUw i.The rated value of wind power and the amount of power available from such units are represented by Pwr i and PWS i,respectively.
A similar methodology is used in this paper to model the uncertainty cost of solar power generation.In this case,the overestimation cost associated with solar power generation is represented by OCPV i,and the underestimation cost is indicated by UCPV i.
1.4 Objective functions
1.4.1 Cost function with VPE
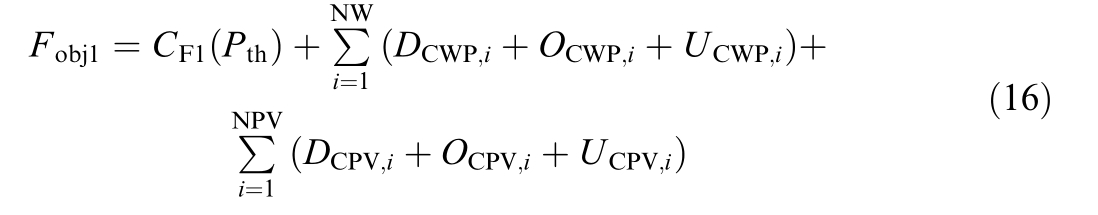
Equation (16) represents the total cost,including the VPE cost of thermal units and the costs associated with renew able power generation.
1.4.2 Total cost model incorporating tax and emission
The emission cost function is represented in Eq.(17).
1.4.3 Cost function with POZs
The commonly used cost function that accounts for the POZs of thermal units can be mathematical ly represented byEq.(18):
1.4.4 Real power losses
The real power losses in the transmission lines can be calculated using Eq.(19),which is intended to be minimiz ed.
The conductance of the transmission line connecting node i to node j is represented by ![]() while the corr esponding bus voltage angle difference is denoted by δij.
while the corr esponding bus voltage angle difference is denoted by δij.
1.4.5 VD minimization
The other objective function considered is the minimization of the VD at each node of the system,as defined in Eq.(20).
1.5 Constraints
1.5.1 Equality constraints
The proposed optimization model for the OPF problem is subject to both equality and inequality constraints.The real power balance equ ation and the reactive power balance equation constitute the two equality constraints,as defined in Equations (21) and (22),respectivel y.
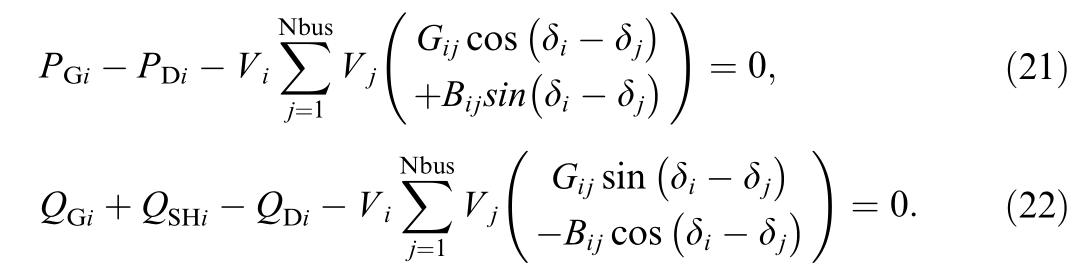
The total nodal active power generation is denoted by PGi,while the total active nodal load demand is denoted by PDi.Similarly,the total nodal real power generation is denoted by QGi,the reactive power nodal shunt element is denoted by QSHi,and the total nodal reactive load demand is denoted by QDi.The set of system nodesis denoted by Nbus.V represents the voltage,and Bij denotes the susceptance of the line between nodes i and j.
1.5.2 Inequality constraints
 Generating units’ constraints
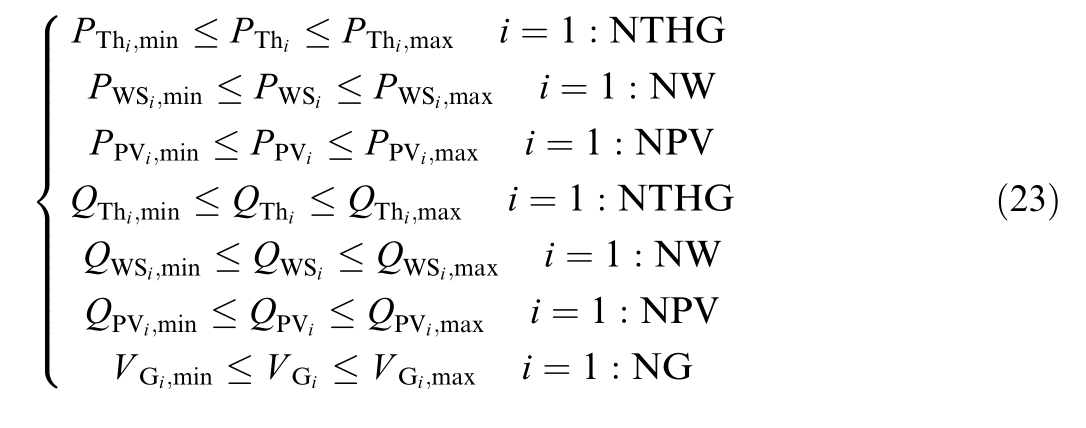
The operation of generating units considered in this study is constrained by the limit ations defined in Eq.(23).These constraints include the real power outputof thermal units,active power generation from wind and solar farms,reactive power generation from therm al units,wind farms,and solar farms,as well as the voltage magnitude of generating units.
 Security constraints
It is important to note that the voltage magnitude at PQ nodes is constrained by minimum and maximum voltage limits,denoted by ![]() respectively.Furthermore,the apparent power flow in the transmission lines is limited by the line capacity,
respectively.Furthermore,the apparent power flow in the transmission lines is limited by the line capacity,![]() .
.
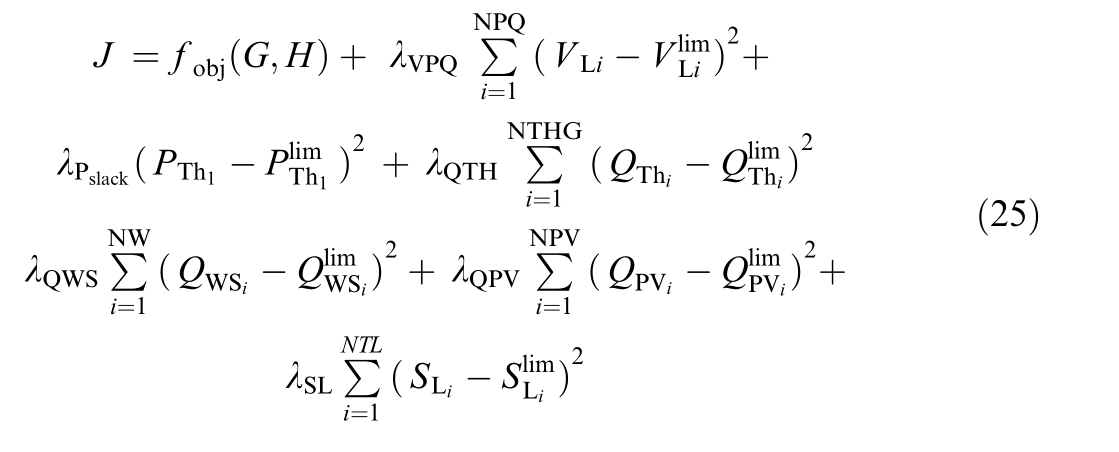
Equation (25) defines the fitness function used in the security-constrained OPF (SCOPF) problem.This function addresses all generation technologies within the systems.The associated penalty co efficients are denoted by λVPQ,λPslack,λQTH,λQWS,λQPV,and λSL.
2 Uncertainty characterization of RESs
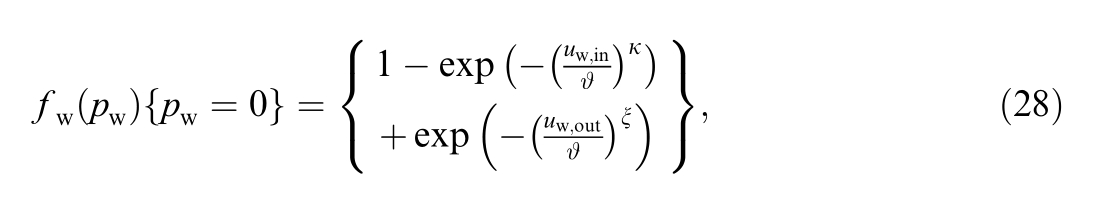
The uncertainty associated with intermittent wind power generation is modeled by first characterizing the probability distribution function (PDF) of wind speed employing the Weibull PDF as defined in Eq.(26).Wind speed is denoted by uw,while the shape and scale parameters are denoted by κ and ,respectively [45,48].
The results obtained by applying the Monte-Carlo simulation (MCS) and using the Weibull PDF of wind speed over 8000 iterations are illustrated in Fig.2 [45,48].Equation (27) characterizes the power curve of the WT:
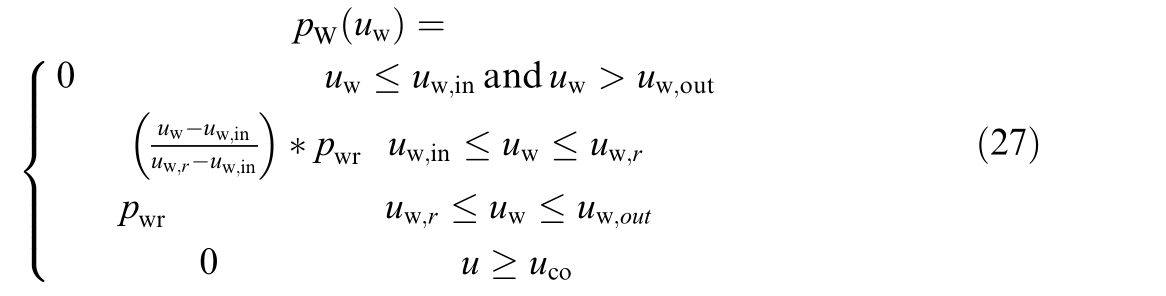
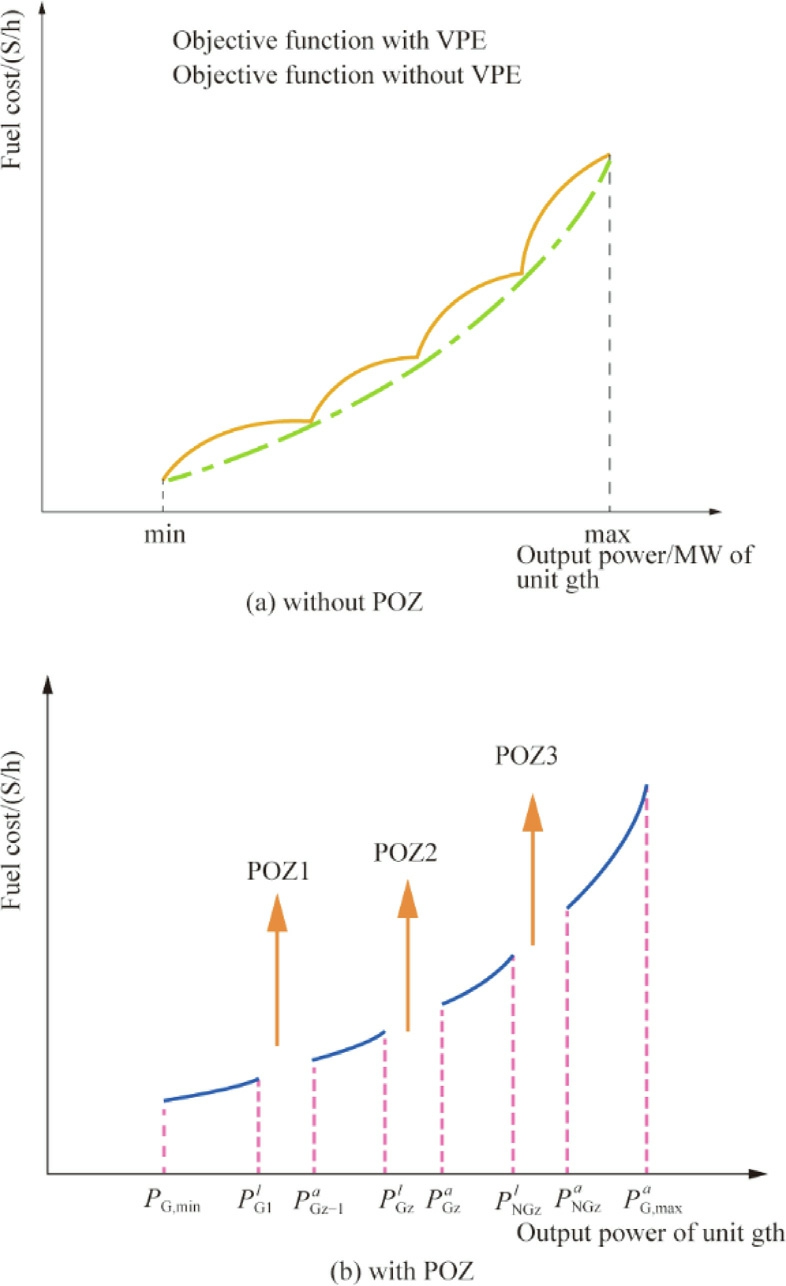
Fig.2.PDF of the wind speed at: (a) Node 5 and (b) Node 11.
where the rated power is denoted by pwr.The cut-in speed is denoted by uw,in,the cut-out speed by uw,out,and the rated wind speed by uw,r.Accordingly,the associated probabilities are calculated using Eqs.(28)–(30).
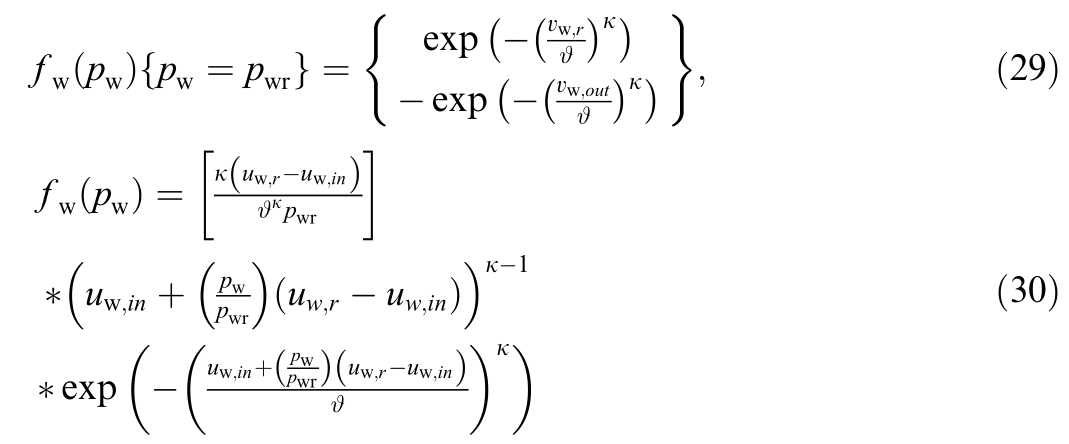
The values assigned to the model for uw,in,uw,r,uw,out,and pwr are 3 m/s,16 m/s,25 m/s,and 3 MW,respectively[45,48].
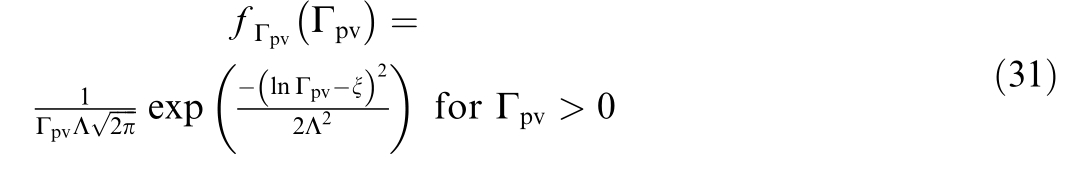
The power generation of solar PV systems is characterized using a lognormal PDF based on a function of solar irradiance.Equations (31) and (32) represent the probabilistic model and the output power of the solar system,respectively [45,48].
By applying the MCS with 8000 iterations,the resul ting PDF for solar irradiance is illustrated in Fig.3.
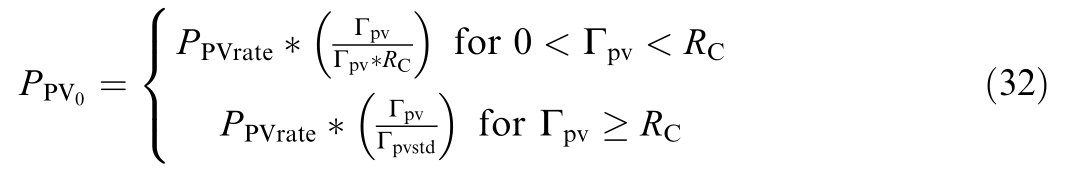
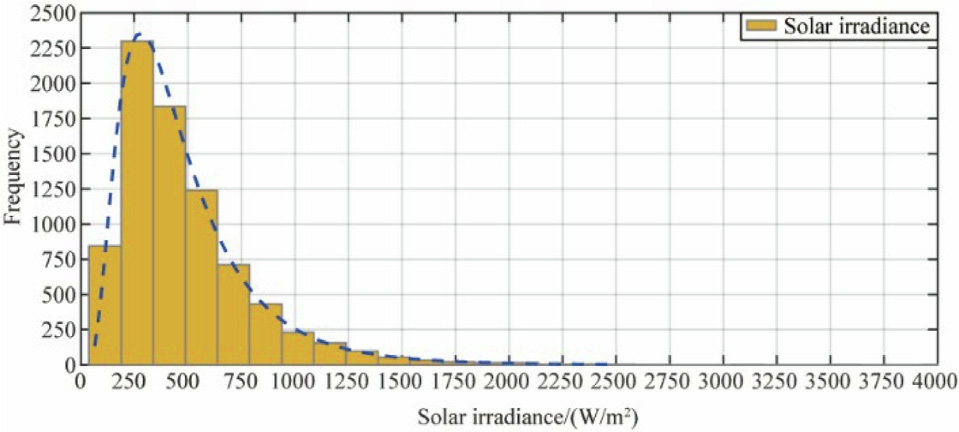
Fig.3.The lognormal PDF of the solar irradiance.
In Eq.(31),the mean and standard deviation are denoted by ξ and Λ,respectively.Equation (32) includes Γpv,which represents the solar irradiance;Γpvstd,the standard solar irradiance;and PPVrate,the rated power of the PVsystem.Fig.4 illustrates the volatile power generation from the solar PV system.The line represents the scheduled power that the system is expected deliver to the grid,al though actual output may vary.
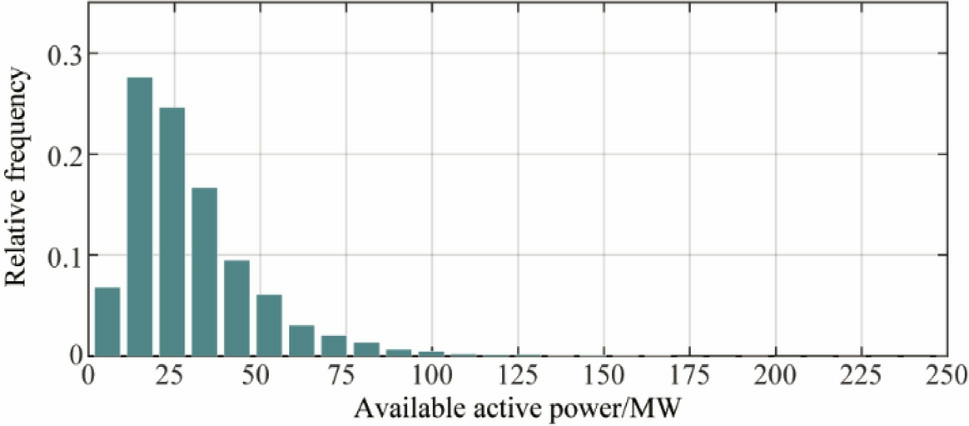
Fig.4.Available solar power generation_Node 13.
The wind farm located at node 5 has a capacity of 75MW,consisting of 25 WTs with κ=2 and φ=9.A second wind farm is located at node 11,with a capacity of 60MW including 20 WTs,also with κ=2 and φ=10.The solar farm is also located at node 13,with a capacity of 50 MW,where ξ=6,Λ=0.6,and RC=120 W/m2.The sta ndard solar irradiance is Γpvstd=800 W/m2.
3 The proposed optimization algorithm
3.1 Enhanced Coulomb’s and Franklin’s laws algorithm
This section presents an explanation of the CFA,and Fig.5 illustrates its corresponding flowchart [40,41].
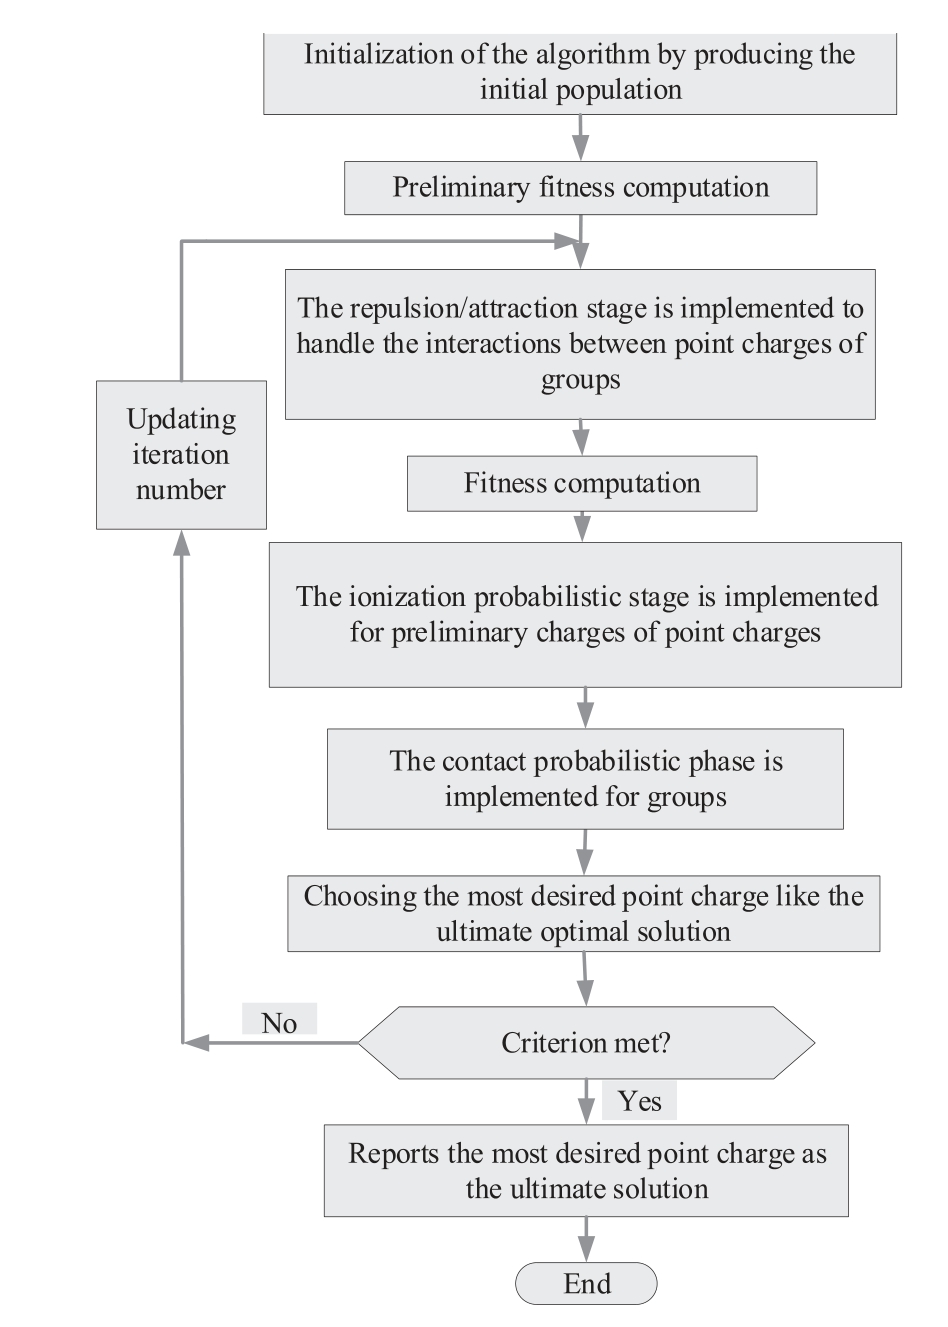
Fig.5.Detailed flowchart of CFA.
The main steps of the CFA are described as follo ws:
3.1.1 Initial population
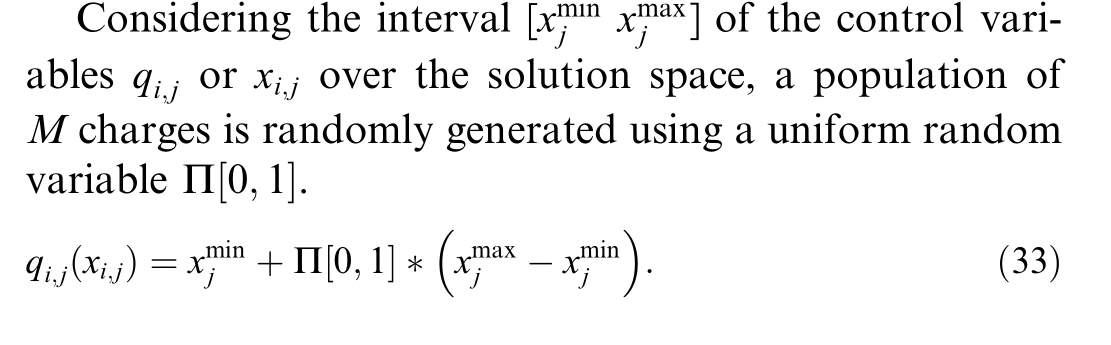
3.1.2 Object selection forMob 2
2
If Mob=1,all members are placed into a single group.For larger values Mob,i.e.,![]() the population members are first sorted in descending order based on the objective function value.These members (charges) are then distributed into Mob clusters,where each cluster represents anobject.The clustering process is carried out by sequentially assigning each sorted member to their respective group: the first member is assigned to the first group,the second to the next,and so on.Once all groups have received one member,the assignment continues cyclically from the first cluster again,ensuring that all membersof the population are evenly and sequentially placed into the clusters.
the population members are first sorted in descending order based on the objective function value.These members (charges) are then distributed into Mob clusters,where each cluster represents anobject.The clustering process is carried out by sequentially assigning each sorted member to their respective group: the first member is assigned to the first group,the second to the next,and so on.Once all groups have received one member,the assignment continues cyclically from the first cluster again,ensuring that all membersof the population are evenly and sequentially placed into the clusters.
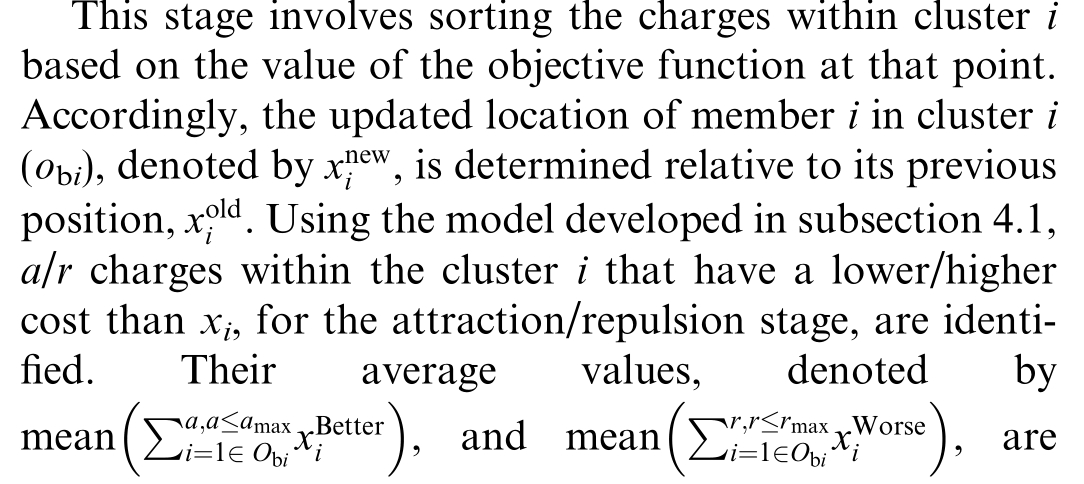
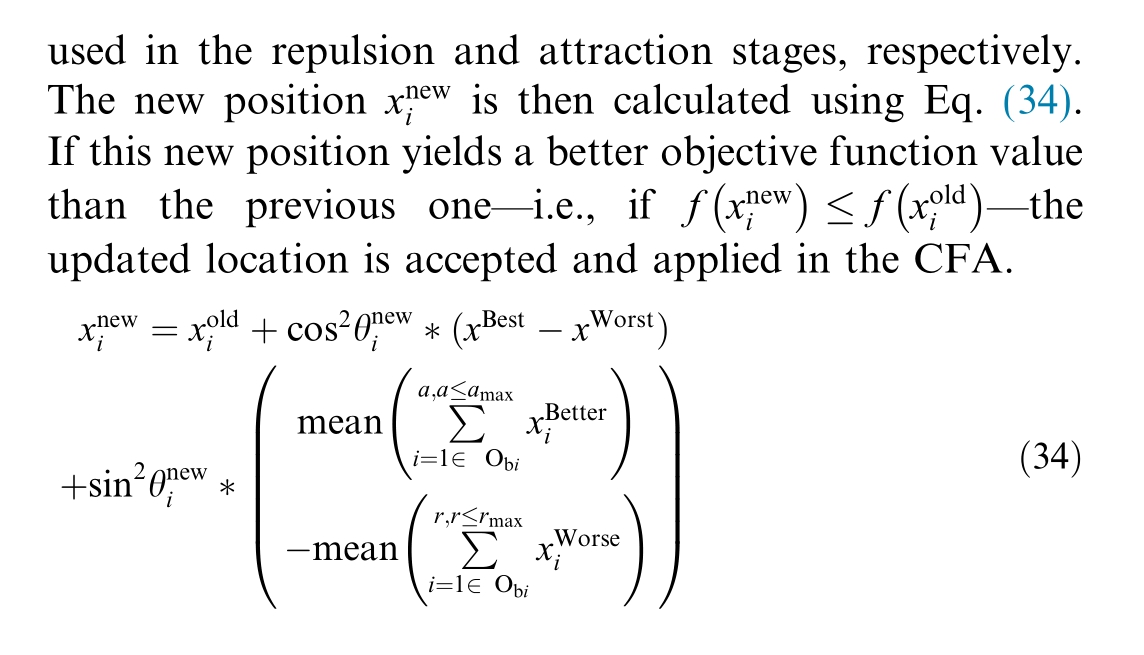
3.1.3 The attraction/repulsion stage
3.1.4 Ionization probabilistic phase
Each charge within the cluster can independently undergo this stage.The ionization process solely applies to xi,j of each point charge.If the normalized ionization energy of the point charge i,denoted as Ei,is greater than a randomly generated number rand,then xi,j is selected in randomly using the corresponding relation![]() Here,D represents the dimension of the optimization problem.The new contr ol variable,
Here,D represents the dimension of the optimization problem.The new contr ol variable,![]() is then determined by incorporating the control variable j of the best and worst point charges within the same cluster,denoted by xBest and xWorst,respectivel y,as depicted in relation (35).
is then determined by incorporating the control variable j of the best and worst point charges within the same cluster,denoted by xBest and xWorst,respectivel y,as depicted in relation (35).
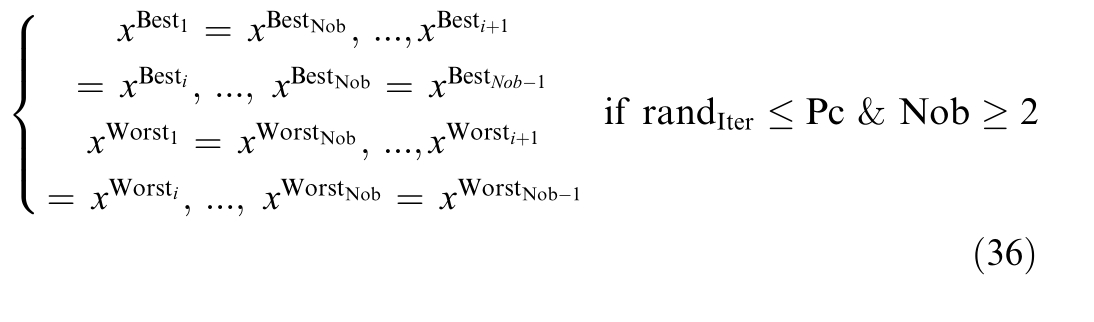
3.1.5 Contact probabilistic stage
Based on presumption 4,the point charges of each object behaves similar to particles in a gaseous state.One important consideration when employing multiple clustersMob 2,particularly in high-dimensional problems,is the implementation of the contact operation.This operation occurs during the iteration Iter of the algorithm,provided that the contact probability factor,denoted by Pc,exceeds rand.Through extensive simulations,the optimal value for Pc has been determined to be 0.5.The formulation of the probabilistic contact phase is provided in Eq.(36).
3.2 Enhanced Coulomb’s and Franklin’s laws physics-inspired algorithm
3.2.1 Bare-Bones PSO (BBPSO)
The PSO is a swarm intelligence-based approach inspired by the collective behavior observed in birds flocking and fish schooling[44].In this method,each particleis influenced by its own most desired position,denoted by Ybest,and the global most desired position,denoted by Obest,discovered by the entire swarm.The convergence ofeach particle has been theoretically analyzed,revealing that particles tend to move towards a weighted average ofObest and Ybest [45,48].
where w1 and w2 represent the learning factors of the method.Based on the convergence behavior of PSO,Reference [49]introduced an enhanced version of the algorithm known as BBPSO.In this modified approach,the velocity component is eliminated,and the positions are updated using the following method:
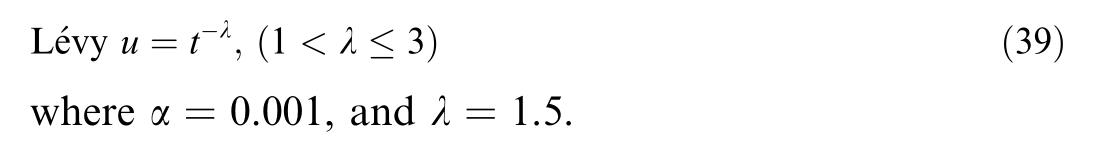
3.2.2 Lévy-flight
If the idealized rule,population flow in the pulmonary circulation strategy,and the characteristics of Lévy flights are integrated through an equation α sign![]() Lévy,a novel Lévy-flight-based CFA (LCFA) can be developed.This approach incorporates Lévy flights to introduce randomization,where “α” represen ts the randomization parameter.The operation denoted by
Lévy,a novel Lévy-flight-based CFA (LCFA) can be developed.This approach incorporates Lévy flights to introduce randomization,where “α” represen ts the randomization parameter.The operation denoted by ![]() signifies entrywise multiplications.Additionally,sign
signifies entrywise multiplications.Additionally,sign ![]() necessarily introduces randomness in sign or direction,while the step length follows a Lévy distribution [50]:
necessarily introduces randomness in sign or direction,while the step length follows a Lévy distribution [50]:
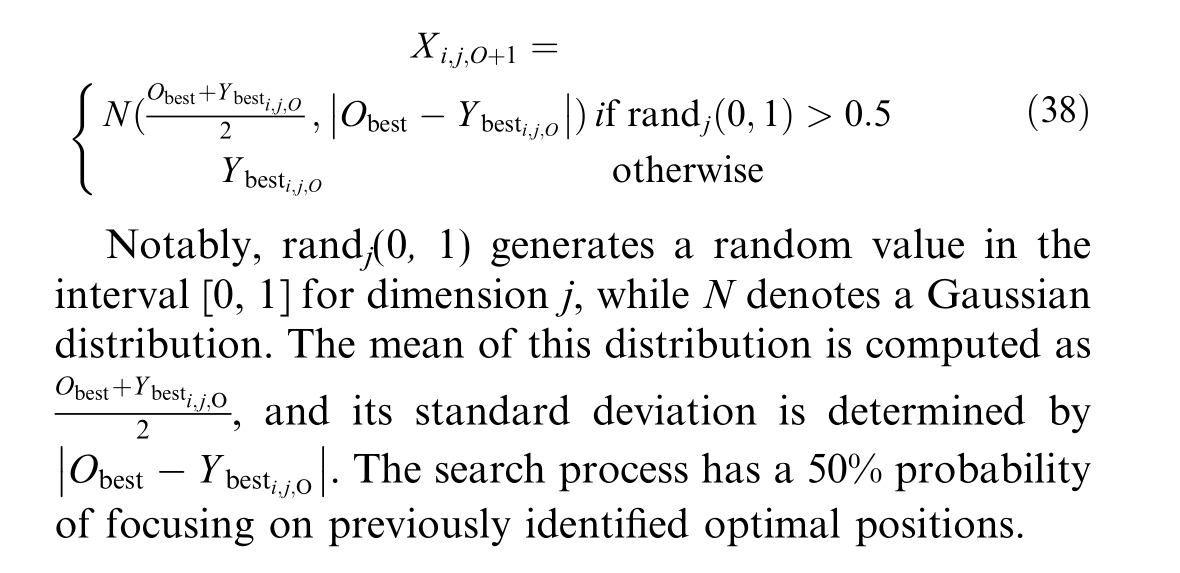
3.2.3 Mathematical model of ECFA
Regarding the exploration and exploitation phases in the search behavior of BBPSO,the use of Gaussian sampling functions as a refined adjustment mechanism begins during the exploration phase and continues throughout the exploitation phase.This approach significantly enhances the search capability of evolutionary optimization methods.Accordingly,this paper introduces a new and robust CFA algorithm,termed the Gaussian barebones LCFA (ECFA).The Gaussian mutation and Lévy-flight strategies used in ECFA are defined as follows:
The original CFA encounters two major limitations:slow convergence and susceptibility to local optima when address ing complex OPF problems.To address these issues,the mechanisms described in Eqs.(37) and (38)are incorporated.Simulation results demonstrate that ECFA out performs the original CFA.
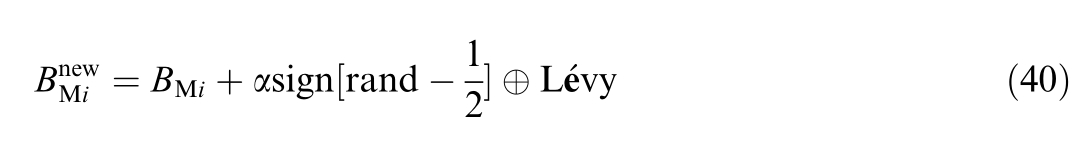
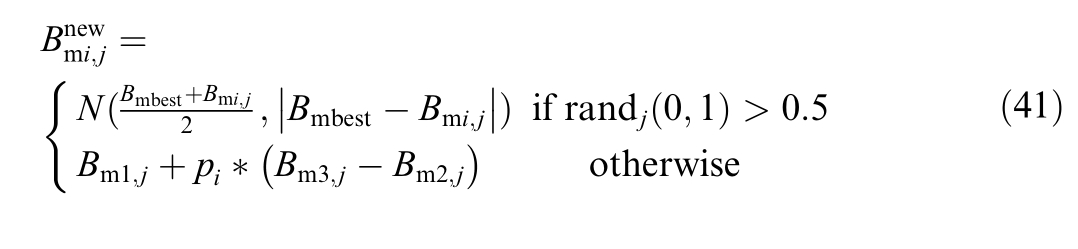
One of the main challenges faced with the original CFA algorithm,particularly when solving complex problems such as OPF,is its slow convergence and its tendency to get trapped in local optima.This paper presents an enhanced version of the CFA targeted to achieve better optimum solutions,avoid local minima,and accelerate convergence.The reinforcement techniques proposed to address these limitations are detailed in Eqs.(40) an d(41).Simulations and experimental results consistently demonstrate that the improved method outperforms the original CFA.A summary of the findings,presented inthe relevant section,confirms the effectiveness of the impr oved strategy.
The new boosting strategies in ECFA are definedas follows:
3.3 The presented Lévy population flow in pulmonary circulation technique
The proposed Gaussian bare-bones population flow technique based on systematic circulation is presented as follows:
4 ECFA for solving the OPF problems
The proposed framework is implemented in MATLAB and evaluated using the IEEE 30-bus test network,as illustrated in Fig.6.The standard SSA,BA,SCA,ABC,CFA,and ECFA algorithms are applied to address the OPF problem incorporating RESs.The co ntrol parameters for the optimization algorithms are adopted from previous studies and summarized in Table 1.Reference [7]provides the system data for the IEEE 30-bus network.Population size N refers to the total number of candidate solutions (agents)employed in each algorithm per iteration.In the CFA and ECFA algorithms,the group size denotes the number of individuals within each subgroup used for local interactions and enhancing the search process.
Table 1 Control parameters of the studied methods.
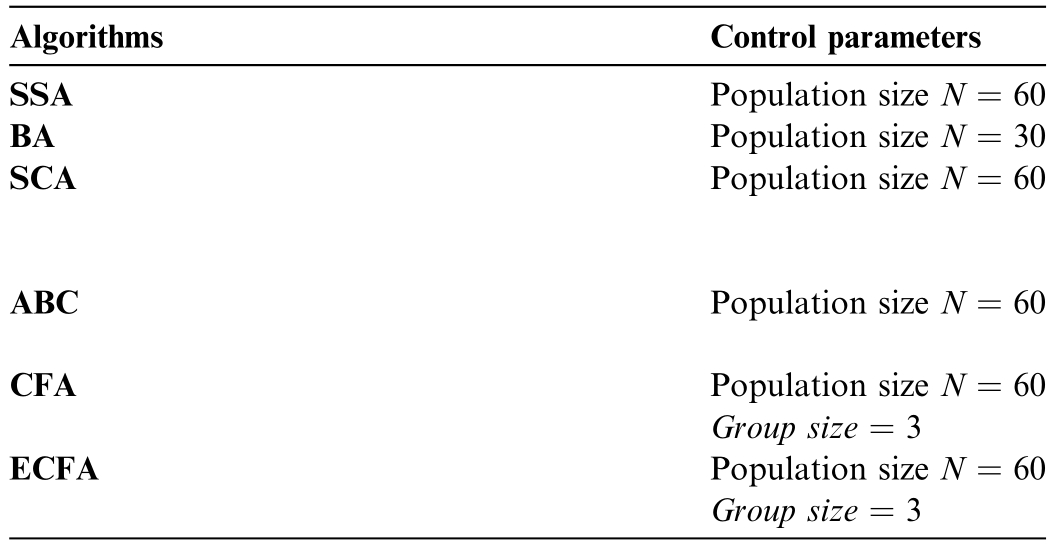
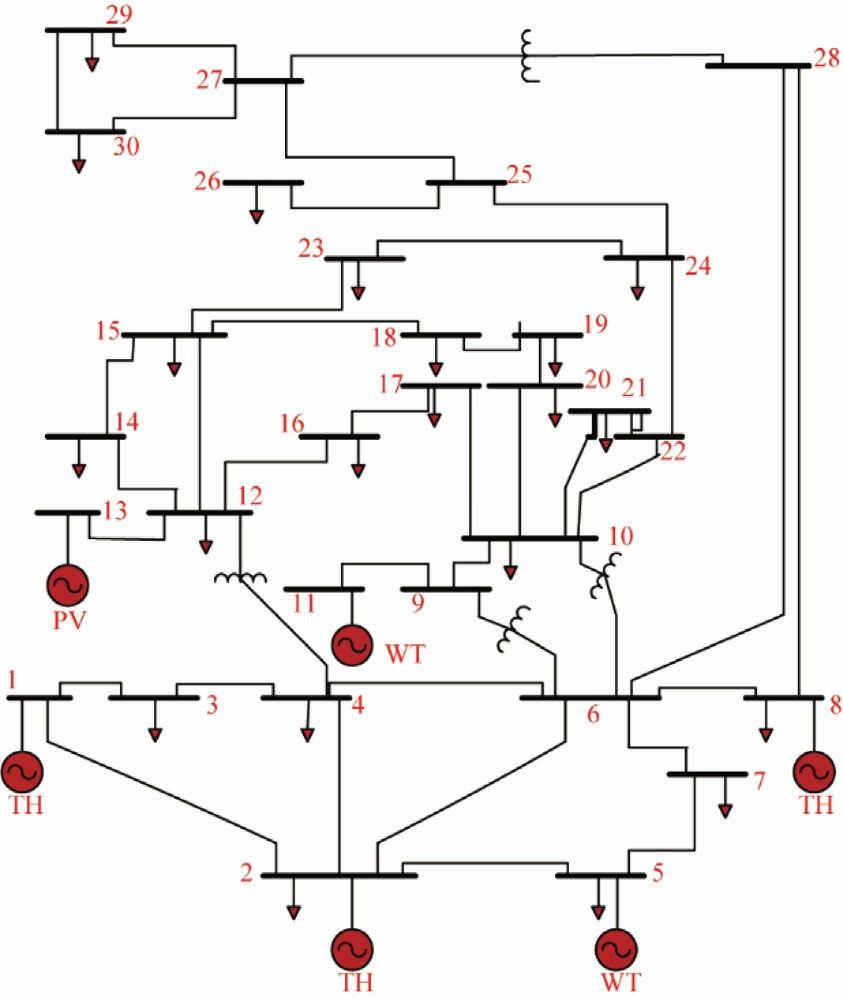
Fig.6.Simplified diagram portraying the IEEE 30-bus system.
Table 2 presents the economic data for RES-based units.MATPOWER [43,51]was used to perform the load flow calculations,which consider thermal,wind,and solar generating systems.To ensure evaluation,all algorithms were executed 30 times in each case study,enabling statistical analysis.The simulation studies were conducted for the following case studies:
Table 2 RESs-based units’ economic data.

4.1 Case 1: Total cost minimization with VPE and RESs
This case study focuses on minimizing generation costs while incorporating RES-based generating units,as outlined in Section 2.Table 3 presents the best (Min),the worst (Max),the average (Mean),and the standard deviation (Std.) of the statistical an alysis of the results,comparing the proposed ECFA with SSA,BA,SCA,ABC,and CFA algorithms.The table also includes the solution time and detailed performance metrics.As shown,for 30 simulation runs,ECFA outperforms all other algorithms across all statistical indicators,with results highlighted in bold.ECFA achieves the lowest generation cost at 781.8010$/h,while the highest cost,782.9650 $/h,is observed with SSA.The table reveals that both CFA and ECFA demonstrate robust performance;however,ECFA achieves superior accuracy.Furthermore,ECFA exhibits a smooth convergence trajectory and a rapid convergence rate toward the best solution as illustrated in Fig.7.
Table 3 Economic and statistical results obtained from the studied algorithms_ Case 1.
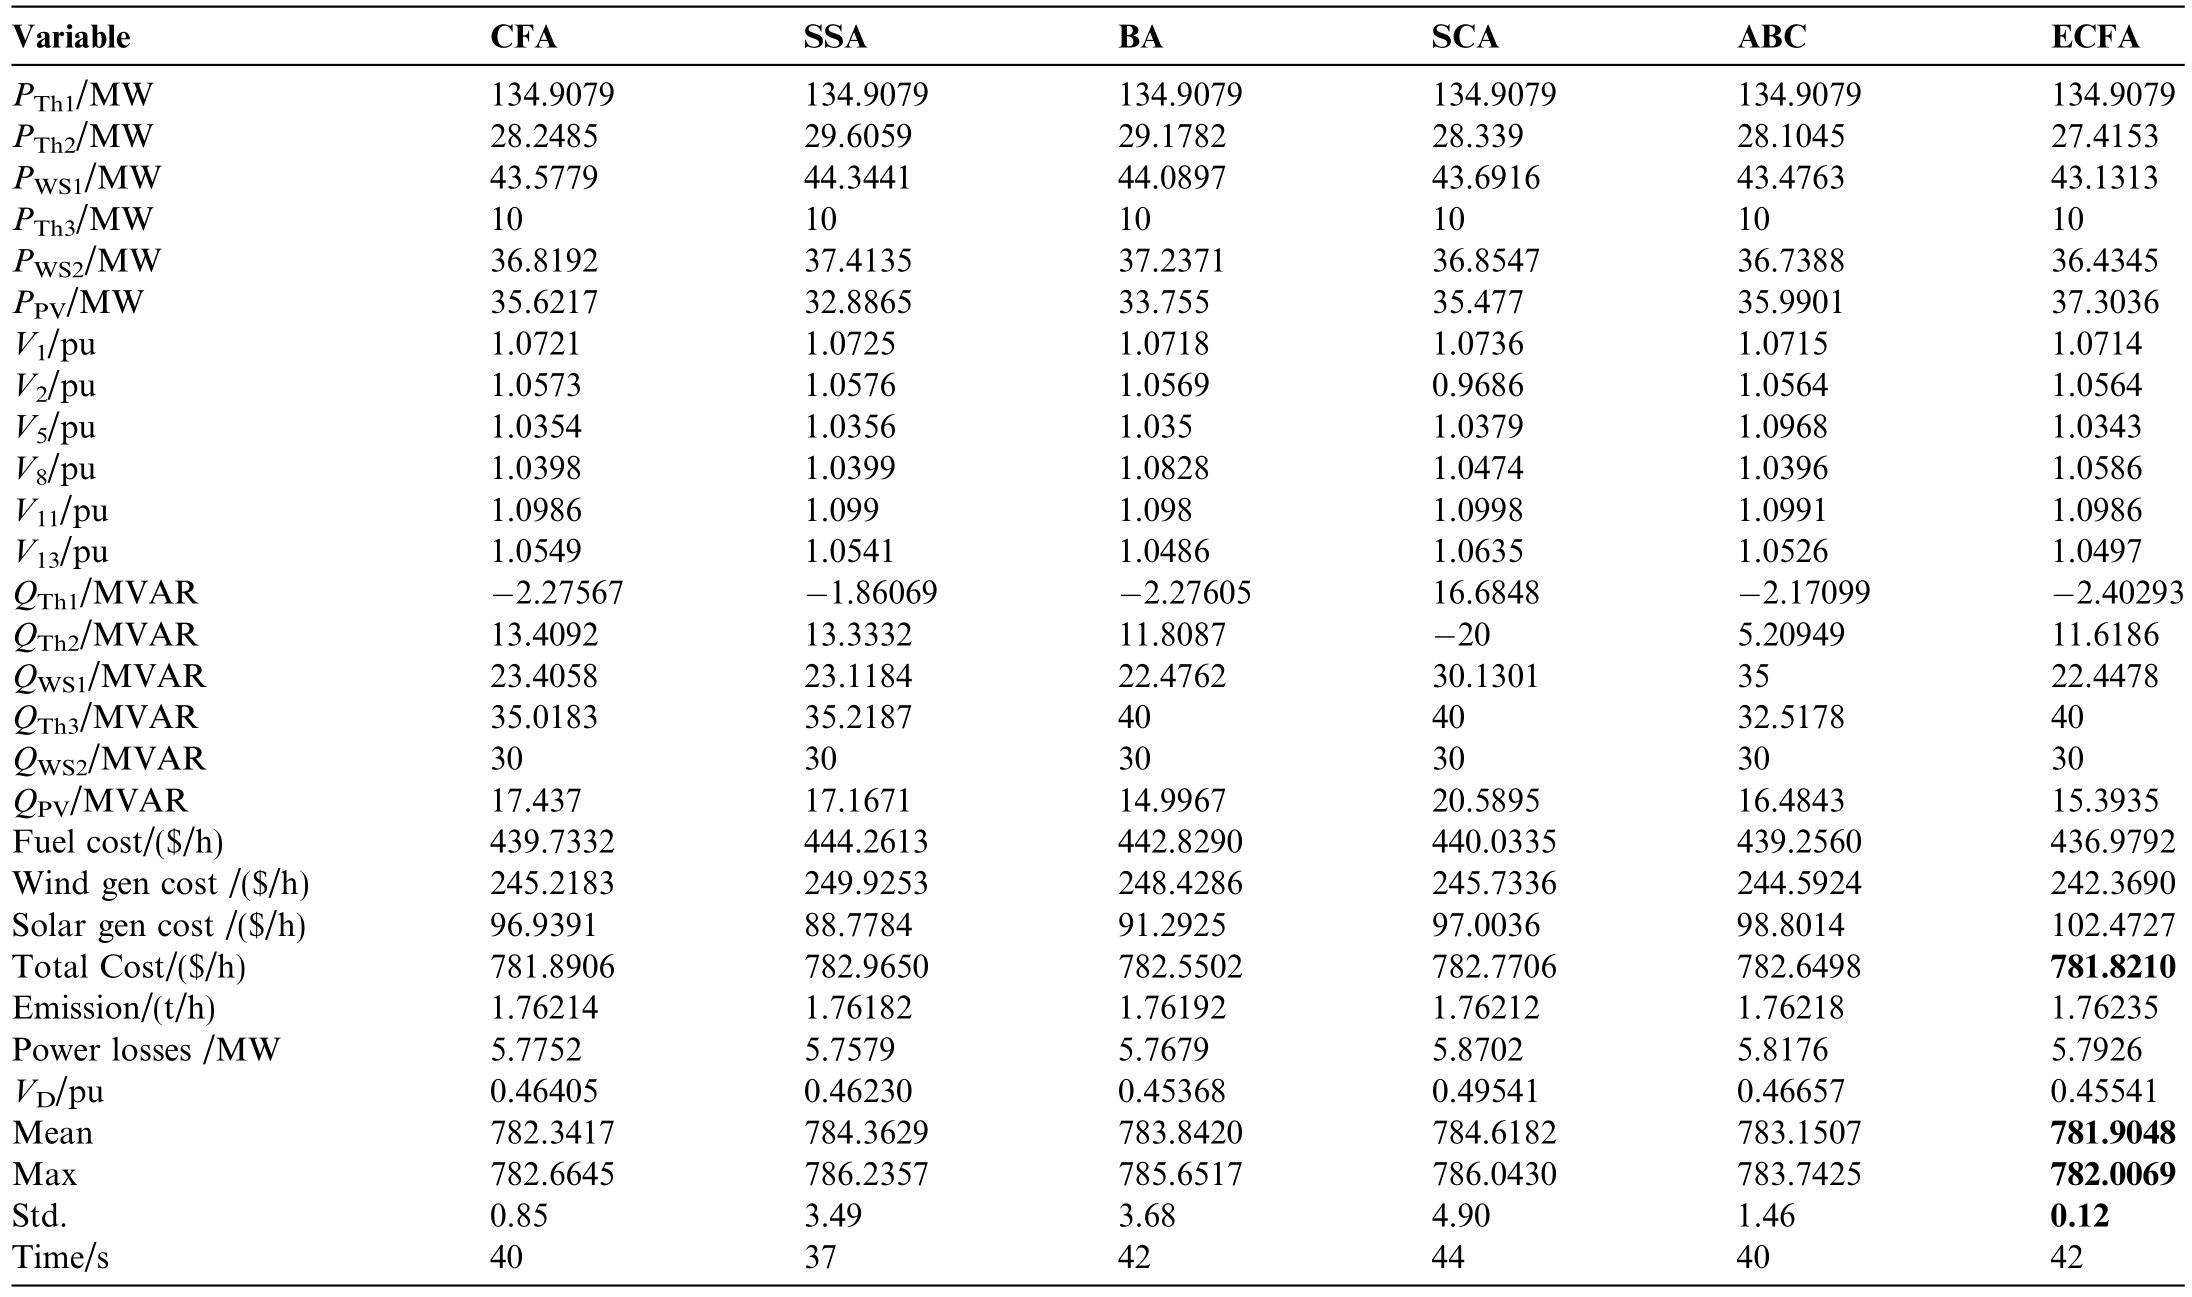
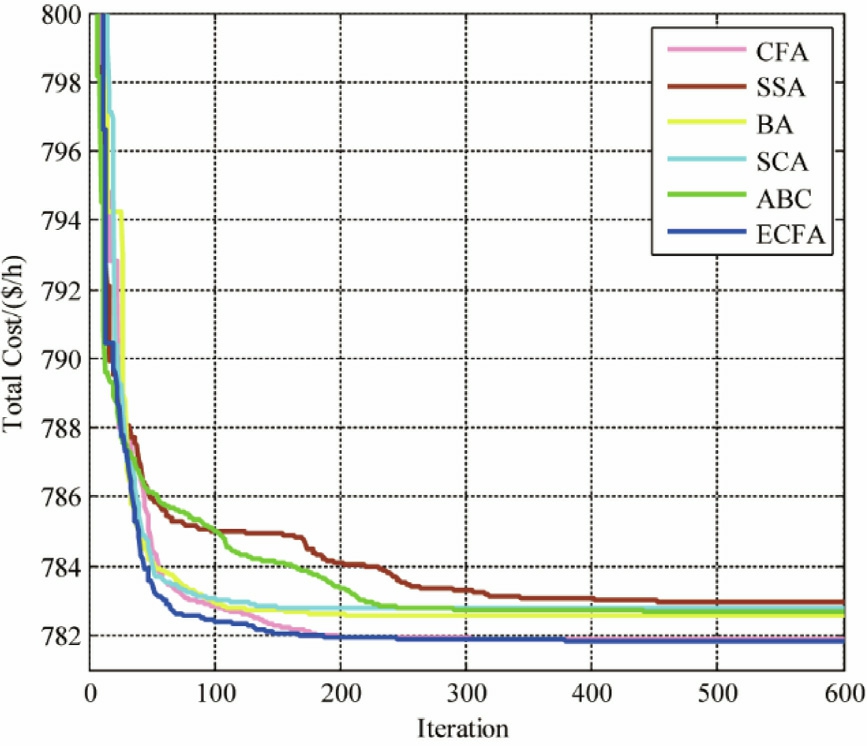
Fig.7.Convergence trajectories of the optimization techniques_Case1.
4.2 Case 2: Total cost minimization with carbon tax and emissions
In this scenario,the primary objective is to minimize the generation cost while accounting for emissions.A forced carbon tax (Ctax) of 20 $/ton is applied,as specified in[47].Table 4 presents the statistical results of 30 simulation runs,evaluating the performance of various algorithms.Remarkably,the ECFA consistently outperforms the other algorithms in terms of the minimum,maximum,and average generation costs,with results highlighted in bold.Notably,ECFA ach ieves the lowest generation cost of 810.1013 $/h.Fig.8 displays the convergence trajectories of the studied methods.
Table 4 Economic and statistical results obtained from the studied algorithms_Case 2.
Fig.8.Convergence trajectories of the optimization techniques_Case 2.
4.3Case 3: Total cost minimization with POZs and RES-based generating units
In this case study,the primary objective is to minimize the overall cost while considering POZs and RESs.The objective function is formulated to reflect this goal.Table 5 presents the statistical results obtained from 30 simulation runs for all algorithms.The most favorable results in terms oftotal cost reduction are achieved using the ECFA,which is highlighted in bold.The convergence trajectories of the evaluated algorithms are graphically illustrated in Fig.9.Remarkably,ECFA demonstrates rapid convergence,achieving the desired results in fewer than 200 iterations.
Table 5 Economic and statistical results obtained from the studied algorithms_ Case 3.
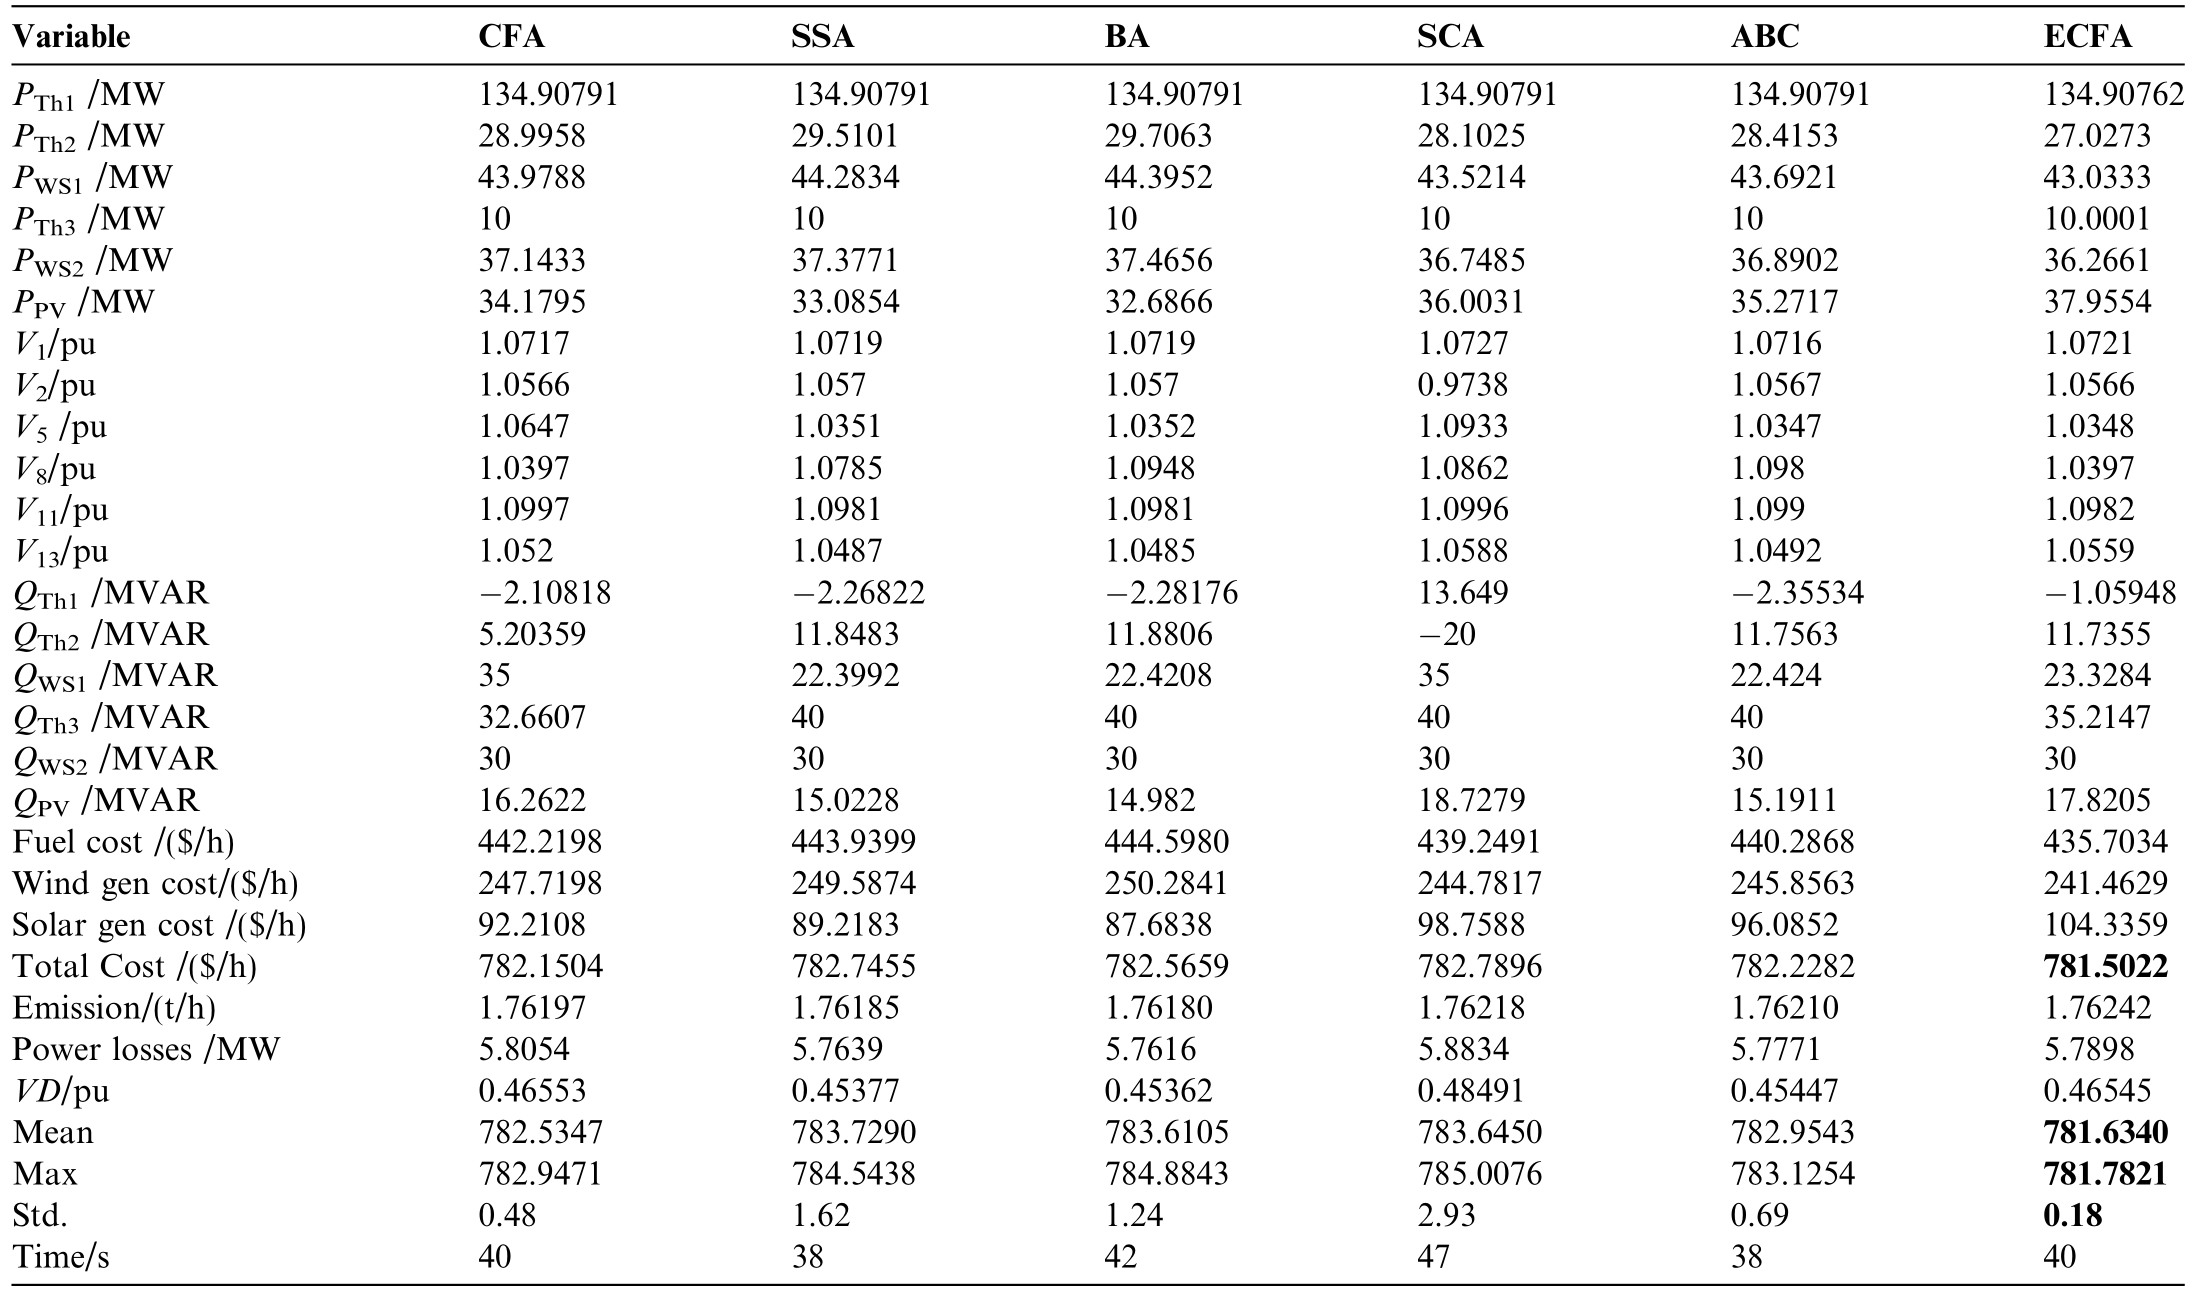
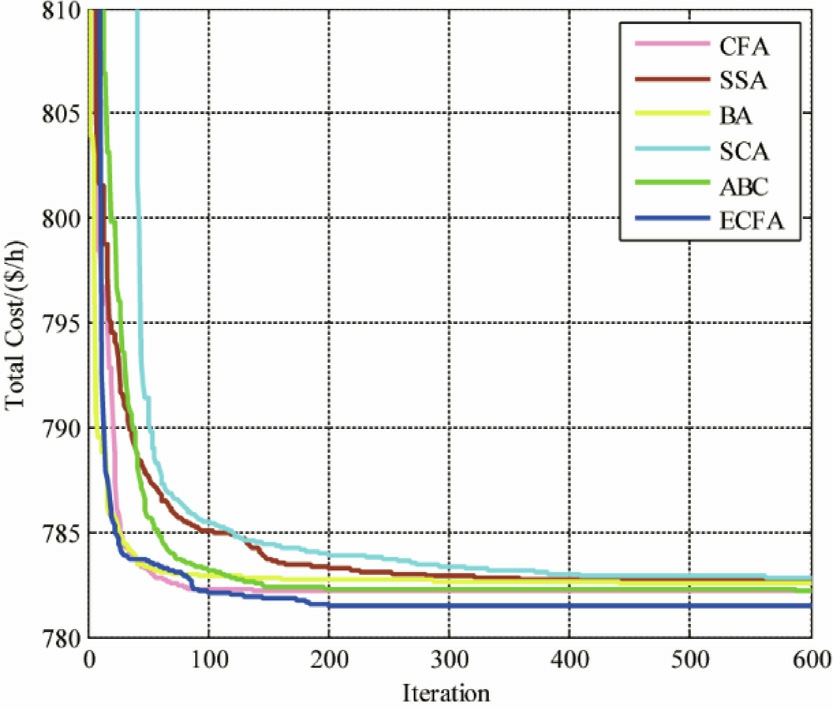
Fig.9.Convergence trajectories of the optimization techniques_Case3.
4.4 Case 4: Minimization of active power losses
This case study focuses on minimizing total transmission losses.These losses are obtained from MATPOWER after execu ting the load flow analysis.Comparative statistical results of the evaluated algorithms are presented in Table 6.The findings confirm that ECFA achieves the lowest losses,outperforming the other algorithms.Moreover,ECFA exhibits superior consistency,as indicated by the minimum,maximum,average,and standard deviation values across 30 simulation runs.To illustrate the convergence rate,Fig.10 shows the convergence trajectories for the best run of each algorithm in this case.Notably,ECFA converges in fewer than 180 iterations to achieve the minimum loss values.
Table 6 Economic and statistical results obtained from the studied algorithms_Case 4.
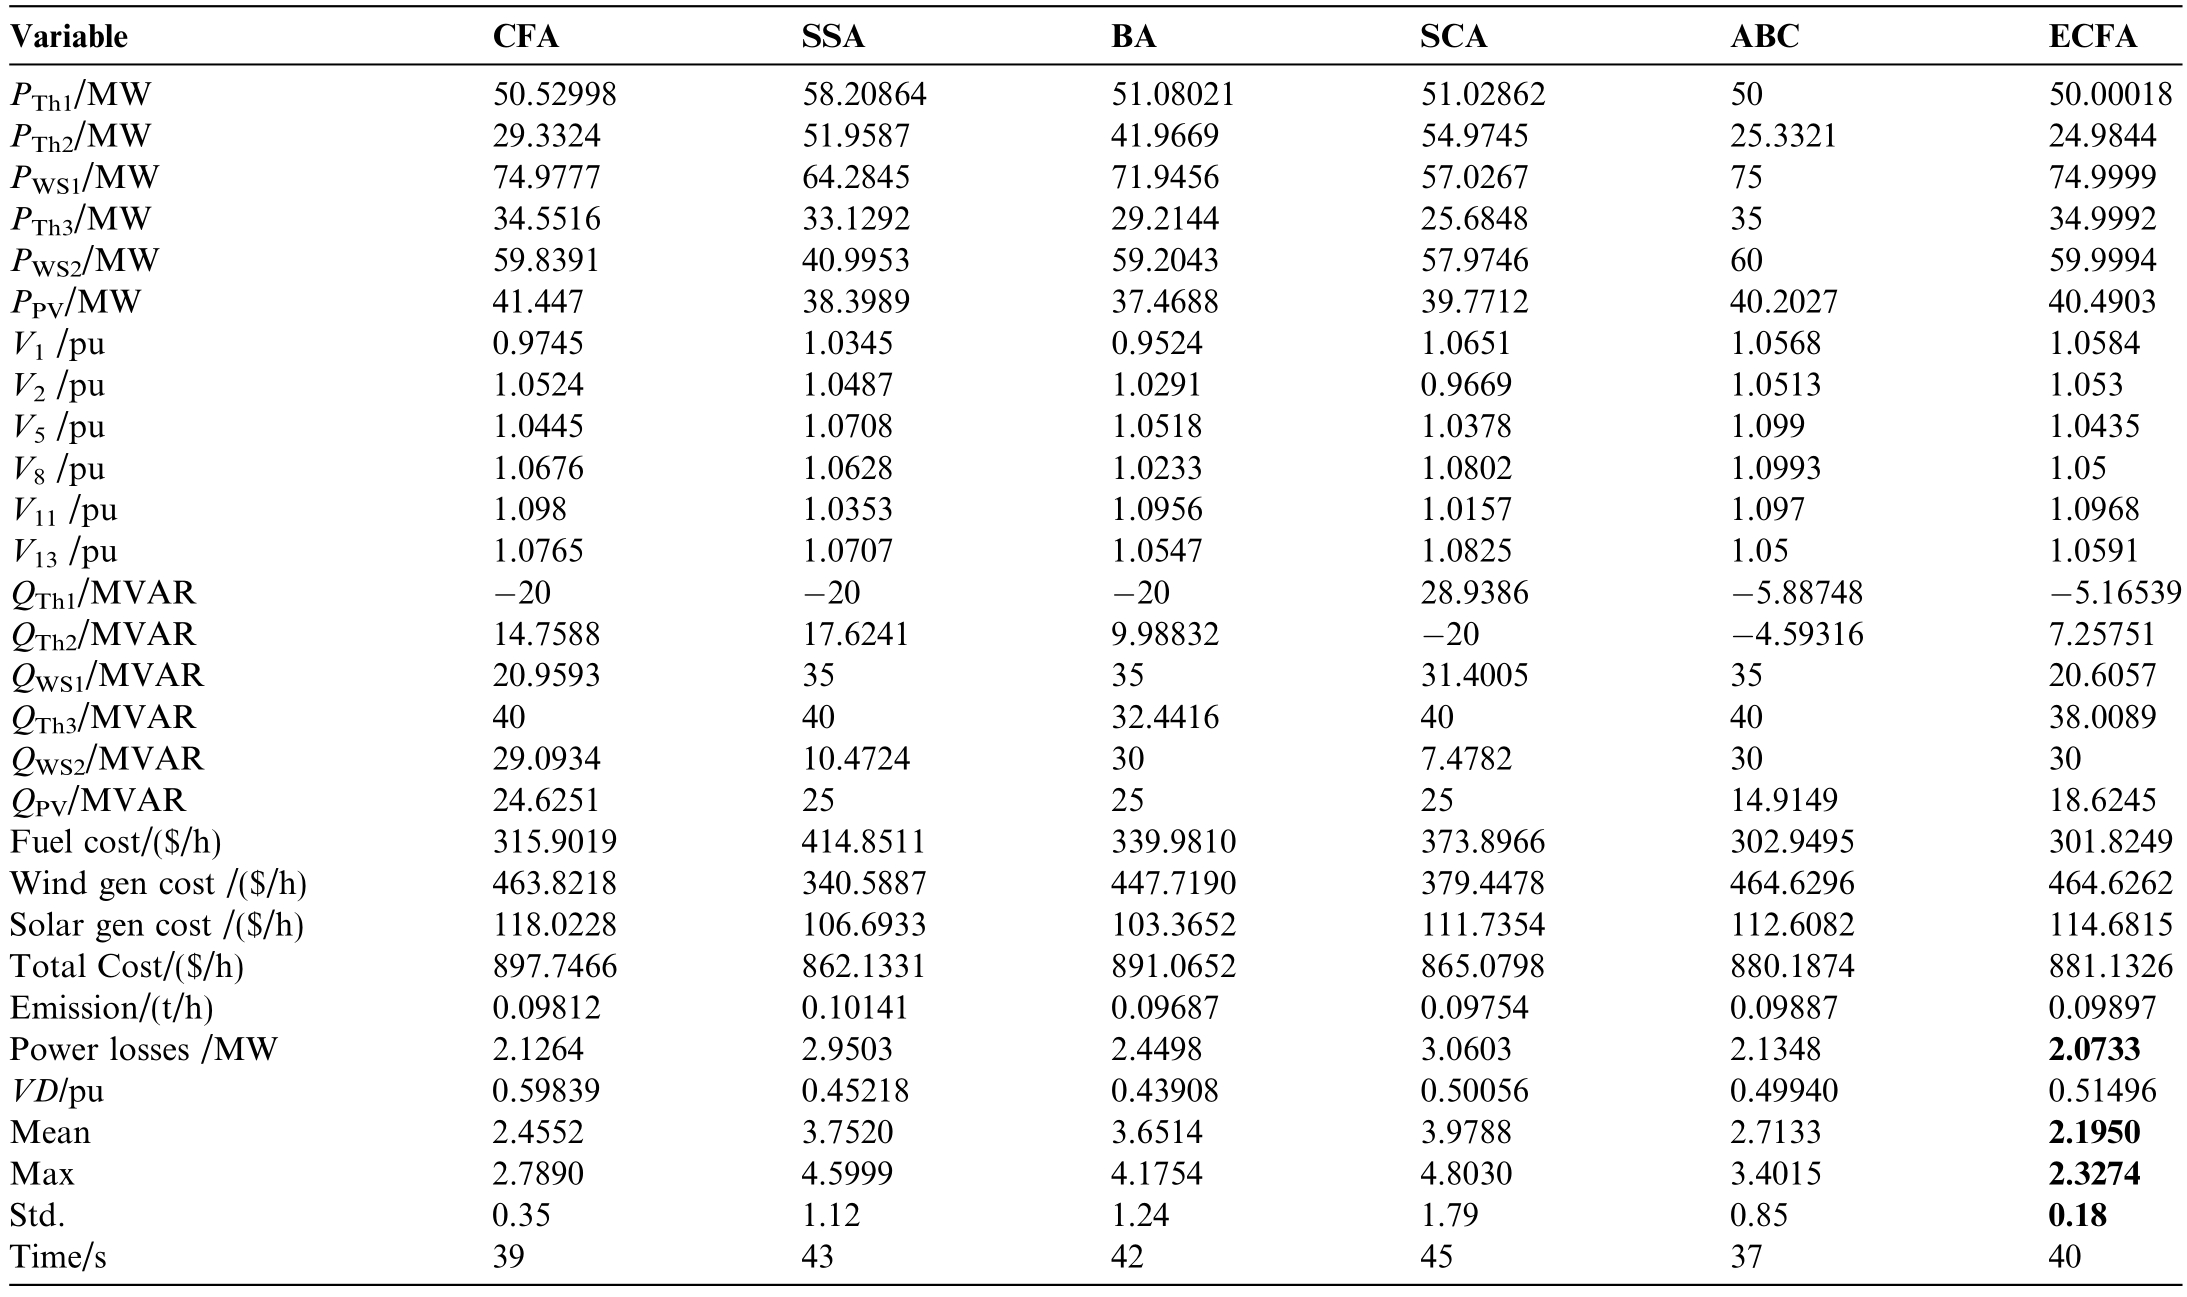
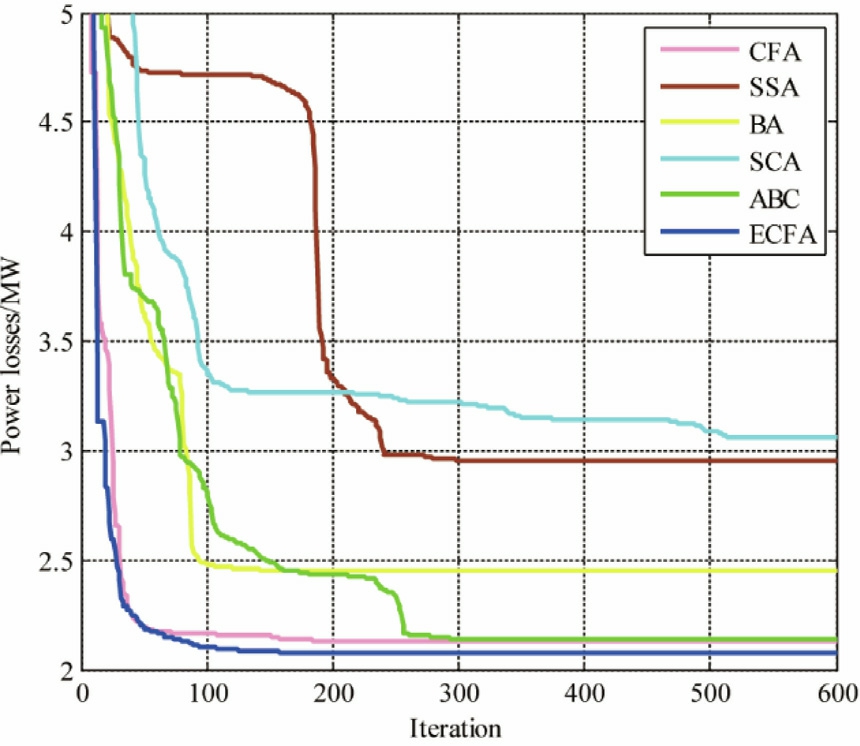
Fig.10.Convergence trajectories of the optimization techniques_Case 4.
4.5 Case 5: VD minimization
This case study investigates VD minimization,whichis crucial for maintaining the power system ne twork’s voltage quality and security at each node.The obtained results are given in Table 7.The results demonstrate that the ECFA outperforms other algorithms by achieving the lowest voltage deviation.Moreover,the ECFA shows superior results concerning minimum,maximum,average,and std.Fig.11 depicts the convergence trajectories of the studied methods.
Table 7 Economic and statistical results obtained from the studied algorithms_ Case 5.
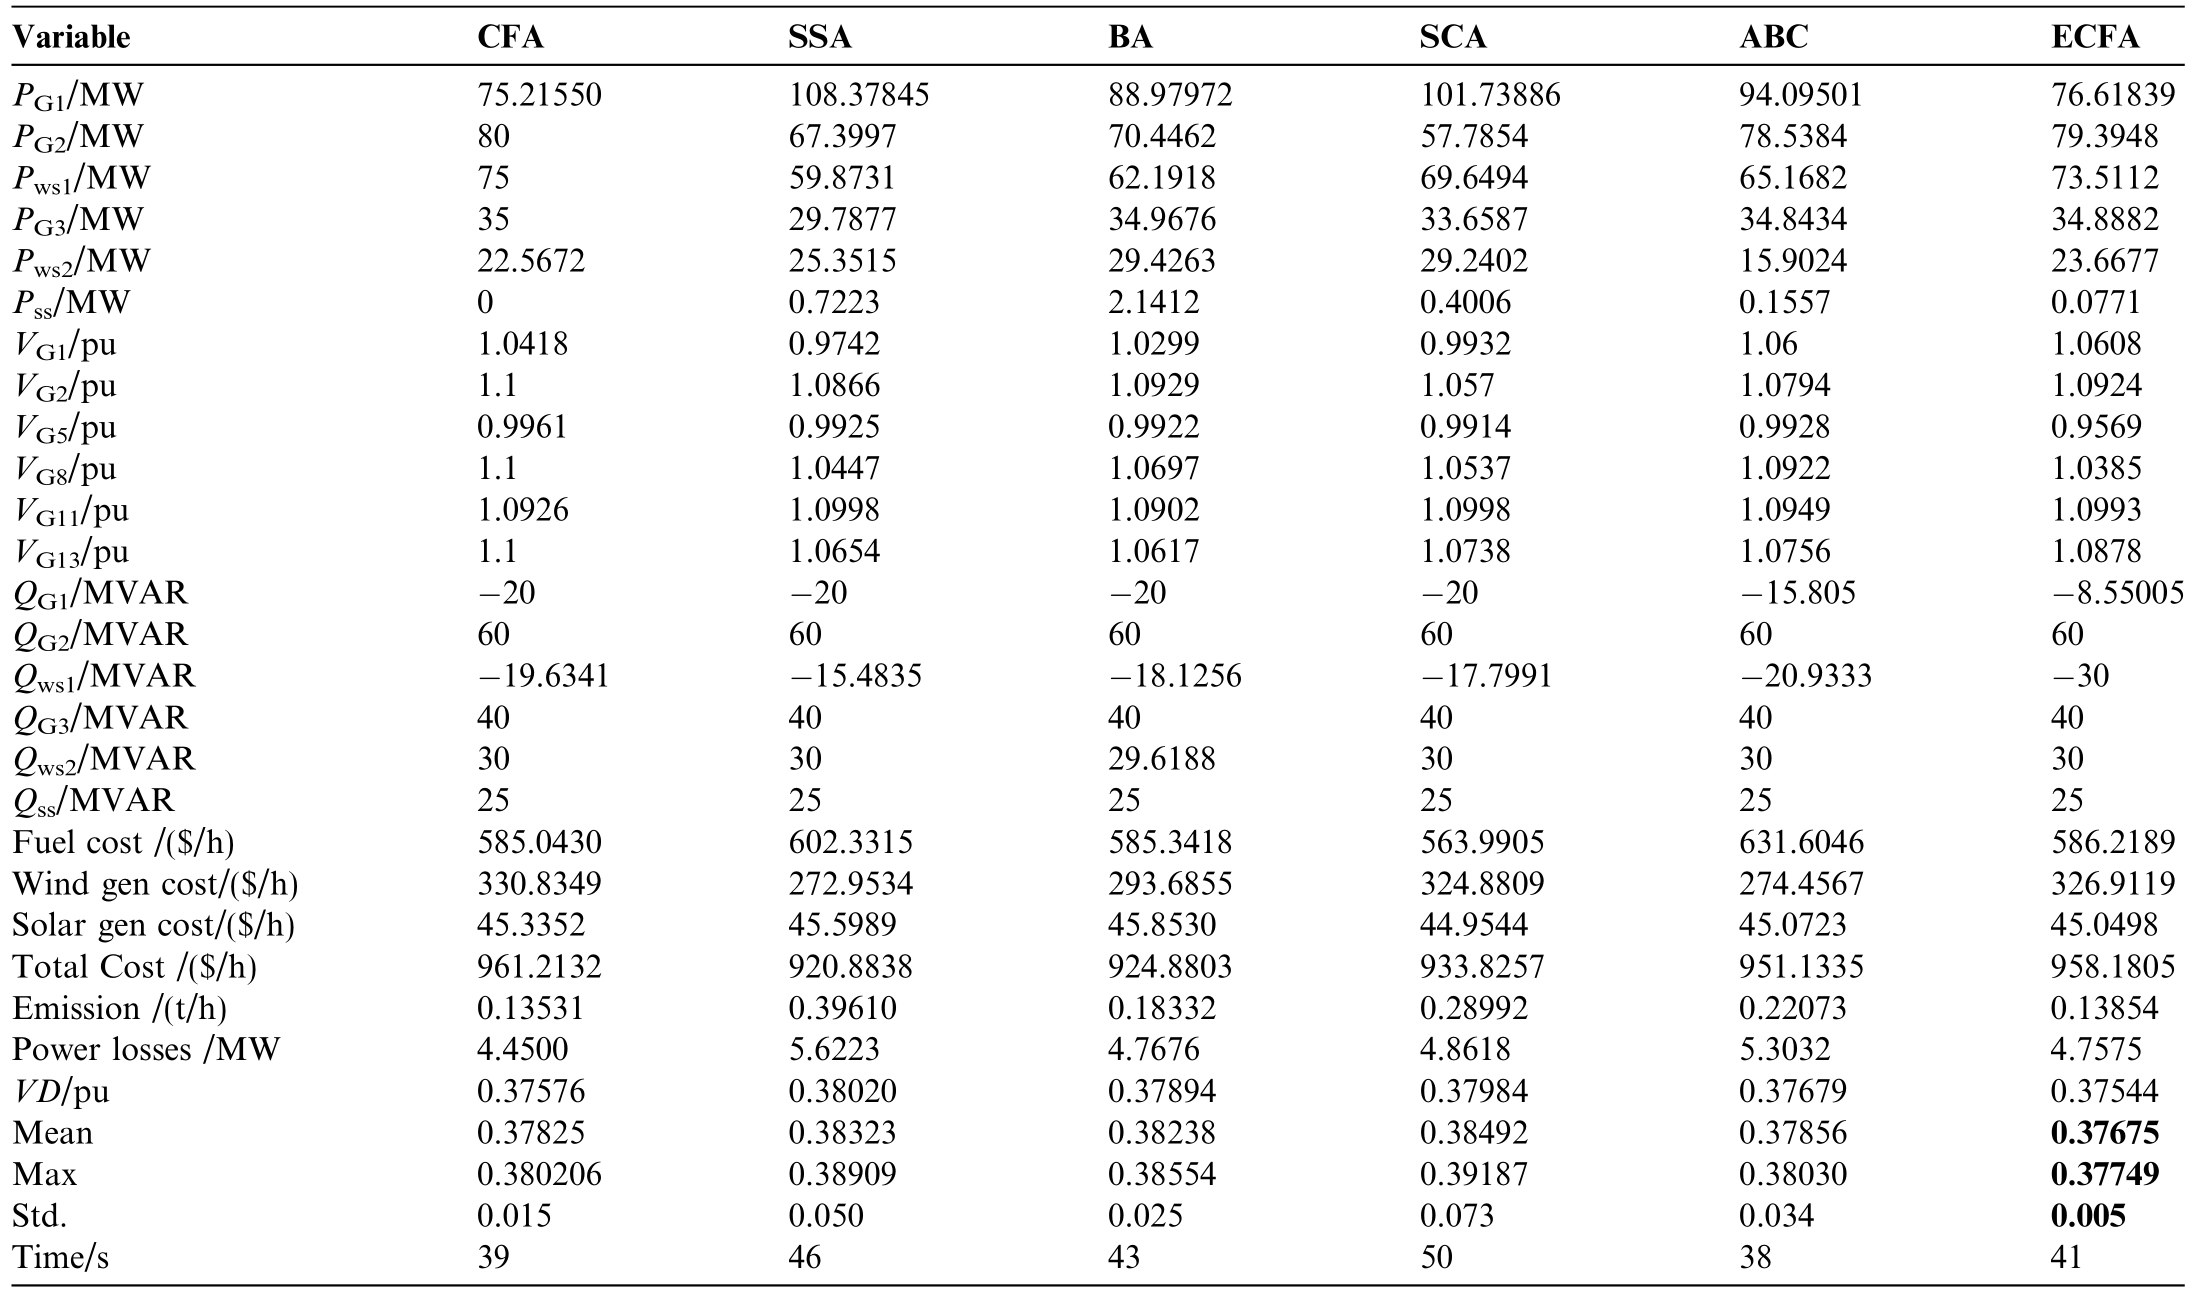
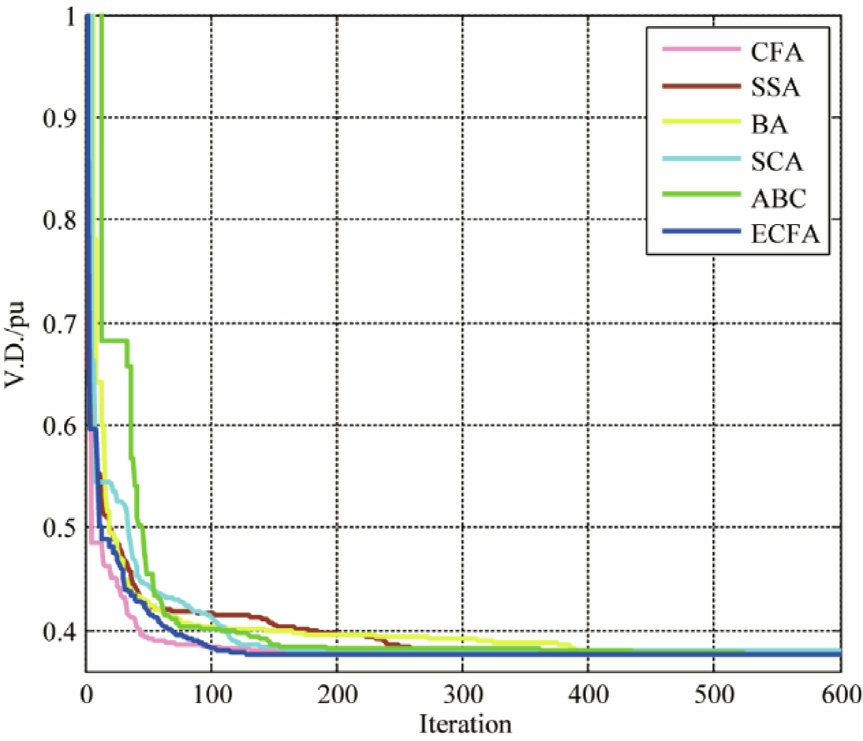
Fig.11.Convergence trajectories of the optimization techniques _Case5.
5 Conclusions
The crucial optimization problem OPF has captured the researcher’s attention in the area of power system studies.Different methods have been presented so far to cope with this problem.In this regard,this paper proposed a modified optimization method using the ECFA.Initially,the OPF problem was modeled as a nonlinear optimization problem,and different objectives were introduced.The objective functions included total cost minimization,emission costs minimization,voltage deviation minimization,as well as transmission losses minimization.Besides,renewable power generation through WTs and solar PV panels was modeled in the context of the OPF.In this regard,five case studies were simulated and analyzed where the ECFA indicated superior performance compared to other optimization methods,including SSA,BA,SCA,ABC,and CFA.The paper investigated the benefits of employing the ECFA method to tackle the OPF problem.The suggested method proved effective in real-world scenarios and outperformed several commonly used and powerful algorithms from previous publications,showc asing its efficiency in solving complex optimization problems.
CRediT authorship contribution statement
Saeid Jowkar: Writing– original draft,Methodology,Software,Data curation.Amin Besharatiyan: Writing–original draft,Formal analysis,Validation.Ali Esmaeel Nezhad: Supervision,Project administration,Investigation,Validation,Resources,Methodology,Conceptualization.Ehsan Rahimi: Methodology,Investigation.Fariba Esmaeilnezhad: Visualization,Project administration,Resources,Methodology.Toktam Tavakkoli Sabour: Methodology,Investigation.Mohammadamin Mobtahej: Supervision,Formal analysis. Afshin Canani: Project administration,Supervision,Formal analysis.
Declaration of competing interest
The authors declare that they have no known competing financial interests or personal relationships that could have appeared to influence the work reported in this paper.
Acknowledgments
The authors received no funding for this work.
References
[1]M.Javadi,A.E.Nezhad,M.Gough,M.Lotfi,J.P.Catalão,Implementation of consensus-ADMM approach for fast DC-OPF studies,In: Paper presented at International Conference on Smart Energy Systems and Technologies (SEST).IEEE.2019.pp.1–5.https://doi.org/10.1109/SEST.2019.8848992.
[2]A.Esmaeel Nezhad,T.Tavakkoli Sabour,R.P.Joshi,Coordinated TSO-DSO operational planning for congestion management in day-ahead and real-time markets,e-Prime– Adv.Electr.Eng.Electron.Energy 12 (2025) 100981.
[3]A.Esmaeel Nezhad,P.H.J.Nardelli,M.S.Javadi,S.Jowkar,T.Tavakkoli Sabour,F.Ghanavati,A hybrid optimal power flow model for transmission and distribution networks,Electr.Pow.Syst.Res.245 (2025) 111638.
[4]S.E.Razavi,H.Falaghi,A.Esmaeel Nezhad,M.J.Hadidian Moghaddam,F.H.Gandoman,An effective approach for the probabilistic and deterministic multistage PMU placement using cuckoo search: Iran’s national power system,Iran.J.Sci.Technol.– Trans.Electr.Eng.44 (2020) 237–252.
[5]M.S.Javadi,A.Esmaeel Nezhad,A.R.Jordehi,M.Gough,S.F.Santos,J.P.S.Catalão,Transactive energy framework in multicarrier energy hubs: a fully decentralized model,Energy 238 (2022)121717.
[6]M.S.Javadi,M.Lotfi,M.Gough,A.E.Nezhad,S.F.Santos,J.P.S.Catalão,Optimal spinning reserve allocation in presence of electrical storage and renewable energy sources,in: Proceedings–2019 Paper presented at IEEE International Conference on Environment and Electrical Engineering and IEEE Industrial and Commercial Power Systems Europe,EEEIC/I and CPS Europe 2019.https://doi.org/10.1109/EEEIC.2019.8783696.
[7]U.Guvenc,S.Duman,H.T.Kahraman,S.Aras,M.Katı,Fitness–Distance Balance based adaptive guided differential evolution algorithm for security-constrained optimal power flow problem incorporating renewable energy sources,Appl.Soft Comput.108(2021) 107421.
[8]A.Esmaeel Nezhad,S.Jowkar,T.Tavakkoli Sabour,E.Rahimi,F.Ghanavati,F.Esmaeilnezhad,A short-term wind-hydrotherm al operational framework in the presence of pumped-hydro storage,e-Prime– Adv.Electr.Eng.Electr.Energy 8 (2024) 100577.
[9]A.Esmaeel Nezhad,T.Tavakkoli Sabour,M.S.Javadi,P.H.J.Nardelli,S.Jowkar,F.Ghanavati,Water–en ergy nexus.Towards Future Smart Power Systems with High Penetration of Renewables(2025) 75–102.
[10]M.Simab,M.S.Javadi,A.E.Nezhad,Multi-objective programming of pumped-hydro-thermal scheduling problem using normal boundary intersection and VIKOR,Energy 143(2018) 854–866.
[11]A.Esmaeel Nezhad,A.Rahimnejad,P.H.J.Nardelli,S.A.Gadsden,S.Sahoo,F.Ghanavati,A shrinking horizon model predictive controller for daily scheduling of home energy management systems,IEEE Access 10 (2022) 29716–29730.
[12]M.S.Javadi,A.E.Nezhad,M.Gough,M.Lotfi,A.Anvari-Moghaddam,P.H.J.Nardelli,S.Sahoo,J.P.S.Catalã o,Conditional value-at-risk model for smart home energy management systems,e-Prime– Adv.Electr.Eng.Electron.Energy 1 (2021) 100006.
[13]A.Esmaeel Nezhad,M.Mobtahej,M.S.Javadi,P.H.J.Nardelli,S.Sahoo,Optimal operation of lithium-ion batteries in microgrids using a semidefinite thermal model,Int.J.Electr.Power Energy Syst.155 (2024) 109630.
[14]M.S.Javadi,A.E.Nezhad,M.Shafie-Khah,P.Siano,J.P.S.Catalão,Assessing the benefits of capacity payment,feed-in-tariff and time-of-use programme on long-term renewable energy sources integration,IET Smart Grid 2 (2019) 602–611.
[15]M.Lotfi,P.S.Joao Catalao,M.S.Javadi,A.E.Nezhad,M.Shafie-Khah,Demand response program implementation for day-ahead power system operation,IEEE Milan PowerTech.PowerTech 2019(2019),https://doi.org/10.1109/PTC.2019.8810850.
[16]A.Besharatiyan,S.Jowkar,A.Esmaeel Nezhad,E.Rahimi,F.Esmaeilnezhad,T.Tavakkoli Sabour,A.Zare,A.Demir,Tackling optimal power flow in modern power systems using a new optimization strategy,Front.Eng.Manage.(2025) 1–22.
[17]S.R .Salkuti,Optimal power flow using multi-objective glowworm swarm optimization algorithm in a wind energy integrated power system 16 (2019) 1547–1561.doi: 101080/1543507520191677234.
[18]E.E.Elattar,Optimal power flow of a power system incorporating stochastic wind power based on modified moth swarm algorithm,IEEE Access 7 (2019) 89581–89593.
[19]P.P.Biswas,P.N.Suganthan,B.Y.Qu,G.A.J.Amaratunga,Multiobjective economic-environmental power dispatch with stochastic wind-solar-small hydro power,Energy 150 (2018)1039–1057.
[20]A.Alanazi,M.Alanazi,M.Barbosa,et al.,Determining optimal power flow solutions using new adaptive Gaussian TLBO method,Appl.Sci.12 (2022) 7959.
[21]R.Kathiravan,R.P.Kumudini Devi,Optimal power flow model incorporating wind,solar,and bundled solar-thermal power in the restructured Indian power system,Int.J.Green Energy 14 (2017)934–950,http://dx.doi.org/101080/1543507520171339045.
[22]J.Sarda,K.Pandya,K.Y.Lee,Hybrid cross entropy—cuc koo search algorithm for solving optimal power flow with renewable generators and controllable loads,Optim.Control Appl.Methods 44 (2023) 508–532.
[23]S.Duman,S.Rivera,J.Li,L.Wu,Optimal power flow of power systems with controllable wind-photovoltaic energy systems via differential evolutionary particle swarm optimization,Int.Trans.Electr.Energy Syst.30 (2020) e12270.
[24]M.Riaz,A.Hanif,S.J.Hussain,M.I.Memon,M.U.Ali,A.Zafar,An optimization-based strategy for solving optimal power flow problems in a power system integrated with stochastic solar and wind power energy,Appl.Sci.11 (2021) 6883.
[25]S.Sarhan,R.El-Sehiemy,A.Abaza,M.Gafar,Turbulent flowof water-based optimization for solving multi-objective technical and economic aspects of optimal power flow problems,Mathematics10(2022) 2106.
[26]B.Mahdad,K.Srairi,T.Bouktir,Optimal power flow for largescale power system with shunt FACTS using efficient parallel GA,Int.J.Electr.Power Energy Syst.32 (2010) 507–517.
[27]M.Abdo,S.Kamel,M.Ebeed,J.Yu,F.Jurado,Solving nonsmooth optimal power flow problems using a developed grey wolf optimizer,Energies 11 (2018) 1692.
[28]M.Ghasemi,S.Ghavidel,E.Akbari,A.A.Vahed,Solving nonlinear,non-smooth and non-convex optimal power flow problems using chaotic invasive weed optimization algorithms based on chaos,Energy 73 (2014) 340–353.
[29]S.Mouassa,A.Althobaiti,F.Jurado,S.S.M.Ghoneim,Novel design of slim mould optimizer for the solution of optimal power flow problems incorporating intermittent sources: a case study of Algerian electricity grid,IEEE Access 10 (2022) 22646–22661.
[30]A.Panda,M.Tripathy,A.K.Barisal,T.Prakash,A modified bacteria foraging based optimal power flow framework for Hydro-Thermal-Wind generation system in the presence of STATCOM,Energy 124 (2017) 720–740.
[31]M.Ghasemi,S.Ghavidel,S.Rahmani,A.Roosta,H.Falah,A novel hybrid algorithm of imperialist competitive algorithm and teaching learning algorithm for optimal power flow problem with non-smooth cost functions,Eng.Appl.Artif.Intel.29 (2014) 54–69.
[32]P.Jangir,A.E.Ezugwu,Arpita,S.P.Agrawal,S.B.Pandya,A.Parmar,G.Gulothungan,L.Abualigah,Precision parameter estimation in proton exchange membrane fuel cells using depth information enhanced differential evolution,Sci.Rep.14 (1) (2024)1–36.
[33]P.Jangir,A.E.Ezugwu,K.Saleem,Arpita,S.P.Agrawal,S.B.Pandya,A.Parmar,G.Gulothungan,L.Abualigah,A hybrid mutational Northern Goshawk and elite opposition learning artificial rabbits optimizer for PEMFC parameter estimation,Sci.Rep.14 (1) (2024) 1–23.
[34]P.Jangir,A.E.Ezugwu,K.Saleem,Arpita,S.P.Agrawal,S.B.Pandya,A.Parmar,G.Gulothungan,L.Abualigah,A levy chaotic horizontal vertical crossover based artificial hummingb ird algorithm for precise PEMFC parameter estimation,Sci.Rep.14(1) (2024) 1–26.
[35]P.Jangir,Arpita,Sunilkumar,et al.,A cooperative strategy-based differential evolution algorithm for robust PEM fuel cell parameter estimation,Ionics 31 (1) (2024) 703–741.
[36]The quick crisscross sine cosine algorithm for optimal FACTS placement in uncertain wind integrated scenario based power systems-ScienceDirect.https://www.sciencedirect.com/science/article/pii/S2590123024019467.Accessed 15 Apr 2025.
[37]G.Srikanth,D.Nimma,R.V.S.Lalitha,P.Jangir,N.V.S.Kumari,Arpita,Food security based marine life ecosystem for polar region conditioning: remote sensing analysis with machine learning model,Remote Sens.Earth Syst.Sci.8 (2024) 65–73.
[38]C.Yue,H.F.Isleem,D.N.Qader,A.Mahmoudian,T.Weiming,P.Jangir,Arpita,A.Y.Hamed,Utilization finite element andmachine learning methods to investigation the axial compressive behavior of elliptical FRP-confined concrete columns,Structures 70 (2024) 107681.
[39]H.S.Mohamed,T.Qiong,H.F.Isleem,R.K.Tipu,R.I.Shahin,S.A.Yehia,P.Jangir,Arpita,M.Khishe,Compressive behaviorof elliptical concrete-filled steel tubular short columns using numerical investigation and machine learning techniques,Sci.Rep.14 (1)(2024) 1–31.
[40]M.Ghasemi,S.Ghavidel,J.Aghaei,E.Akbari,L.Li,CFA optimizer: a new and powerful algorithm inspired by Franklin’s and Coulomb’s laws theory for solving the economic load dispatch problems,Int.Trans.Electr.Energy Syst.28 (2018) e2536.
[41]M.Ghasemi,E.Akbari,I.Faraji Davoudkhani,A.Rahimnej ad,M.B.Asadpoor,S.A.Gadsden,Application of Coulomb’s and Franklin’s laws algorithm to solve large-scale optimal reactive power dispatch problems,Soft.Comput.26 (2022) 13899–13923.
[42]M.S.Javadi,A.Esmaeel Nezhad,Multi-objective,multi-year dynamic generation and transmission expansion planningrenewable energy sources integration for Iran’s National Power Grid,Int.Trans.Electr.Energy Syst.29 (2019) e2810.
[43]MATPOWER– Free,open-source tools for electric power system simulation and optimization.https://matpower.org/.Accessed29 Jul 2023.
[44]J.Kennedy,Eberhart R Particle swarm optimization,in:Proceedings of ICNN’95– Paper presented at International Conference on Neural Networks,vol.4.pp.1942–1948.
[45]M.Clerc,J.Kennedy,The particle swarm-explosion,stability,and convergence in a multidimensional complex space,IEEE Trans.Evol.Comput.6 (2002) 58–73.
[46]U.Guvenc,S.Duman,H.T.Kahraman,S.Aras,M.Kat\i,Fitnessdistance Balance based adaptive guided differential evolution algorithm for security-constrained optimal power flow problem incorporating renewable energy sources,Appl.Soft Comput.108(2021) 107421.
[47]P.P.Biswas,P.N.Suganthan,G.A.J.Amaratunga,Optimal power flow solutions incorporating stochastic wind and solar power,Energy Convers Manag 148 (2017) 1194–1207.
[48]F.Van Den Bergh,A.P.Engelbrecht,A study of particle swarm optimization particle trajectories,Inf.Sci.(N Y) 176 (2006) 937–971.
[49]J.Kennedy,Bare bones particle swarms,2003 IEEE Swarm Intelligence Symposium,2003.
[50]A.S.Alghamdi,Optimal power flow of renewable-integrated power systems using a Gaussian bare-bones levy-flight firefly algorithm,Front.Energy Res.10 (2022) 921936.
[51]A.A.A.Mohamed,Y.S.Mohamed,A.A.M.El-Gaafary,A.M.Hemeida,Optimal power flow using moth swarm algorithm,Electr.Pow.Syst.Res.142 (2017) 190–206.
Received 9 February 2025;revised 16 April 2025;accepted 11 May 2025
* Corresponding author.
E-mail addresses: saeid.jowkar@studio.unibo.it (S.Jowkar),aesmaeel@ttu.edu (A.Esmaeel Nezhad),ttavakol@ttu.edu (T.Tavakkoli Sabour),Mmobtahej@lamar.edu (M.Mobtahej).
https://doi.org/10.1016/j.gloei.2025.05.006
2096-5117/© 2025 Global Energy Interconnection Group Co.Ltd.Publishing services by Elsevier B.V.on behalf of KeAi Communications Co.Ltd.This is an open access article under the CC BY-NC-ND license(http://creativecommons.org/licenses/by-nc-nd/4.0/).

Amin Besharatiyan received the bachelor’s degree master’s degree in Electrical Engineering-Power at the Allameh Mohaddes Nouri University,Nur,Iran,and The Islamic Azad University,Najafabad,Iran,2009 and 2013,respectively.His research interests include power system operation and planning,renewable energy and electric vehicles.