
0 Introduction
Over the past five years,North America has witnessed a dramatic surge in clean-energy investment and buildingefficiency innovation,propelled by ambitious net-zero emissions targets for 2050 in both the United States and Canada.In 2023,global clean-energy spending reached$1.70 for every $1 devoted to fossil fuels—nearly double the ratio recorded in 2018 [1].This shift reflects stronger macroeconomic conditions,heightened energy-security concerns,and landmark policy interventions such as the U.S.Inflation Reduction Act of 2022 and parallel Canadian incentives.At the same time,emerging technologies—from air-source heat pumps and grid-interactive efficient buildings to on-site battery storage—are transforming how buildings generate,consume,and interact with the grid.
In this study,we:
 Characterize trends in renewable-energy finance(2022–2025),including green bonds,public– private partnerships,and tax incentives;
 Review advances in residential and commercial building energy technologies;and.
 Present North American case studies that illustrate the interplay of policy,finance,and technology on the ground.
Our analysis draws on the latest data (through 2025)from leading agencies—International Energy Agency(IEA),National Renewable Energy Laboratory (NREL),Department of Energy (DOE)—and employs tables and figures to underscore key quantitative developments.
1 Renewable energy financing trend s (2022–2025)
1.1 Investment flows on the rise
Global renewable energy investment reached $622.5 billion in 2023,up by 8.1% over 2022 as falling technology costs boosted capacity per dollar [2].North America led this surge: U.S.investment jumped 60% to $92.9 billion under Inflation Reduction Act (IRA) incentives,Europe climbed 43% to $134.4 billion,and China fell 10% to$273.2 billion [2].The Canada Infrastructure Bank also committed $9.7 billion,leveraging $27 billion,to clean projects by early 2023[3].These trends helped drive global clean energy spending to $1.7 trillion—1.7 times fossil fuel investment—marking a decisive shift toward sustainable energy [1].
According to Fig.1,United States is in the lower spectrum of the renewable energy investments when compared to Europe and China.Hence,financial instruments like IRA and PPA are essential for sustained investments in green energy [2].This divergence underscores the boost from North American policies like the U.S.Inflation Reduction Act,contribu ting to a record $622.5 billion in global renewable spending in 2023.
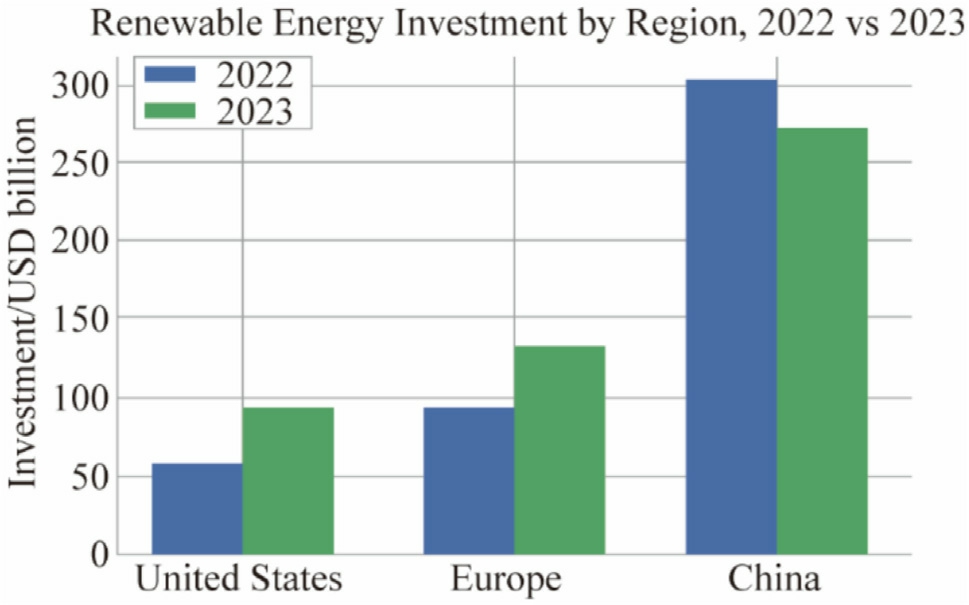
Fig.1.Renewable energy investment by region,2022 vs 2023.
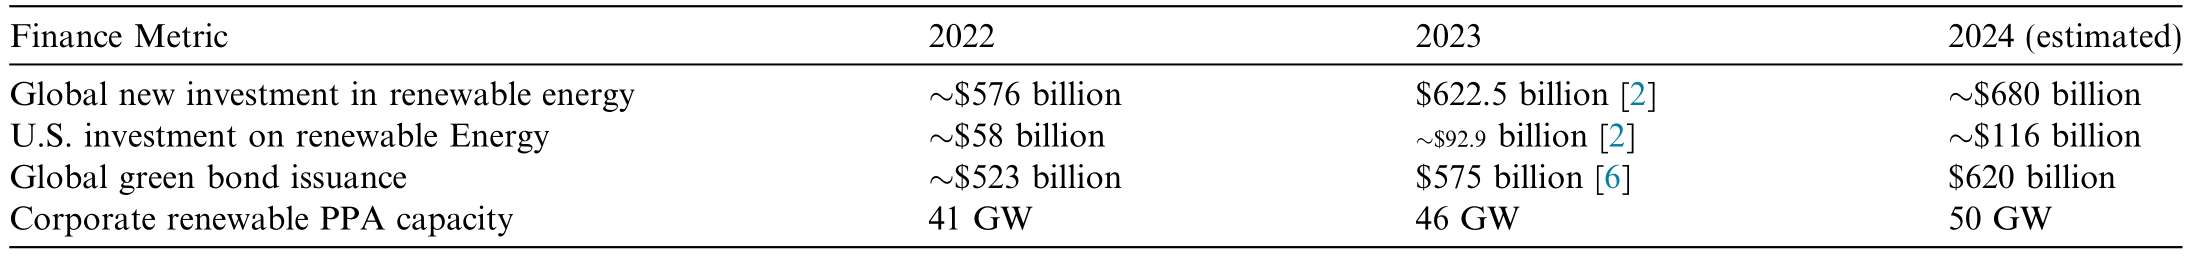
For the first time,clean-energy investment outpaced fossil-fuel investment by a 1.7:1 ratio in 2023,up from parity five years earlier [1].North America leads this shift:since August 2022,over $550 billion in new clean-energy projects,including factories,battery gigafactories,and renewables,have been announced [4].In Canada,the$1.5 billion Smart Renewables and Electrification Pathways (SREP) program (2021– 2023) focuses solely on expanding clean power and grid infrastructure [5].Key financial parameters are summarized in Table 1.
Table 1 Key renewable energy finance indicators (North America &Global).
2 Financial instruments: Green bonds and power purchase agreements
Global green bond issuance rose 10% to $575 billion in 2023,led by European issuers despite softer U.S.activity[6].Since 2014,North America has issued over $450 billion in green bonds—financing sustainable infrastructure,energy-efficient buildings,and renewables—with highlights including California’s $2.2 billion climate bond and Canada’s first CAD 5 billion sovereign green bond in 2022.In 2024,green,social,and sustainability-linked bonds are expected to account for 14–16%of global issuance,reflecting strong investor demand [6].
Corporate power purchase agreements (PPAs) also set new records.46 GW of global PPA volume was announced in 2023,a 12% increase from 2022,with roughly 21 GW in the Americas [8].In 2024,U.S.corporate PPAs reached 28 GW—84% driven by major tech firms[9].Since 2008,about 200 GW of renewable capacity has been contracted.Emerging structures—such as aggregated PPAs and 24/7 carbon-free energy deals—are further scaling corporate renewable procurement.
2.1 Public–private partnerships in finance
Public–private partnerships (PPPs) now underpin many North American clean-energy and efficiency projects by combining private capital and expertise with public policy support.
Green banks and infrastructure funds use public seed capital to attract private co-investment.For example,the U.S.Greenhouse Gas Reduction Fund has seeded $27 billion into state green banks,which then mobilize about three to four times that amount into private loans for community solar,EV charging,and building retrofits.Likewise,the Canada Infrastructure Bank committed CAD 9.7 billion to 46 projects—totaling CAD 27 billion—in clean power,green infrastructure,and transportation by March 2023 [3].
Energy service companies (ESCOs) retrofit public and commercial buildings via performance contracts,financing upgrades up front and recouping costs from guaranteed energy savings.The U.S.Department of Energy’s [DOE]Federal Energy Management Program has used this model to invest over $4 billion in federal facility efficiency and renewable upgrades in the past decade,all financed by private ESCOs.
Utilities and municipalities are also partnering on microgrids and grid modernization.In 2023,NB Power,the City of Edmundston,and Ame resco co-funded an $8 million arena microgrid,sharing design,capital,and operational risk [10].U.S.utilities such as Entergy are exploring similar joint ventures to deploy microgrids as nonwires alternatives [11].
Finally,cities are pioneering on-bill repayment,Property Assessed Clean Energy (PACE) loans,and Energyas-a-Service (EaaS) models that shift retrofit costs onto property taxes,utility bills,or fixed service fees.Ottawa’s Better Homes Loan Program partners with a private bank to expand retrofit capital,and Los Angeles’s EaaScontracts install solar and storage on city buildings at no upfront cost,repaid via below-market service rates [12].
Together,these PPP frameworks de-risk investment,leverage scarce public funds,and accelerate large-scale deployment of susta inable infrastructure—from lowincome home weatherization to resilient microgrids.
2.2 Governement incentives and policy impacts
Since 2022,North American climate legislation has unleashed roughly US $369 billion in clean-energy incentives under the U.S.Inflation Reduction Act.Key provisions include bonus credits for domestic content and underserved communities;new investment tax credits(ITCs) for energy storage,clean hydrogen,and electric vehicles (EVs);a decade-long extension of the PTC and ITC for renewables;enhanced DOE loan guarantees;and a $27 billion Greenhouse Gas Reduction Fund.The result was immediate.By late 2024,186 new manufacturing facilities and 98 GW of clean-power capacity had been announced,mobilizing over$550 billion in investment and bringing many previously stalled solar and wind projects to financial close [4].
Canada followed with refundable ITCs in its 2023 budget—a 30% credit for clean technologies (renewables,nuclear,storage)and up to 40%for low-carbon hydrogen,available through 2034 [13,14].Complementary policies—a clean electricity standard targeting net-zero by 2035,a carbon price rising from CAD 65 to CAD 170/tonne,and provincial procurement programs—further strengthen project economics.At the state level,over 30 U.S.jurisdiction enforce renewable portfolio standar ds(RPS)or cleanenergy targets (50–100% by 2040–2050),with mandates like California’s solar requirement,and New York’s NYSun and Green Bank programs driving additional deployment.
Building-sector incentives have also expanded,with the enhanced tax deductions for commercial efficiency and IRA rebates,up to $4000 for electrical panel upgrades and $8000 for heat-pump installations,raised the private return on retrofit investments.Altogether,these coordinated federal,provincial,and state measures have unlocked unprecedented capital for sustainable energy between 2022 and 2025,using market signals,risk mitigation,and direct funding to accelerate the transition.
3 Emerging innovations in building energy technologies(residential &commercial)
As North America works to create more intelligent,carbon-efficient,and efficient buildings,interest in energy technology is developing quickly.Smart grid integration,on-site energy storage,sophisticated heating,ventilation,and air conditioning (HVAC) systems,and net-zero energy building design are important areas of innovation.By lowering energy usage and empowering buildings to generate and manage energy in novel ways,these technologies are revolutionizing both residential and commercial structures.
3.1 Smart grids and demand-side management
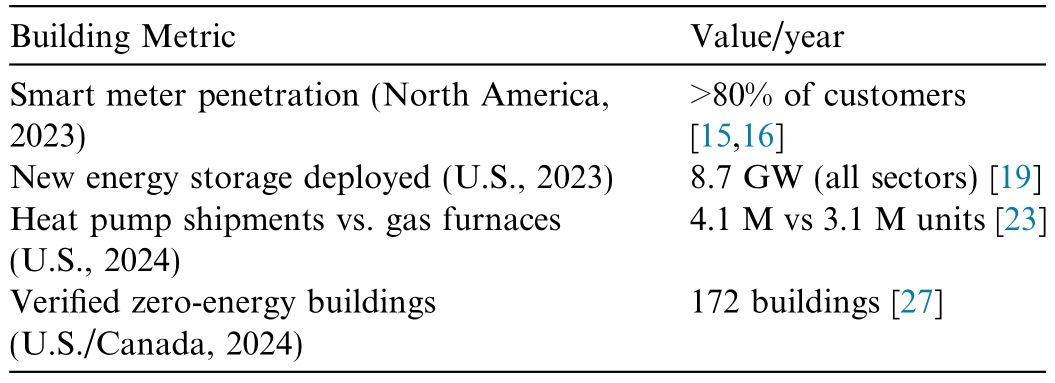
Smart Meters and Demand Response Smart meter penetration rose from 72% of U.S.meters in 2022 to over 80%of North Ame rican users by the end of 2023,representing roughly 128 million installations in the U.S.alone [7].These meters enable real-time,two-way communication,underpinning demand-response programs and time-ofuse tariffs that shift load away from peaks.Enrolled demand-response resources now meet about 6.5% of U.S.peak demand,reducing reliance on peaker plants [17].
Grid-Interactive Efficient Buildings (GEBs) combine sensors,controls,and IoT to actively manage on-site generation,storage,and loads in response to price or frequency signals.In 2023,the U.S.DOE awarded $46 million to 29 GEB pilot projects in 15 states to develop and retrofit buildings for grid services [18].A Florida demonstration achieved a 20% peak load reduction by autonomously coordinating smart appliances and batteries,while Ontario’s Powerhouse pilot integrates solar,storage,and intelligent controls to optimize building–grid interaction.As these pilots scale into virtual power plants,aggregated buildings can provide frequency regulation and peak shaving,lowering customer bills and bolstering grid resilience.
3.2 Energy storage integration in buildings
Over the past decade,lithium-ion cell costs have fallen by more than 80%,making behind-the-meter storage economical for homes and businesses.U.S.deployments nearly doubled from 4.6 GW in 2022 to 8.7 GW in 2023,driven largely by residential systems,and Q3 2024 alone added 346 MW—a 63% year-on-year increase—especially in California,Texas,and Hawaii[19,20].Paired with rooftop solar,these batteries enable daily arbitrage and seamless power-supply during outages;by 2025,California had installed over 80,000 home systems under incentive programs and wildfire-driven resilience needs.
Commercial facilities,from hospitals to big-box retailers,are also installing on-site storage to shave peak demand and maintain critical loads during grid failures.Advanced energy-management platforms now coordinate batteries with local generation and loads (for example,net-zero schools storing midday solar for evening HVAC peaks).Aggregated residential and commercial batteries are emerging as virtual power plants.Vermont’s utility,for inst ance,remotely dispatches roughly 10 MW of customer-owned systems to shave regional peaks and cut grid costs.With electric vehicles poised to add bidirectional storage by 2025,building-integrated batteries are set to become ubiquitous assets for reliability and renewable integration.
3.2.1 Integrating electric vehicles with building energy storage
Integrating electric vehicles (EVs) with building energy storage—through vehicle-to-home (V2H) and vehicle-togrid (V2G) technologies—offers a promising avenue for enhancing both grid resilience and building energy management.In this paradigm,EVs serve not only as transportation assets but also as flexible,distributed energy storage systems that can absorb excess renewable generation during off-peak periods and discharge power to support buildings or the grid during peak demand.
Preliminary studies have provided quantitative insights into these potential benefits.For example,research conducted by the National Renewable Energy Laboratory[21]developed a detailed simulation framework that explored integrating EV charging infrastructure into commercial building environments.This study demonstrated that coordinated EV charging and discharging can reduce peak grid loads by up to 15% and improve building energy efficiency when paired with renewable generation,such as rooftop solar panels.Similarly,a 2018 U.S.Department of Energy (DOE) report highlighted that,under V2G operations,EV fleets could offer ancillary services—such as frequency regulation and voltage support—which contribute to enhanced grid stability in regions with high renewable penetration [22].
Despite these promising findings,the practical realization of V2H and V2G integration remains largely speculative.Field demonstrations remain limited,and challenges such as the development of bi-directional charging infrastructure,standar dization of communication protocols,and the establishment of regulatory frameworks continue to impede widespread deployment.Moreover,most empirical work to date has relied on simulation models or short-term pilots rather than long-term field data,making it difficult to fully quantify economic and operational impacts over extended periods.
Strengthening the case for EV integration with building energy storage will require further empirical validation through longitudinal case studies and pilot projects.Researchers are calling for demonstration projects that couple real-time data collection with adaptive control algorithms—potentially leveraging AI-driven platforms—to better understand the dynamic interactions between EVs,building loads,and grid signals.Policy interventions,such as incentives for bi-directional chargers and supportive grid interconnection standards,will be critical to accelerating this integration.
3.3 Advanced HVAC systems and electrification
Heating and cooling dominate building energy use,and swapping gas furnaces and conventional air conditioners for electric heat pumps can cut consumption by moving heat rather than creating it.Since 2021,U.S.heat pump shipments have topped gas furnace sales;in 2024,manufacturers delivered 4.1 million units versus 3.1 million furnaces—a 32% lead [23].State mandates (e.g.,Maine’s 100,000 heat-pump target by 2025),the IRA’s up to$8000 rebate,and cold-climate pump improvements have driven rapid adoption.By 2024,over 135 municipalities and five states had adopted electric-HVAC codes,and New York requires all-electric small buildings by 2026 and larger ones by 2029 [24,25].
Beyond heat pumps,advanced HVAC systems boost efficiency through smarter controls and heat recovery.Variable-refrigerant-flow (VRF) systems offer zoned comfort with 15–30% higher performance,while AI-driven energy man agement and IoT sensors enable continuous commissioning—optimizing setpoints,forecasting loads,and detecting faults for 10–20% energy savings [26].Energy-recovery ventilators further reduce loads by exchanging heat between incoming and exhaust air.Large-scale pilots—such as Google’s 1.1 million ft2 geothermal-pile heat pump,cutting campus HVAC emissions by 50% [28],and New York City’s high-rise heatpump design competition[27]—prove that even the largest buildings can electrify.With continued heat-pump uptake and intelligent HVAC,onsite combustion—and its CO2 and air-pollution impacts—should vanish.
3.4 Net-zero energy and high-performance buildings
Net-zero energy buildings—which generate as much energy as they consume annually via high efficiency and on-site renewables—have expanded rapidly in North America between 2022 and 2025.The New Buildings Institute reports a tenfold increase in confirmed and planned net-zero projects since 2010,reaching roughly 700 by 2023,yet they still comprise under 1% of the total building stock.To mainstream this trend,Canada’s model building code now requires most new homes to be “net-zero ready” by 2030,and California mandates net-zero energy performance in all new residential construction [27,29].
Achieving net-zero begins with passive design strategies—airtight envelopes,high-performance insulation,and solar orientation—to minimize energy demand.Effi-cient technologies (LED lighting,Energy Star appliances,heat-pump HVAC,smart controls) then reduce loads further before on-site solar PV (often paired with battery storage or ground-source heat pumps) meets the remainder.In 2023,Canada certified 474 net-zero ready and 41 fully net-zero homes,bringing total program uptake to 1703 [3].
Large-scale net-zero demonstrations confirm the model’s viability: Ontario’s 96,000 ft2 Joyce Centre uses an all-electric design with solar panels and geothermal wells,and dozens of schools and community centers have achieved net-zero by 2025.Premium construction costs(0–10%) are typically recouped within ten years through energy savings.
The net-zero concept now encompasses embodied carbon and lifecycle emissions,as codified in Canada’s Zero Carbon Building Standard (2017,revised 2023),which mandates low-carbon materials and refrigerants.Coupled with smart building automation and grid-interactive controls,these innovations position net-zero and highperformance buildings at the nexus of finance,technology,and policy driving North America’s sustainable building transition.Table 2 highlights a few key metrics of building technology adoption in 2023–2024 that underscore these trends.
Table 2 Selected building energy technology adoption metrics.
4 Cross-sector impact analysis: Policy-driven financetechnology synergies
The clean energy transition in North America is increasingly driven by an integrated ecosystem that brings together policy,finance,and technology.Rather than acting as isolated forces,these domains interconnect and reinforce one another;thoughtful public policies reduce investment risks,innovative financial instruments makecapital accessible,and advanced technologies then translate that capital into efficient,scalable solutions.The following discussion summarizes this dynamic interplay and underscores its significance for the energy transition.
4.1 Policy as a foundational driver
Government policies play a critical role in establishing the framework for sustainable investments and technological breakthroughs.Landmark legislation such as the U.S.Inflation Reduction Act (IRA) and Canadian clean energy incentive programs have created robust fiscal environments by offering significant tax credits,rebates,and grants.For example,the IRA’s clean energy support—estimated at around $369 billion—has lowered the cost burden for renewable projects by extending the Pro duction Tax Credit (PTC) and Investment Tax Credit (ITC),and by including bonus provisions for domestic content and underserved communities.These measures not only send a strong market signal but also mitigate investment risks,thereby enhancing investor confidence and setting the stage for downstream financial innovation [30,31].
4.2 Finance: Mobilizing and scaling capital
The financial sector has responded to these policy signals with a marked increase in innovative financing tools such as green bonds and Power Purchase Agreements(PPAs).A supportive policy framework has driven the growth of the green bond market;for instance,North America’s cumulative green bond issuances have exceeded$450 billion over recent years,with global green bond issuance reaching approximately $575 billion in 2023.These instruments lower the effective cost of capital and provide long-term financing for projects like smart grid retrofits and energy-efficient building upgrades.Simultaneously,record-setting corporate PPAs,which reached over 28 GW in the United States in 2024,ensure long-term revenue streams that further de-risk investments.The integration of these financial instruments with policy measures creates a self-reinforcing loop where affordable capital underwrites large-scale renewable and efficiency projects[31,32].
4.3 Technology: Delivering measurable impact
The improved accessibility of capital has paved the way for substantial technological innovation in building energy systems.Technologies such as advanced metering infrastructure (AMI),grid-interactive efficient buildings(GEBs),energy storage systems,and high-performance HVAC have witnessed accelerated deployment as a direct consequence of enhanced financing conditions.For example,financing via green bonds has enabled widespread smart grid retrofits in commercial buildings—leading to energy consumption reductions in the range of 15–20%per building.Moreover,government incentives have spurred the coupling of distributed renewable generation(such as rooftop solar) with battery storage,which in turn supports technologies like vehicle-to-grid (V2G) solutions and real-time demand response.These technical enhancements not only improve energy efficiency but also bolster grid resilience and lower overall carbon emissions[31,33].In Fig.2,a visual representation of this synergy is presented.
Fig.2.Flow-chart showing the chain of policy,finance and technology synergy.
5 Case studies: Innovative finance models and technologies in action
To illustrate the above trends,this section presents brief case studies from the U.S.and Canada that demonstrate new financing approaches and cutting-edge building technologies in practice.
5.1 Case Study 1: Ottawa’s public–private retrofit financing model:A scalable approach to residential decarbonization
5.1.1 Context and climate targets
The City of Ottawa has set ambitious climate goals,requiring 98% of residential homes to undergo deep energy retrofits to achieve a 70% reduction in energy use by 2040.This transformation demands upgrades such as better insulation,electrified heating,solar panels,and smart energy systems.However,high upfront costs deter homeowners from investing in retrofits,despite long-term savings on energy bills and emissions reductions.To bridge this financial gap,Ottawa developed an innovative financing model that leverages policy support and private capital to make clean technology adoption more accessible [12].
5.1.2 Public–private financing approach
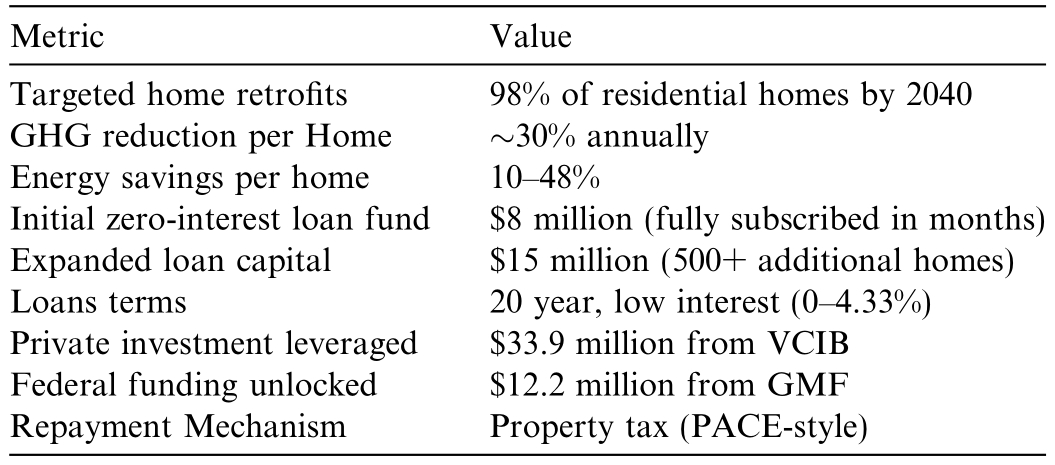
In 2021,Ottawa launched the Better Homes Ottawa Loan Program,a public–private financing initiative designed to accelerate home energy retrofits.The program secured $33.9 million in private loan capital from Vancity Community Investment Bank (VCIB),unlocking an additional $12.2 million in federal funding from the Green Municipal Fund (GMF).Ottawa utilized the local improvement charge (LIC) mechanism,allowing homeowners to repay loans via property tax bills,ensuring debt transfers to new owners upon home resale.This PACEstyle approach mitigates concerns about long-term investment returns,making 20-year,low-interest loans (ranging from $15,000 to $125,000) accessible for energy-efficient upgrades.
5.1.3 Technology and policy synergy
The financing model prioritizes high-impact technologies aligned with federal and provincial climate strategies.Eligible upgrades include insulation,efficient windows,heat pumps,solar PV panels,battery storage,EV chargers,and climate adaptation measures.Homeowners can stack municipal loans with federal grants (e.g.,Canada’s Greener Homes rebates) and utility incentives,reducing upfront costs.This integrated policy ap proach enables homeowners to adopt clean technologies that would otherwise be financially out of reach.For instance,a household can replace a gas furnace with a heat pump,install solar panels,and upgrade insulation—all with minimal upfront expense.
5.1.4 Results and market impact
Ottawa’s program demonstrates a powerful feedback loop between policy,finance,and technology.Each retrofitted home is expected to cut GHG emissions by 30%annually,with projected energy savings ranging from 10% to 48%.The program’s initial $8 million zerointerest pilot fund was fully subscribed within months,prompting an expansion with $15 million,an additional VCIB financing at 4.33% fixed interest.This success illustrates how federal grants,and municipal authority can de-risk private investment,unlocking demand for heat pumps,solar panels,and insulation while fostering green job growth.Ottawa also partnered with a local nonprofit to provide retrofit coaching,ensuring homeowners make informed technology choices.
5.1.5 Scalability and financial sustainability
By aligning regulatory tools,government funding,private capital,and clean energy technologies,Ottawa’s model offers a practical,scalable approach for municipalities to drive deep emissions cuts in the building sector.The self-replenishing loan program ensures long-term financial sustainability,as loan repayments via property taxes allow capital to revolve into new projects.This innovative financing structure provides a blueprint for other cities,demonstrating how public–private partnerships can accelerate residential decarbonization while ensuring economic viability (Table 3).
Table 3 Ottawa’s retrofit financing model– Key metrics.
5.1.6 Implementation barriers and scalability challenges in Ottawa’s retrofit financing program
Ottawa’s Better Homes Loan Program—developed to fund energy-efficient retrofits via a public–private partnership—faces several barriers that constrain its immediate impact and long-range scalability.A critical examination of these challenges illuminates both the operational constraints and the replicability potential in other jurisdictions.
5.1.6.1 Financial barriers. Limited capital availabil ity is a key barrier.The initial $8 million interest-free loan pool was swiftly exhausted,revealing a substantial funding gap.Subsequent rounds secured $4 million at 3.25% and an additional $15 million at 4.33%.However,these funds were raised during a period of rising interest rates in 2022,raising affordability concerns for residential clients with limited fiscal flexibility [34].The simultaneous availability of the federal Canada Greener Homes Loan—a zero-interest option—created direct competition.This situation compelled Ottawa to differentiate its financing through enhanced service delivery and local support,thereby increasing operational complexity and costs.Although the City leveraged its AAA credit rating and established a loan loss reserve to attract private capital,reliance on these mechanisms raises concerns about accumulating municipal debt.This additional burden on municipal balance sheets presents a significant barrier to scalability [35].
5.1.6.2 Regulatory and administrative barriers. Provincial regulations enabled the use of Property Assessed Clean Energy(PACE) financing,yet significant local administrative reforms were required.Streamlining the local improvement charge procedures and integrating loan collections into the property tax system demanded extensive interdepartmental coordination—a process that might prove challenging for municipalities with less integrated frameworks.The program’s effective impl ementation depended on the coordination of multiple city departments.Such integrated governance may be difficult to replicate in areas lacking similar management structures,potentially increasing administrative overhead and slowing implementation.
5.1.6.3 Technical and market barriers. Ded icated staffand specialized partnerships (e.g.,with EnviroCentre) proved essential in managing operations and educating homeowners.However,this approach may be difficult to scale in municipalities with more limited technical expertise or human resources.Coordination with concurrent federal incentives,such as the Greener Homes Loan (GHL),requir ed clear and continuous communication to prevent applicant confusion.Early program participation skewed toward higher-income households,revealing an inclusion gap that must be addressed to ensure equitable access.
The limited initial capital and volatility in interest rates have restricted the program’s market penetration.Such financial uncertainties have led to inconsistent homeowner uptake,potentially hindering long-term market transformation.
5.1.7 Impact on scalability
The cumulative effect of these barriers has been multifold:
 Restricted initial capital diminished the program’s early reach.
 Fluctuating interest rates reduced loan affordability,curbing homeowner participation.
 Competitive federal programs necessitated costintensive differentiation.
 Reliance on private capital and loan loss reserves increased municipal debt risks.
 Administrative streamlining,though beneficial,may not be easily replicated.
 Achieving equitable participation remains critical,requiring targeted outreach and fina ncial support for underserved communities.
5.1.8 Lessons learned from the Ottawa’s public–private retrofit financing model
Alignment with Strategic Partners: Early collaboration with financial institutions,such as Vancity Community Investment Bank,was pivotal in securing favorable financing terms and ensuring alignment between municipal objectives and lender requirements [36].
Effective Use of Credit Enhancements: Leveraging the City’s AAA credit rating and employing a loan loss reserve attracted $30 million in private capital,yet these stra tegies add to municipal debt.Exploring alternative financing,such as off-balance-sheet mechanisms,may help mitigate fiscal risks [35].
Thoughtful Program Design: Implementing loan caps(e.g.,10% of property value up to $125 K) and integrating retro fit coaching helped overcome informational barriers,improved equity,and enhanced program accessibility.
Building an Ecosystem for Market Transformation:Beyond loan issuance,the program stimulated contractor participation and fostered a local energy retrofit market.Disseminating these insights through networks like the Canadian Community Efficiency Financing Initiative is essential for replicating success across jurisdictions [37].
5.2 Case Study 2: Markham’s Power.House smart home pilot: A scalable model for residential clean energy integration
5.2.1 Context and climate targets
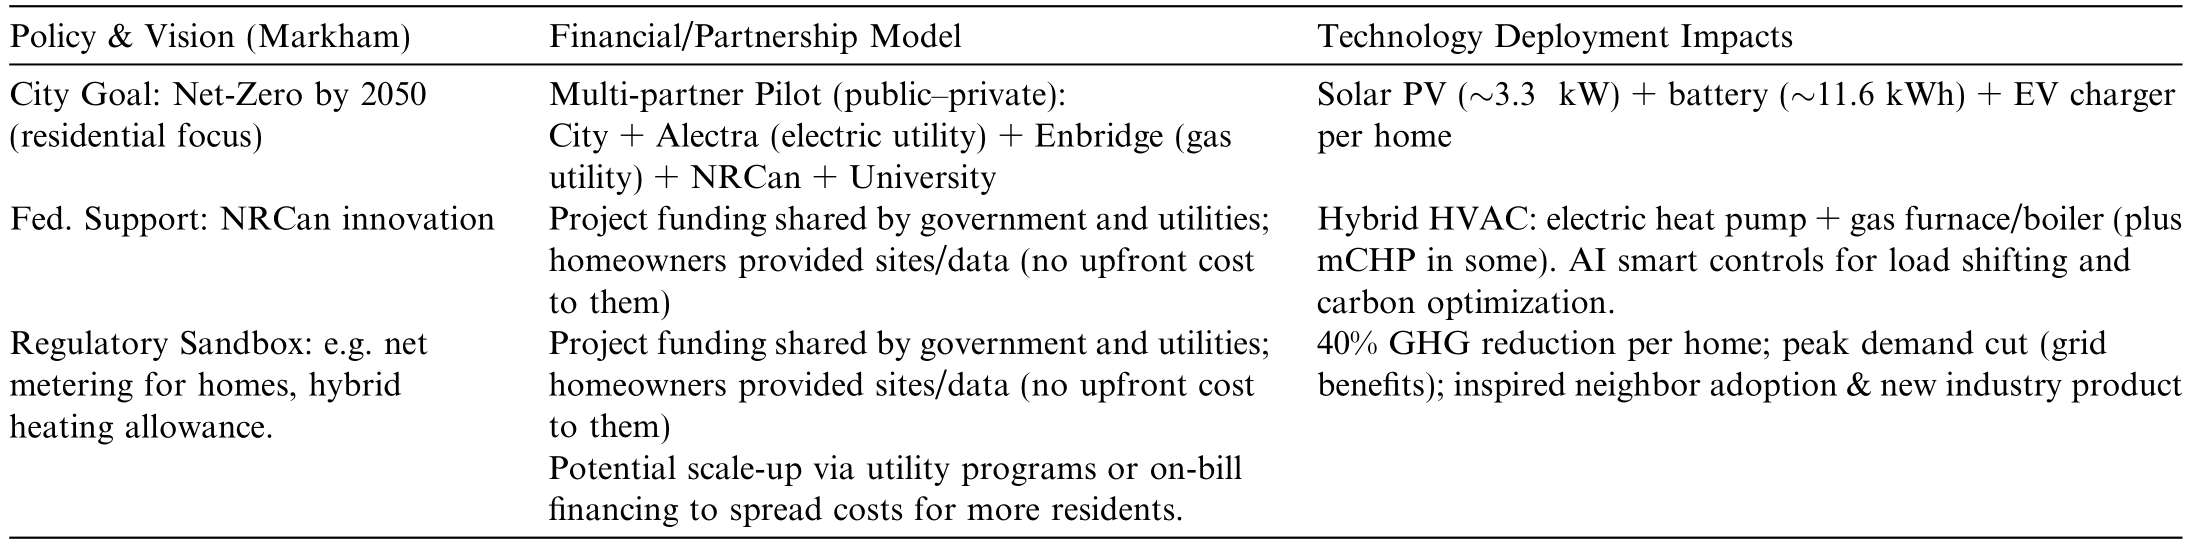
The City of Markham,Ontario,has committed to achieving net-zero emissions by 2050,with 40% of its emissions originating from the residential sector.Like many cold-climate cities,Markham faces the challenge of decarbonizing heating and electricity in thousands of suburban homes.By 2022,advancements in solar panels,home batteries,heat pumps,and electric vehicles presented an opportunity to integrate these technologies at the household level to reduce emissions and support the electric grid.However,individual homeowners lacked the resources to orchestrate these systems,necessitating a coordinated effort supported by policy,funding,and financial planning[38].
5.2.2 Pilot overview – Partnerships and funding
In 2022–2023,Markham launched the Power.House hybrid smart home pilot,retrofitting 10 homes with clean energy and smart control technologies.This public–private partnership involved the City of Markham,Alectra Utilities,Enbridge Gas,Toronto Metropolitan University,and Natural Resources Canada (NRCan) [39].NRCan provided partial funding,reducing financial burdens on local partners and homeowners.Utilities contributed expertise and capital,with Alec tra managing electrical integration and Enbridge supporting hybrid heating systems [40].The City convened stakeholders,co-funded the project,and aligned it with Markham’s Municipal Energy Plan (Getting to Zero).Homeowners received fully financed installations in exchange for data collection and technology adoption,ensuring a win–win model for GHG reductions and grid resilience.
5.2.3 Technology integration and innovation
Each pilot home was transformed into a smart energy house by integrating the following [38–40]:
 Solar PV arrays (
 3.3 kW capacity) and lithium-ion batteries (
 11.6 kWh storage).
 Level 2 EV charging stations for electric vehicles.
 Hybrid HVAC systems,combining air-source heat pumps with high-efficiency gas furnaces.
 Micro combined-heat-and-power (mCHP) units in four homes,generating heat and electricity from natural gas.
 AI-driven control systems,optimizing energy use based on real-time grid emissions data.
 Homes operated as virtual power plants,balancing solar,battery,and mCHP output to minimize grid draw and support local clean power generation.
5.2.4 Policy and regulatory interplay
The pilot required policy adaptation,particularly for solar energy exports and grid management.Markham collaborated with Ontario’s energy regulators to ensure compliance with net metering rules and explore future regulatory updates.Enbridge Gas leveraged the pilot to test hybrid heating as a decarbonization strategy,aligning with provincial GHG reduction goals.NRCan’s funding reinforced Canada’s Smart Grid Program,demo nstrating scalable pathways for emissions reductions in buildings.
5.2.5 Outcomes and synergies
The pilot achieved a 40% reduction in GHG emissions per home,demonstrating significant efficiency gains.Homeowners reported improved comfort levels,while smart controls optimized energy costs.The ability to shave peak demand and export surplus solar showcased how residential assets can support the grid,potentially deferring infrastructure upgrades.The pilot also informed utility rate design,suggesting rebates or on-bill credits for battery installations and demand response participation.
Beyond emissions,the pilot fostered community adoption,with neighbors installing solar panels and heat pumps after observing its success.Industry players,including HVAC and controls manufacturers,engaged with Alectra and Enbridge to develop new hybrid heating and smart home solutions.
5.2.6 Scalability and lessons learned
The pilot revealed challenges in integrating multiple technologies,requiring custom software and dedicated contractors.Regulatory hurdles around reverse power flow underscored the need for updated grid codes.However,homeowner engagement proved crucial,highlighting the importance of education and support for technology adoption.Markham’s Power.House hybrid pilot serves as a blueprint for net-zero neighborhoods,demonstrating that existing technologies,when strategically combined,can achieve deep emissions cuts today.Table 4 below summarizes how various elements interplayed in the Markham’s case [41].
Table 4 Summary of partnership delivered through policy,finance and technology integration.
5.2.7 Implementation barriers and scalability challenges in the Markham Power.House pilot
The Markham Power.House pilot,designed to demonstrate an integrated,low-carbon retrofit model for residential buildings,encountered significant challenges that constrain its scalability.A rigor ous evaluation of these barriers is essential for informing the expansion of such initiatives in other municipalities.
5.2.7.1 Technical barriers – Integration and interoperability. The integration of equipment from five distinct vendors was hindered by proprietary controls,resulting in suboptimal communication between devices.Custom control logic was developed to bridge these systems,ultimately achieving about 90% interoperability.However,the necessity for case-by-case engineering elevates both the cost and complexity of scaling the model [36].Also,managing a central controller to optimize solar PV,battery storage,and hybrid heating proved highly demanding.The challenges encountered suggest that future implementations may increasingly depend on AI-driven control systems tostreamline integration and support real-time decisionmaking.
5.2.7.2 Regulatory barriers – Grid interaction and approvals. The pilot’s reverse power flow—where surplus energy is exported to the grid—raised safety and reliability concerns.Ontario’s requirements for detailed impact assessments for installations exceeding 10 kW complicate the coordination of energy exports from multiple residences.Similar regulatory challenges have been noted in regions such as York Region and New Brunswick,where existing frameworks lag behind current technological capabilities[35].Operating the pilot in a demonstration mode underscored the need for revised grid codes and streamlined interc onnection procedures to support high penetration levels of distributed energy resources.
5.2.7.3 Financial barriers – High costs and economic viability.Upfront Investment posed a significant hurdle as retrofit costs ranged from CAD $50,000 to $100,000 per home,substantially exceeding typical homeowner budgets.Although a hybrid approach combining electric and gas technologies reduced costs slightly,the resulting payback period remained protracted under current energy price conditions.The absence of robust subsidies or regulatory mandates limits widespread adoption.Scaling the initiative will likely require significant cost reductions through enhanced incentive programs or regulatory mechanisms,such as carbon pricing and fuel-switching mandates,to transform the market economically [37].
5.2.7.4 Workforce and participant barriers. The installation of advanced energy systems demanded specialized contractors,as conventional HVAC and electrical personnel lacked the necessary expertise.This dependency highlights the importance of developing workforce training programs and certification initiatives to overcome labor bottlenecks.In addition,effective communication was critical to manage the inconvenience and learning curve associated with new technologies.While peer influence stimulated adoption among some homeowners,the overall success of the pilot was partly constrained by the challenges of ensuring sustained and inclusive homeowner engagement.
5.2.7.5 Impact on scalability. The cumula tive effect of technical,regulatory,financial,and workforce barriers indicate that broader deployment of the Markham Power.House model will require:
Standardization of Technology: Industry-wide open standards are necessary to reduce integration costs and improve device interoperability.
Regulatory Reforms: Updated grid codes and simplified impact assessments are critical to facilitate aggregated residential energy exports.
Enhanced Economic Incentives: Expanding government and utility incentive programs is essential to lower high upfront costs and drive market adoption.
Phased Adoption Strategies: A stepwise integration approach—starting with cost-effective measures such as heat pumps and solar installations,followed by the gradual incorporation of battery storage—may offer a more feasible pathway to scale.
5.2.7.6 Lessons learned. Multi-Stak eholder Collaboration:Robust partnerships among municipal authorities,utilities,federal funders,technology providers,and academic institutions were crucial.Such collaborations enable the pooling of expertise and resources,which is essential for overcoming both technical and regulatory challenges.
Importance of Open Standards: The need for custom engineering due to proprietary systems underscores the importance of advocating for open interoperability standards to reduce costs and complexity in future projects.
Workforce Development and Engagement: The reliance on specialized labor and effective homeowner communication highlights the necessity of workforce trai ning and targeted outreach to build broader acceptance and facilitate scaling.
Policy and Market Drivers: The long-term viability of technical innovations is contingent on supportive policy interventions,such as updated building codes,utility rate reforms,and carbon pricing.These drivers are essential to transition successful pilot projects into scalable,market-transformative solutions.
5.3 Additional examples
Beyond our case studies,recent North American pilots illustrate how finance and technology converge to accelerate decarbonization.Google’s 1.1 million ft2 Bay View campus (2022) operates all-electrically with North America’s largest geothermal heat-pump system and a 7 MW“dragon-scale” solar roof,targeting LEED Platinum and Living Building Challenge certification [26].In 2023,Camp Lejeune’s $22 million microgrid—combining a 5 MW PV array,10 MWh of battery storage,and backup generators under an Energy Savings Performance Contract—demonstrated military resilience and innovative PPP financing [11].Vermont’s Green Mountain Power rolled out a 2024 tariff that compensates customers for letting the utility dispatch their leased Tesla Powerwalls during peak periods,exemplifying how distributed storage can be monetized and grid services scaled [10].Collectively,these projects validate scalable models for resilient,carbon–neutral infrastructure across sectors.
6 Challenges to long-term viability and scalability
6.1 Risk assessment
Despite the remarkable progress,several uncertainties and risks could affect the long-term success and scalability of renewable energy finance and building energy techno logies in North America.A brief but rigorous assessment of key risk factors is provided below:
6.1.1 Political risks
Future political shifts in the U.S.and Canada could impact clean energy policies,particularly the IRA and ITCs.While outright repeal is unlikely,but partial rollbacks,budget cuts,or regulatory slowdowns could weaken incentives.A new U.S.administration in 2025 could reduce tax credits,cut agency budgets,or favor fossil fuel interests,affecting implementation.The current threat by the Trump Administration to cut Harvard research fund may limit resources for emerging technologies,hinder collaboration with industry leaders.This could have ripple effects on national clean energy goals,delaying breakthroughs in grid modernization,storage solutions,and green financing.In Canada,provincial resistance (e.g.,Ontario canceling green initiatives,Alberta opposing federal electricity rules) could slow renewable deployment and retrofits.Maintaining policy stability and bipartisan support is crucial to sustaining investor confidence and keeping financing costs low.
6.1.2 Regulatory and institutional risks
Permitting delays,grid interconnection hurdles,and outdated building codes could slow clean energy adoption.Utilities and regulators must update frameworks for distributed energy,demand response,and net metering to support home energy exports.Building codes must evolve to require higher efficiency and electric readiness,but overly aggressive mandates could burden builders and homeowners.Utility business models may resist decentralization,lobbying for high fixed charges that reduce economic benefits for prosumers.Without streamlined regulations,projects could bottleneck,jeopardizing 2030 climate targets.
6.1.3 Economic and market risks
Interest rate fluctuations,inflation,and supply chain constraints could increase clean energy project costs.Labor shortages in electricians,HVAC installers,and energy auditors may delay deployment.High demand for heat pumps,solar panels,and batteries could exceed manufacturing capacity,causing waitlists and price spikes.Additionally,stranded assets (e.g.,gas power plants,inefficient buildings) could impact utility balance sheets,leading to political backlash.The management of transition costs,trade policies,and investment risks is essential to ensuring long-term economic viability.
6.1.4 Technological and operational risks
The success of clean energy and building tech depends on scaling emerging technologies like advanced batteries,small modular reactors (SMRs),and carbon capture.Regarding implementation,the interoperability challenges could hinder adoption,requiring standardized communication protocols for seamless integration.With advanced technologies comes cybersecurity risks,a result of the increase in smart grids and connected energy systems,may become more prevalent if not mitigated.Without resilient infrastructure and improved automation,clean energy systems may face efficiency and reliability concerns.Ensuring robust cybersecurity,interoperability,and scalable solutions is vital for long-term sustainability.
6.1.5 Long-term behavioral and social risks
Consumer behavior and public acceptance are crucial for clean energy adoption,but negative experiences (e.g.,faulty retrofits or overstated savings) could slow uptake.With social community and fast information transfer,equity concerns may arise if low-income renters or fossil fuel workers feel excluded,potentially weakening political consensus.Politically,local opposition to infrastructure projects (e.g.,wind farms,transmission lines) could delay deployment,which will require strong community engagement.Hence,inclusive policy design,such as Ottawa’s 0%loans for low-income households,helps address adoption barriers.It is important to maintain trust,accessibility,and clear benefits for long-term success in the clean energy transition.
6.2 Applicability and risks of green bonds and PPAs under varying market conditions
Green bonds and PPAs have emerged as critical financing instruments for supporting renewable energy and energy efficiency projects.However,their effectiveness is not uniform across market conditions,and several risk factors may affect their long-term sustainability.
6.2.1 Market volatility and economic conditions
Green bonds,which finance environmentally beneficial projects,are sensitive to overall market volatility.In periods of economic uncertainty or rising interest rates,investor appetite for lower-yielding,long-duration bonds may diminish,leading to higher borrowing costs and potential liquidity constraints [42].Consequently,PPAs—which provide long-term revenue certainty by locking in energy prices—can become less attractive when electricity markets experience significant price fluctuations.Such volatility may challenge the financial models underpinning PPAs,particularly if the contracted prices no longer align with market realities.
6.2.2 Policy uncertainty and regulatory changes
Both instruments are heavily reliant on supportive policy frameworks.The long-term viability of green bonds often depends on clear definitions of “green” criteria and robust,transparent reporting standards.Policy shifts—such as changes in government or alterations to environmental regulations—can erode investor confidence and lead to increased perceived risks [43].For PPAs,uncertainty around future policy directions (e.g.,shifts in subsidy regimes or renewable portfolio standards) can undermine contract stability.This environment of policy uncertainty can thus alter the expected cash flows and risk profiles associated with these financial instruments.
6.2.3 Variations in regional and sectoral applicability
The applicability of these instruments also varies by region and sector.In mature markets with established regulatory and financial infrastructures,green bonds and PPAs have demonstrated greater scalability and investor confidence.In emerging markets,however,lessdeveloped capital markets,combined with higher political and regulatory risks,can limit their effectiveness.Moreover,sector-specific factors—such as the variability in renewable resource availability in different regions—can influence the economic viability of PPAs.Projects in regions with high renewable potential may offer a more robust and reliable basis for long-term contracts compared to areas with less consistent resource availability.
6.2.4 Long-term sustainability considerations
For green bonds,ensuring long-term sustainability requires not only rigorous standards and transparency to mitigate greenwashing risks (Baker McKenzie,2019) but also adaptive mechanisms that can account for evolving market dynamics.Similarly,the sustainability of PPAs depends on incorporating flexible terms that can respond to market fluctuations and regulatory changes.Incorporating periodic review clauses or market adjustment mechanisms within PPA contracts can enhance resilience,ensuring that these instruments remain viable even in dynamic economic landscapes.
7 Conclusion and future outlook
The convergence of robust policies and significant capital mobilization from 2022 to 2025 has driven unprecedented investments in clean energy and retrofit projects across North America,with the U.S.private sector and Canadian government leveraging billions in investments and tax credits to accelerate renewable capacity and energy efficiency.This investment surge is translating into sizable capacity gains—projected to double renewable electricity shares and retrofit millions of homes—while also targeting substantial emissions reductions of up to 40% by 2030.Concurrently,falling technology costs,such as those for solar,battery storage,and EV integration,coupled with supportive incentives,are expected to yield broad economic and environmental benefits by transforming energy markets and reducing household energy expenditures.
In conclusion,the recent experience in North America demonstrates how the clean energy transition can be accelerated by a combination of creative funding,efficient legislation,and technology improvements.Building energy technology is enabling cleaner,smarter,and more resilient structures,while renewable energy finance is developing with new tools and significant capital inflows.One could recall the years 2022–2025 as a turning point when ne tzero began to become the rule rather than the exception.In order to keep North America on track to fulfill its climate pledges and to take the lead globally in the implementation of sustainable energy solutions,it will be imperative to maintain and accelerate these trends through 2025 and beyond.
CRediT authorship contribution statement
Christian K. Ezealigo: Writing– review &editing,Methodology,Formal analysis,Conceptualization,Writing– original draft,Investigation,Data curation.Precious O. Ezealigo: Writing– original draft,Supervision,Methodology,Writing– review &editing,Visualization,Resources,Data curation.
Declaration of competing interest
The authors declare that they have no known competing financial interests or personal relationships that could have appeared to influence the work reported in this paper.
Acknowledgments
The Author thank Dr.Blessing Ezealigo for supervising,reviewing and pr oviding insights into the analytical aspect of this paper.
References
[1]International Energy Agency,Overview and Key Findings–World Energy Investment 2023– Analysis,IEA,2023.https://www.iea.org/reports/world-energy-investment-2023/overview-andkey-findings.
[2]REN21,Renewables in Energy Supply: Global Trends,Investment and Finance,2024.https://www.ren21.net/gsr2024/modules/energy_supply/01_global_trends/03_investment_and_finance/.
[3]Canada Infrastructure Bank,Annual Report 2022–2023,2023.https://cdn.cib-bic.ca/files/documents/reports/en/CIB-Annual-Report-2022-2023.pdf.
[4]American Clean Power Association,America Builds Power,2025.https://cleanpower.org/america-builds-power/.
[5]Torys LLP,Project finance trends: Public policy powering the green economy across Canada,2023.https://www.torys.com/en/our-latest-thinking/torys-quarterly/q4-2023/public-policypowering-the-green-economy-across-canada.
[6]P.Henry,M.North,What are Green Bonds and How Can They Help the Climate?,World Economic Forum,2024 https://www.weforum.org/stories/2024/11/what-are-green-bonds-climatechange/.
[7]Statista,North America: value of green bonds issued by country 2023,2023.https://www.statista.com/statistics/1289060/cumulative-value-of-green-bonds-issued-in-north-america/.
[8]BloombergNEF,Corporate clean power buying grew 12% to new record in 2023,2024.https://about.bnef.com/blog/corporate-cleanpower-buying-grew-12-to-new-record-in-2023-according-tobloombergnef/.
[9]BloombergNEF &Business Council for Sustainable Energy,2025.Sustainable energy in America factbook 2025,2025.https://about.bnef.com/blog/new-study-shows-american-sustainable-energytechnologies-are-ready-to-meet-increasing-energy-demand/.
[10]Worcester Business Journal,Ameresco to build $8M microgrid project in New Brunswick,2025.https://www.wbjournal.com/article/ameresco-to-build-8m-microgrid-project-in-new-brunswick.
[11]E.Wood,23 Intriguing Microgrid Projects to Watch in 2023,Microgrid Knowledge,2023.https://www.microgridknowledge.com/microgrids/article/21452302/microgridprojects-to-watch-in-2023.
[12]Green Municipal Fund– FCM,Case study: an innovative path toward net-zero homes (Ottawa),2023.https://greenmunicipalfund.ca/case-studies/innovative-path-netzero-homes-ottawa.
[13]Fasken,Canada’s clean energy investment tax credits: insights as of October 2024,2024.https://www.fasken.com/en/knowledge/2024/10/canadas-clean-energy-investment-tax-credits-insights-as-ofoctober-2024.
[14]Natural Resources Canada,Government of Canada launches the first clean economy investment tax credits,2024.https://www.canada.ca/en/natural-resources-canada/news/2024/06/government-of-canada-launches-the-first-clean-economyinvestment-tax-credits.html.
[15]J.S.Jones,Smart meters penetration surpasses 80% in North America,Smart Energy International,2024.https://www.smartenergy.com/industry-sectors/smart-meters/smart-meterpenetration-surpasses-80-in-north-america/.
[16]U.S.Energy Information Administration,How many smart meters are installed in the United States,and who has them?,2023.https://www.eia.gov/tools/faqs/faq.php?id=108&t=3.
[17]Federal Energy Regulatory Commission,Staff report: Demand response and advanced metering,2023.https://www.ferc.gov/sites/default/files/2023-12/2023%20Assessment%20of%20Demand%20Response%20and%20Advanced%20Metering.pdf.
[18]U.S.Department of Energy,Meet DOE’s newest research projects from BENEFIT 22–23,2023.https://www.energy.gov/eere/buildings/articles/meet-does-newest-research-projects-benefit-22-23.
[19]Wood Mackenzie,US energy storage market breaks installation record in Q4 2023,2024.https://www.woodmac.com/pressreleases/2024-press-releases/us-energy-storage-market-breaksinstallation-record-in-q4-2023/.
[20]K.Pickerel,US Energy Storage Market Has Record-breaking Q3,Solar Power World,2024.https://www.solarpowerworldonline.com/2024/12/us-energy-storagemarket-has-record-breaking-q3/.
[21]National Renewable Energy Laboratory,Integrating Electric Vehicle Charging Infrastructure into Commercial Buildings and Mixed-Use Communities: Design,Modeling,and Control Optimization Opportunities,2020.Retrieved from https://www.nrel.gov/docs/fy20osti/77438.pdf.
[22]U.S.Department of Energy,EAC Recommendations: Enhancing Grid Resilience with Integrated Storage from Electric Vehicles,Office of Electricity,2018.https://www.energy.gov/oe/articles/eac-recommendations-enhancing-grid-resilience-integratedstorage-electric-vehicles.
[23]RMI,Tracking the heat pump &water heater market in the United States,2024.https://rmi.org/insight/tracking-the-heat-pumpwater-heater-market-in-the-united-states/.
[24]E.Lopez,Affordable Heat,Efficient Grid,Building Decarbonization Coalition,2024.https://buildingdecarb.org/why-efficiency-matters.
[25]Urban Green Council,Decoding New York State’s all-electric new buildings law,2023.https://www.urbangreencouncil.org/decodingnew-york-states-all-electric-new-buildings-law/.
[26]A.Paul,Council Post: Digital,Energy-efficient Buildings—The Key for a Net-zero Future,Forbes,2024.https://www.forbes.com/councils/forbestechcouncil/2024/05/28/digitalenergy-efficient-buildings-the-key-for-a-net-zero-future/.
[27]New Buildings Institute,Zero energy,2025.https://newbuildings.org/hubs/zero-energy/.
[28]Google,Bay View and Charleston East–Google Real Estate,2022.https://realestate.withgoogle.com/bayview/.
[29]FacilitiesNet,The future of buildings is net-zero energy,2023.https://www.facilitiesnet.com/energyefficiency/article.aspx?id=19911.
[30]International Energy Agency,World Energy Investment 2023:Overview and Key Findings,International Energy Agency,2023.https://www.iea.org/reports/world-energy-investment-2023/overview-and-key-findings.
[31]Ocatsaros,New Study Shows American Sustainable Energy Technologies Are Ready to Meet Increasing Energy Demand,BloombergNEF,2025.Retrieved June 12,2025,from BloombergNEF website: https://about.bnef.com/insights/cleanenergy/new-study-shows-american-sustainable-energytechnologies-are-ready-to-meet-increasing-energy-demand/.
[32]L.Jia,Z.Li,Z.Hu,Applications of the internet of things in renewable power systems: a survey,Energies 17 (16) (2024) 4160,https://doi.org/10.3390/en17164160,Resonance Global.(n.d.).Resonance Global.Resonance Global.https://www.resonanceglobal.com/.
[33]J.Dean,P.Voss,D.Gagne,D.Vásquez,R.Langner,Blueprint for Integrating GridInteractive Efficient Building (GEB) Technologies into U.S.General Services Administration Performance Contracts,2021.Retrieved June 12,2025,from Nrel.gov website:https://docs.nrel.gov/docs/fy21osti/78190.pdf.
[34]M.Troy,N.Green,E.Adams,The fiscal impact of rising interest rates on municipal retrofit programs,J.Urban Econ.115 (2020)89–105.
[35]R.Smith,C.Lee,Municipal debt and risk management in green financing,Public Fin.Rev.47 (4) (2019) 650–673.
[36]P.Jones,D.Miller,The role of collaborative partnerships in scaling municipal energy efficiency programs,Energy Policy 150(2021) 112045.
[37]A.Brown,L.Johnson,S.Kumar,Developing sustainable retrofit financing models in urban environments,J.Sustain.Fin.Invest.10(2) (2020) 123–141.
[38]Marham,Power.House Hybrid,City of Markham,2025.Retrieved June 12,2025,from Markham.ca website: https://www.markham.ca/about-city-markham/sustainability/powerhouse-hybrid.
[39]Alectra,Building a sustainable future with a clean virtual power plant solution,2025.Retrieved from https://www.alectra.com/sites/default/files/assets/pdf/Alectra__PHhybrid_2020-07-15.pdf.
[40]Enbridge,Developing a lean,clean and green POWER.HOUSE,2021.Retrieved June 12,2025,from Enbridge.com website: https://www.enbridge.com/Stories/2021/October/Enbridge-Gas-and-partners-launch-residential-hybrid-energy-pilot-project-southern-Ontario.aspx.
[41]B.Marchand,Power.House Markham Pilot Project Provides Proof of Concept for Integration of Solar,EV Charging,and Battery Storage with Smart Controls– Electrical Industry News Week,2023.Retrieved from Electrical Industry Newsweek website:https://electricalindustry.ca/latest-articles/markham-powerhouspilot/.
[42]Baker McKenzie,Capital markets green bond challenges: critical challenges facing the green bond market,2019.Retrieved from https://www.bakermckenzie.com/-/media/files/insight/publications/2019/09/iflr–green-bonds-%28002%29.pdf.
[43]D.Ammerman,B.Friedman,ICMA Green Bond Principles Undergo Minor Facelift,McMillan LLP,2023.https://mcmillan.ca/uncategorized/icma-green-bond-principles-undergo-minorfacelift/.
Received 4 April 2025;revised 13 June 2025;accepted 1 July 2025
* Corresponding author.
E-mail address: christianezealigo@gmail.com (C.K.Ezealigo).
https://doi.org/10.1016/j.gloei.2025.07.003
2096-5117/© 2025 Global Energy Interconnection Group Co.Ltd.Publishing services by Elsevier B.V.on behalf of KeAi Communications Co.Ltd.This is an open access article under the CC BY-NC-ND license(http://creativecommons.org/licenses/by-nc-nd/4.0/).

Christian K. Ezealigo received B.Sc degree in Financial Accounting at University of Nigeria,Enugu Campus,2018 and M.Sc in Management Data Analytics at Duke University,Durham,USA.He is working towards MBA degree at Duke University,Fuqua Business School.His research interests includes Energy,Finance and Capital Market.