0 Introduction
The introduction of China’s dual-carbon goal has prompted the integration of a substantial share of renewable energy sources such as wind and solar energy into the power grid.Consequently, the inadequacy of the peak load regulation capacity becomes more apparent.Traditional thermal power units suffer from poor regulation sensitivity, sluggish scheduling, and substantial pollution during peak load regulation.Similarly, hydropower units encounter challenges related to their geographical and seasonal characteristics regarding peak load regulations [1,2].Following the extensive incorporation of new energy sources, the ability of power grids to regulate peak loads has encountered significant challenges.EVs are a novel form of load with controllability,bidirectionality,and flexibility[3].Projections from pertinent research indicate that the number of EVs in China is expected to reach 30 million by 2030 and escalate to 80 million by 2050.The substantial presence of EVs and their advantageous capacity for rapid battery charging and discharging have emerged as valuable resources for mitigating strain in power grid peak load regulation [4].
Numerous studies have directly employed EVs in regulations to address the peaking problem.For instance, a control strategy rooted in adaptive dynamic programming was proposed in [5], which incorporated a substantial number of EVs through an aggregator for active involvement in ancillary services for the grid.While achieving satisfactory peaking effect, this approach neglects economic considerations by ignoring the charging and discharging costs of EVs.A random management control algorithm for EV charging in a stochastic environment was proposed in [6], which considers charging costs; however, the peaking effect was not prominent.It is evident that these studies inadequately considered operational characteristics, such as EV charging and discharging costs and battery costs,leading to indistinguishable peaking effects and high adjustment costs for EVs.In response,certain studies have built optimization scheduling models for EV participation during peaking,considering various operational characteristics of EVs,and have investigated methods to solve these models.For the optimization objective construction process, a model with user charging and discharging costs as the objective function has been established [7]; however,it does not consider the bidirectional scheduling ability of EVs.A peak-shaving model with the minimization of battery aging costs was constructed in [8], with charging and grid loss costs as objectives, thoroughly considering the cost issues associated with EVs.However, the peakshaving effect was not significant.
In terms of the solution process, a three-layer energy management model for the large-scale integration of multiple microgrids was constructed [9].It employs an information-based polyhedron indeterminacy set solution for an EV participation peak-shaving scheduling model based on an enhanced self-organizing feature-mapping artificial neural network.Nevertheless, the simulation results indicated a low optimization accuracy.The participation of electric vehicles in peaking is considered a multiobjective,multi-parameter,and constraint problem,which was proposed in[10]and solved using the Lagrange multiplier theory.However, the model is complex and the solution speed is slow, leading to prolonged computation times.Overall, existing heuristic algorithms that are effective in solving scheduling models suffer from drawbacks such as slow optimization speed and low precision.The golden eagle optimizer(GEO)algorithm,a novel heuristic optimization algorithm, was proposed in [11], which can effectively solve global optimization problems.However,in cases of insufficient population diversity,the GEO algorithm is still prone to falling into local optima,resulting in low accuracy of the optimization results and an inability to accurately solve EV participation in power grid peakshaving optimization scheduling instructions.Therefore,it is necessary to improve GEO algorithms.The Bernoulli chaotic mapping theory can improve the diversity of the initial population of the algorithm and balance global exploration and local development.Therefore, this paper proposes an improved GEO algorithm based on Bernoulli chaotic mapping theory, which ensures strong real-time data processing ability in peak-shaving scenarios, accelerates algorithm optimization speed, improves algorithm optimization accuracy, and avoids problems such as poor initial population diversity and weak global search ability in the initial iteration stage.
To mitigate the degradation of the operational lifespan of an EV, a distributed two-stage scheduling strategy that considers the battery degradation of the user was proposed[12].This approach reduces the frequency of charging and discharging cycles during scheduling; however, the extent of lifespan reduction is limited.The Long Short-Term Memory (LSTM) method has been used in [13] to orchestrate ordered charging and discharging schedules for EVs,accounting for battery degradation costs at different discharge depLSTMths.However, this scheduling scheme has high computational complexity and requires an extended execution time.Though these studies address EV operational lifespan degradation,the reduction in lifespan degradation is limited, and there is an issue of poor state of charge (SOC) balance for EVs after participating in scheduling.The SOC equilibrium after EV dispatching determines its controllable latent capacity,which has been proposed in[14],emphasizing the importance of maintaining a fine, favorable SOC balance during EV operation to enhance the controllable capacity in future periods.
Based on the above research, this study is based on the perspective of the power grid and EV aggregators, committed to achieving good results of EV participation in power grid peak shaving and obtaining EV operating benefits,and proposes an improved golden eagle optimization algorithm for electric vehicle grouping control strategy in peak shaving scenarios.The main contributions of this study are as follows:
1) Considering the difference between peak and valley loads and the operating costs of EVs, an optimized scheduling model for EV participation in system peak shaving was established to effectively reduce the difference between peak and valley loads and the cost of regulating EV operating life losses.
2) We have designed an improved golden eagle optimizer(IGEO)algorithm,which utilizes the Bernoulli chaotic mapping initialization method to increase the diversity of the initial population, enhance the balance between global exploration and local development, accelerate the optimization speed, and improve the optimization accuracy of the algorithm.
3) A dual-layer power allocation method for EVs based on the k-means algorithm for dynamic grouping is proposed.Using the k-means algorithm, the EVs are dynamically divided into three groups: priority charging, backup, and priority discharge.A duallayer power allocation scheme is designed for EVs.The results indicate that the control strategy proposed in this study effectively reduces the peak-valley difference in the power grid, reduces the operational life loss of EVs, and improves the SOC balance of EVs.
1 Control framework implementation
To reduce the peak-to-valley load difference rate while reducing the operational life loss of EVs and improving their SOC balance, the IGEO algorithm for EV grouping control under peaking scenarios is illustrated in Fig.1.The specific implementation process is as follows.
1) Optimization of signals for EVs participating in grid peaking.First, considering both the peak-to-valley load difference and EV operational attrition,an optimization scheduling model is established for EV participation in the peaking system, with constraints on the maximum charging/discharging power, capacity,and quantity of EVs.Second, to address the limitations of the original GEO in terms of global optimization and local exploration capabilities, the GEO algorithm was improved to create the IGEO.This enhancement results in an improved optimization speed and accuracy.The IGEO algorithm was then utilized to solve the EV peaking model, obtaining the charging and discharging power signals for EVs.
2) Dynamic grouping and power distribution for EVs.First, using the k-means algorithm and SOC, the EVs were categorized into three groups: priority charge group(PCG),reserve group(RG),and priority discharge group (PDG).Second, based on the charging and discharging power signals for each moment, the charging and discharging sequences for the three EV groups were confirmed along with the power distribution scheme, achieving the toplayer power distribution.Next, considering either the maximum charging/discharging power or the SOC balance principle,charging and discharging signals were issued to each EV, accomplishing a lower stratum power distribution.Finally, the EVs acted on the provided charging and discharging directives.
2 Improved golden eagle optimization algorithm for EV peaking and grid connection signal acquisition
2.1 Dispatching pattern for EV participating in peaking
2.1.1 Objective function construction
To control the disordered EVs to reduce the peak valley load difference of the power grid while considering the impact of time of use, electricity prices, and carbon benefits [15], this study designs an original objective function for the EV pitch in the grid peaking strategy.The objective function comprises two main components: the grid load peak-to-valley difference and EV operational cost.
1) Peak-shaving effect
The main purpose of aggregators regulating their subordinate EVs and participating in grid peak shaving is to reduce the peak-valley difference of the load curve, while also ensuring the benefits of aggregators regulating their behavior.Therefore,this study sets the objective functions from two perspectives.The first objective function was the peak-valley difference.The smaller the peak valley difference, the smoother the load curve.The objective function constructed using the minimum load peak valley difference is as follows:

where f1 is the grid load peak-to-valley D-value, Pev(t) is the power signal for the charging or discharging of EVs(positive for charging and negative for discharging)at time t, and Pload(t) is the grid load power at the time t.
2) Operating costs
In addition, it is necessary to consider the operating costs of aggregators participating in the regulations.In this study, the operating costs of the aggregators included the charging costs, discharge benefits, and benefits obtained from selling carbon quotas.The objective function constructed with the lowest operating cost was

where f2 is the total operating cost of the EV, Cev(t) the sum of the EV charging and discharging costs, Closs(t)the cost of the EV battery life loss, and Ccev(t) the total revenue from the sale of carbon quotas by EVs.
The sum of EV charging and discharging costs Cev(t)is:

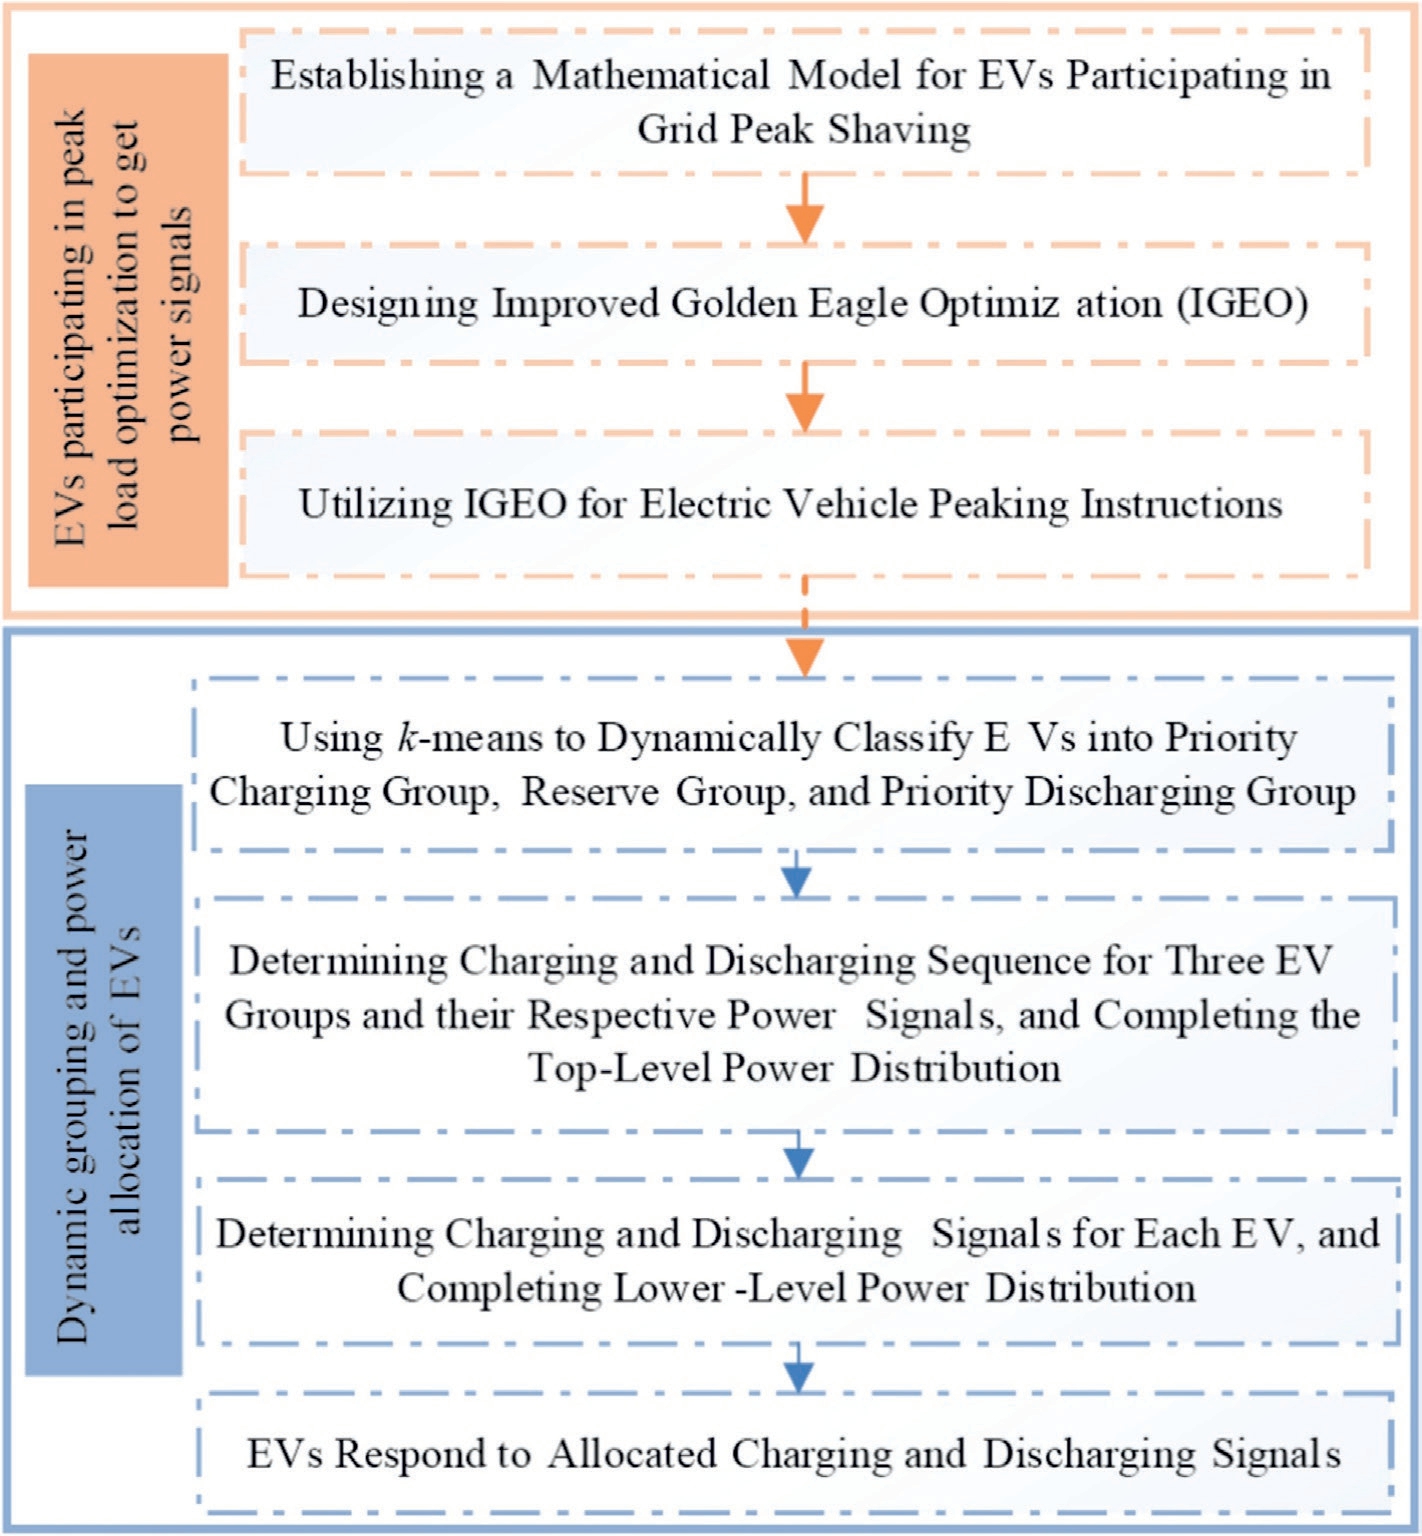
Fig.1.Dynamic Group Control Process for EVs.
where cc(t) is the time of use electricity price at time t for grid charging, and cd(t) is the compensation electricity price at time t for grid discharge, obtained based on the time of use electricity price.
The cost of EV battery life loss Closs(t) is:

where closs is the coefficient of battery lifetime degradation cost for EVs participating in peaking, set at 0.42 yuan/(kW·h).
The total revenue from the sale of carbon quotas by EVs Ccev(t) is:

where Mev(t) is the carbon emissions of a fuel powered vehicle that can travel the same distance as an EV at Δt,expressed in kilograms; qev is the price at which carbon quotas are sold, with a value of 0.299 yuan/kg; Δt is the interval time period, with a value of 1; Lev is the distance that an EV can travel per unit of electricity, typically 5 km per 1 kWh; Egas is the carbon emissions of a fuel powered vehicle when driving 1 km, with a value of 0.197 kg.
When solving nonlinear programming problems with multi-objective functions, it is often difficult to achieve the optimal solution simultaneously, owing to conflicts between various sub-objectives.Therefore,by determining the optimal compromise solution, the various subobjectives are balanced as much as possible, making them the closest to the ideal solution.To achieve this,it is often necessary to convert multi-objective functions into singleobjective functions.However, owing to the different dimensions of the different objective functions, it can be difficult to perform these operations directly.Therefore,it is necessary to normalize the objective function to eliminate dimensional differences.
3) Optimization value function
Linear weighting was performed on the objective functions f1 and f2.When using linear weighting, weight coefficients must be introduced to represent the relative importance of each objective function.The simplified objective function can be expressed as

where f is the objective function processed by linear weighting method;f1max is the maximum value of the load peak valley difference;f2max is the maximum operating cost of an EV; ω1 and ω2 are the proportions of the objective function, also known as weight coefficients, each with value of 0.5.
2.1.1 Objective function construction
To control the disordered EVs to reduce the peak valley load difference of the power grid while considering the impact of time of use, electricity prices, and carbon benefits [15], this study designs an original objective function for the EV pitch in the grid peaking strategy.The objective function comprises two main components: the grid load peak-to-valley difference and EV operational cost.
1) Peak-shaving effect
The main purpose of aggregators regulating their subordinate EVs and participating in grid peak shaving is to reduce the peak-valley difference of the load curve, while also ensuring the benefits of aggregators regulating their behavior.Therefore,this study sets the objective functions from two perspectives.The first objective function was the peak-valley difference.The smaller the peak valley difference, the smoother the load curve.The objective function constructed using the minimum load peak valley difference is as follows:
where f1 is the grid load peak-to-valley D-value, Pev(t) is the power signal for the charging or discharging of EVs(positive for charging and negative for discharging)at time t, and Pload(t) is the grid load power at the time t.
2) Operating costs
In addition, it is necessary to consider the operating costs of aggregators participating in the regulations.In this study, the operating costs of the aggregators included the charging costs, discharge benefits, and benefits obtained from selling carbon quotas.The objective function constructed with the lowest operating cost was

where f2 is the total operating cost of the EV, Cev(t) the sum of the EV charging and discharging costs, Closs(t)the cost of the EV battery life loss, and Ccev(t) the total revenue from the sale of carbon quotas by EVs.
The sum of EV charging and discharging costs Cev(t)is:


Fig.1.Dynamic Group Control Process for EVs.
where cc(t) is the time of use electricity price at time t for grid charging, and cd(t) is the compensation electricity price at time t for grid discharge, obtained based on the time of use electricity price.
The cost of EV battery life loss Closs(t) is:
where closs is the coefficient of battery lifetime degradation cost for EVs participating in peaking, set at 0.42 yuan/(kW·h).
The total revenue from the sale of carbon quotas by EVs Ccev(t) is:
where Mev(t) is the carbon emissions of a fuel powered vehicle that can travel the same distance as an EV at Δt,expressed in kilograms; qev is the price at which carbon quotas are sold, with a value of 0.299 yuan/kg; Δt is the interval time period, with a value of 1; Lev is the distance that an EV can travel per unit of electricity, typically 5 km per 1 kWh; Egas is the carbon emissions of a fuel powered vehicle when driving 1 km, with a value of 0.197 kg.
When solving nonlinear programming problems with multi-objective functions, it is often difficult to achieve the optimal solution simultaneously, owing to conflicts between various sub-objectives.Therefore,by determining the optimal compromise solution, the various subobjectives are balanced as much as possible, making them the closest to the ideal solution.To achieve this,it is often necessary to convert multi-objective functions into singleobjective functions.However, owing to the different dimensions of the different objective functions, it can be difficult to perform these operations directly.Therefore,it is necessary to normalize the objective function to eliminate dimensional differences.
3) Optimization value function
Linear weighting was performed on the objective functions f1 and f2.When using linear weighting, weight coefficients must be introduced to represent the relative importance of each objective function.The simplified objective function can be expressed as
where f is the objective function processed by linear weighting method;f1max is the maximum value of the load peak valley difference;f2max is the maximum operating cost of an EV; ω1 and ω2 are the proportions of the objective function, also known as weight coefficients, each with value of 0.5.
2.2 Constraint conditions
1) Constraints on EV Charging and Discharging Power

where N(t) is the general number of EVs at time t and PN is the rated charging and discharging power of the EVs.
2) Limitations on SOC in EVs

where SOC(t)denotes the SOC of the EV battery at time t.When the SOC of a battery ranges from 20 to 80 %, the voltage changes relatively smoothly and slowly and remains unchanged [16].Therefore, for the precise control of EV, SOCmin, and SOCmax are the minimum and maximum SOC of EV, respectively, with values of 0.2 and 0.8,respectively.
3) Constraints on the Charging and Discharging Quantity of EVs

where nc(t) and nd(t) are the charging and discharging quantities of the EVs at the time t, respectively; N(t) is the general number of EVs available for scheduling at time t.
1) Constraints on EV Charging and Discharging Power
where N(t) is the general number of EVs at time t and PN is the rated charging and discharging power of the EVs.
2) Limitations on SOC in EVs
where SOC(t)denotes the SOC of the EV battery at time t.When the SOC of a battery ranges from 20 to 80 %, the voltage changes relatively smoothly and slowly and remains unchanged [16].Therefore, for the precise control of EV, SOCmin, and SOCmax are the minimum and maximum SOC of EV, respectively, with values of 0.2 and 0.8,respectively.
3) Constraints on the Charging and Discharging Quantity of EVs

where nc(t) and nd(t) are the charging and discharging quantities of the EVs at the time t, respectively; N(t) is the general number of EVs available for scheduling at time t.
2.3 Improved golden eagle optimization
2.3.1 Basic principle of golden eagle optimization
GEO, introduced by Abdolkarim et al.in 2020, simulates the foraging behavior of golden eagles [15].Given its fast convergence speed and strong optimization capability, GEO are currently widely applied in scenarios such as microgrid optimization scheduling[17],load forecasting[18],and power inspection[19].A GEO operates based on the following fundamental principle:
1) Establish the initial size of the population
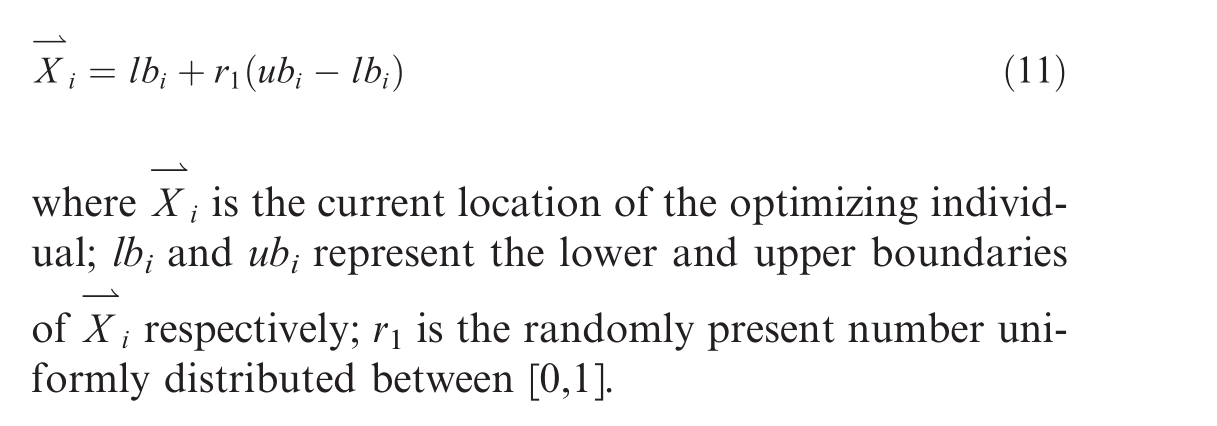
2) Determine the attack coefficient Pa and the cruising coefficient Pc
3) Execute attack and cruising behaviors
The golden eagle must perform either an attack or cruise on its prey during each iteration.The attack behavior can be simulated using vectors,and the computing formula is as follows:
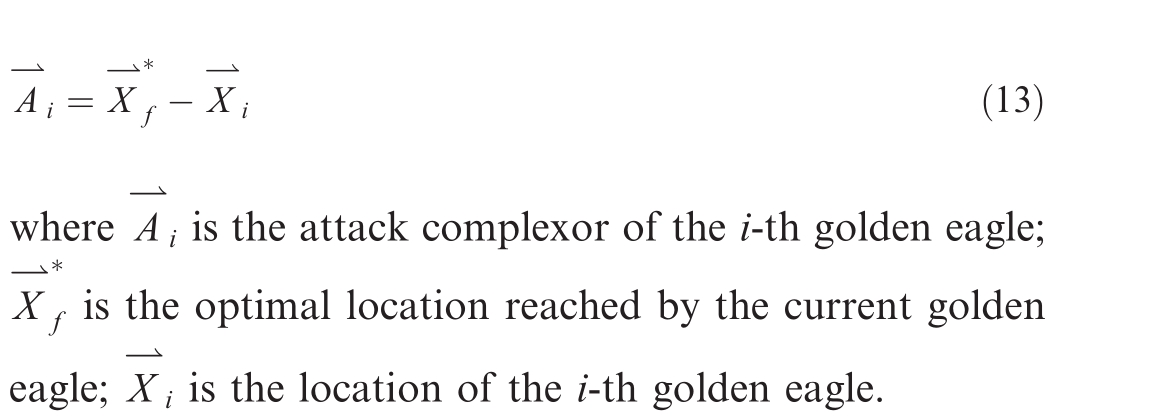
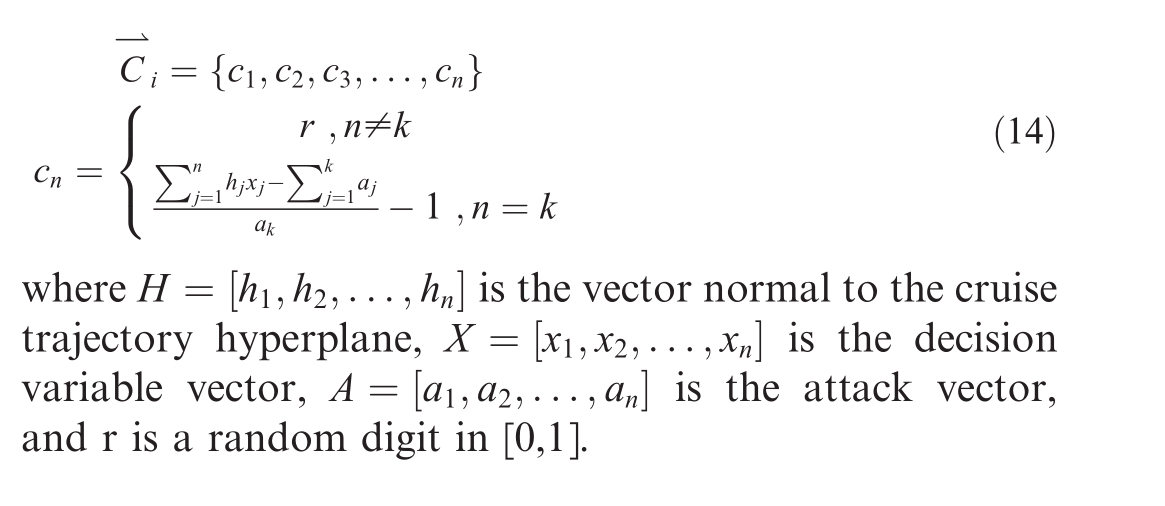
The cruise behavior can be described in terms of a cruising vector, which is counted based on the attack complexor.The equation for counting cruising vectors is as follows:
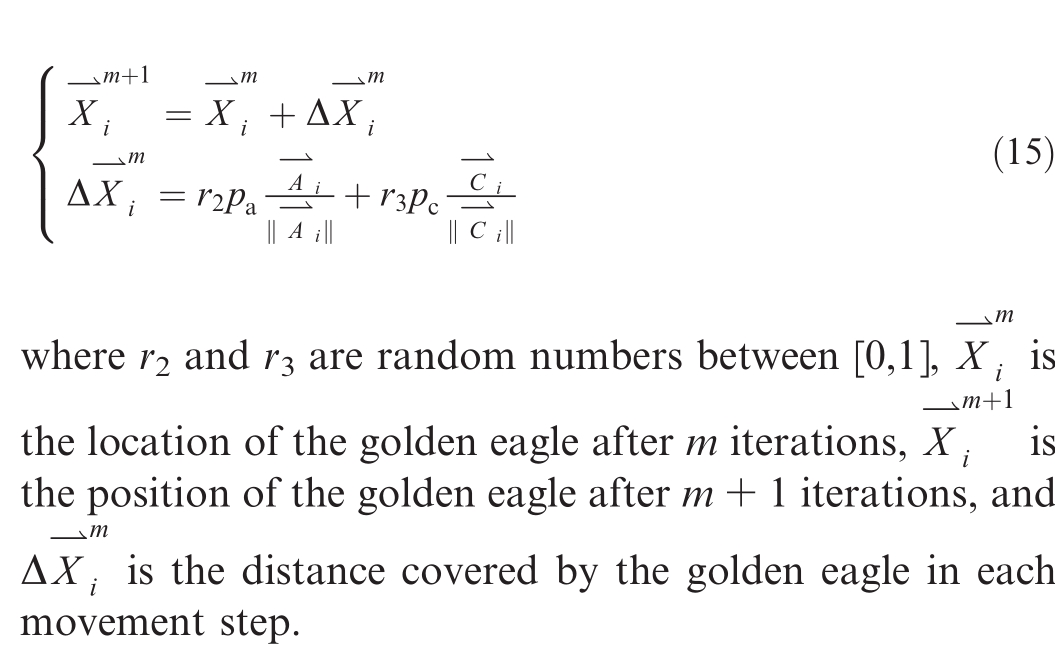
4) Position Update
2.3.2 Improvement of the golden eagle optimization
Leveraging the characteristics of chaotic sequences that exhibit regularity, randomness, and other features can enable algorithms to escape local optima and enhance their global optimization capabilities.Compared with the original principles governing the initialization of populations in the GEO, the integration of chaos into the initial population of the golden eagle herd yields enhanced multiplicity [20].In this regard, this study utilizes Bernoulli chaos theory [21] to map the optimization of the GEO algorithm’s initial population.The Bernoulli chaosmapping equation is as follows:

where λ is set to 0.5.
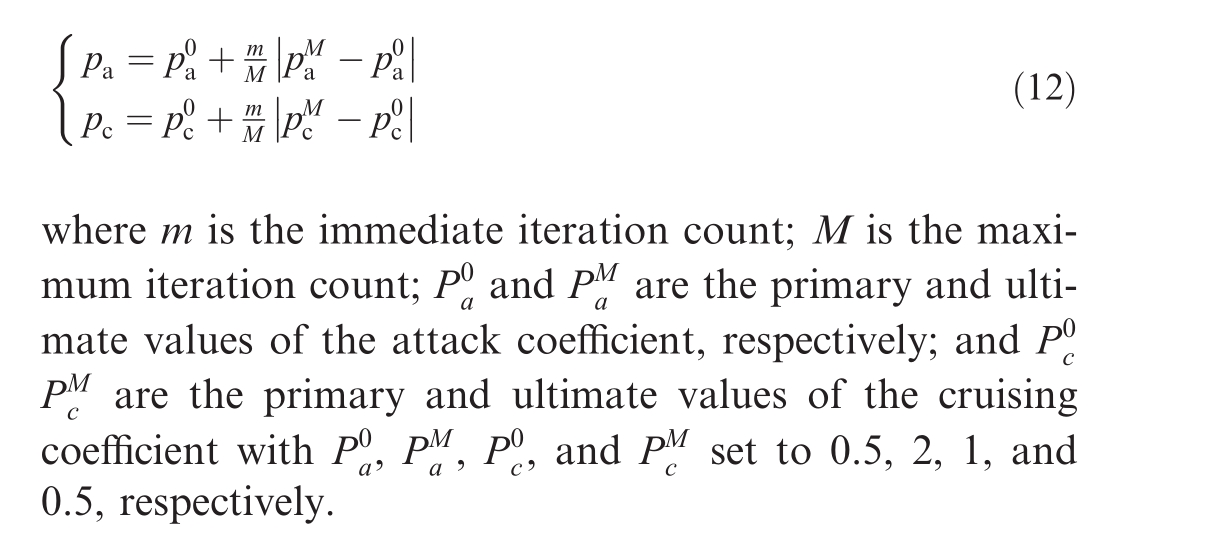
Further, attack and cruise parameters are crucial factors that influence the optimization accuracy and pace of the golden eagle population.In the original GEO, both the attack and cruise parameters exhibit linear increments or decrements, which can lead to a weak global search capability in early iterations and a reduced ability of optimized individuals to escape local optima in later iterations.In response to this,the present study introduced improved attack and cruise coefficients as follows:

where m represents the number of iterations in the golden eagle optimization algorithm;a1,a2,and a3 are parameters with values of -0.2, 50, and 0.94, respectively.
It can be observed that, the proposed IGEO addresses the shortcomings of the original GEO algorithm, such as susceptibility to local optima, poor diversity in the initial population, and weak overall techmeme in the initial iterations.The utilization of the Bernoulli chaos mapping initialization method enhances the diversity of the initial population, whereas improvements in the attack and
cruise coefficients enhance the ability of the algorithm to balance global exploration and local exploitation.
2.3.1 Basic principle of golden eagle optimization
GEO, introduced by Abdolkarim et al.in 2020, simulates the foraging behavior of golden eagles [15].Given its fast convergence speed and strong optimization capability, GEO are currently widely applied in scenarios such as microgrid optimization scheduling[17],load forecasting[18],and power inspection[19].A GEO operates based on the following fundamental principle:
1) Establish the initial size of the population

2) Determine the attack coefficient Pa and the cruising coefficient Pc

3) Execute attack and cruising behaviors
The golden eagle must perform either an attack or cruise on its prey during each iteration.The attack behavior can be simulated using vectors,and the computing formula is as follows:

The cruise behavior can be described in terms of a cruising vector, which is counted based on the attack complexor.The equation for counting cruising vectors is as follows:

4) Position Update

2.3.2 Improvement of the golden eagle optimization
Leveraging the characteristics of chaotic sequences that exhibit regularity, randomness, and other features can enable algorithms to escape local optima and enhance their global optimization capabilities.Compared with the original principles governing the initialization of populations in the GEO, the integration of chaos into the initial population of the golden eagle herd yields enhanced multiplicity [20].In this regard, this study utilizes Bernoulli chaos theory [21] to map the optimization of the GEO algorithm’s initial population.The Bernoulli chaosmapping equation is as follows:

where λ is set to 0.5.
Further, attack and cruise parameters are crucial factors that influence the optimization accuracy and pace of the golden eagle population.In the original GEO, both the attack and cruise parameters exhibit linear increments or decrements, which can lead to a weak global search capability in early iterations and a reduced ability of optimized individuals to escape local optima in later iterations.In response to this,the present study introduced improved attack and cruise coefficients as follows:

where m represents the number of iterations in the golden eagle optimization algorithm;a1,a2,and a3 are parameters with values of -0.2, 50, and 0.94, respectively.
It can be observed that, the proposed IGEO addresses the shortcomings of the original GEO algorithm, such as susceptibility to local optima, poor diversity in the initial population, and weak overall techmeme in the initial iterations.The utilization of the Bernoulli chaos mapping initialization method enhances the diversity of the initial population, whereas improvements in the attack and
cruise coefficients enhance the ability of the algorithm to balance global exploration and local exploitation.
2.4 Constructing an optimal value function
To enable an efficient solution of constrained optimization problems using the IGEO algorithm,this study incorporates constraint conditions into the optimization value function based on the penalty function theory [21].The resulting new IGEO optimization value function is formulated as follows:

where F is the optimization value function of IGEO;θ1,θ2,and θ3 are penalty coefficients for function boundary violations,all set to 108;g1,g2,and g3 are flags indicating the constraint violations for the EV charging/discharging power,EV battery volume,and number of EV charge/discharge cycles, respectively.They have the value of 1 when there is a violation and 0 when there is no violation.
To enable an efficient solution of constrained optimization problems using the IGEO algorithm,this study incorporates constraint conditions into the optimization value function based on the penalty function theory [21].The resulting new IGEO optimization value function is formulated as follows:
where F is the optimization value function of IGEO;θ1,θ2,and θ3 are penalty coefficients for function boundary violations,all set to 108;g1,g2,and g3 are flags indicating the constraint violations for the EV charging/discharging power,EV battery volume,and number of EV charge/discharge cycles, respectively.They have the value of 1 when there is a violation and 0 when there is no violation.
3 Dynamic grouping-based double-layer power distribution method for EVs using the k-means algorithm
When responding to charging and discharging directives, the current research commonly adopts methods that involve average allocation,ignoring the temporal randomness of the number of EVs at different times[22].To effectively reduce peak load differences, minimize operational wear and tear on EVs, and ensure a more balanced SOC for EVs, this study proposes a double-layer power distribution method for EVs utilizing the k-means algorithm for dynamic grouping, which forms the foundation of the approach.
When responding to charging and discharging directives, the current research commonly adopts methods that involve average allocation,ignoring the temporal randomness of the number of EVs at different times[22].To effectively reduce peak load differences, minimize operational wear and tear on EVs, and ensure a more balanced SOC for EVs, this study proposes a double-layer power distribution method for EVs utilizing the k-means algorithm for dynamic grouping, which forms the foundation of the approach.
3.1 Dynamic grouping of EVs based on the k-means algorithm
The k-means algorithm groups data points by measuring their distances in a Euclidean space.The assessment of the similitude between different cluster entities is measured by the Euclidean distance,which is inversely proportional to the relationship between similarity and distance[23].In theory, EVs with a lower SOC should be prioritized for charging, whereas those with a higher SOC should be prioritized for discharging, ensuring that the maximum charging and discharging power and capacity are maintained for the next time step.However, the number of EVs connected to the grid and the SOC status changed at each time step.Therefore,this study employs the kmeans algorithm to categorize EVs into three groups based on SOC.By sorting the three groups from small to large according to the computed centroids, it designates them as PCG, RG, and PDG.
The k-means algorithm groups data points by measuring their distances in a Euclidean space.The assessment of the similitude between different cluster entities is measured by the Euclidean distance,which is inversely proportional to the relationship between similarity and distance[23].In theory, EVs with a lower SOC should be prioritized for charging, whereas those with a higher SOC should be prioritized for discharging, ensuring that the maximum charging and discharging power and capacity are maintained for the next time step.However, the number of EVs connected to the grid and the SOC status changed at each time step.Therefore,this study employs the kmeans algorithm to categorize EVs into three groups based on SOC.By sorting the three groups from small to large according to the computed centroids, it designates them as PCG, RG, and PDG.
3.2 Top layer power distribution for EVs
In cases where PEV >0, the response sequence for the three EV groups follows the order of PCG →RG →PDG.This sequence continued until the charging power aligned with the current regulation signal or reached the maximum charging power of the EV.Conversely,when PEV <0,the response sequence for the three EV groups is PDG →RG →PCG.This sequence persists until the discharge power matches the current regulation signal or reaches the maximum discharge power of the EV.The maximum charging and discharging powers for the priority charging, reserve, and priority discharging groups are specified as Pmax,c, Pmax,b, and Pmax,d, respectively.The upper power distribution scheme is presented in Table 1.
In cases where PEV >0, the response sequence for the three EV groups follows the order of PCG →RG →PDG.This sequence continued until the charging power aligned with the current regulation signal or reached the maximum charging power of the EV.Conversely,when PEV <0,the response sequence for the three EV groups is PDG →RG →PCG.This sequence persists until the discharge power matches the current regulation signal or reaches the maximum discharge power of the EV.The maximum charging and discharging powers for the priority charging, reserve, and priority discharging groups are specified as Pmax,c, Pmax,b, and Pmax,d, respectively.The upper power distribution scheme is presented in Table 1.
3.3 Lower layer power distribution for EVs
After obtaining the corresponding power signals for each EV group,each group signal is allocated to individual EVs [24].In this regard, this study, based on the top-layer power distribution results for EVs, defines the power distribution principles used per EV to accomplish the lower-layer power distribution.The principles of the lower-layer power distribution are as follows:
1) Maximum Charge-Discharge Power distribution Principle [25].
The maximum charge-discharge power distribution refers to the EVs responding with the maximum chargedischarge power while satisfying the running constraints.
2) SOC Balancing Power Distribution Principle [26].
Allocate the charging and discharging power of each EV reasonably and ensure a relative balance of the SOC while considering the rated power and SOC value of each EV to jointly determine its output power.The specific determination method is as follows:
①charging

where Pirate is the rated charging and discharging power of the i-th EV,Pich and Pidis are the charging and discharging powers of the i-th EV,respectively,and SOCi is the current SOC value of the i-th EV.Similarly, Pjrate is the rated charging and discharging power of the j-th EV; Pjch and Pjdis are the charging and discharging powers of the j-th EV, respectively; SOCj is the current SOC value of the jth EV.fch(x)is the function governing the charging process of the EV battery, fdis(x) is the function dictating the discharging process of the EV battery,and N is the total number of EVs.
The sigmoid function was stretched and transformed to obtain the corresponding charge-discharge function.When charging and discharging multiple EVs, it is expected that EVs with a higher SOC will charge less and discharge more, whereas EVs with a lower SOC will charge more and discharge less, to achieve a relative balance of SOC for each EV.
The selected charging SOC function expression is:

When the SOC is low, the charging function fch (x) has a high value,corresponding to a high EV charging power,whereas when the SOC is high, the value of its charging function fch(x)is low,corresponding to a high EV charging power.
The selected discharge SOC function expression is:

When the SOC is low,the discharge function fdis(x)has a smaller value, corresponding to a lower EV discharge power, whereas when the SOC is high, the charging func-tion fdis(x) has a larger value, corresponding to a higher EV discharge power.
Table 1
Adjustment signals of three EV groups.

Through the above equation,we can obtain a more reasonable allocation of charging and discharging power for each EV so that each EV can maintain a relative balance of SOC when receiving scheduling instructions.The EV battery charging and discharging function is defined as[27]

where SEVi(t-1) is the SOC of the i-th EV at the previous time instance, t-1.
After normalizing the charging and discharging distribution coefficients, the expression for the SOC-balanced power distribution based on the EV charging and discharging function was obtained as follows:

where PEVi(t)is the charging and discharging signal of the i-th EV at time t,and PEV(t)is the charging and discharging signal of all EVs at time t.
After obtaining the corresponding power signals for each EV group,each group signal is allocated to individual EVs [24].In this regard, this study, based on the top-layer power distribution results for EVs, defines the power distribution principles used per EV to accomplish the lower-layer power distribution.The principles of the lower-layer power distribution are as follows:
1) Maximum Charge-Discharge Power distribution Principle [25].
The maximum charge-discharge power distribution refers to the EVs responding with the maximum chargedischarge power while satisfying the running constraints.
2) SOC Balancing Power Distribution Principle [26].
Allocate the charging and discharging power of each EV reasonably and ensure a relative balance of the SOC while considering the rated power and SOC value of each EV to jointly determine its output power.The specific determination method is as follows:
①charging

where Pirate is the rated charging and discharging power of the i-th EV,Pich and Pidis are the charging and discharging powers of the i-th EV,respectively,and SOCi is the current SOC value of the i-th EV.Similarly, Pjrate is the rated charging and discharging power of the j-th EV; Pjch and Pjdis are the charging and discharging powers of the j-th EV, respectively; SOCj is the current SOC value of the jth EV.fch(x)is the function governing the charging process of the EV battery, fdis(x) is the function dictating the discharging process of the EV battery,and N is the total number of EVs.
The sigmoid function was stretched and transformed to obtain the corresponding charge-discharge function.When charging and discharging multiple EVs, it is expected that EVs with a higher SOC will charge less and discharge more, whereas EVs with a lower SOC will charge more and discharge less, to achieve a relative balance of SOC for each EV.
The selected charging SOC function expression is:
When the SOC is low, the charging function fch (x) has a high value,corresponding to a high EV charging power,whereas when the SOC is high, the value of its charging function fch(x)is low,corresponding to a high EV charging power.
The selected discharge SOC function expression is:
When the SOC is low,the discharge function fdis(x)has a smaller value, corresponding to a lower EV discharge power, whereas when the SOC is high, the charging func-tion fdis(x) has a larger value, corresponding to a higher EV discharge power.
Table 1
Adjustment signals of three EV groups.

Through the above equation,we can obtain a more reasonable allocation of charging and discharging power for each EV so that each EV can maintain a relative balance of SOC when receiving scheduling instructions.The EV battery charging and discharging function is defined as[27]

where SEVi(t-1) is the SOC of the i-th EV at the previous time instance, t-1.
After normalizing the charging and discharging distribution coefficients, the expression for the SOC-balanced power distribution based on the EV charging and discharging function was obtained as follows:

where PEVi(t)is the charging and discharging signal of the i-th EV at time t,and PEV(t)is the charging and discharging signal of all EVs at time t.
4 Simulation validation and analysis
4.1 Parameter configuration
A typical summer load curve in a specific area in the southern province of China was used as an illustrative example for simulation validation.Table 2 lists the electricity prices corresponding to each time segment [28],and Fig.2 illustrates the number of EVs available for regulation in each time segment [28].The total number of available EVs for regulation was 300, and each EV adopted slow charging with a rated charge/discharge power of 7.5 kW, storage capacity of 35 kWh, and charge/discharge efficiency of 90 %.
A typical summer load curve in a specific area in the southern province of China was used as an illustrative example for simulation validation.Table 2 lists the electricity prices corresponding to each time segment [28],and Fig.2 illustrates the number of EVs available for regulation in each time segment [28].The total number of available EVs for regulation was 300, and each EV adopted slow charging with a rated charge/discharge power of 7.5 kW, storage capacity of 35 kWh, and charge/discharge efficiency of 90 %.
4.2 Fitness function optimization and result comparison
Using IGEO to optimize the fitness function and obtain the adjustment signals for EV,as shown in Fig.3,the optimization results are contrasted with those achieved by alternative optimization methods such as GEO, Particle Swarm Optimization (PSO), Whale Optimization Algorithm(WOA),and Genetic Algorithm(GA),as illustrated in Fig.4.It is evident that compared to the other four optimization algorithms, IGEO not only requires the fewest optimization iterations but also achieves the highest optimization accuracy, as shown in Fig.4.
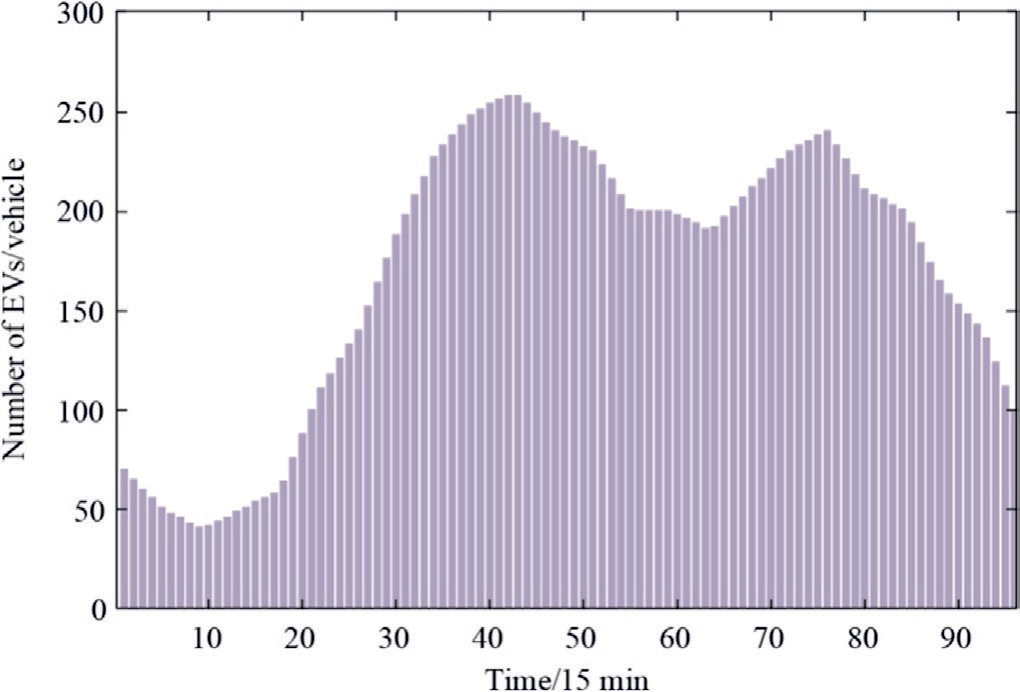
Fig.2.Number of EVs in each period.
Table 2
Time segmented price of a power grid in each period.

Table 3 shows the superiority of the IGEO algorithm by analyzing and comparing the peak-to-valley ratio, peakto-valley difference, and vehicle-owner profit under different optimization algorithms.As indicated in the table,the PSO algorithm achieved the highest vehicle-owner profit.However, it is observed that, in this scenario, the peak-to-valley ratio increases compared to the original curve, which would result in greater grid fluctuations.Hence, the algorithm strived to obtain accurate peak results.Under this research method, not only the load peak-valley difference can effectively be reduced, but the operating cost of EVs can also be reduced, ensuring that reasonable economic returns can be obtained during participation in the power grid regulation process.
Considering that the CEC2005 test set is the most widely used and classic test set, containing 23 benchmark functions, based on the analysis process of algorithm performance in [29], we selected F1-F6 as the typical test functions in the CEC2005 test set, including unimodal,multimodal, high-dimensional unimodal, and step functions, which can comprehensively test the optimization accuracy,speed,and robustness of the algorithm proposed in this study.The IGEO is compared with four algorithms:original GEO,PSO,WOA,and GA.To avoid randomness of the optimization results and demonstrate the stability of the IGEO algorithm, the number of iterations for each algorithm was set to 100, the population size was set to 30,and each test function was run 50 times.The best solution (BS), root mean square error (RMSE), and required time (RT) for each algorithm were used as the final evaluation metrics to assess the optimization accuracy, speed,and robustness of the algorithms.Table 4 presents the results, with the optimal values shown as bold text.
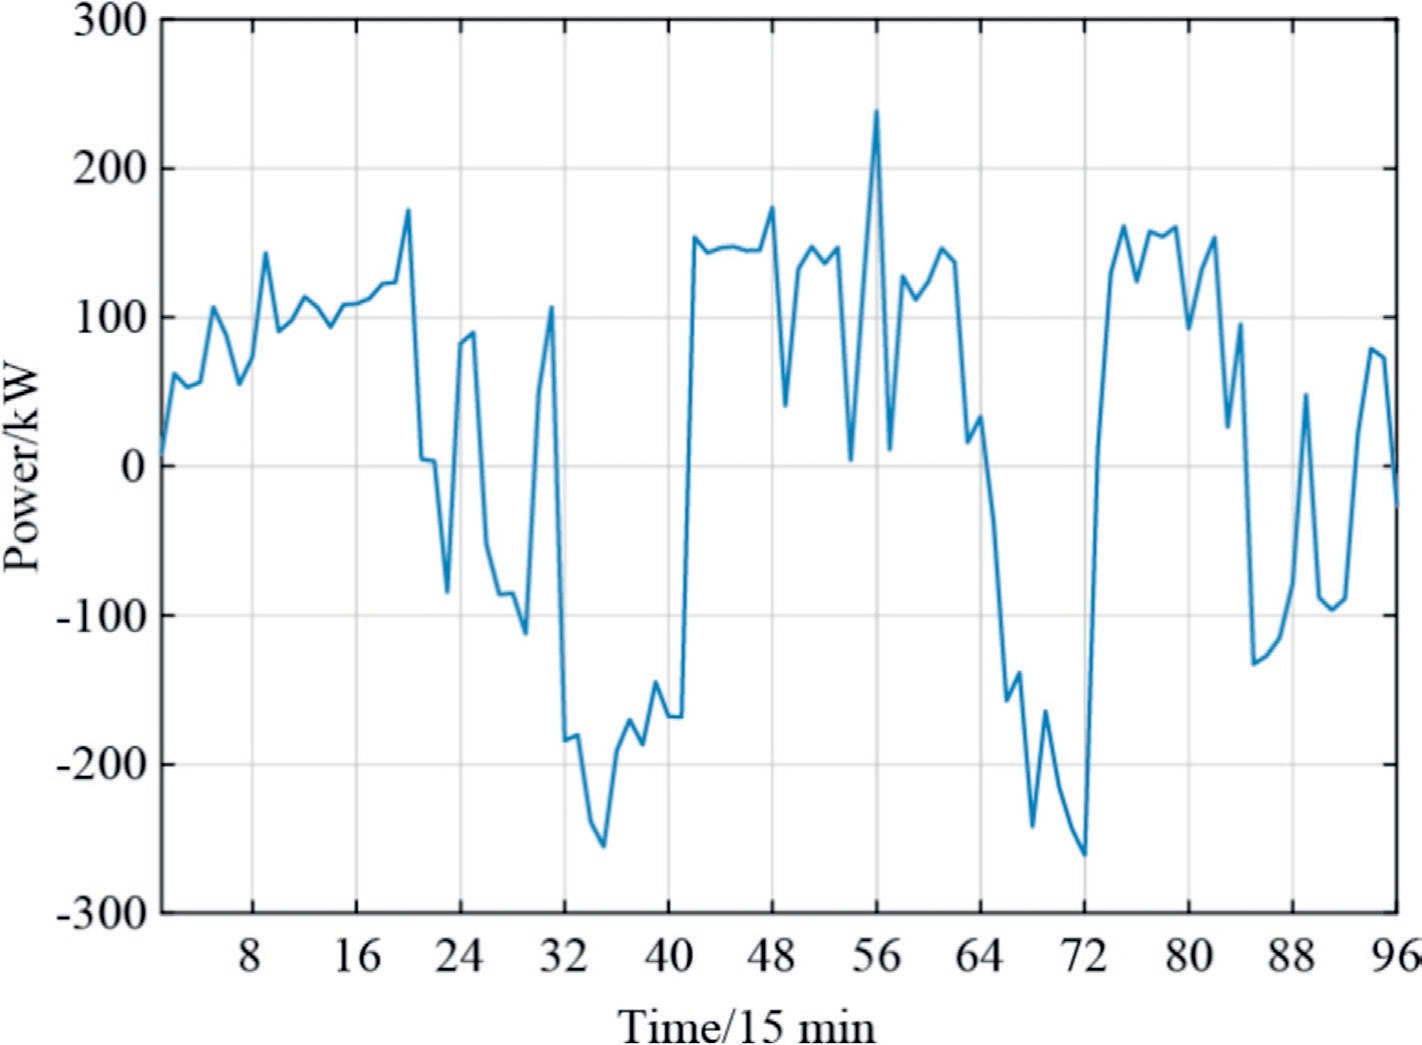
Fig.3.EV regulation signal under IGEO optimization.
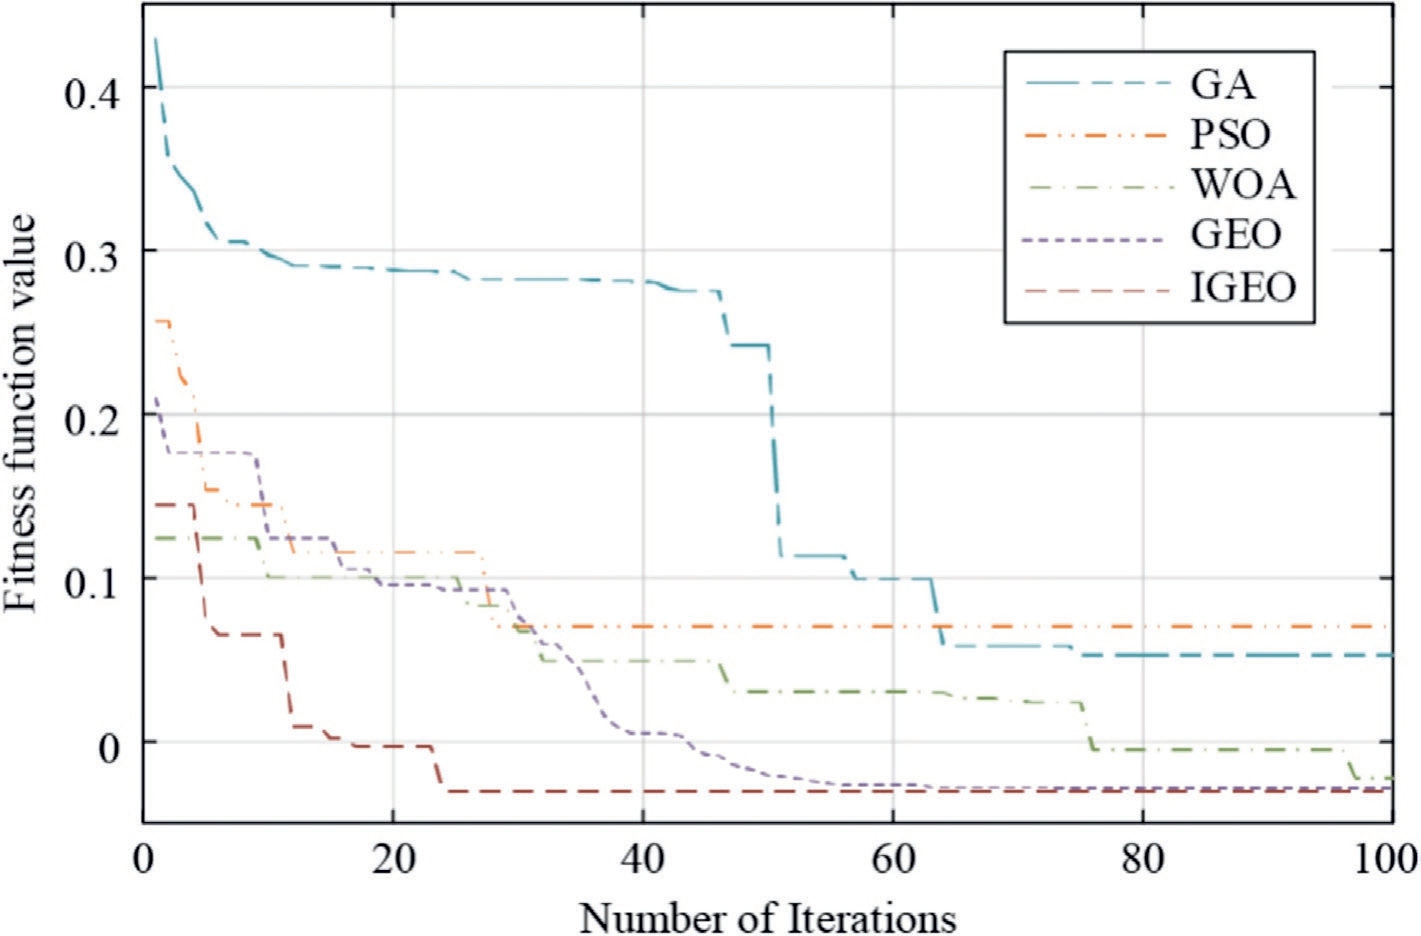
Fig.4.Comparison of iterative effects of each optimization algorithm.
Table 3
Comparison of peak reduction index and EV operation cost of each optimization algorithm.

Table 4
Performance evaluation of various algorithms.
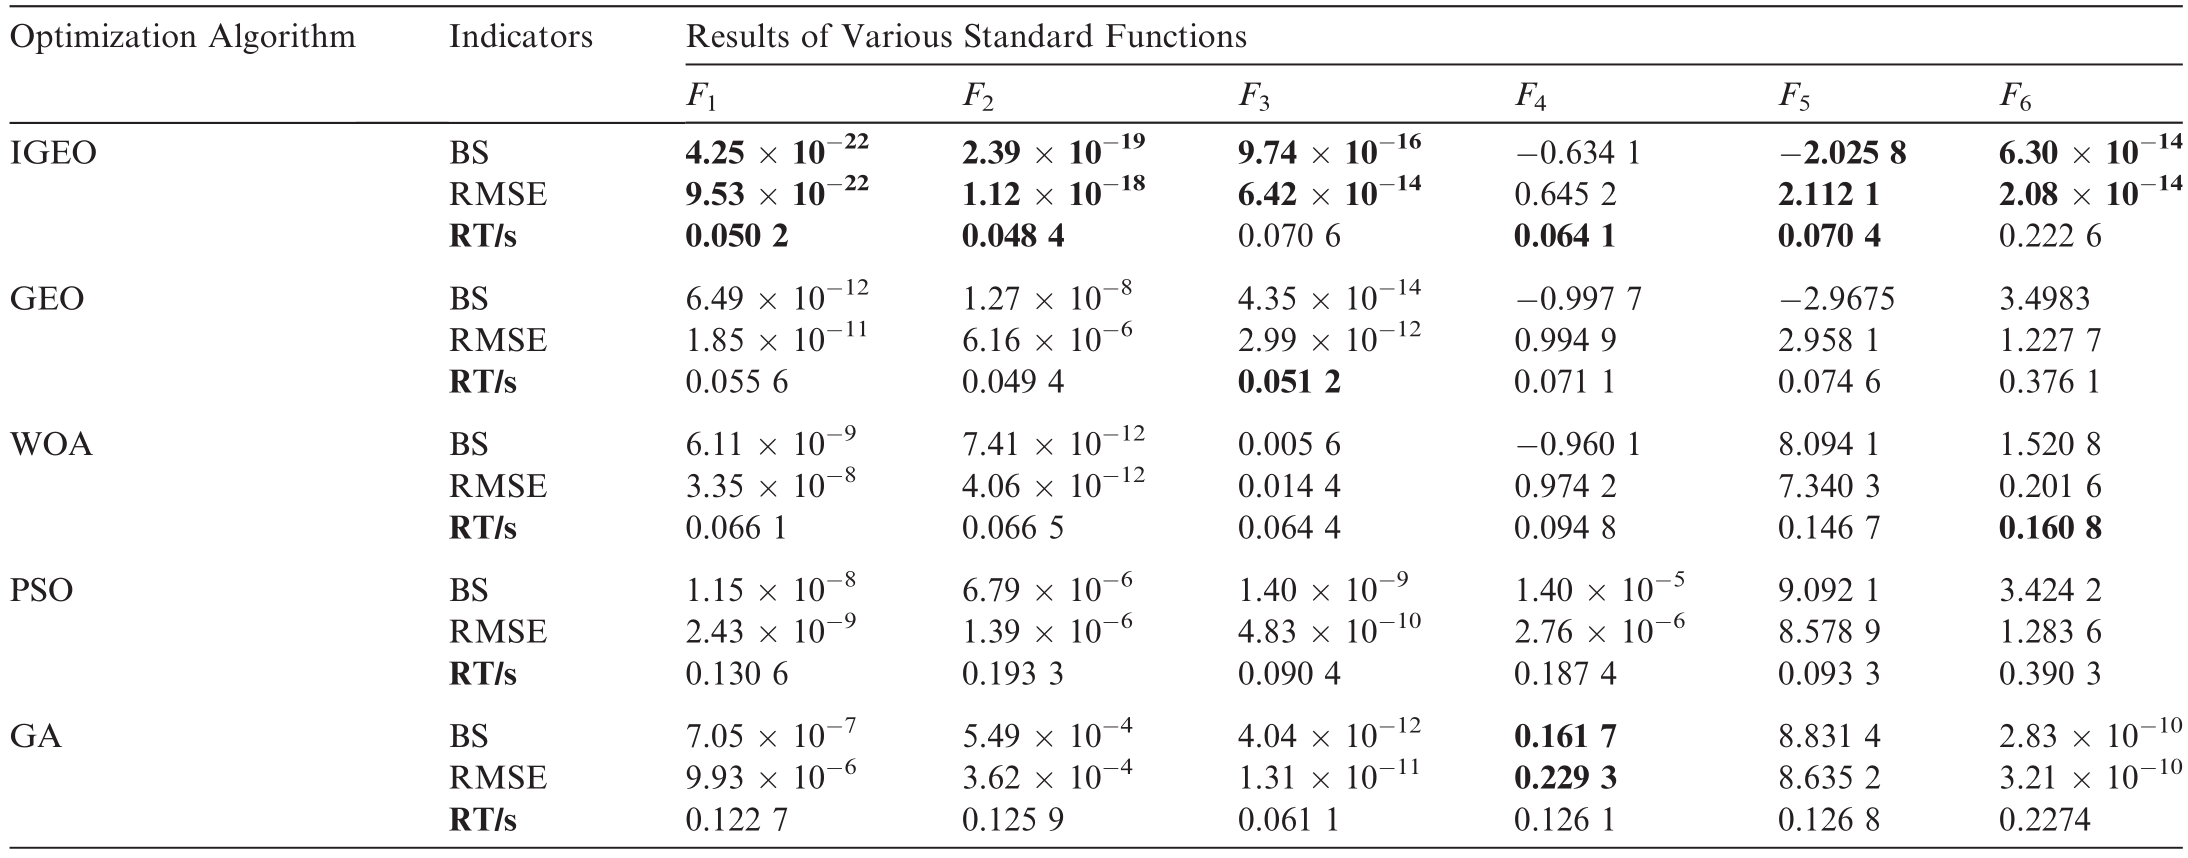
Table 5
Comparison of EV life loss and service life under different strategies.

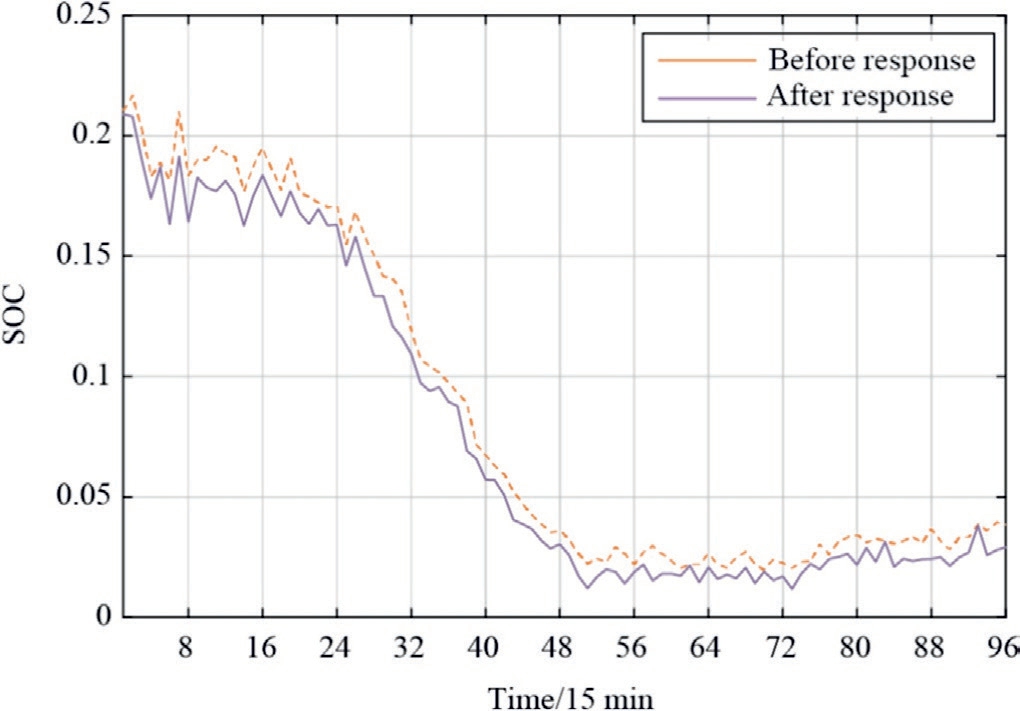
Fig.5.SOC standard D-value of per group before and after EV response.
Table 4 indicates that the proposed IGEO achieved nearly the best results for the test functions,demonstrating significant advantages in terms of F1, F2, and F5.This demonstrates the effectiveness of the proposed IGEO algorithm in terms of optimization capability, speed, and accuracy.
Using IGEO to optimize the fitness function and obtain the adjustment signals for EV,as shown in Fig.3,the optimization results are contrasted with those achieved by alternative optimization methods such as GEO, Particle Swarm Optimization (PSO), Whale Optimization Algorithm(WOA),and Genetic Algorithm(GA),as illustrated in Fig.4.It is evident that compared to the other four optimization algorithms, IGEO not only requires the fewest optimization iterations but also achieves the highest optimization accuracy, as shown in Fig.4.

Fig.2.Number of EVs in each period.
Table 2
Time segmented price of a power grid in each period.

Table 3 shows the superiority of the IGEO algorithm by analyzing and comparing the peak-to-valley ratio, peakto-valley difference, and vehicle-owner profit under different optimization algorithms.As indicated in the table,the PSO algorithm achieved the highest vehicle-owner profit.However, it is observed that, in this scenario, the peak-to-valley ratio increases compared to the original curve, which would result in greater grid fluctuations.Hence, the algorithm strived to obtain accurate peak results.Under this research method, not only the load peak-valley difference can effectively be reduced, but the operating cost of EVs can also be reduced, ensuring that reasonable economic returns can be obtained during participation in the power grid regulation process.
Considering that the CEC2005 test set is the most widely used and classic test set, containing 23 benchmark functions, based on the analysis process of algorithm performance in [29], we selected F1-F6 as the typical test functions in the CEC2005 test set, including unimodal,multimodal, high-dimensional unimodal, and step functions, which can comprehensively test the optimization accuracy,speed,and robustness of the algorithm proposed in this study.The IGEO is compared with four algorithms:original GEO,PSO,WOA,and GA.To avoid randomness of the optimization results and demonstrate the stability of the IGEO algorithm, the number of iterations for each algorithm was set to 100, the population size was set to 30,and each test function was run 50 times.The best solution (BS), root mean square error (RMSE), and required time (RT) for each algorithm were used as the final evaluation metrics to assess the optimization accuracy, speed,and robustness of the algorithms.Table 4 presents the results, with the optimal values shown as bold text.

Fig.3.EV regulation signal under IGEO optimization.

Fig.4.Comparison of iterative effects of each optimization algorithm.
Table 3
Comparison of peak reduction index and EV operation cost of each optimization algorithm.

Table 4
Performance evaluation of various algorithms.

Table 5
Comparison of EV life loss and service life under different strategies.


Fig.5.SOC standard D-value of per group before and after EV response.
Table 4 indicates that the proposed IGEO achieved nearly the best results for the test functions,demonstrating significant advantages in terms of F1, F2, and F5.This demonstrates the effectiveness of the proposed IGEO algorithm in terms of optimization capability, speed, and accuracy.
4.3 Analysis of EV group operating performance and dispatchable potential
Considering that most car manufacturers such as BYD currently use lithium iron phosphate batteries, based on Reference [30], the expression for calculating the EV life loss can be expressed as

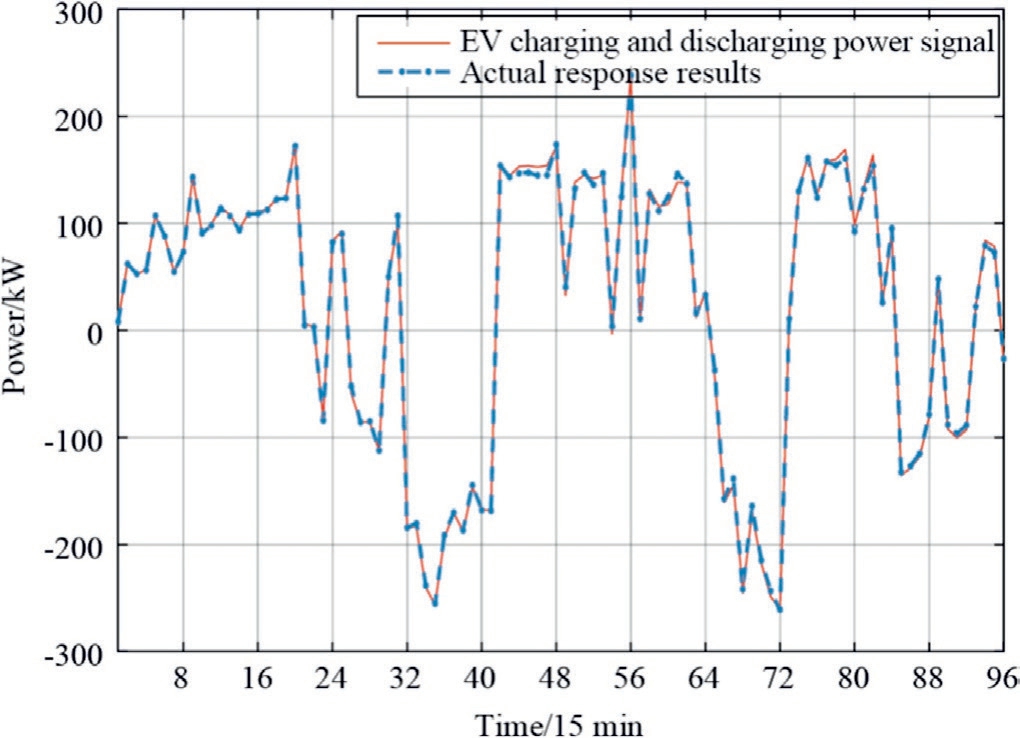
Fig.6.Comparison chart of EV charge and discharge signals and actual responses.
where Qloss is the lifetime degradation, Ts is the converted EV service life according to this degradation, Rcd is the charging and discharging speed of the EV, ΔS is the variation of SOC, G is the gas constant, and its numerical value is 8.314 J/(mol·K).Tem is the cell temperature during normal EV operation, set at 298 K, EEV is the volume of the EV at 35 kW·h, B1, B2, and B3 are constants relying on the battery ilk(typically lithium-ion for EVs),with values of 27128, 31700, and 370.3, respectively, and a4 K is the EV battery capacity degradation factor with a value of 0.2.
To validate the significance of the suggested doublelayer power distribution tactic, Eq.(15) was employed to numerate the lifetime degradation and useful life for the present study and the five other tactics.Tactic 1 evenly distributes the charging and discharging power instructions to each EV.Tactic 2 is based on the SOC-balancing power distribution method.Tactic 3 divides EVs into two groups with equal capacity, assigning EVs with a smaller SOC to one group (PCG) and those with a greater SOC to the other group (PDG); both groups use the mean power distribution method.Tactic 4 follows the same grouping as Tactic 3, but employs the SOC balancing power distribution measure for each EV group.Tactic 5 divides EVs into three groups (PCG, RG, and PDG) with equal volumes,assigning EVs with lower SOC to PCG,those with greater SOC to PDG, and the remaining will be allocated to RG.Each EV group uses the average power distribution method.
The lifetime degradation and service life for each strategy are listed in Table 5.It is evident that the double-layer power distribution tactic based on dynamic grouping in this research exhibits the minimum EV lifetime degradation compared with the other five tactics, thereby enhancing the useful life of EVs.
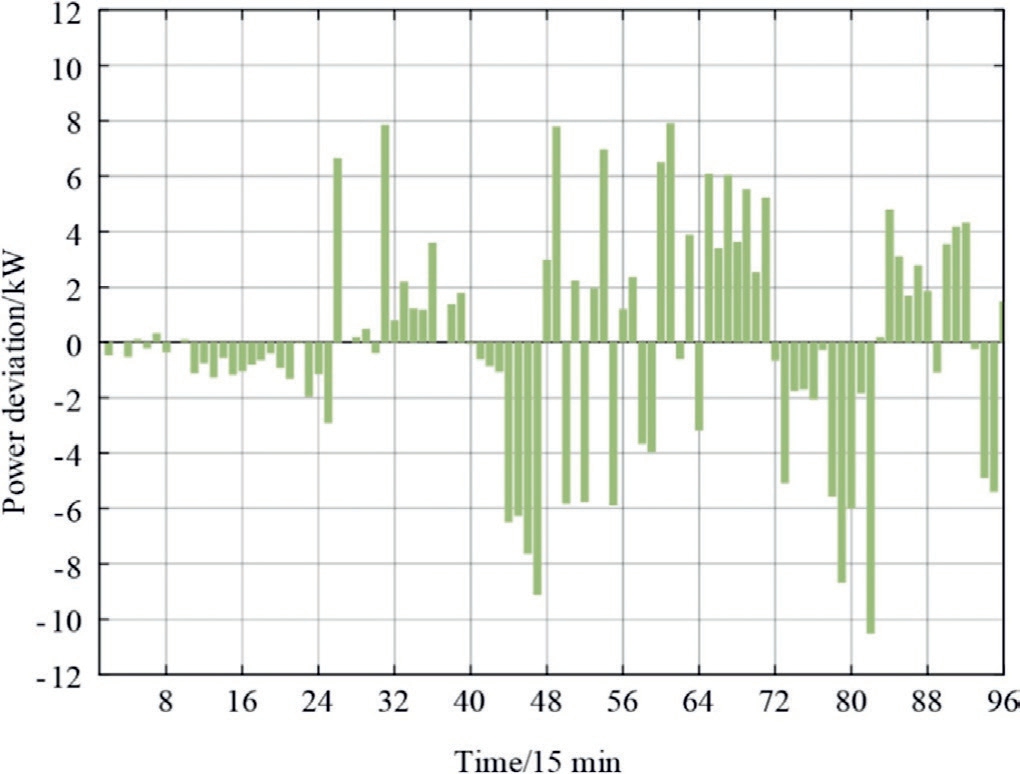
Fig.7.Tracking signal deviation results.
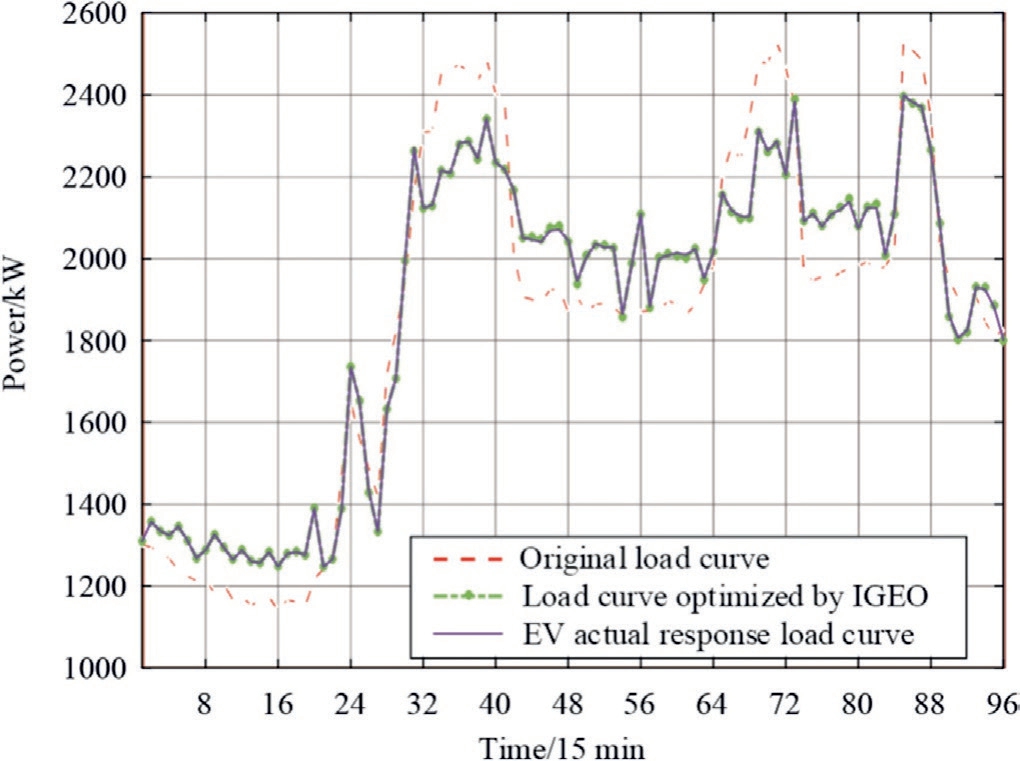
Fig.8.Comparison of daily load curve before and after peaking(1 day).
The SOC balance is illustrated using the standard Dvalue of the SOC for each group of EVs before and after the responses across the 96-time intervals, as depicted in Fig.5.Fig.5 shows that at all 96 time intervals, the standard D-value of the SOC for each group of EVs is lower after the response than before the response.This demonstrates that the proposed tactic enhances the SOC equilibrium of EVs, indicating an improvement in their dispatchable potential.
Considering that most car manufacturers such as BYD currently use lithium iron phosphate batteries, based on Reference [30], the expression for calculating the EV life loss can be expressed as


Fig.6.Comparison chart of EV charge and discharge signals and actual responses.
where Qloss is the lifetime degradation, Ts is the converted EV service life according to this degradation, Rcd is the charging and discharging speed of the EV, ΔS is the variation of SOC, G is the gas constant, and its numerical value is 8.314 J/(mol·K).Tem is the cell temperature during normal EV operation, set at 298 K, EEV is the volume of the EV at 35 kW·h, B1, B2, and B3 are constants relying on the battery ilk(typically lithium-ion for EVs),with values of 27128, 31700, and 370.3, respectively, and a4 K is the EV battery capacity degradation factor with a value of 0.2.
To validate the significance of the suggested doublelayer power distribution tactic, Eq.(15) was employed to numerate the lifetime degradation and useful life for the present study and the five other tactics.Tactic 1 evenly distributes the charging and discharging power instructions to each EV.Tactic 2 is based on the SOC-balancing power distribution method.Tactic 3 divides EVs into two groups with equal capacity, assigning EVs with a smaller SOC to one group (PCG) and those with a greater SOC to the other group (PDG); both groups use the mean power distribution method.Tactic 4 follows the same grouping as Tactic 3, but employs the SOC balancing power distribution measure for each EV group.Tactic 5 divides EVs into three groups (PCG, RG, and PDG) with equal volumes,assigning EVs with lower SOC to PCG,those with greater SOC to PDG, and the remaining will be allocated to RG.Each EV group uses the average power distribution method.
The lifetime degradation and service life for each strategy are listed in Table 5.It is evident that the double-layer power distribution tactic based on dynamic grouping in this research exhibits the minimum EV lifetime degradation compared with the other five tactics, thereby enhancing the useful life of EVs.

Fig.7.Tracking signal deviation results.

Fig.8.Comparison of daily load curve before and after peaking(1 day).
The SOC balance is illustrated using the standard Dvalue of the SOC for each group of EVs before and after the responses across the 96-time intervals, as depicted in Fig.5.Fig.5 shows that at all 96 time intervals, the standard D-value of the SOC for each group of EVs is lower after the response than before the response.This demonstrates that the proposed tactic enhances the SOC equilibrium of EVs, indicating an improvement in their dispatchable potential.
4.4 Monitor EV tracking signal execution results
The results of tracking the charging and discharging signals for grouped EVs on a typical summer day are illustrated in Fig.6, and the deviations in tracking these signals are depicted in Fig.7.A comparison of the daily load profiles before and after peaking is shown in Fig.8.From Figs.6 and 7, it is evident that the EVs following the power distribution strategy proposed in this study exhibited effective tracking of their charging and discharging signals, with a maximum tracking deviation within 12 kW.As shown in Fig.8, the response of the EVs to the signals leads to a reduction in the peak-valley disparity in the power grid load curve.The calculated peak-valley disparity rate decreases from the primary 55.03 to 48.04 %, effectively dampening the power fluctuations in the grid.To further verify the effectiveness of the proposed strategy, we included a set of simulation processes with a time scale of three days (288 data points), as shown in Fig.9.It can be observed that in the multi day simulation,the response of EV to instructions reduces the peak valley difference of the power grid load curve, and has a good peak shaving effect.
These results emphasize the positive impact of the proposed power distribution strategy on EV performance,demonstrating its ability to mitigate tracking deviations and contribute to a more stable power grid with reduced peak-valley differences.
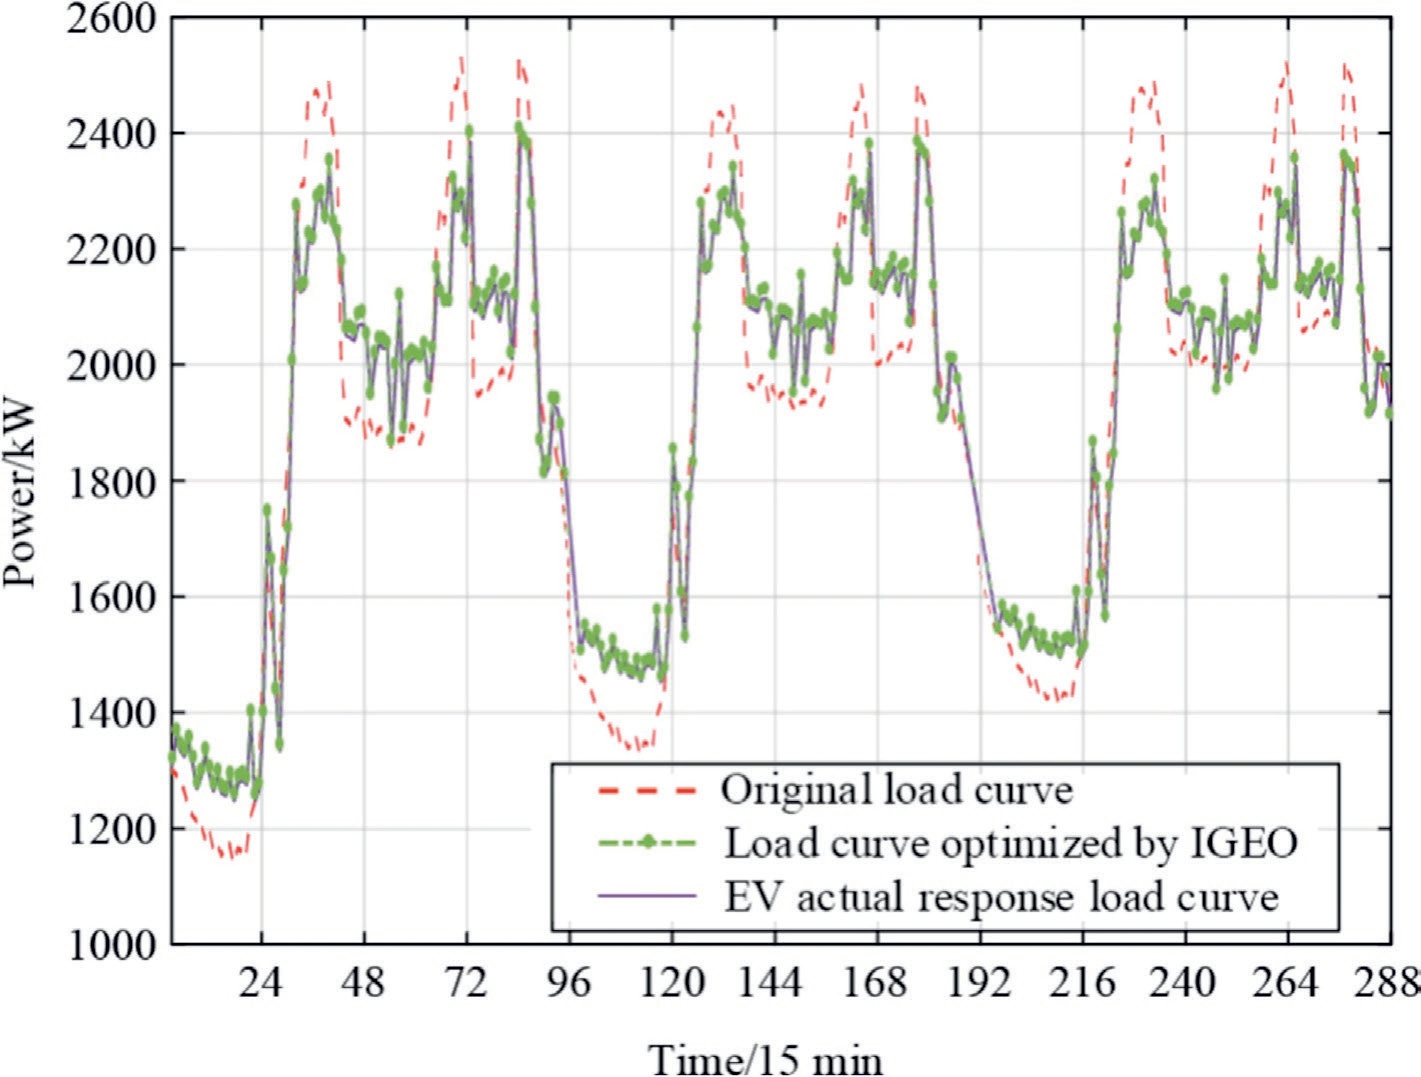
Fig.9.Comparison of daily load curve before and after peaking (3 days).
The results of tracking the charging and discharging signals for grouped EVs on a typical summer day are illustrated in Fig.6, and the deviations in tracking these signals are depicted in Fig.7.A comparison of the daily load profiles before and after peaking is shown in Fig.8.From Figs.6 and 7, it is evident that the EVs following the power distribution strategy proposed in this study exhibited effective tracking of their charging and discharging signals, with a maximum tracking deviation within 12 kW.As shown in Fig.8, the response of the EVs to the signals leads to a reduction in the peak-valley disparity in the power grid load curve.The calculated peak-valley disparity rate decreases from the primary 55.03 to 48.04 %, effectively dampening the power fluctuations in the grid.To further verify the effectiveness of the proposed strategy, we included a set of simulation processes with a time scale of three days (288 data points), as shown in Fig.9.It can be observed that in the multi day simulation,the response of EV to instructions reduces the peak valley difference of the power grid load curve, and has a good peak shaving effect.
These results emphasize the positive impact of the proposed power distribution strategy on EV performance,demonstrating its ability to mitigate tracking deviations and contribute to a more stable power grid with reduced peak-valley differences.

Fig.9.Comparison of daily load curve before and after peaking (3 days).
5 Conclusion
(1) IGEO was designed.Compared with the other four optimization algorithms, the IGEO demonstrates higher optimization accuracy, faster optimization speed, and better robustness.The optimization scheduling model established using the IGEO algorithm results in a smoother power grid load curve and concurrently reduces the operational costs of EVs.
(2) In comparison with other five power distribution strategies, the double-layer power distribution tactic based on the k-means algorithm introduced in this study yields the lowest EV lifetime degradation,extending the EV service life from 4.8 to 10 years.
(3) The use of the SOC-balancing power distribution method improves the SOC balancing standard.The standard D-value of the SOC for each group of EVs decreased from 0.0847 before the response to 0.076 after the response, thereby enhancing the dispatchable potential of EVs.
(4) The proposed power distribution strategy enables more accurate responses to charging and discharging signals for EVs, consequently reducing the peakvalley disparity in the power grid from 55.03 to 48.04 %.It also had a good peak-shaving effect during the multiday simulation process.This confirms that the proposed power distribution strategy effectively lowers the peak-valley disparity in the load.
CRediT authorship contribution statement
Yang Yu: Supervision, Resources, Project administration,Funding acquisition.Yuhang Huo:Writing-original draft, Validation. Shixuan Gao: Visualization, Data curation.Qian Wu:Validation,Investigation.Mai Liu:Validation.Xiao Chen:Software,Methodology,Formal analysis,Conceptualization. Xiaoming Zheng: Resources, Project administration, Funding acquisition. Xinlei Cai: Supervision, Software, Resources, Project administration.
Declaration of competing interest
The authors declare the following financial interests/personal relationships which may be considered as potential competing interests: Xiaoming Zheng is currently employed by State Grid Shanxi Economic and Technological Research Institute;Xinlei Cai is currently employed by Power Dispatching Control Center of Guangdong Power Grid Co., Ltd.
Acknowledgments
This study was supported by the National Natural Science Foundation of China (52077078) and China Southern Power Grid Company Limited 036000KK52220004 (GDKJXM20220147).
References
[1]Y.S.Zhu, J.Z.Liu, Y.Hu, et al., Distributionally robust optimization model considering deep peak shaving and uncertainty of renewable energy, Energy 288 (2024) 129935.
[2]N.Guru, M.R.Nayak, A.K.Barisal, et al., Optimal sizing of battery energy storage in solar microgrid considering peak load shaving, Int.J.Ambient Energy 44 (1) (2023) 2362-2371.
[3]Y.Yu, M.Liu, D.Y.Chen, et al., Dynamic grouping control of electric vehicles based on improved k-means algorithm for wind power fluctuations suppression, Global Energy Interconnect.6 (5)(2023) 542-553.
[4]A.K.Karmaker, K.Prakash, M.N.I.Siddique, et al., Electric vehicle hosting capacity analysis:challenges and solutions,Renew.Sustain.Energy Rev.189 (2024) 113916.
[5]D.Liu,M.Wang,G.Li,et al.,Research on the business operation mode of electric vehicles participating in the electricity market,Global Energy Interconnect.2 (5) (2019) 516-524 (in Chinese).
[6]A.Singh, V.Sharma, V.Kumar, et al., Investigation of PBUC problem with RES and EV in restructured environment,Wind Eng.47 (6) (2023) 1096-1109.
[7]S.J.Liu,D.Z.W.Wang,Q.Y.Tian,et al.,Optimal configuration of dynamic wireless charging facilities considering electric vehicle battery capacity, Transp.Res.Part E: Logist.Transp.Rev.181(2024) 103376.
[8]S.Arof, P.Mawby, H.Arof, et al., Low harmonics plug-in home charging electric vehicle battery charger BMS state of charge balancing using priority and sequencing technique,IOP Conf.Ser.:Earth Environ.Sci 1261 (1) (2023) 012032.
[9]B.F.Tan, S.M.Chen, Z.P.Liang, et al., An iteration-free hierarchical method for the energy management of multiplemicrogrid systems with renewable energy sources and electric vehicles, Appl.Energy 356 (2024) 122380.
[10]H.G.Tran,L.Ton-That,N.G.M.Thao,Lagrange multiplier-based optimization for hybrid energy management system with renewable energy sources and electric vehicles,Electronics 12(21)(2023)4513.
[11]Y.Lan, Y.Li, N.Z.Wang, Multi-objective reactive power optimization for distribution networks based on the modified golden eagle algorithm,J.Phys.Conf.Ser.2666(1)(2023)012002.
[12]N.Ban˜ol Arias, S.Hashemi, P.B.Andersen, et al., Assessment of economic benefits for EV owners participating in the primary frequency regulation markets, Int.J.Electr.Power Energy Syst.120 (2020) 105985.
[13]D.An, F.F.Cui, X.Kang, Optimal scheduling for charging and discharging of electric vehicles based on deep reinforcement learning, Front.Energy Res.11 (2023) 1273820.
[14]Y.Wang,Z.Khan,Effects of optimization on user-based charging/discharging control strategy, Recent Adv.Electric.Electron.Eng.(Formerly Recent Patents on Electric.Electron.Eng.)15(2)(2022)158-170.
[15]X.Y.Liu, T.Y.Feng, Energy-storage configuration for EV fast charging stations considering characteristics of charging load and wind-power fluctuation, Global Energy Interconnect.4 (1) (2021)48-57.
[16]X.Ji,C.Fu,X.Wang,et al.,Research on voltage SOC segmented balancing control strategy for multi energy storage battery packs in microgrids.Electrical Technology, (24) (2023) 31-34+39 (in Chinese).
[17]M.F.Roslan, M.A.Hannan, P.Jern Ker, et al., Scheduling controller for microgrids energy management system using optimization algorithm in achieving cost saving and emission reduction, Appl.Energy 292 (2021) 116883.
[18]X.H.Lang, Analysis of power system load forecasting based on neural networks, J.Phys.Conf.Ser.2664 (1) (2023) 012010.
[19]T.Z.Zhang, J.Dai, Electric power intelligent inspection robot: A review, J.Phys.Conf.Ser.1750 (1) (2021) 012023.
[20]B.Ristic, B.T.Vo, B.N.Vo, et al., A tutorial on bernoulli filters:theory, implementation and applications, IEEE Trans.Signal Process.61 (13) (2013) 3406-3430.
[21]M.J.Cui,J.H.Wang,J.Tan,et al.,A novel event detection method using PMU data with high precision, IEEE Trans.Power Syst.34(1) (2019) 454-466.
[22]L.Y.Kong, J.M.Han, W.T.Xiong, et al., A review of control strategy of the large-scale of electric vehicles charging and discharging behavior, IOP Conf.Ser.: Mater.Sci.Eng.199(2017) 012039.
[23]M.Sahoo, J.Sandeep, S.Rai, Model order estimation for lowfrequency oscillations in power systems by an advanced K-mean clustering approach, Electr.Pow.Syst.Res.224 (2023) 109676.
[24]S.X.Yang, X.F.Wang, W.Q.Ning, et al., An optimization model for charging and discharging battery-exchange buses: consider carbon emission quota and peak-shaving auxiliary service market,Sustain.Cities Soc.68 (2021) 102780.
[25]M.Fahad Ali, L.J.Shi, I.Jamil, et al., Research on charging and discharging of lithium ion battery based on temperature controlled technique, Int.J.Eng.6 (5) (2019) 153-158.
[26]F.Jiang,C.Jin,H.T.Liao,et al.,An artificial potential field-based lithium-ion battery SOC equilibrium method in electric vehicles,IFAC-PapersOnLine 53 (2) (2020) 12682-12687.
[27]G.Liu, Z.Lu, Z.Yang, et al., Distributed energy storage aggregation control method considering SOC equalization, Power Capacitor Reactive Power Compens.41 (3) (2020) 174-181 (in Chinese).
[28]L.Yang, S.Hu, P.Yang, et al., Research on renewable energy acceptance capacity of Guangdong power grid, Power Syst.Protect.Control 41 (15) (2013) 110-115 (in Chinese).
[29]S.Mirjalili, A.Lewis, The whale optimization algorithm, Adv.Eng.Softw.95 (2016) 51-67.
[30]Y.Zhou,H.Su,Q.Gui,et al.,Dynamic battery loss evaluation and its application for optimal online wind-storage integrated scheduling, IET Renew.Power Gener.14 (16) (2020) 3079-3087.
Received 2 January 2024;revised 26 June 2024; accepted 26 June 2024
Peer review under the responsibility of Global Energy Interconnection Group Co.Ltd.
E-mail addresses: ncepu_yy@163.com (Y.Yu), 1340642142@qq.com(Y.Huo), 2982480960@qq.com (S.Gao), wuqian@ncepu.edu.cn (Q.Wu), 1695824724@qq.com (M.Liu), 2737980132@qq.com (X.Chen),ysuzhxm@126.com (X.Zheng), 517665114@qq.com (X.Cai).
https://doi.org/10.1016/j.gloei.2024.06.011
2096-5117/© 2025 Global Energy Interconnection Group Co.Ltd.Publishing services by Elsevier B.V.on behalf of KeAi Communications Co.Ltd.This is an open access article under the CC BY-NC-ND license(http://creativecommons.org/licenses/by-nc-nd/4.0/).

Yang Yu received bachelor’s degree in 2005 from North China Electric Power University,Baoding, master’s degree in 2008 from Xi’an Jiaotong University, Xi’an, and PhD in 2016 from North China Electric Power University,Beijing.At present,he is working as a professor in North China Electric Power University,Baoding.His research fields are energy storage technology and flexible resource dispatching.

Yuhang Huo received the bachelor’s degree in 2022 from North China University of Science and Technology, Tangshan.He is currently pursuing master’s degree in North China Electric Power University, Baoding.His main research interests are electrical energy storage technology and renewable power generation technology.

ShixuanGao received bachelor’s degree in 2022 from Shanxi University, Taiyuan.He is currently pursuing master’s degree in North China Electric Power University, Baoding.His main research fields are Bus load prediction.

Qian Wu received bachelor’s degree at Yanshan University,Qinhuangdao,2022.He is currently pursuing master’s degree in North China Electric Power University, Baoding.His main research areas are low-carbon optimized operation of integrated energy systems.

Mai Liu received the bachelor’s degree in 2021 from China Three Gorges University, HuBei.She is currently pursuing master’s degree in North China Electric Power University, Baoding.Her main research field is electric vehicle optimal scheduling.

Xiao Chen received the bachelor’s degree in 2021 from North China Electric Power University, Baoding.He is currently pursuing master’s degree in North China Electric Power University, Baoding.His main research fields are energy storage technology and renewable energy generation technology.

Xiaoming Zheng received bachelor’s degree in 2009 from Yanshan University, Qinhuangdao,master’s degree in 2013 from Yanshan University,Qinhuangdao and PhD in 2019 from North China Electric Power University, Beijing.He works at the State Grid Shanxi Economic and Technological Research Institute, Taiyuan.His research areas include electric energy storage technology,power grid planning and operation.

Xinlei Cai received bachelor’s degree in 2009 from Xi’an Jiaotong University, Xi’an, and master’s degree in 2012 from Xi’an Jiaotong University, Xi’an.He works at the Power Dispatching Control Center of Guangdong Power Grid Co.,Ltd,Guangzhou.His research field is power system operation control.
(Editor Yu Zhang)
