0 Introduction
On April 25,2023,the EU’s Carbon Border Adjustment Mechanism (CBAM), also known as carbon tariffs, completed its legislative process and officially took effect on October 1,2023[1,2].The CBAM establishes a green trade barrier under the pretext of preventing carbon leakage and has long-term and far-reaching implications for China’s exports to the EU.This study addresses the issue of carbon emissions cost asymmetry between European companies and their foreign competitors.The CBAM not only supports the EU in implementing more ambitious emission reduction policies but also incentivizes its trading partners to adopt emission reduction measures comparable to those of the EU [3].The EU is China’s largest export destination,with exports reaching USD 390.8 billion in 2020,constituting 15%of China’s total exports and 20%of the EU’s total imports.Due to factors such as energy consumption structure, technological development level, and economic development stage, China’s products exported to the EU have a relatively high intensity of carbon emissions.The implementation of the CBAM mechanism will potentially have a significant impact on the export of high-carbon products in certain sectors, which requires significant attention from China.Thus, it is important to assess the scale and distribution of carbon dioxide implied by China’s high carbon exports to Europe.
Many researchers have conducted extensive research on the CBAM and its impact.Wang et al.[4] analyzed the development process, key mechanisms, economic impacts,stance of the international community, trends, and responses to CBAM.Zeng et al.[5]suggested that CBAM reduced the total amount of exports from affected sectors in China to Europe by 11%-13%, and increased export costs by USD 100 million to USD 305 million.Ren et al.[6] used a bilateral trade implicit emission analysis model to estimate the impact of CBAM on the export trade volume, added economic value, and implicit carbon emissions of 40 industrial products in China.Liu et al.[7]employed a single-region input-output model and inputoutput table to calculate the implicit carbon emissions from China’s exports to 27 EU countries in 2018 and analyzed the potential economic losses for China.Ruan et al.[8] used the GTAP model to quantitatively assess the impact of CBAM on China’s exports.Tan et al.[9]utilized a multi-regional input-output (MRIO) model to estimate the total implicit carbon emissions of, first, direct imports and exports between China and the EU, and second,China’s processing and re-export of products imported from the EU.Wei et al.[10] used the MRIO model to measure the scale of energy-related carbon emissions transferred through international trade between 1995 and 2009.Wang et al.[11] analyzes the spillover effects of CBAM using an extended MRIO model and a CGE model.Xie et al.[12] quantitatively analyzed the impact of CBAM on China’s economy and achievement of global carbon reduction targets.An et al.[13]discussed the compatibility of CBAM with the WTO framework from the perspectives of rule consistency, scope of application,and legitimacy.Ren et al.[14] examined the impact of the CBAM on China’s renewable energy development and provided recommendations.Guo et al.[15] proposed a CGE model based on an evolutionary game as a dynamic recursive basis for studying the impact of CBAM on the Chinese manufacturing industry.Lin et al.[16]employed the event study method utilizing the steel and aluminum data from China’s futures market to empirically examine the existence of the green paradox.Zhong et al.[17] implemented a systematic review of the insights and challenges in formulating effective CBAM policies.
The existing literature primarily focuses on the scale and transfer patterns of energy-related implicit carbon emissions, with limited research on indirect carbon emissions from electricity.Based on the input-output theory,the current study establishes quantitative models for implicit carbon emissions and indirect carbon emissions from the electricity of export products to Europe.Scenario analysis was then employed to design six carbon tariffscenarios and assess the impact of the CBAM on the major export sectors under each scenario.Finally, from the perspective of the power industry, four measures were proposed to mitigate the adverse effects of CBAM.
1 The main content of CBAM
The final agreement on the CBAM proposal,compared with the conservative European Commission draft and more radical European Parliament amendments, adopts a compromise strategy in terms of the starting time,reduction of free allowances, and scope of coverage.
Carbon tarifftiming: CBAM came into effect on October 1, 2023.The transitional period started from October 1, 2023 and will continue till December 31, 2025, during which only reporting obligations will apply.In other words, importers only need to submit annual data on the implicit carbon emissions of their imported products without paying fees.CBAM will formally start in 2026 and will be fully implemented by 2034.The CBAM will be phased at the same pace as the reduction in free allowances in the EU Emissions Trading System (EU-ETS), as shown in Fig.1.
Carbon tariffobjectives: The CBAM is applicable to those trading partner countries of EU that have not implemented equivalent climate policies, exempting countries with the similar climate objectives.As a result, developing countries including China, India, Vietnam, and Brazil,which have a large trade scale with the EU, will be the main targets of these carbon tariffs.
Carbon tariffscope: Currently, CBAM includes steel,aluminum, electricity, cement, fertilizer, hydrogen, certain precursors, and downstream products.Before the end of the transitional period, the European Commission is required to evaluate whether to expand its scope to include other products at risk of carbon leakage,including organic chemicals and polymers.The goal of the CBAM is to include all products covered by the EU-ETS by 2030.
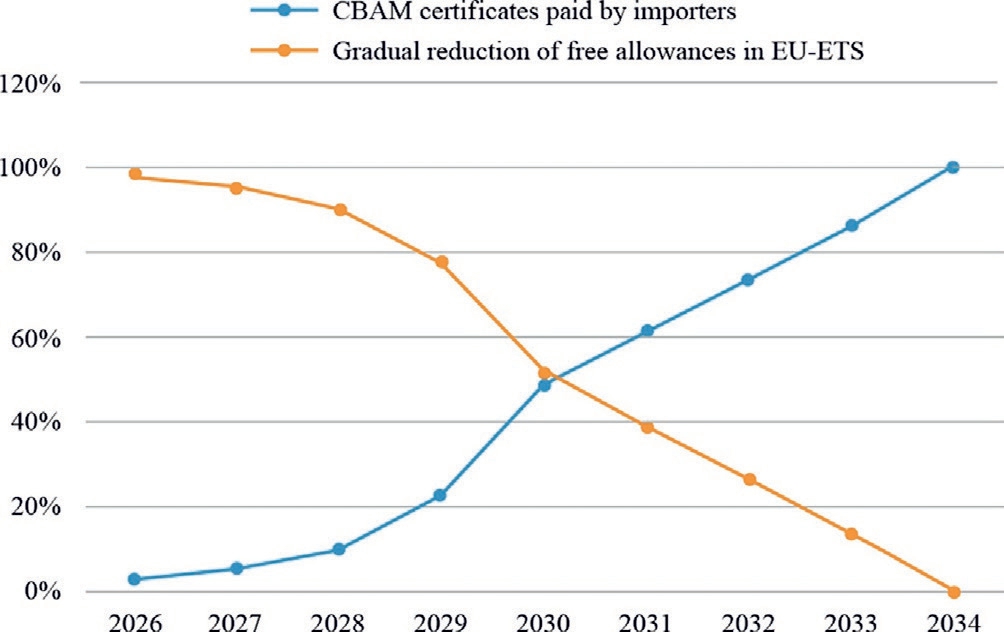
Fig.1.CBAM carbon tariffprocess.
Emission types: Currently, CBAM mainly includes direct emissions from production processes (Scope 1) and certain conditions of indirect carbon emissions from electricity consumption (Scope 2), covering three categories of greenhouse gases: carbon dioxide, nitrous oxide (only for fertilizer products),and perfluorocarbons(only for aluminum products).Specific regulations on carbon tariffs for indirect emissions have not yet been clarified.For steel and aluminum,because the EU’s production of these products already receives compensation for indirect emission costs(electricity price subsidies), these products may initially be exempt from indirect emissions and only be subjected to taxes on direct emissions.
Carbon tariffmethod: EU importers are required to regularly submit data that includes the total volume of imported products and their direct and indirect carbon emissions.In the case of imported products for which actual data cannot be provided, the EU uses a default emission intensity value to calculate the tax rate.This default value is the average of the carbon emission intensities of the highest 10% of the same product imported into the EU.The EU sells CBAM certificates at a price that is aligned with the auction price of the emissions allowance in the EU-ETS market.Each year, importers are required to purchase sufficient certificates and submit them to the EU until May 31st.The cost of the CBAM certificate payment for importers is calculated as follows:
where E denotes the cost of CBAM certificates paid by importers, Call denotes the direct carbon emissions of imported products,Cfree denotes the free carbon allowance obtained for the same products in the EU, CBAMprice denotes the purchase price of CBAM certificates,and Epay denotes the explicit carbon emissions cost already paid for the product in the country of origin.
2 Calculation of implicit carbon emission and indirect emission from electricity
2.1 Implicit carbon emission
Carbon emissions in exported products include not only direct emissions from production, but also indirect emissions caused by electricity consumption and inputs of intermediate products.This study uses the concept of implicit carbon emissions to represent the total carbon emissions throughout the product lifecycle.First, the input-output theory is used to calculate the scale of implicit carbon emissions in exported products.
Based on a single-region input-output model,assuming an economy with n sectors, the basic input-output model is expressed as
X =AX +Y (2)
where X represents the total output value in USD; A denotes the coefficient matrix of direct consumption; AX denotes intermediate sector use value in USD; and Y represents the final use value in USD.This equation can be rearranged as
where (I-A)-1 denotes the Leontief inverse matrix.Let ei represent the direct carbon emissions of the i-th sector per unit of output value,that is,the direct carbon emission intensity of the i-th sector expressed in tCO2/USD, ci represent the total implicit carbon emissions of the i-th sector,tCO2.ei and ci for n sectors form n-dimensional matrices E and C, respectively.Thus, X = C/E.Substituting this into(3) yields the implicit carbon emissions C caused by satisfying final demand Y as
where E(I-A)-1 represents the implicit carbon emission intensity.To differentiate between domestic and imported product inputs in the production stage, A is divided into two parts: Ad and Am for domestic and imported product consumption coefficients, respectively.Y comprises final domestic consumption, capital formation, and total exports Yo.Therefore, the implicit carbon emissions Co in exported products with domestic product inputs can be obtained as
Moreover, the direct carbon emissions Cd in exported products are calculated as
2.2 Indirect emission from electricity consumption
The use of electricity to replace fossil energy consumption and reduce carbon emissions has the advantage of low cost.Therefore, by assessing the scale and distribution of indirect carbon emissions from electricity in high-carbon export products, export enterprises can mitigate the impact of the CBAM by increasing green electricity consumption at lower costs.Based on the input-output theory, the indirect carbon emissions from electricity consumption Ce in exported products are calculated as follows:
where P represents the electricity consumed by each sector(kWh);P/X represents the electricity consumption per unit output value by each sector, kWh/USD; B represents the electricity consumption carbon emission factor, tCO2/kWh; M represents the indirect carbon emission intensity from electricity, tCO2/USD.
From(6),it is evident that the indirect carbon emission intensity M is closely related to the electricity consumption intensity and electricity consumption carbon emission factor.Compared to developed countries in the EU, China has a higher electricity consumption intensity and a higher electricity consumption emission factor, indicating significant potential for emission reduction.In 2020, China’s electricity consumption intensity was approximately 278 kWh/ten thousand CNY, whereas that of the EU was 142 kWh/ten thousand CNY, which is 51% of that of China.In 2021,China’s average electricity consumption emission factor is 557 gCO2/kWh[18],whereas that of the EU is 241 gCO2/kWh, which is 43% of that of China, as shown in Fig.2.
The proportion Se of indirect carbon emissions from electricity consumption Ce in implicit carbon emissions Co is expressed as
3 CBAM impact assessment on China’s exports
3.1 Data process flow
To calculate the implicit carbon emissions Co,the direct carbon emission intensity E, the matrix of domestic product consumption coefficients Ad, and the export amount Yo are required.Yo was directly obtained from the 2021 China Trade and Economic Statistics Yearbook.The first step was to unify the sector divisions.Only implicit carbon emissions from agricultural and industrial products exported to Europe were considered.China’s exports to the EU were divided into 21 sectors.The specifics of sector division can be found in[8].The second step was to calculate the direct carbon emission intensity E based on the coal, crude oil, and natural gas consumed by each sector and their carbon emission coefficients (see Table 1).The third step was to calculate Ad.Based on China’s noncompetitive input-output table for 2020, the intermediate sector use value of the corresponding domestic products was merged and divided by the corresponding merged total input value to obtain the direct consumption coeffi-cient matrix Ad of the corresponding merged sector.
3.2 Calculation results
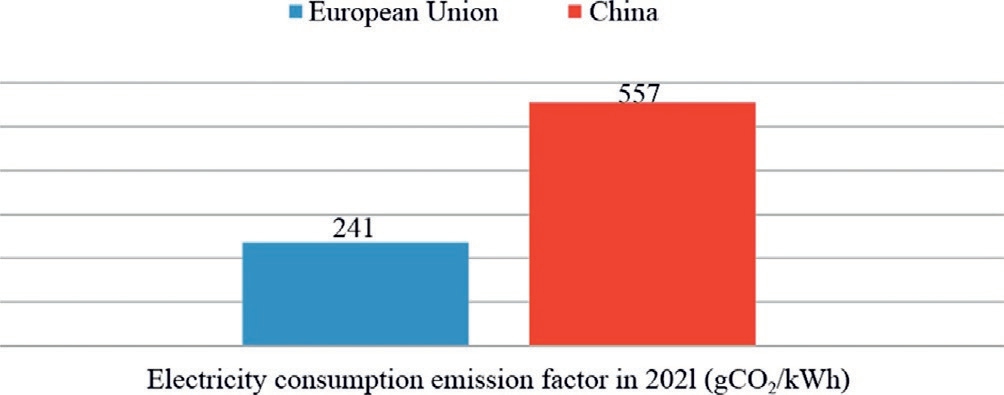
Fig.2.Electricity consumption carbon emissions factor of EU and China in 2021.
As shown in Fig.3, in 2021, China’s implicit carbon emissions for all products exported to the EU were approximately 375 million tons, of which the top five sectors were chemical sector (approximately 115.7 million tons), machinery and equipment sector (approximately 59.7 million tons), general and special equipment sector(approximately 55.1 million tons), textile sector (approximately 29.9 million tons), and metal products sector (approximately 28 million tons), accounting for a total proportion of 76.8%.The implicit carbon emission intensity of products exported to Europe is between 0.3 kgCO2/USD and 2.1 kgCO2/USD, with an average implicit carbon emission intensity of 0.77 kgCO2/USD.The four sectors with the highest implicit carbon emission intensities are chemical sector (2.13 kgCO2/USD), nonmetallic mineral products sector (1.40 kgCO2/USD), metal smelting and rolling sector (1.37 kgCO2/USD), and nonmetallic mineral mining and dressing sector (1.24 kgCO2/USD).These are traditional energy- and resource-intensive sectors.The implicit carbon emission intensities of these four sectors in the EU are 18%, 41%, 30%, and 15%, respectively, of those of China.If the implicit carbon emission intensity of industrial products reaches the same level as that of the EU,the total implicit carbon emissions of products exported to Europe in 2021 can be reduced by 63%,which has great potential for decarbonization and tax reduction.
The calculation results for implicit carbon emissions of export products to Europe from China are similar to those in reported in Refs.[4] and [7] considering that the size of China’s exports to the EU in 2021 was 1.4 times that in 2018.
As shown in Fig.4,it is assumed that the electricity consumption emission factor in China was 557 gCO2/kWh in 2021, and the indirect carbon emissions from electricity consumption for all products exported to the EU in 2021 were approximately 41.8 million tons, accounting for 11% of the total implicit carbon emissions from all products exported to Europe.The Se of each sector ranged from 7% to 35%.Among these, the textile, chemical,machinery and equipment, and special and general equipment sectors exhibited the highest indirect carbon emissions from electricity consumption, accounting for 64%of the total indirect carbon emissions from electricity consumption for all products exported to Europe.As shown in Fig.5, the Se values of these four sectors are 22%,7%, 11%, and 9%, respectively.Currently, the proportion of indirect carbon emissions from electricity consumption to the total implicit carbon emissions is not high.However,with the establishment of the new-type power system,the proportion of electricity in the final energy consumption continuously increases, and electricity is gradually replacing fossil energy as the primary terminal energy.As the scale of indirect carbon emissions from electricity consumption increases, their impact is expected to grow increasingly significant.
Table 1
CO2 emission coefficients of primary energy sources.
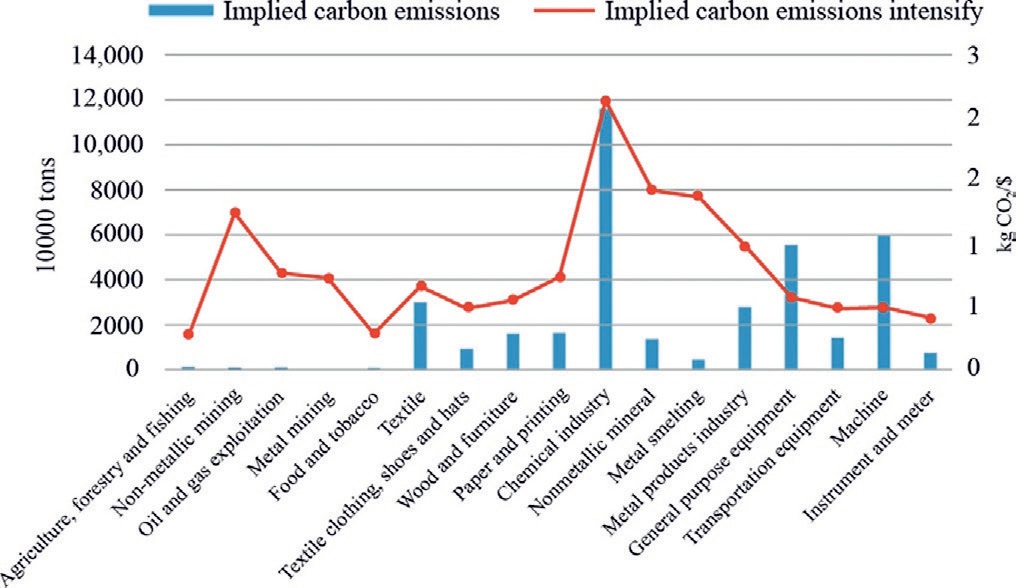
Fig.3.Implicit carbon emissions and the implicit carbon emissions intensity in different sectors.
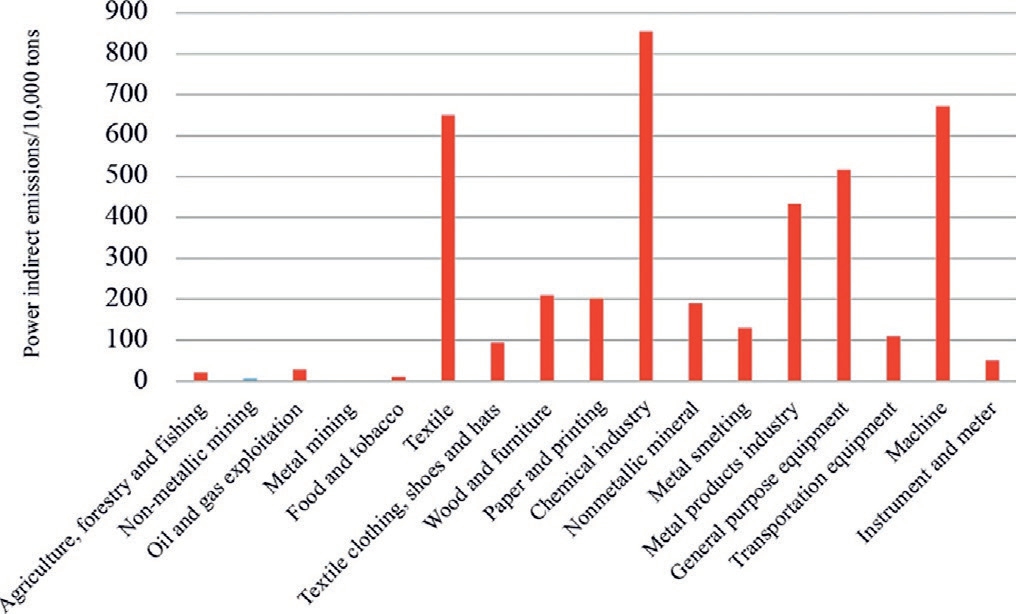
Fig.4.Indirect carbon emissions from electricity consumption in all sectors.
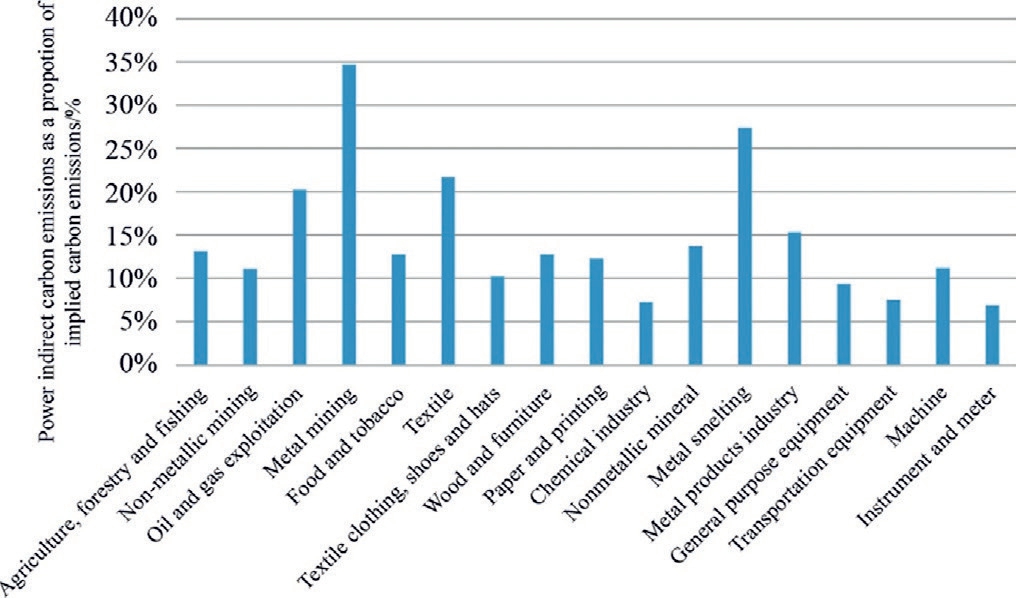
Fig.5.Indirect carbon emissions from electricity consumption as a proportion of implicit carbon emissions in all sectors.
3.3 The impact of CBAM on China’s export
Implicit carbon emissions are used to evaluate the impact of the CBAM on China’s exports to the EU.According to the scope of the carbon tariff,tariffprice,free allowances in the EU, and domestic paid carbon emission costs, six scenarios (S1-S6) were designed to analyze the impact of CBAM on China’s exports to the EU,as shown in Table 2.The tariffprice of 85 EUR/ton is the average carbon price of the EU-ETS in 2022, and the average carbon price of China’s carbon market transactions in 2022 is 55 CNY/ton.This study assumes that locally produced goods in the EU have obtained free carbon allowances that are one-third of the implicit carbon emissions of same product imported from China.
The total paid carbon tariffs and share of total foreign trade exports under various scenarios are listed in Table 3.In the most severe scenario(S1),China will be levied a carbon tariffof 33.7 billion USD, accounting for 6.9% of the total export to Europe.Indirect carbon emissions from electricity consumption will be levied at tariff3.75 billion USD.In scenario S4, China will be levied a carbon tariff11.8 billion USD after the transition period, accounting for 2.4% of its total exports to Europe.Indirect carbon emissions from electricity consumption, levied a carbon tariff1.3 billion USD.In the scenario S6,which is the current CBAM proposal,China will be levied carbon tariffs of 1.4 billion USD,accounting for 0.3%of its total export to Europe.The indirect carbon emissions from electricity consumption will be levied carbon tariff160 million US dollars.
Based on scenario S4, the impact of the CBAM on key sectors within the scope of the EU-ETS was thoroughly analyzed.The organic chemicals and plastics sector is expected to pay carbon tariffs of approximately 5.3 billion USD for exports to the EU, accounting for 22% of the total exports of these two sectors.Overall,the sector profits will be severely affected.The glass and ceramic sector is expected to pay approximately 770 million USD for exports to the EU, accounting for 14% of total exports to the EU.This will significantly increase export costs and weaken relative competitive advantage.The steel,aluminum, cement, and fertilizer sectors are expected to pay carbon tariffs of approximately 2.2 billion USD for exports to the EU, accounting for 12.5% of the total exports of these four sectors to the EU.The exports of these four sectors to the EU is expected to be severely affected.The metal products sector will pay carbon tariffs of approximately 950 million USD for exports to the EU,accounting for 9% of the total exports of this sector to Europe.Thus,the overall profit of the metal products sector will be affected.The textile and papermaking sectors are expected to pay carbon tariffs of approximately 2.6 billion USD for exports to Europe,accounting for 7%of the total exports from these two sectors to Europe.Thus,CBAM is expected to reduce the export competitiveness in these sectors.
Table 2
Carbon tariffs scenario design.

Table 3
Carbon tariffs paid in different scenario.

3.4 The estimation of China’s implicit carbon emissions
In the future, it is expected that, although China’s exports to the EU will continue to grow steadily, its trade structure might change.Goods with high carbon emission intensities will gradually decrease,and those with low carbon emission intensities will gradually increase.Based on data from 2010 to 2023 and style="vertical-align: middle; text-align: center;">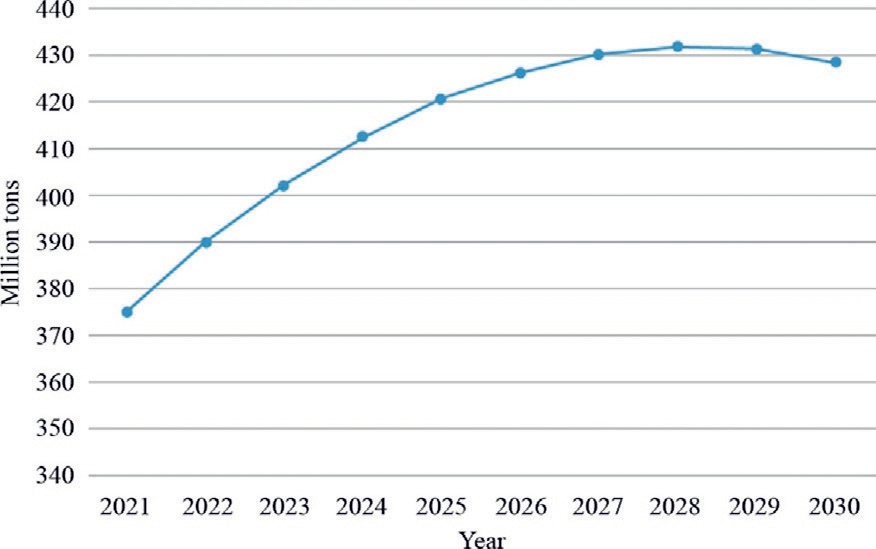
Fig.6.The predicted values of China’s implicit carbon emissions for all products exported to the EU.
4 Countermeasures
To reduce indirect carbon emissions from electricity consumption and the adverse effects of CBAM,the following four measures are proposed:
(1) Strengthening of industrial energy conservation
In the iron and steel sector, use of energy-saving technologies and waste steel should be popularized.In aluminum sector, waste aluminum can be recycled to produce new aluminum products, and advanced electrolytic cell technology and energy-saving kilns can be promoted to reduce carbon emissions.In the cement sector,next-generation cement production technologies can be applied to reduce energy consumption.In the fertilizers sector,the proportion of green hydrogen-based raw materials can be increased to optimize the raw material structure of synthetic ammonia.By relying on industrial energy-saving technologies and management, implicit carbon emissions can be reduced by 1%-5%.
(2) Accelerate the low-carbon transformation of the electric power industry
In desert regions including the Gobi desert, large-scale development of wind power and photovoltaic power generation in a localized manner needs to be accelerated.The comprehensive development of water,wind,and solar energy in the southwestern region and the construction of offshore wind power bases in the eastern region should be promoted.The development of distributed renewable energy also needs to be promoted.Electricity can be promoted to replace coal, oil, gas, and primary biomass energy consumption in the industrial sector to improve energy consumption efficiency and reduce carbon emissions.By relying on the decarbonization of the power supply structure and clean replacement of fossil fuels,implicit carbon emissions can be reduced by 5%-10%.
(3) Promote the electricity carbon emission factor with spatiotemporal information
The renewable energy generation varies significantly with time.It changes considerably with seasons daytime,and intraday timescales.Thus,the electricity consumption carbon emission factors exhibit significant differences.In terms of the spatial dimension,owing to the uneven distribution of wind and light resources and the different scales of transregional electricity transmission, the intensity of electric power carbon emissions in various regions is significantly different.As reported in [18], the electricity consumption carbon emission factor of Hebei province is 6.4 times that of Yunnan Province.By using the electricity consumption carbon emission factor with spatiotemporal information instead of a national unified electricity consumption carbon emission factor, implicit carbon emissions can be reduced by 5%-10%.
(4) Vigorous development of green electricity trading
A unified national green certificate system needs to be established to recognize low-carbon contributions between green electricity trade, green certificate trade, and trade in other markets.Aggregation methods for renewable energy sources to participate in green electricity trading, such as virtual power plants, should be encouraged to enhance enthusiasm for participating in green electricity trading and reduce transaction costs.To realize the large-scale optimization configuration capabilities of renewable energy, the inter-provincial and inter-regional trading mechanisms for renewable energy need to be improved.By strengthening carbon footprint management and expanding green electricity trading, the indirect carbon emissions of electricity implied in the product needs to be offset.
5 Conclusions
Based on the input-output theory, this study quantitatively examines the scale of implicit carbon emissions of products exported to Europe and indirect carbon emissions of electricity consumption to Europe.Six scenarios were designed to analyze and evaluate the impact of CBAM on major export sectors, and measures were proposed from the perspective of the power industry to reduce the adverse effects of CBAM.
(1) In 2021,the implicit carbon emissions of all products exported from China to Europe were approximately 375 million tons, of which the top five sectors were the chemical, machinery and equipment, general and special equipment, textile, and metal products sectors, accounting for a total proportion of 76.8%.The average carbon emission intensity of products exported to Europe (0.77 kg carbon/USD) is much higher than that of similar products exported from mainland China to the EU.
(2) In the worst-case scenario, China will be subject to carbon tariffs of USD 33.7 billion, accounting for 6.9% of the total export value to Europe in 2021.However, according to the current levy plan, China will be subject to carbon tariffs of approximately USD 1.4 billion, accounting for 0.3% of its total export value to Europe.The organic chemicals and plastics, glass ceramics, steel, aluminum, cement,and fertilizer sectors are the main sectors that will be affected by carbon tariffs.These sectors are expected to pay carbon tariffs that account for more than 10% of their export trade volumes.
(3) The indirect carbon emissions from electricity for all products exported from China to Europe in 2021 were approximately 41.8 million tons, accounting for 11% of the implicit carbon emissions of all products exported from China to Europe.The estimated proportion of indirect carbon emissions from each sector’s products exported to Europe was between 7%and 35%of the implicit carbon emissions of each sector.As the proportion of electricity consumption in terminal energy continues to increase, the impact of including indirect carbon emissions from electricity consumption in carbon tariffs will become increasingly significant.
(4) To reduce indirect carbon emissions from electricity consumption, it is necessary to strengthen industrial energy conservation and management,promote lowcarbon transformation in the power industry, promote power grid carbon emission factors using spatiotemporal information, and vigorously develop green electricity trading to reduce the adverse effects of CBAM on China’s exports.
Declaration of competing interest
The authors declare the following financial interests/personal relationships which may be considered as potential competing interests: Ya Wen and Yun Zhang are currently employed by Global Energy Interconnection Group Co.,Ltd.The research project is funded by Global Energy Interconnection Group Co., Ltd.
References
[1]European Commission, Impact Assessment Report Accompanying the Document: Proposal for a Regulation of the European Parliament and of the Council Establishing a Carbon Border Adjustment Mechanism, European Commission, Brussels,2021.
[2]Tencent Research Institute, Eu Carbon Border Tax: What is it?Why? How to do, 2021.https://www.tisi.org/17965.
[3]M.Duan, L.Li, Y.Tao, The EU border carbon adjustment mechanism and the potential impact on China’s countermeasures(2021).http://www.3e.tsinghua.edu.cn/cn/article/116.
[4]M.Wang, Z.Ji, W.Kang, et al., Key points, impacts and countermeasures of the carbon border adjustment mechanism of the EU, China Popul.Resour.Environ.31 (12) (2019) 45-52.
[5]A.Zeng, X.Tan, Y.Wang, et al., Impact of EU carbon border adjustment mechanism on China in the context of carbon neutrality and its countermeasures, Chin.J.Environ.Manage.14(1) (2022) 31-37.
[6]Y.Ren, J.Tian, L.Chen, China’s industrial products export trade and the effects of carbon tariffs study, J.Environ.Manage.China 14 (6) (2022) 100-109.
[7]B.Liu, F.Zhao, The impact of EU carbon border adjustment mechanism on China’s exports and countermeasures, J.Tsinghua Univ.(Philos.Social Sci.) 36 (06) (2021), 185-194+210.
[8]W.Ruan, The impact of EU’s carbon border adjustment mechanism on China-Eu trade and its countermeasures, Sci.Dev.2021 (04) (2021) 90-95.
[9]J.Tan, M.Chen, Calculation and analysis of carbon implicit in Sino-European trade based on multi-regional input-output model,Economist 02 (2015) 72-81.
[10]T.Wei, S.Peng, Study on hidden energy and carbon emission transfer in international trade based on multi-regional input-output model, Resour.Sci.39 (01) (2017) 94-104.
[11]H.Wang, Y.Wang, Spillover impact of EU carbon border adjustment mechanism and China’s countermeasures, Fin.Theory Pract.08 (2022) 111-118.
[12]C.Xie, W.Peng, Quantitative Analysis of the Impact of the EU Carbon Border Adjustment Mechanism on China’s Economy and Global Carbon Emission Reduction, Beijing CICC Research Institute, 2021.
[13]Q.An, The adaptability of the carbon border adjustment mechanism & WTO rule and its enlightenment, Int.Petrol.Econ.28 (11) (2020) 10-13.
[14]D.Ren, Impact of EU carbon border adjustment mechanism on China’s renewable energy development and countermeasures,Energy China 44 (04) (2022), 21-28+35.
[15]C.Guo, Impact of carbon border adjustment mechanism on China’s manufacturing sector: a dynamic recursive CGE model based on an evolutionary game, J.Environ.Manage.347 (2023)119029.
[16]B.Lin, H.Zhao, Evaluating current effects of upcoming EU carbon border adjustment mechanism: evidence from China’s futures market, Energy Policy 177 (2023) 113573.
[17]J.Zhong, J.Pei, Carbon border adjustment mechanism: a systematic literature review of the latest developments, Clim.Policy 24 (2) (2023) 228-242.
[18]Ministry of Ecology and Environment.Announcement on the Release of the 2021 Electricity CO2 Emission Factor,2024.https://www.mee.gov.cn/xxgk2018/xxgk/xxgk01/202404/t20240412_1070565.html.
Received 30 June 2024;revised 13 September 2024; accepted 12 November 2024
* Corresponding author.
E-mail addresses:libing-wang@chd.com.cn(L.Wang),ya-wen@geidco.org (Y.Wen), zhangyun@geidco.org (Y.Zhang).
https://doi.org/10.1016/j.gloei.2024.11.017
2096-5117/© 2025 Global Energy Interconnection Group Co.Ltd.Publishing services by Elsevier B.V.on behalf of KeAi Communications Co.Ltd.This is an open access article under the CC BY-NC-ND license(http://creativecommons.org/licenses/by-nc-nd/4.0/).

Libing Wang received a B.S.degree from Xi’an Jiaotong University in 2009 and Ph.D.from Huazhong University of Science and Technology in 2014.Currently, he is working at the Strategic and Development Research Center of China Huadian Corporation Ltd..His research interests include power system planning, power policy analysis and electricity market.

Ya Wen, PhD in Energy Finance, graduated from the University of Duisburg-Essen, Germany.He is employed at Global Energy Interconnection Group Co., Ltd.His research areas include energy finance, electricity market and carbon market.

Yun Zhang, Ph.D.in Engineering, is employed at Global Energy Interconnection Group Co.,Ltd.He has long been dedicated to research on ultra-high voltage direct current (UHVDC)transmission systems, macro-strategic studies on energy transition, and analysis of electricity markets and carbon markets.
(Editor Yajun Zou)
