0 Introduction
With industrial development,environmental pollution caused by the burning of traditional fossil fuels has become a major obstacle to global economic development.Renewable energy generation is considered one of the measures for solving the environmental pollution problem,and its development potential is sufficient to meet the demand for electricity.Compared with other renewable energy sources,solar energy has become the most popular owing to its easy access,abundant reserves,and non-polluting advantages [1-3].Photovoltaic (PV) power generation using solar energy has attracted widespread attention as it relates to modern power grids.
PV power generation depends on many meteorological variables such as solar irradiance,air temperature,cloud cover variations,wind speed,and relative humidity.These meteorological conditions cause PV power generation to be characterized by intermittency,instability,and randomness[4].The large-scale grid connection of PV power plants causes major problems in the grid,such as system stability,reliability,power balance,reactive power compensation,and frequency response [5].Therefore,the accurate prediction of PV output is of great significance for guaranteeing the stability of the power grid.
Traditional PV power prediction methods can be classified into three main categories: physical,statistical,and machine learning [6].The physical method is a deterministic prediction method based on the characteristics of PV cell components and lighting conditions.It predicts the power output of PV power generation by building a physical model based on the operating principles and characterization parameters of the PV cell.In this study,we built a single-diode model based on a five-parameter equivalent circuit [7].This study presents a novel approach for converting an implicit current-voltage (I-V) expression into a double-diode model [8].The study first processed numerical weather prediction (NWP) data using Kalman filtering and then predicted the PV power [9].Satellite images are used to analyze cloud trajectories and predict PV power output [10-12].Statistical methods use curve fitting and hypothesis testing to study the intrinsic patterns of PV power generation,meteorological factors,and time series.A mapping model between the inputs and outputs is established to obtain the output of the PV power generation prediction results.Common statistical methods include regression analysis [13],gray prediction [14],and artificial neural networks (ANNs) [15-17].Machine learning methods use artificial intelligence technology to learn and train a large amount of historical data to obtain a nonlinear model that can adaptively adjust parameters and weights to predict future PV power output.The main techniques for machine learning in PV prediction are long short-term memory(LSTM) and its variants [18,19].Large-scale experiments showed that the hybrid model outperformed the single convolutional neural network (CNN) and LSTM models[20].The paper proposed a combination of gated recurrent units (GRUs) and CNN models for PV power forecasting[21].Another study proposed a model combining k-means ++,an optimal similar-day approach,and an LSTM network [22].
Machine learning methods use large amounts of historical data to automatically train power prediction models to improve accuracy.However,as the number of new PV sites increases,the collection and processing of data for each new site becomes a time-consuming and challenging task.Transfer learning leverages knowledge extracted from different but related problems (source domains) to improve the solution of specific problems(target domains),thereby reducing the amount of labeled data required to train new models.A model combining transfer learning and constrained LSTM was proposed for power prediction for new PV sites [23].A new architecture substructural transfer learning model (STLM) was proposed that incorporates a transfer learning strategy to effectively improve prediction accuracy when there is insufficient data in the target domain [24].However,this is only a preliminary application of transfer learning strategies in classical single models,without further discussion of transfer learning in conjunction with hybrid models capable of extracting multiple types of features.
In this study,a dilated convolutional neural network(DCNN) module is concatenated with a bidirectional long short-term memory (BiLSTM) module and combined with an attention mechanism (AM) to form the DBAM model.The integration of diverse deep learning networks enable the model to accurately extract the temporal and spatial features of the input data and allocate weights to these features based on their relevance to PV forecasting.This enhances the accuracy of the PV power predictions.Moreover,the study employed data from operational PV sites to pretrain a model,which was then deployed for power forecasting at new PV sites,thereby addressing the issue of limited historical operational data for new stations.The experimental results confirm the feasibility of this method.
The structure of this article is as follows: Section 1 presents the composition of the DBAM model.In Section 2,we investigate DBAM using a PV dataset from Alice Springs,Australia.Finally,Section 3 concludes the study.
1 Method
1.1 Inputs and outputs of the model
PV module power generation is highly sensitive to changes in meteorological factors.Of all meteorological factors,solar irradiance has the most significant effect on output power,and high-temperature conditions reduce the efficiency of power generation of PV modules.Atmospheric humidity also affects module temperature by influencing heat dissipation.In addition,past power data often contain important information regarding future power in PV module power prediction.Based on the above analyses,we use meteorological and historical power predictions for the past 12 moments (t k,tk+1,tk+2,...,tk+12) as inputs to predict the power generation of PV modules at a future moment (tk+13).
1.2 DCNN unit
CNNs use convolutional and pooling layers at different stages to perform convolutional and pooling operations such that each feature on top of the final output feature map has the maximum sensory richness for the input information.CNNs can learn complex and abstract feature representations that are highly beneficial for dealing with intricate meteorological conditions and environmental factors in PV power generation forecasting.However,this also increases the number of training parameters.Compared with the traditional CNN,the DCNN increases the receptive field of the convolutional kernel without increasing the number of network parameters by inserting zero values between the elements of the convolutional kernel,so that each output has a wider range of information.
The expression for the DCNN is as follows:
*denotes the convolution operation,X is the input,Y is the output,Kd is the expansion convolution kernel,and the size kd of Kd is determined by the following equation:
where k is the original convolutional kernel size and d is the expansion rate;when d=1,the DCNN has the same effect as the CNN.A schematic representation of the DCNN is shown in Fig.1.
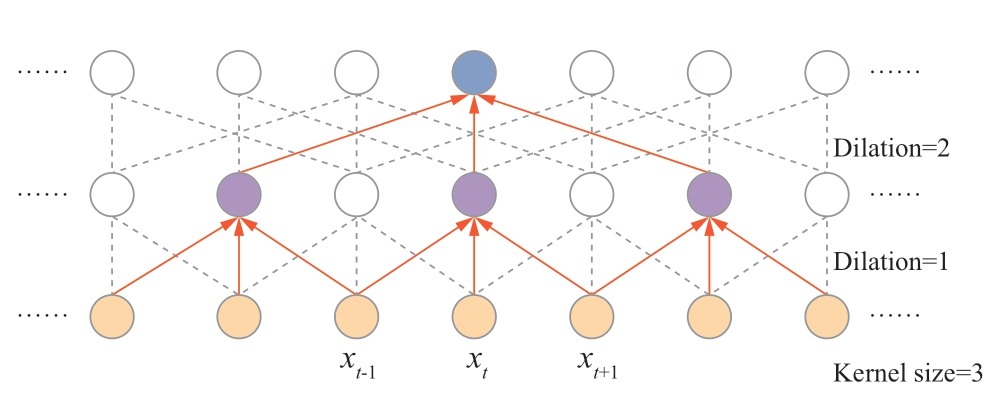
Fig.1 The DCNN structure.
1.3 BiLSTM unit
Traditional recurrent neural networks (RNNs) cannot effectively memorize information over long periods because of the gradient explosion and vanishing problems that occur during the training of long sequences.LSTM introduces a gate mechanism to control the circulation and loss of historical information features,thereby effectively solving the shortcomings of traditional RNNs.As shown in Fig.2,the inputs of an LSTM unit include the cell state ct-1 of the previous moment,the output ht-1 of the hidden node of the previous moment,and the current-moment input xt.These three inputs are first accepted by the LSTM unit and then fed into the three gate structures for processing.ft is called the forget gate and is used to indicate which features of ct-1 are used to compute ct. denotes the cell-state update value,which is computed from the input data xt and the hidden node ht-1,and it is the input gate,which is used to control which features of
  are used for updating ct.Finally,ht is obtained by combining the cell state with the output gate ot.
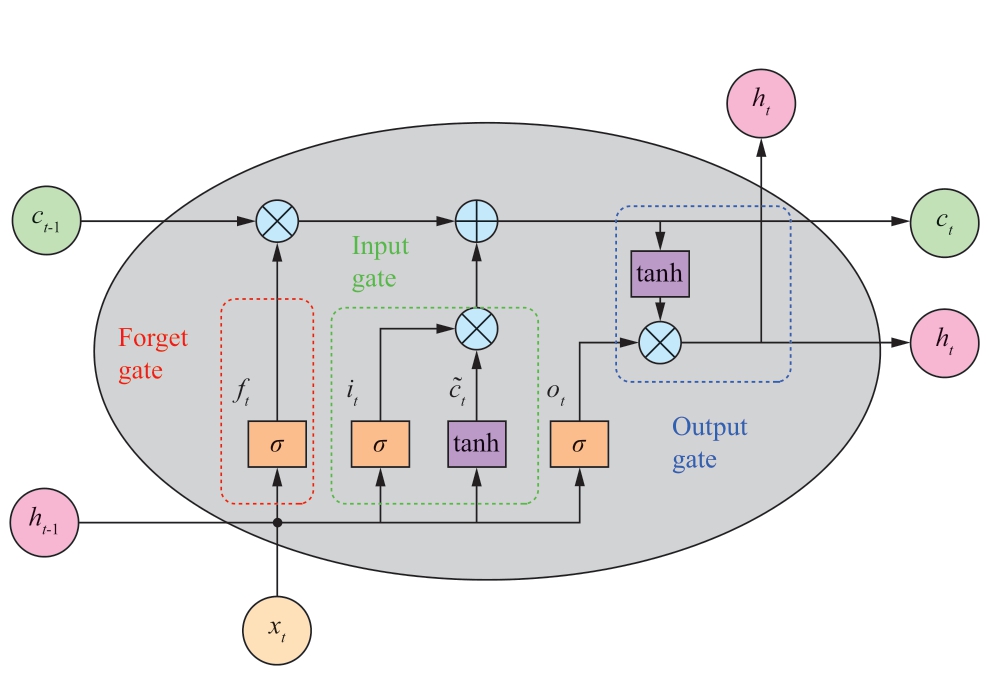
Fig.2 The LSTM cell structure
The power output of PV generation possesses the characteristics of a time series.LSTM networks can learn temporal dependencies within data and feature extractions.In the context of PV power forecasting,this implies that the key factors influencing power generation can be learned automatically from historical data.
The LSTM equations are as follows:
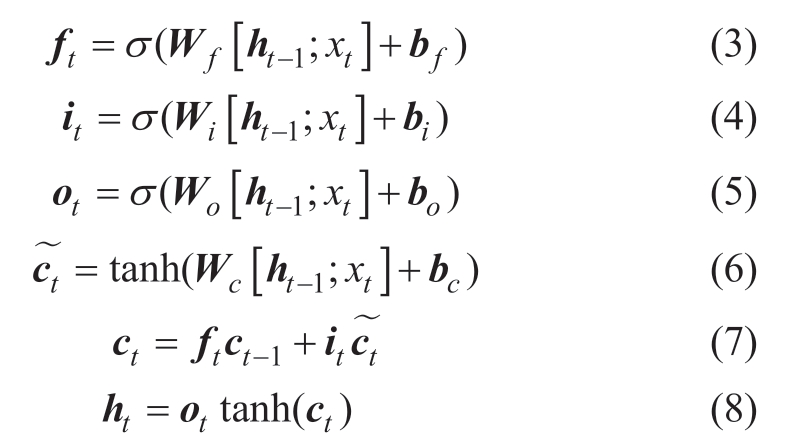
where Wf,Wi,Wo,and Wc are the weight matrices of the LSTM cell structures;bf,bi,bo,and bc are the bias matrices of the LSTM cell structures;ht-1 denotes the state matrix of the hidden layer at the previous moment;xt denotes the inputs,and σ denotes a sigmoid function.
The BiLSTM structure is shown in Fig.3.It consists of two LSTM layers stacked in opposite directions such that each input sequence in forward and reverse passes through a set of RNNs.Thus,the input is provided to both the forward and reverse LSTM layers,and the output is jointly determined using these two LSTM layers.This structure gives each output node complete bidirectional timing information,which gives the model greater nonlinear learning ability and robustness.
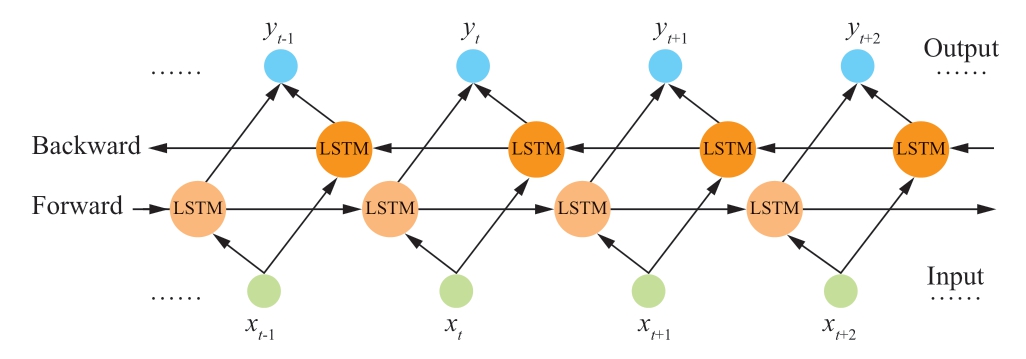
Fig.3 The BiLSTM structure
The LSTM equations are as follows:
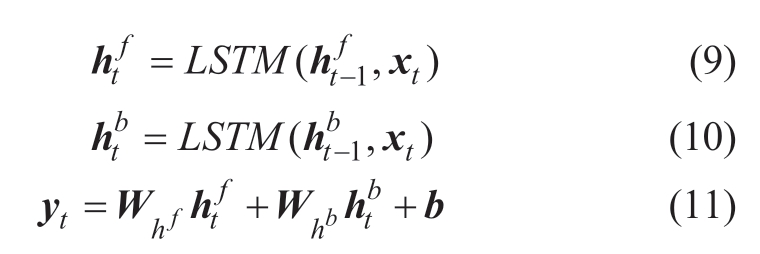
where LSTM represents one LSTM operation,Whf,Whb represent the weight matrices of the forward and backward hidden sequences,respectively.b denotes the bias matrix of the BiLSTM output layer.
1.4 Attention mechanisms combined with LSTM
In traditional time series models,each element of the input series is usually treated with equal weight,and no greater or lesser attention can be given to different elements.The attention mechanism (Fig.4),on the other hand,enables the model to dynamically and selectively focus on different parts of the input sequence by introducing a learnable weight assignment mechanism.In the proposed model,the attention mechanism is combined with an LSTM unit that adaptively focuses on more relevant variables.
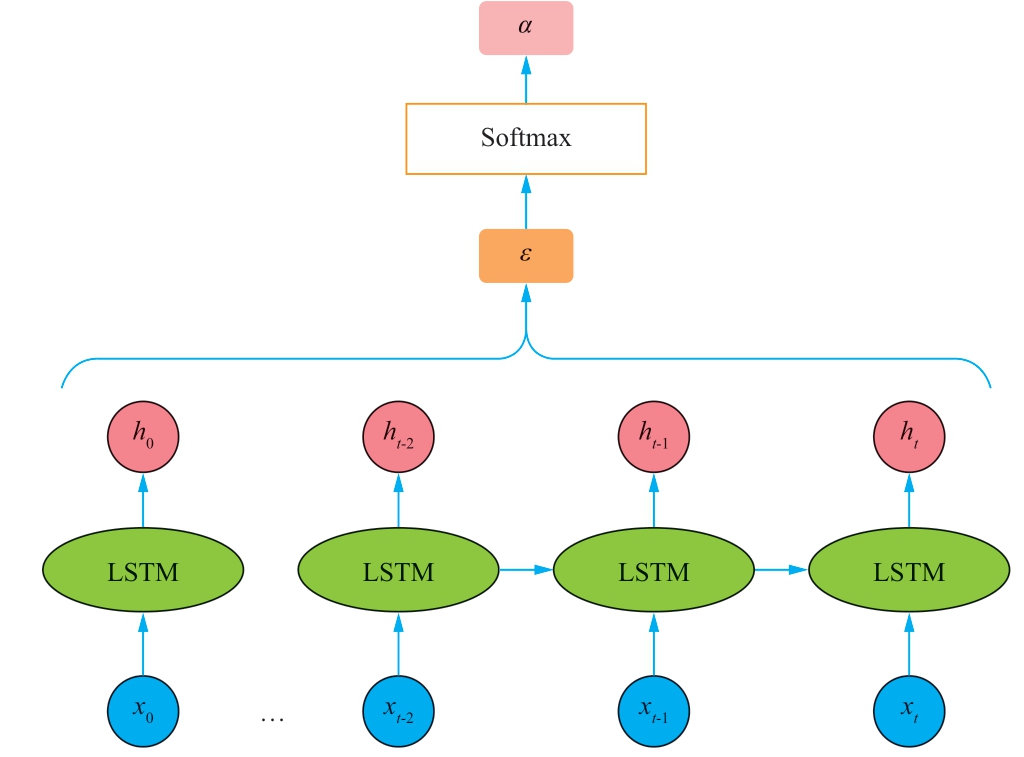
Fig.4 The structure of attention mechanisms combined with LSTM units
DCNNs are primarily used to extract spatial features from data.By integrating them with BiLSTM,they can simultaneously consider information along temporal dimensions.Furthermore,by employing an attention mechanism to allocate weights to the temporal and spatial features,a more comprehensive perspective can be provided for PV forecasting.
1.5 Flow of methods
As shown in Fig.5,the method proposed in this study consists of two steps: model pretraining and model transfer.The PV data were processed before model training and then normalized to the range of 0-1 based on the maximum and minimum values of each feature in the training set.Upon inputting the sample data,the source domain model was meticulously trained by iteratively adjusting the weights and biases across all the network layers to minimize the loss function,which continued until the predefined termination criteria were satisfied.After subjecting the target domain data to the same treatment,the parameters of the pre-trained model were transferred to the target domain model instead of retraining the target domain model with a large amount of target domain data.Thus,the target PV site inherits knowledge from the source PV site without using a training dataset.Then,the power prediction for the target domain PV site was performed using the source domain pre-trained model.
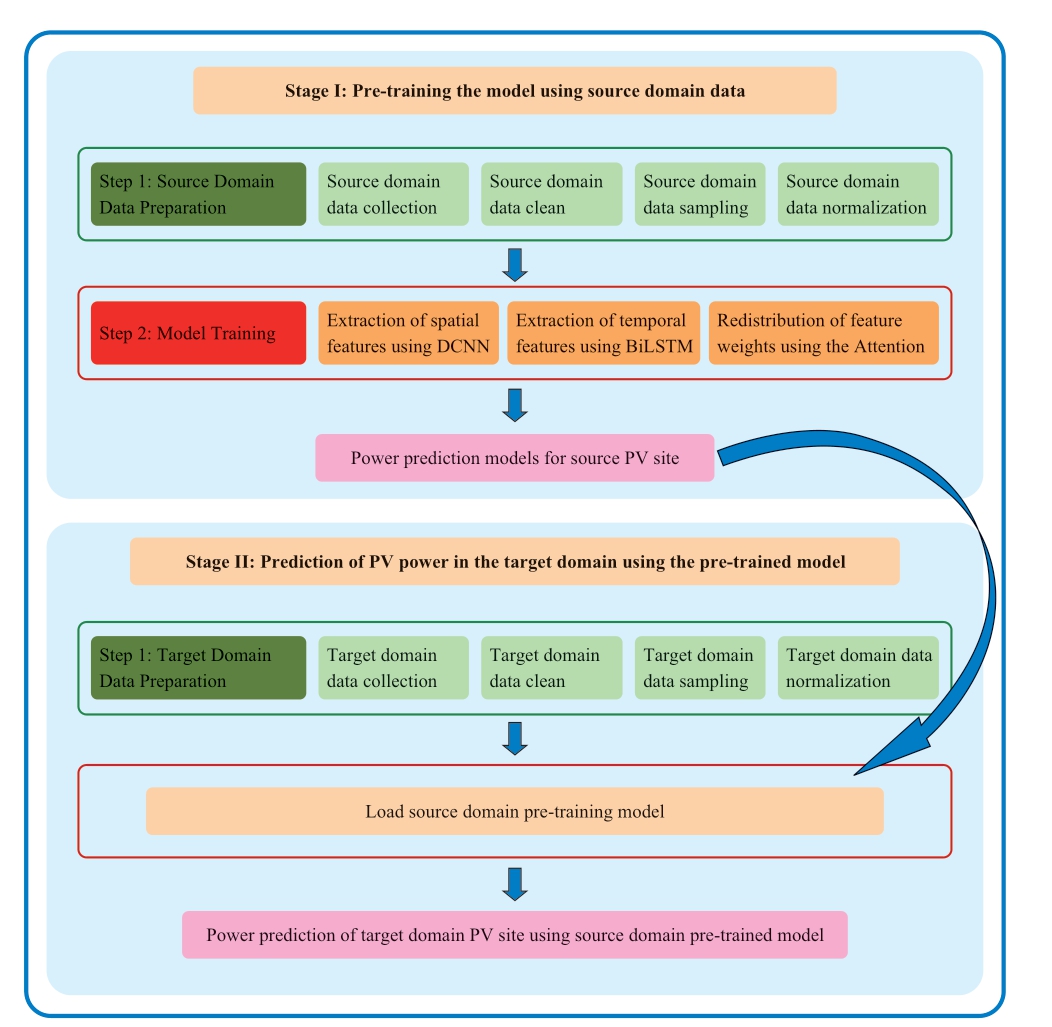
Fig.5 The flowchart of the method used in this study
2 Result
2.1 Description of data sets
The data used in this study were provided by the Desert Knowledge Australia Solar Centre (DKASC) in Alice Springs,Australia.This PV plant was commissioned in 2008 and provides a realistic demonstration of different solar power technologies.
The recorded data included historical active power (kW),atmospheric temperature (°C),relative humidity (%),global horizontal radiation (GHR,W/m2),and diffuse horizontal radiation (DHR,W/m2).The time resolution was set to 5 min.
In this study,the operational data from five PV sites for the whole year of 2021 were used.These five PV sites were numbered as No.1A,No.1B,No.2,No.3,and No.6.PV sites No.1B,No.2,No.3,and No.6 were used as the source PV sites,and PV site No.1A was used as the target PV site.The locations and technical specifications of the PV sites are shown in Fig.6 and Table 1.
Table 1 The technical specifications of PV sites used in the studies
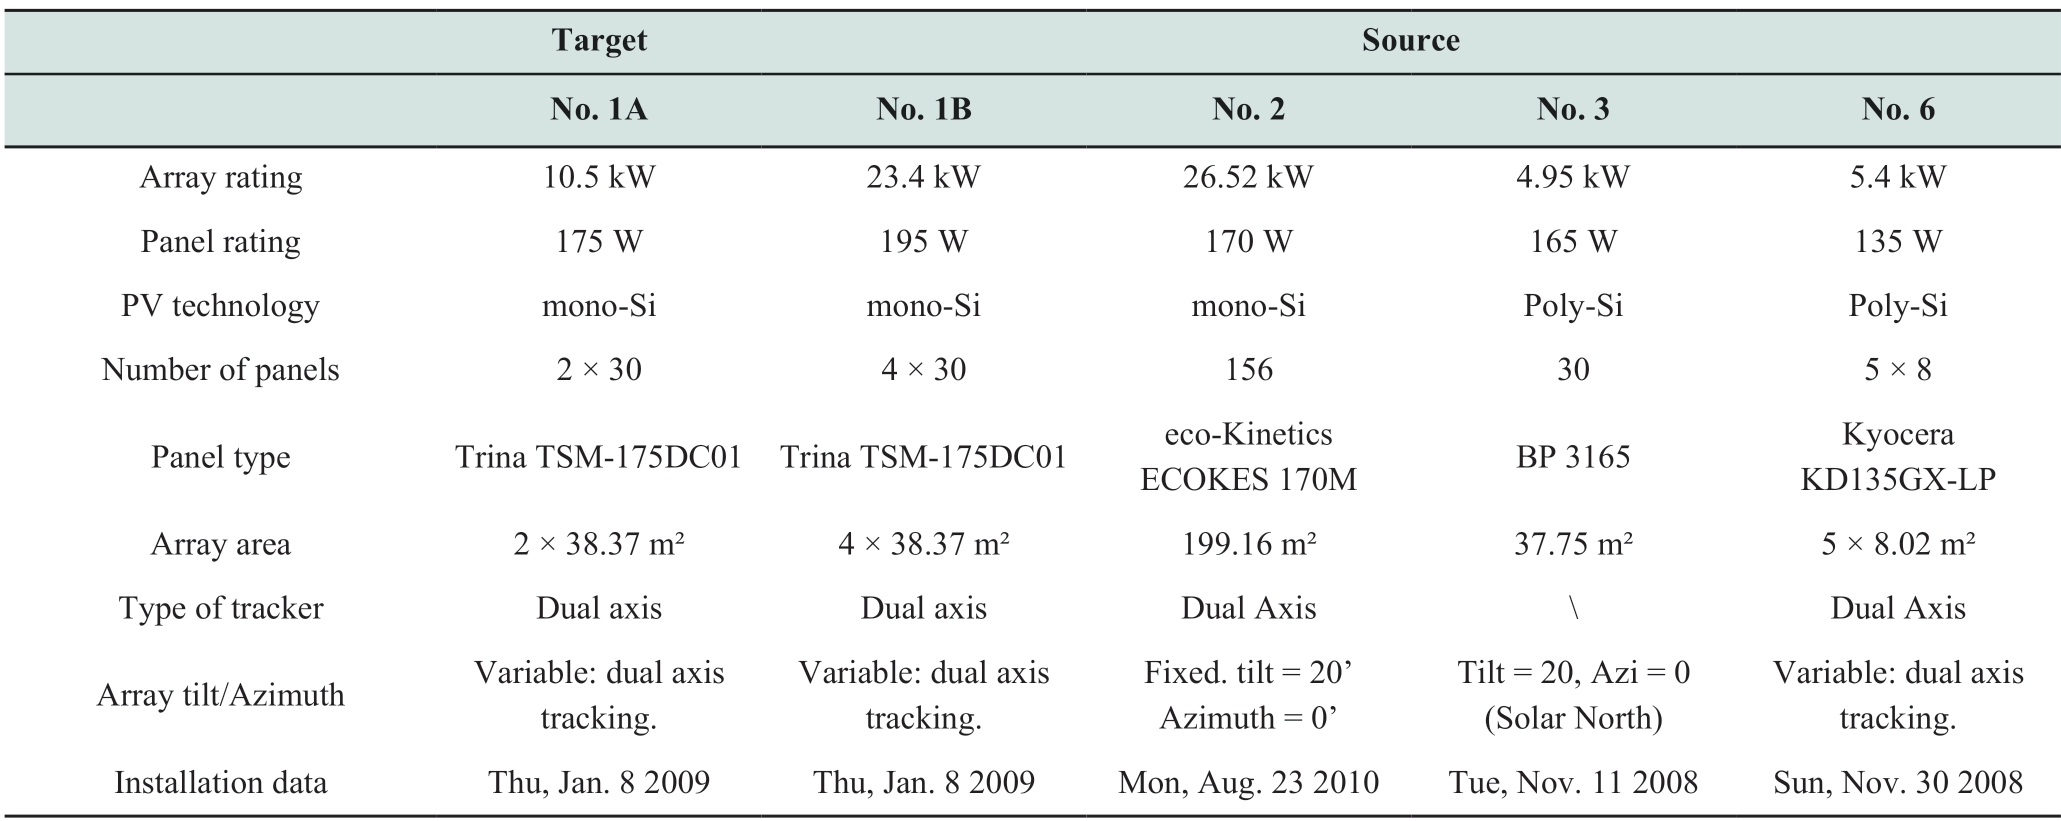
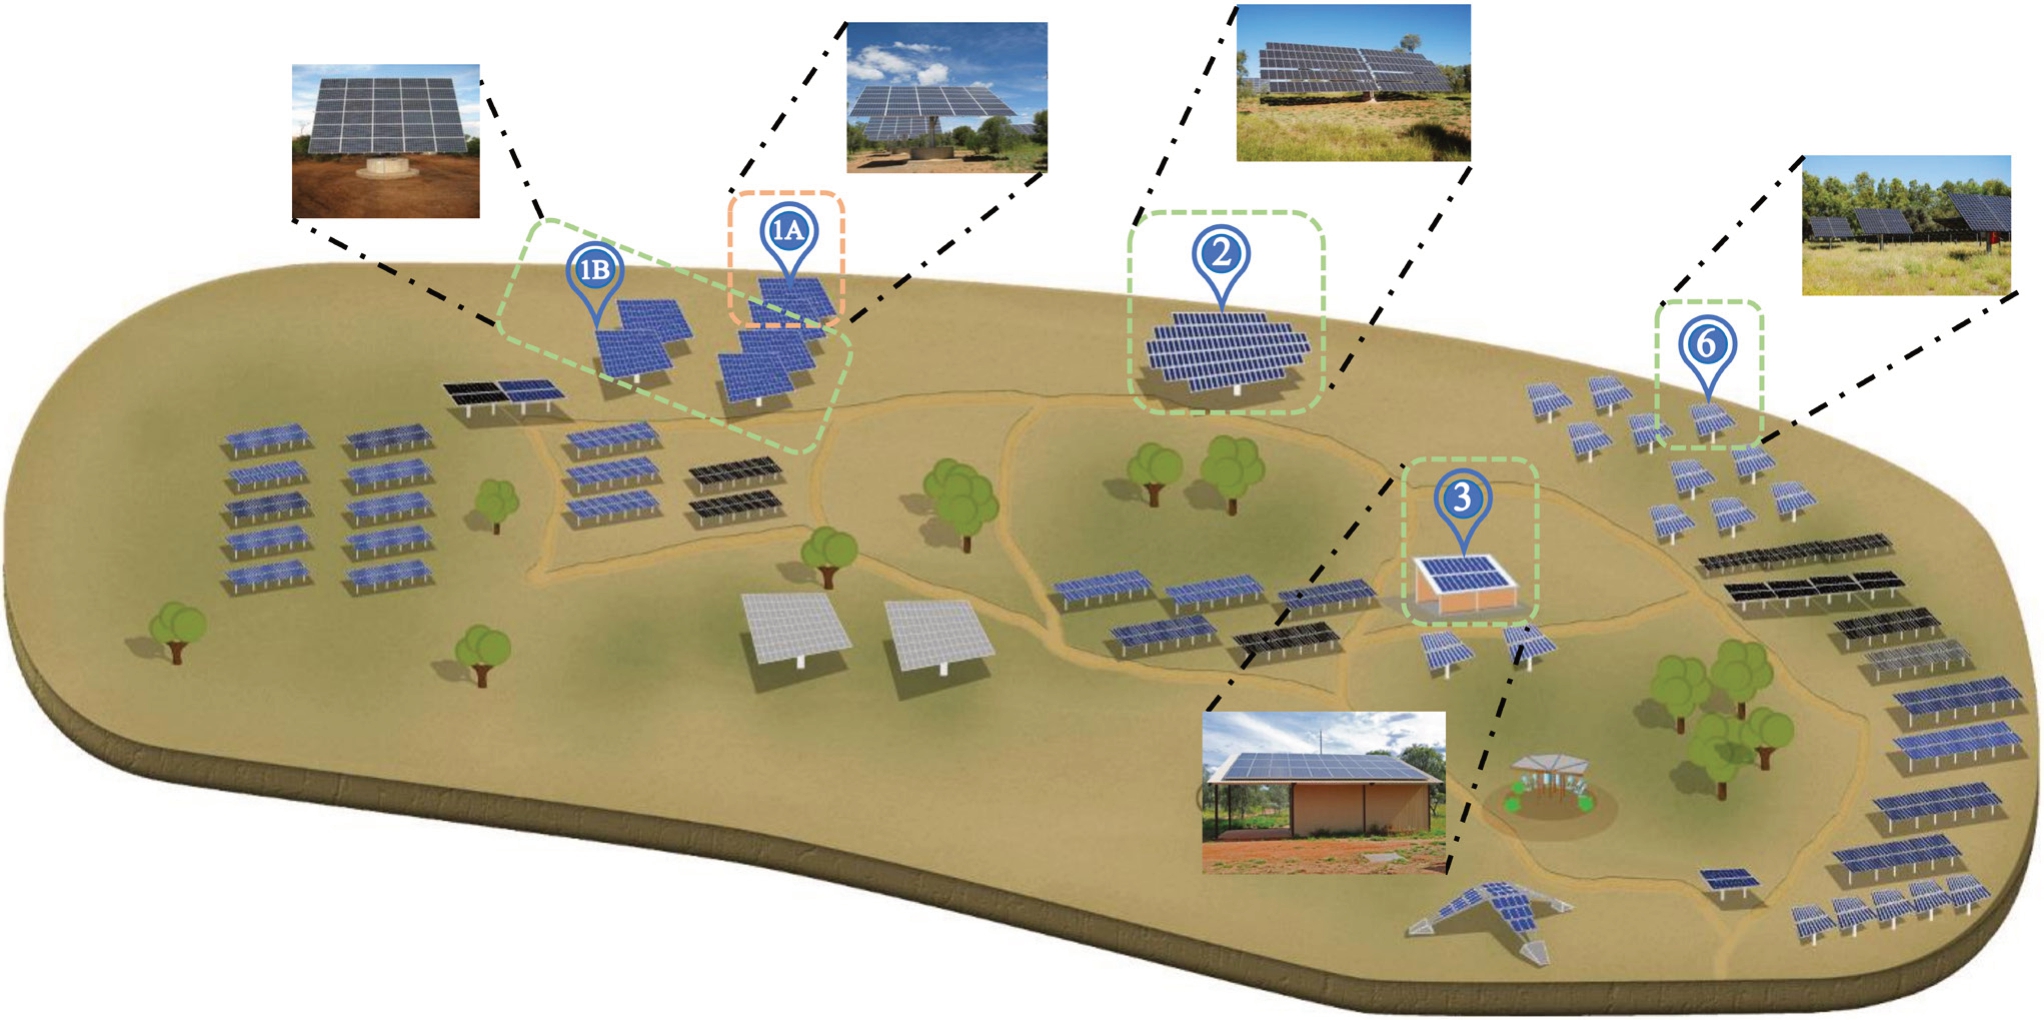
Fig.6 The map of Alice Springs and site locations of five applied PV sites
Because the power output of the PV station is zero during the night,the data used in this study are limited to daytime,and output power less than zero is deleted.In addition,sampling points with missing meteorological and power data were excluded.For sampling points with partial data,whether meteorological or power data,missing values were interpolated using linear interpolation.
2.2 Performance metrics
In this study,four different metrics were used to evaluate the prediction models: mean absolute error (MAE),mean squared error (MSE),root mean squared error(RMSE),and R2.MAE is used to measure the absolute error between the predicted PV module output power and the actual measured power by the different models;the smaller the value of MSE,the more accurate the prediction model is in describing the experimental data.RMSE focuses on measuring the root mean squared difference between the predicted value and the true value,and R2 denotes how well the model fits the data.The four performance metrics are defined as follows:
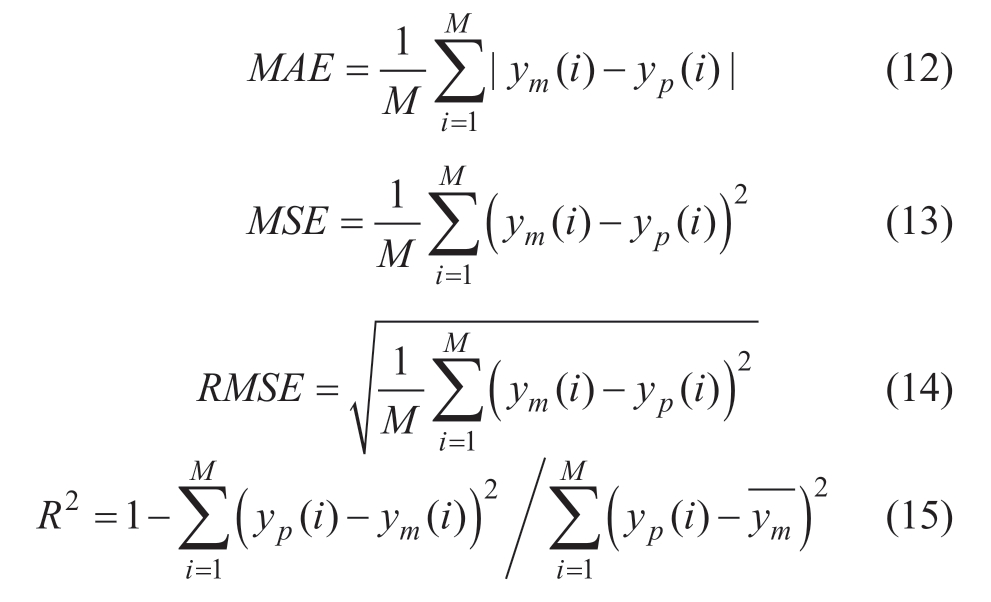
where y m(i ) and y p(i) represent the i-th measured value and predicted power,respectively; represents the mean value of the measured power;and M represents the number of prediction points.
2.3 Implementation details
For the source PV site,data from January 1 to 20 were used as the training set,data from January 21 to 25 were used as the validation set,and data from January 26 to 31 were used as the test set.For the target PV site,data from April 10 to April 17 were used as the test set,data from April 5 to April 9 were used as the test set data,and the training set consisted of data from April 15 rolled forward L days (L=1,2,3,4,5,6,10,20).The details used for parameter training were the number of epochs set to 200,batch size set to 10,learning rate set to 0.001,MSE chosen as the loss function,and the Adam optimizer used to minimize the loss function.
2.4 Performance of different power prediction models
Figure 7 visually depicts the MSE,MAE,and RMSE for the different power prediction models for PV site No.3.As shown in Fig.7,the DCNN has the largest error between the predicted power value and the power measurement value,with the MSE,MAE,and RMSE reaching 0.0648,0.1877,and 0.2546,respectively.In addition,the CNN had the second-largest error in power prediction after the DCNN,with MSE,MAE,and RMSE reaching 0.0648,0.1877,and 0.2546,respectively.These results indicate that the PV power cannot be predicted with high accuracy using only convolutional deep learning networks.In contrast,LSTM,BiLSTM,DCNN-BiLSTM,and DBAM showed a significant reduction in the error between the power prediction value and the power measurement value.DBAM had the smallest RMSE value of 0.1595 and its RMSE value decreased by 0.17% to 2.38% compared to the conventional model.This result indicates that DBAM has the highest power accuracy among all the models.
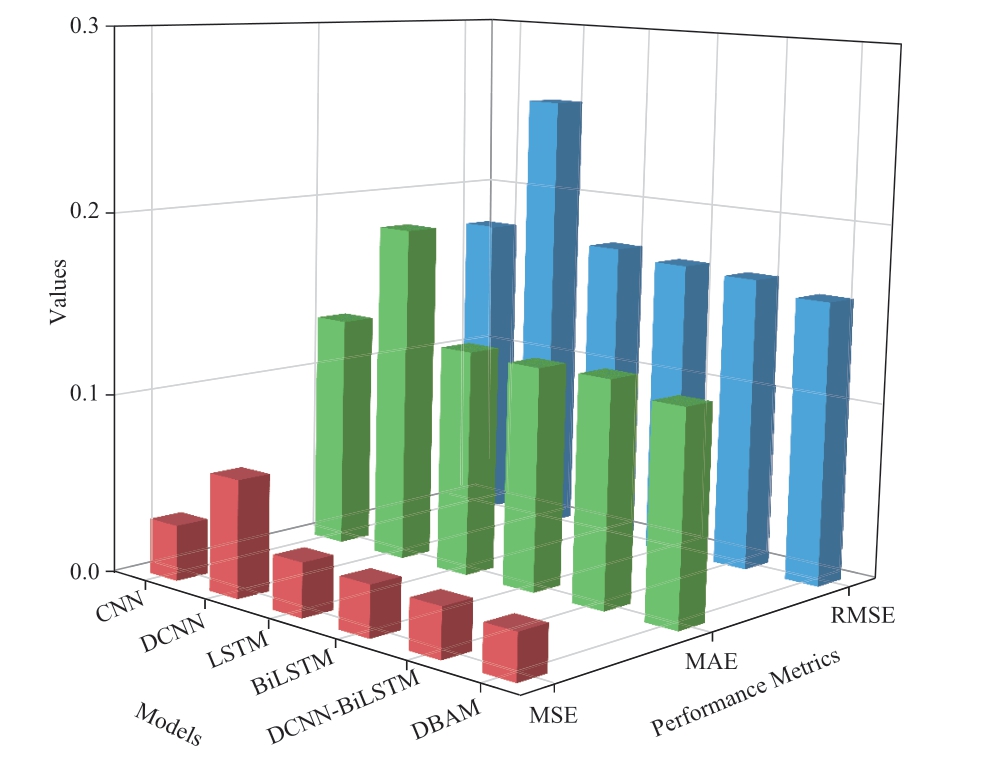
Fig.7 The MSE,MAE,and RMSE for different power prediction models on the No.3 PV site
Figure 8 shows the power prediction images of the six models and a comparison with the actual values on the prediction date of January 26 (a cloudy day).Figure 9 depicts the distribution of absolute errors between the power predictions and actual values for the six models.
As shown in Fig.8,the CNN and DCNN models exhibited significant errors when the weather conditions changed significantly.The power predictions of the other four models were closer to the actual PV module power measurements.The accurate extraction of temporal features can more effectively enhance the accuracy of PV power forecasting under adverse weather conditions.Among these four models,the power predicted using DBAM showed a better fit with the measured power.As shown in Fig.9,the CNN,DCNN,and DCNN-BiLSTM models have a wider distribution of prediction errors and larger outliers than the CNN and DCNN models.By contrast,most of the prediction errors of DBAM are concentrated within a small range,indicating that the DBAM model has good prediction stability.Meanwhile,the DBAM model had the smallest MAE in the predicted power,and most of the errors were concentrated below 0.2 KW.The reason for this phenomenon is that,by reconstructing the weights of different features through the attention mechanism,interference from drastic changes in weakly correlated features is avoided.This result demonstrates the excellent performance of the proposed method on cloudy days.
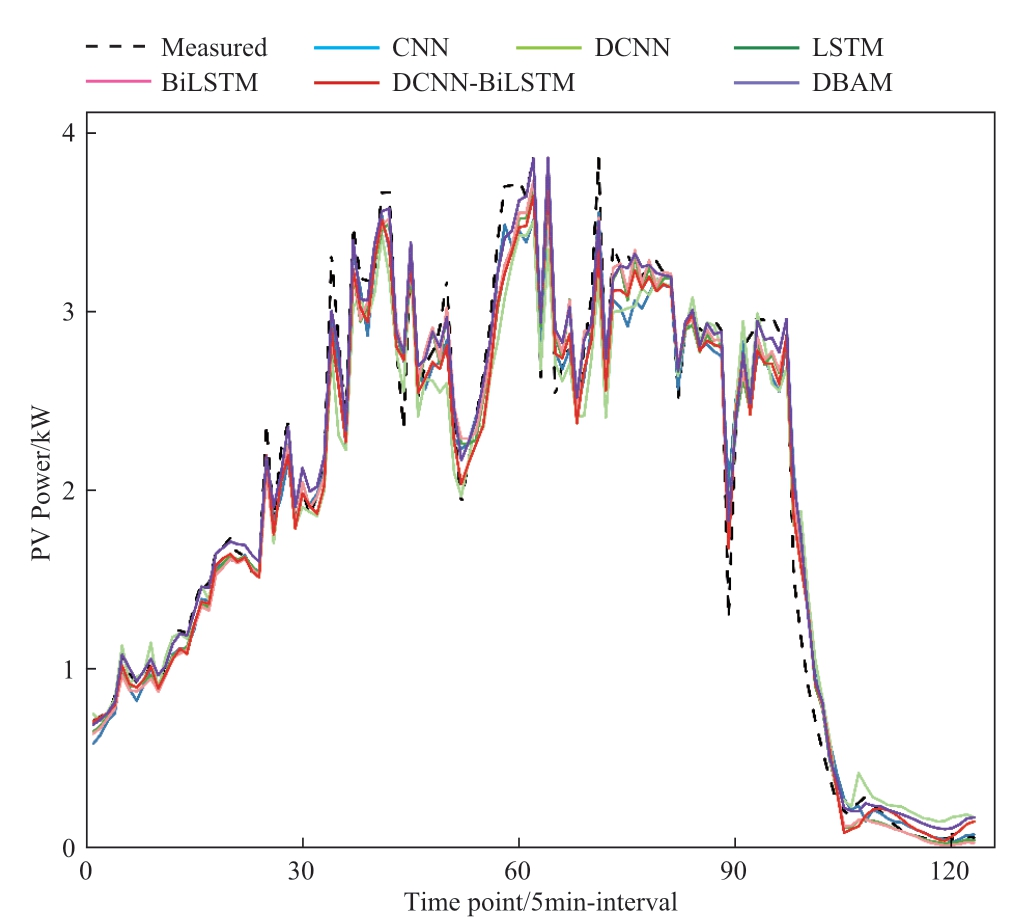
Fig.8 The forecasting power curves of different models on cloudy days for the No.3 PV site
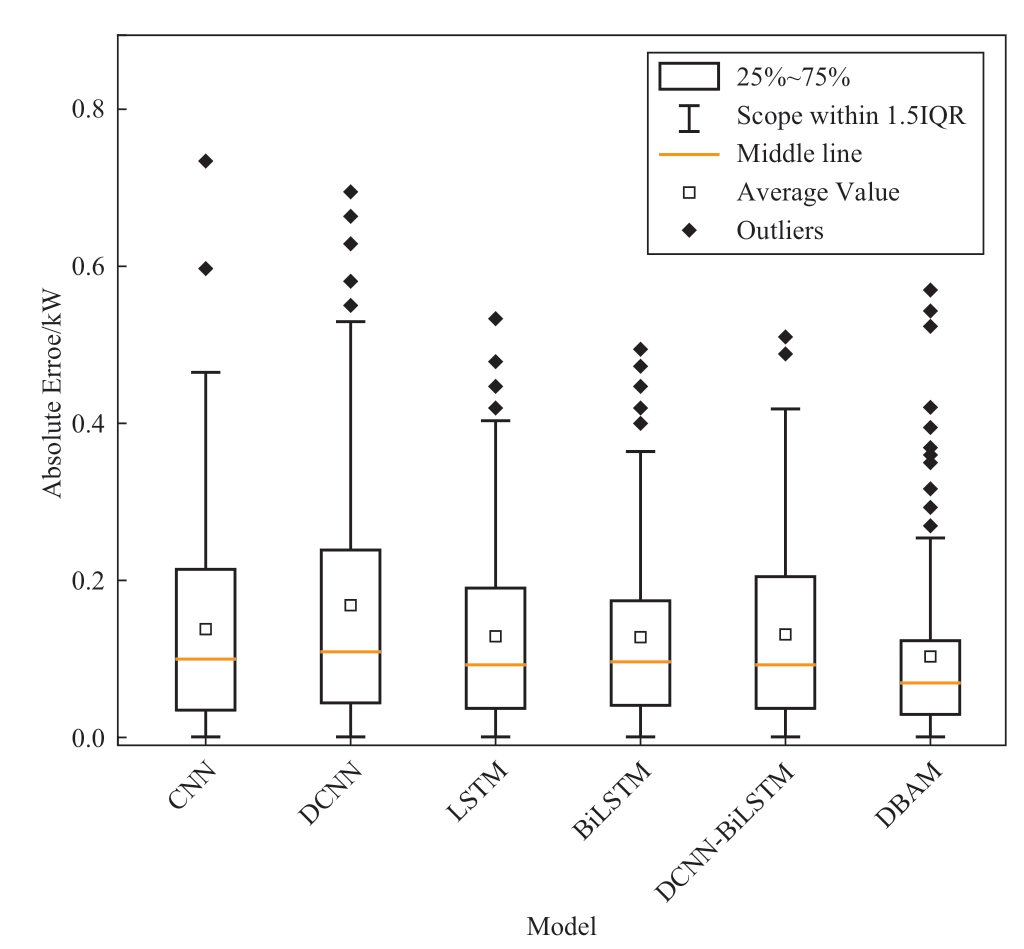
Fig.9 The forecasting power absolute errors of different models on cloudy days for the No.3 PV site
Table 2 lists the MAE,RMSE,MSE,and R2 of different models on cloudy days.Further observation of Table 2 reveals that the R2 between the predicted and actual values for DBAM reaches 0.9841,which further demonstrates the accuracy of the DBAM model under cloudy conditions.
Table 2 The MAE,RMSE,MSE,and R2 of different models on cloudy days for the No.3 site
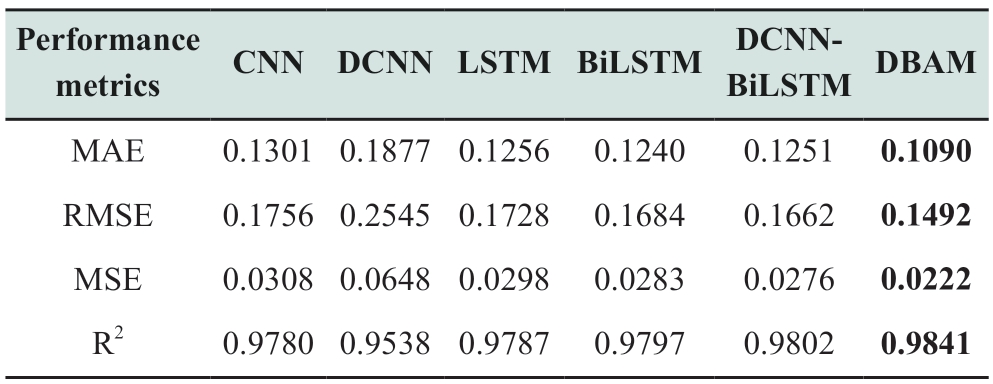
Figure 10 depicts the power prediction images of the six models on February 17 (sunny day) and compares them with the actual values.Figure 11 depicts the distribution of absolute errors between the power predictions and actual values for the six models.
As shown in Fig.10,the prediction accuracies of the six models improved under sunny weather conditions relative to cloudy days with dramatic weather changes.The predicted power of the DCNN-BiLSTM and DBAM models was closer to the measured power during periods of high irradiance than that of the CNN,DCNN,LSTM,and BiLSTM models.The results indicate that the complementarity between spatial and temporal features enriches feature representation and improves forecasting capability when compared to single models.This can help improve the planning and management of the system.In Fig.11,DBAM has the smallest mean absolute error of the predicted power.DBAM can rationally allocate the weights of temporal and spatial features based on their relevance to PV forecasting,rather than treating each input factor equally.This makes DBAM superior to the other models in terms of accuracy and stability.
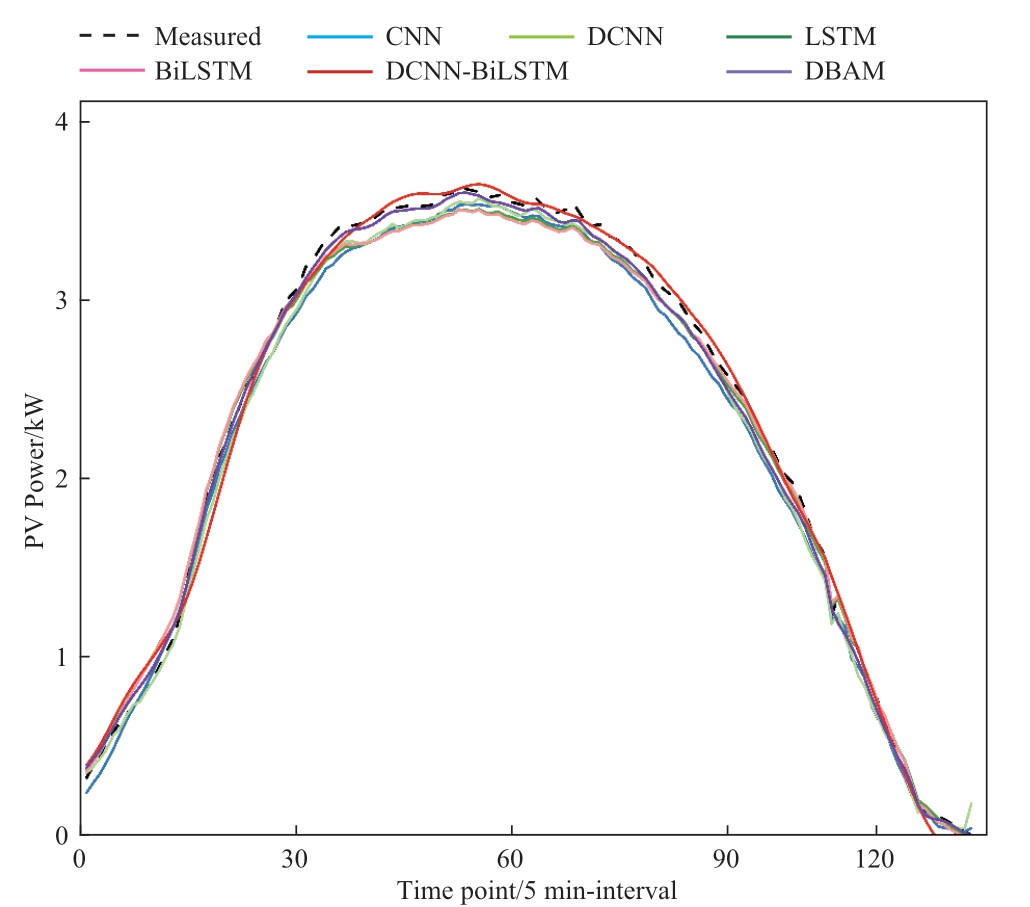
Fig.10 The forecasting power curves of different models on sunny days for the No.3 PV site
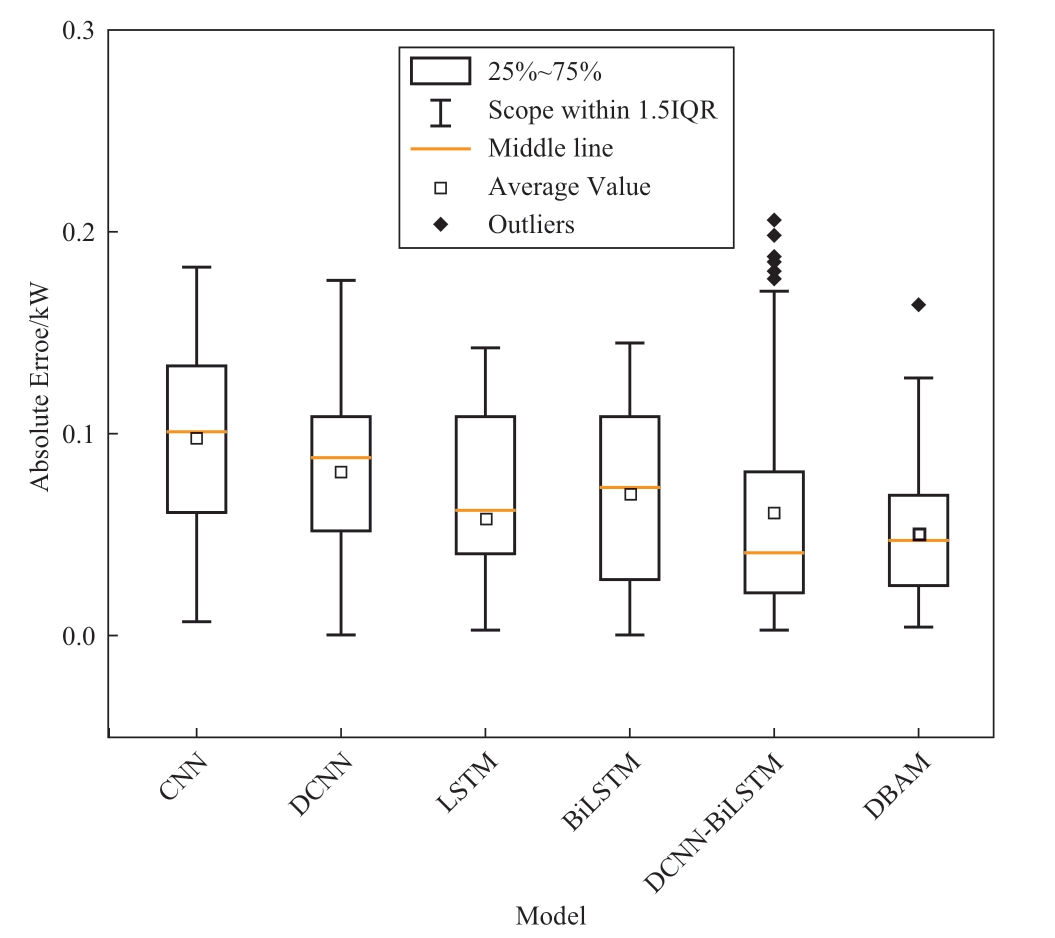
Fig.11 The forecasting power absolute errors of different models on sunny days for the No.3 PV site
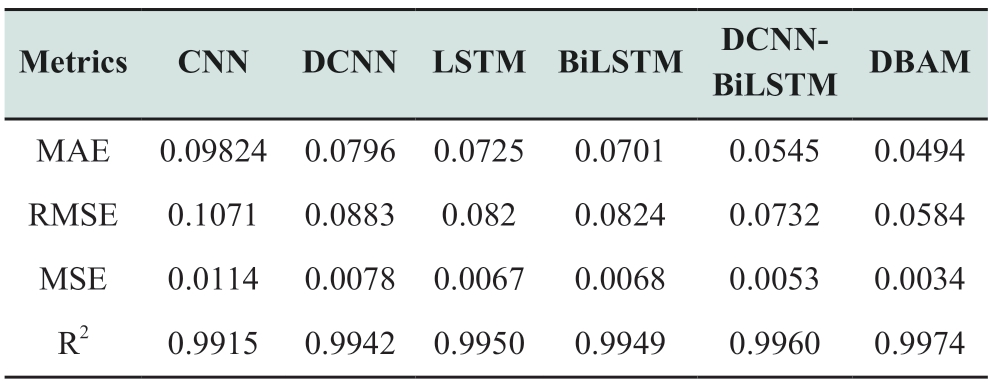
Table 3 lists the MAE,RMSE,MSE,and R2 of different models on sunny days.The R2 of each model listed in Table 3 is above 0.99,indicating high prediction performance for each model on sunny days.The R2 of the DBAM model is 0.9974,indicating the applicability of this model.
Table 3 The MAE,RMSE,MSE,and R2 of different models on sunny days for the No.3 site
2.5 Performance of the pre-trained models
To compare the performance of the pre-trained models in different source domains with the model training using the target domain data,data from site No.1A from April 10 to April 17 were used as the test set.In Fig.12,the straight lines depict the RMSEs for the pre-trained models with four source domains for different models,whereas the orange line shows the change in the performance status of the models trained using different amounts of target domain data.
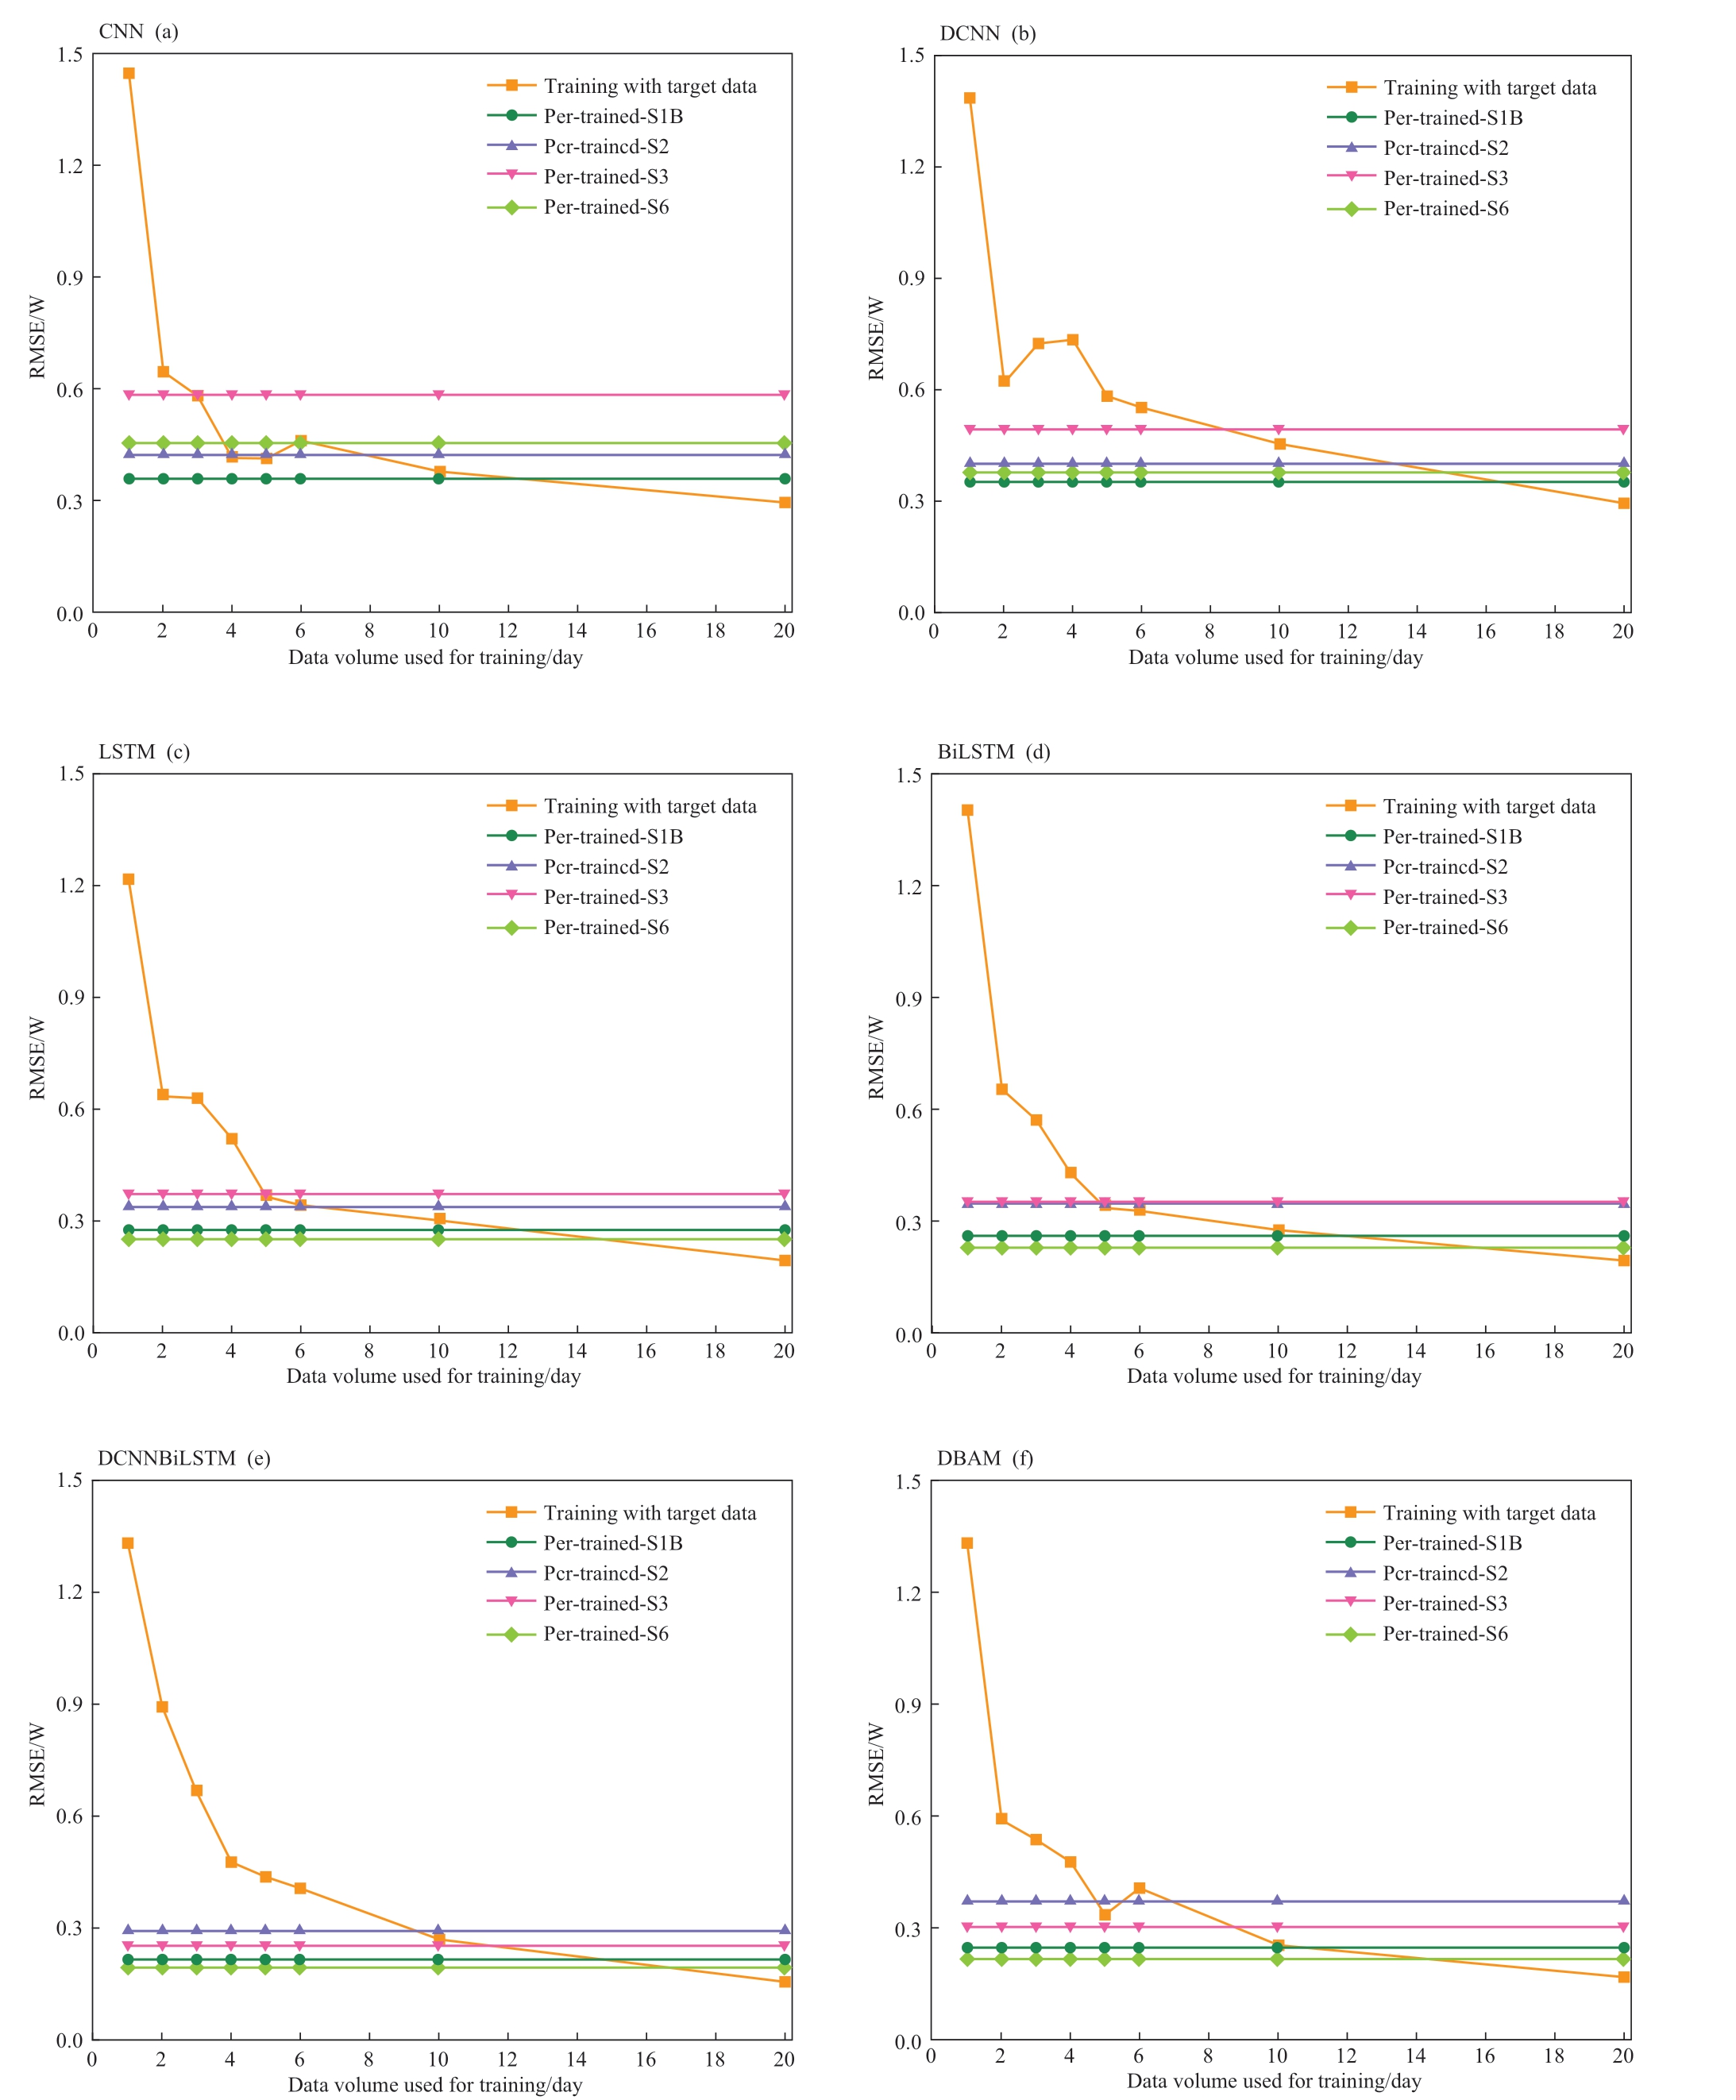
Fig.12 The RMSE of pre-trained models and direct training models with a different number of training set samples
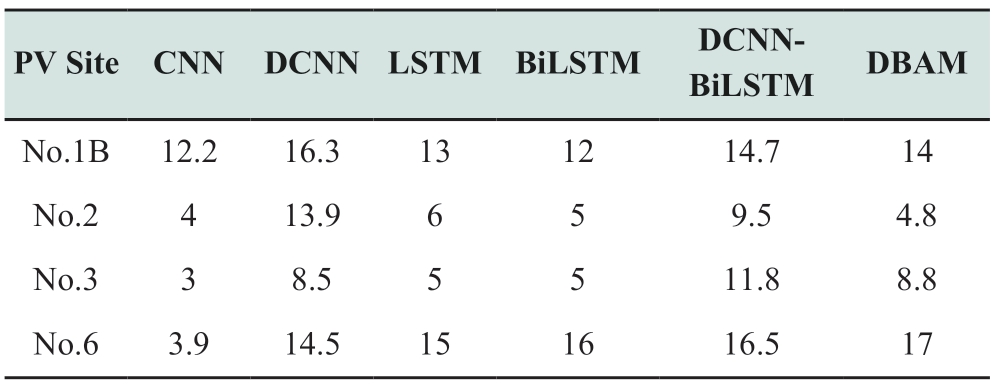
For clarity,the pre-trained model is denoted as Pretrained-S(the number),where the number following S indicates the PV site from which the source domain data were used.Training the model using the target domain data is denoted as the training using the target data (TWTD)model.The amount of data in the training set was measured in days and denoted by n.For example,n=1 indicates that the data from one day were used to train the model.Table 4 lists the amount of data required for the TWTD model performance to exceed the best of the pre-trained models.
Table 4 The number of samples used for TWTD outperform pre-trained models with different architectures (in day)
The results in Fig.12 illustrate that the models pretrained using data from different source domains exhibited varying performances on the same target domain.
In Fig.12(a),the Pre-trained-S1B model demonstrates the highest prediction accuracy for the target domain among all the CNN pre-trained models.Additionally,the Pretrained-S1B model outperformed the TWTD model when training involved 10 or fewer days.The RMSE curves of the Pre-trained-S1B model intersect those of the TWTD model when the PV station data equal 12 days.In Fig.12(b),the best performance of the DCNN pre-trained model is still the Pre-trained-S1B,and when the number of training days is 16.3,the Pre-trained-S1B for the DCNN intersects the RMSE curve of the TWTD model.In Figs.12(c) and (d),the Pre-trained-S6 LSTM and BiLSTM models demonstrate the highest prediction accuracy in the target domain,with an RSME of 0.2445 and 0.2349,respectively.When the amount of data in the training set n=15,Pre-training-S6 of the LSTM model intersects the RMSE curve of the TWTD model.When the amount of data in the training set n=16,the Pre-training-S6 of the BiLSTM model intersects the RMSE curve of the TWTD model.The accuracy of the LSTM and BiLSTM Pre-trained models substantially improved over that of the CNN and DCNN pre-trained models.As shown in Figs.12(e) and (f),the Pre-trained-S6 model also had the highest prediction accuracy in the target domain for DCNN-BiLSTM and DBAM.The RMSE curves of the Pretrained-S6 model and TWTD models intersected at n=15 and n=18,respectively.DBAM intersects earlier,indicating that the proposed model has a faster adaptive capability.In addition,the migration effects of the different source domain pre-training models were not the same,with the S1B pre-training model having the highest accuracy among the CNN and DCNN models.However,in LSTM,BiLSTM,DCNN BiLSTM,and DBAM models,the Pre-trained-S6 model has the highest accuracy and the Pre-trained-S1B model has the second highest accuracy.This suggests that the spatial features of S1B were highly correlated with those of S1A,whereas the temporal features of S6 were strongly correlated with the temporal features of S1A.
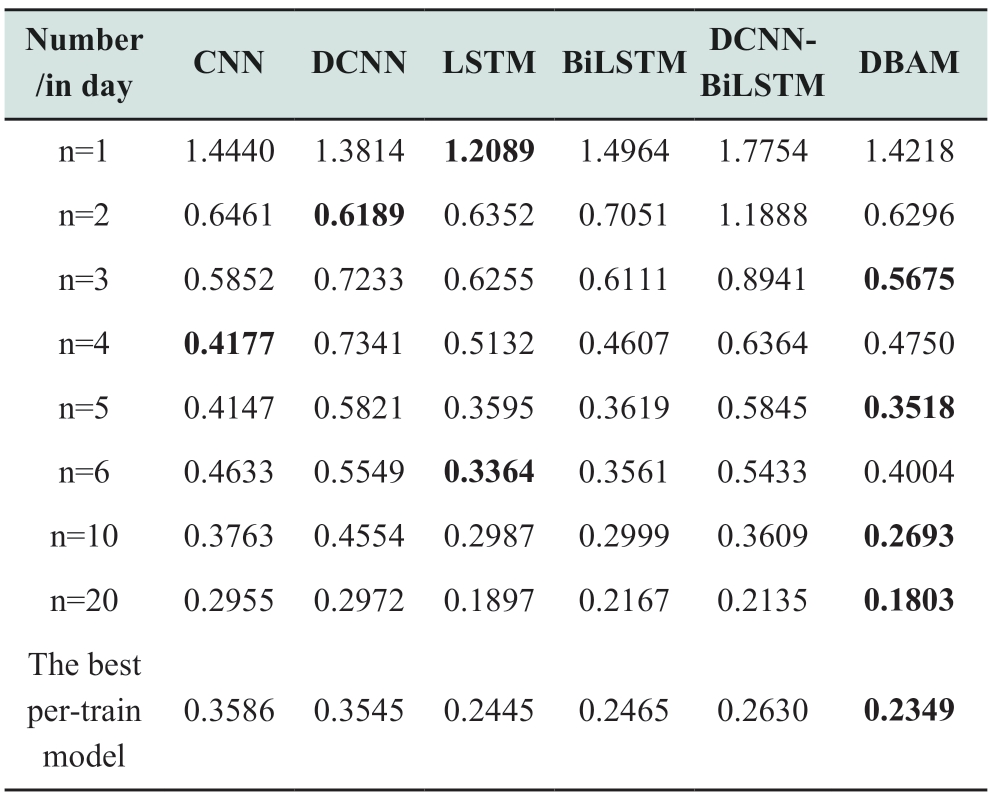
Table 5 lists the RMSE of the best pre-trained model with different architectures and the TWTD model with different numbers of training set samples.Table 5 illustrates that for all deep learning models,the best pre-trained models can significantly enhance the predictive accuracy of the models when the amount of data in the training dataset is less than 10 days.This indicates that the use of pre-trained models can address the issue of insufficient prediction precision at PV sites that lack operational data.In addition,it can be found that the DBAM Pre-trained-S6 model has the best performance among all the pre-trained models.
Table 5 The RMSE of the best pre-trained model with different architectures and TWTD model with different training set sample size
3 Conclusion
In this study,DBAM was proposed to address the PV power prediction problem.DBAM initially utilizes a DCNN to extract spatial features from the input information using a wider sensory field.Subsequently,the extracted spatial features serve as inputs to the BiLSTM module to further extract the temporal features,and weights are then assigned to the temporal features extracted by BiLSTM using the attention mechanism to obtain the final prediction results.Additionally,for new PV sites,we compared the performance of pre-training the model using different source domain data and training the TWTD model using different amounts of target domain data.The results show that using the pre-trained DBAM model is more efficient for new PV sites that are in operation for less than 17 days,and the use of the TWTD model for power prediction is more efficient when new PV sites are in operation for longer durations.The experimental results showed that using the pre-training model can solve the problem of insufficient prediction accuracy caused by a lack of operational data for PV stations.
Additionally,the research findings indicate that pretrained models trained with data from different source domains exhibit varying prediction accuracies within the same target domain.Identifying the source domain with the highest feature match is the next objective of our research.
Acknowledgments
This work was supported by Science and Technology Project of State Grid Ningxia Electric Power Co.,Ltd Research on Distributed Photovoltaic Fine Power Prediction Technology for Day-Ahead Scheduling,5229NX230007.The authors thank the experimental data offered by Desert Knowledge Australia (DKA) Solar Centre sincerely.
Declaration of Competing Interest
We declare that we have no conflict of interest.
References
[1] Liu C C,Li M,Yu Y J,et.Al (2022) A review of multitemporal and multispatial scales photovoltaic forecasting methods.IEEE access,10: pp.35073-35093
[2] Schuss C,Fabritius T,Eichberger B,et al.(2020) Impacts on the output power of photovoltaics on top of electric and hybrid electric vehicles.IEEE Transactions on Instrumentation and Measurement,69(5): 2449-2458
[3] Ahmed R,Sreeram V,Mishra Y,et al.(2020) A review and evaluation of the state-of-the-art in PV solar power forecasting:techniques and optimization.Renewable and Sustainable Energy Reviews,124: 109792
[4] Wang X Y,Sun Y L,Luo D,et al.(2022) Comparative study of machine learning approaches for predicting short-term photovoltaic power output based on weather type classification.Energy,240: 122733
[5] Datta M,Senjyu T,Yona A,et al.(2011) A frequency-control approach by photovoltaic generator in a PV-diesel hybrid power system.IEEE Transactions on Energy Conversion,26(2): 559-571
[6] Wang H,Zhang N,Du E,et al.(2022) A comprehensive review for wind,solar,and electrical load forecasting methods.Global Energy Interconnection,5(1): 9-30
[7] Soto W D,Klein S A,Beckman W A (2006) Improvement and validation of a model for photovoltaic array performance.Solar Energy,80(1): 78-88
[8] Kumar S,Sahu H S,Nayak S K (2019) Estimation of MPP of a double diode model PV module from explicit I-V characteristic.IEEE Transactions on Industrial Electronics,66(9): 7032-7042
[9] Yang Y,Yu T Y,Zhao W G,et al.(2021) Kalman filter photovoltaic power prediction model based on forecasting experience.Frontiers in Energy Research,9: 682852
[10] Han S J,Bae K Y,Park H S,et al.(2016) Solar power prediction based on satellite images and support vector machine.IEEE Transactions on Sustainable Energy,7(3): 1255-1263
[11] Rosiek S,Alonso-Montesinos J,Batlles F J (2018) Online 3-h forecasting of the power output from a BIPV system using satellite observations and ANN.International Journal of Electrical Power &Energy Systems,99: 261-272
[12] Kim B W,Suh D J,Otto M O,et al.(2021) A novel hybrid spatio-temporal forecasting of multisite solar photovoltaic generation.Remote Sensing,13(13): 2605
[13] Jung A H,Lee D H,Kim J Y,et al.(2022) Regional photovoltaic power forecasting using vector autoregression model in South Korea.Energies,15(21): 7853
[14] Zhong Z F,Yan C Y,Zhang T J,et al.(2014) Design of photovoltaic power generation forecasting model based on multivariable grey theory.Advanced Materials Research,953-954: 3-7
[15] Zhu J Z,Miao Y W,Dong Z Y,et al.(2023) Short-term load forecasting method based on Attention-LSTM and multi-model integration.Electric Power Engineering Technology,42(5): 138-147
[16] Huang D M,Zhang N N,Hu A D,et al.(2023) Spatial load forecasting method based on double-layer XGBoost and data enhancement.Electric Power Engineering Technology,42(1):201-208
[17] Pamain A,Rao P K,Tilya F N (2022) Prediction of photovoltaic power output based on different non-linear autoregressive artificial neural network algorithms.Global Energy Interconnection,5(2): 226-235
[18] An Y J,Lee T K,Kim K H (2021) Prediction of photovoltaic power generation based on LSTM considering daylight and solar radiation data.The Transactions of the Korean Institute of Electrical Engineers,70(8): 1096-1101
[19] Jatin S,Soni S,Paliwal P,et al.(2022) A novel long term solar photovoltaic power forecasting approach using LSTM with Nadam optimizer: A case study of India.Energy Science &Engineering,10(8): 2909-2929
[20] Wang K J,Qi X X,Liu H D (2019) A comparison of day-ahead photovoltaic power forecasting models based on deep learning neural network.Applied Energy,251: 113315
[21] Sabri M,Hassouni E M (2022) A novel Deep Learning Approach for Short Term Photovoltaic Power Forecasting Based on GRUCNN Model.E3S Web of Conferences,336: pp.64
[22] Bai R X,Shi Y T,Meng Y,et al.(2023) Hybrid model based on K-means++algorithm,optimal similar day approach,and long short-term memory neural network for short-term photovoltaic power prediction.Global Energy Interconnection,6(2): 184-196
[23] Luo X,Zhang D X,Zhu X.(2022) Combining transfer learning and constrained long short-term memory for power generation forecasting of newly-constructed photovoltaic plants.Renewable Energy,185: 1062-1077
[24] Cai L,Gu J,Jin Z J.(2020) Two-layer transfer-learning-based architecture for short-term load forecasting.IEEE Transactions on Industrial Informatics,16(3): 1722-1732

Scan for more details
Received: 26 April 2024/ Accepted: 20 August 2024/ Published: 25 December 2024
 Siyu Hu
husiyu@epri.sgcc.com.cn
Tiandong Ma
matiand@126.com
Feng Li
lifeng6662024@126.com
Renlong Gao
gaorenlong2024@126.com
Wenwen Ma
mawenwen@epri.sgcc.com.cn
2096-5117/© 2024 Global Energy Interconnection Group Co.Ltd.Production and hosting by Elsevier B.V.on behalf of KeAi Communications Co.,Ltd.This is an open access article under the CC BY-NC-ND license (http://creativecommons.org/licenses/by-nc-nd/4.0/).
Biographies

Tiandong Ma,a senior engineer at State Grid Ningxia Electric Power Company.His research encompasses studies on power grid dispatch and operation.

Feng Li,a senior engineer at State Grid Ningxia Electric Power Company.His research interests include the grid integration and scheduling of new energy sources,as well as renewable energy power prediction.

Renlong Gao,a senior engineer at State Grid Ningxia Electric Power Company.His research interests include grid integration of new energy sources,power generation and operation,and integration management studies.

Siyu Hu,a senior engineer at China Electric Power Research Institute.Her research focuses on power grid meteorological disaster prevention and mitigation technologies,as well as renewable energy resource prediction.

Wenwen Ma,a senior engineer at China Electric Power Research Institute.Her research interests include photovoltaic power output prediction and the application of artificial intelligence.
(Editor Zedong Zhang)
