
1 Introduction
The past decade has witnessed a big growth in Ethiopia’s electricity sector. Between 2012 and 2016,the number of electricity customers of EEP reached over four million from two million at the beginning of the period [1]. This steep growth in the electricity sector has led to significant constraints in EEP. Moreover, while the generation has been at the forefront of energy developments in Ethiopia, the weaknesses in the transmission network are not receiving their due attention. These weaknesses affect the customers, the government, the economy and social welfare of the society. Due to these facts, fault(s) in the transmission system are threatening the operation of the power system, and thereby the national grid system’s vulnerability is increased from time to time.
The main HV levels of the power transmission systems are 400 kV, 230 kV, and 132 kV. The 500 kV transmission system is on the way to come. Among the voltage levels, the 400 kV and 230 kV are the most important and are responsible for the bulk power flows among the eight regional power systems: viz. Addis Ababa, Central, Western, Southwestern, Northwestern,Eastern, Northern and Northeastern regions. In addition,the power transmission network is extended to Djibouti in the east and to the Republic of Sudan to the northwest.The HV transmission network consists of 1071.76 km of 400 kV circuits, 5895.54 km of 230 kV circuits and 4666.79 km of 132 kV circuits [1].
In Ethiopia, the power system’s vulnerability has worsened from time to time because of the implicit and explicit reasons. However, these reasons have not been studied in a concrete way which further exacerbate the situation and as a result partial and total blackouts frequently happen on the grid. Therefore, this paper presents an approach for assessing vulnerability of the EEP system by using two indices, called performance indices(PIs) which reflect the health of the system. The indices allow assessing two different symptoms of system stress such as voltage limit violations and overloads.
This process of vulnerability analysis involves studying the effect of the removal of a system component on the system, particularly the power flows and the bus voltages.This component can be a generator, transmission line,transformer, and so on. This work however focuses on outages of the transmission network. The reason is that most of the previous partial and total blackouts happened as results of the faults on the transmission lines, as reported by National Load Dispatch Center of EEP (NLDC) in [2].What follows is a qualitative and quantitative evaluation of which line outages lead to the most issues with regard to voltage limit and line load violations.
The method used to rank vulnerabilities is taken from[3], [4], [5], and [6]. Detailed explanation is given in Section II.
2 Vulnerability Assessment Methods
2.1 Performance Indices
The system performance index is a measure that can be used to evaluate the relative severity of a contingency[3]. The most common form of system performance indices gives a measure of the deviation from rated values of system variables such as line flows, bus voltages, bus power injections, etc. The indices to quantify problems related to loading and voltage limit violations are described in equations (1) and (2).
1) Active power performance index (PIρ): This index is used to measure the degree of line over loads and is given by [4].
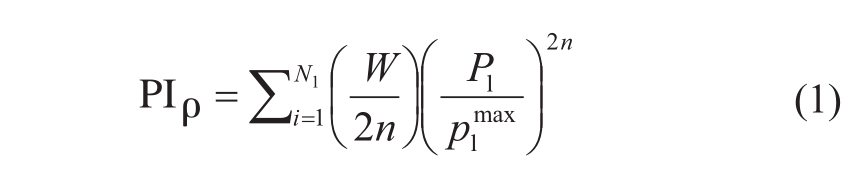
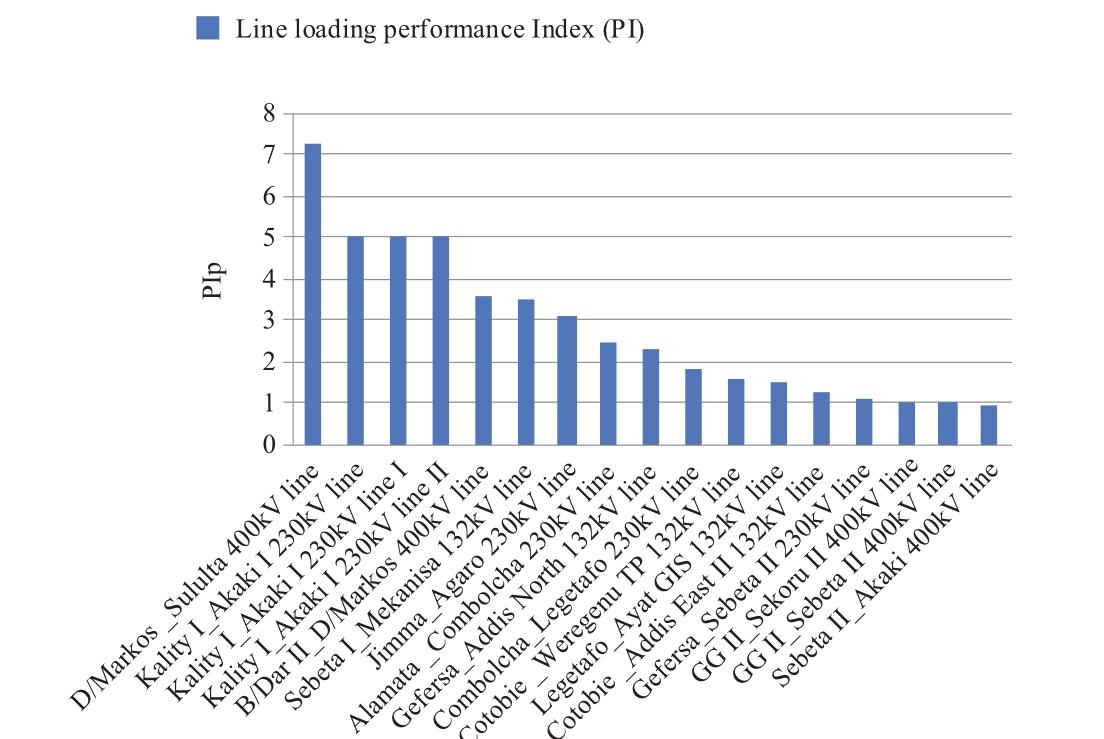
Fig. 1 Line outages ranking in terms of PIρ
where
Pl – The MW flow of line l
Pl max – The MW capacity limit of line l
Nl – The number of overloaded lines in the system
W – Real power weighting factor (in general, W = 1)
n – A positive number (n = 1, 2, 3… etc...).
The summation is carried out on overloaded lines only to avoid the masking problem reported in [3], [4], [5].
2) Voltage performance index (PIv): The voltage level performance index chosen to quantify system deficiency due to out of limit bus voltages in defined by [4].
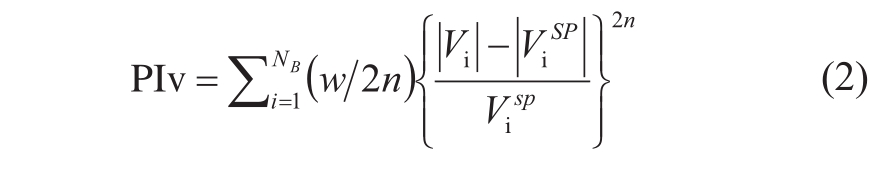
where
Vi – The voltage magnitude corresponding to bus i
Vi SP – Specified voltage magnitude corresponding to bus i
n – A positive number and usually its value is 1 (n = 1, 2, …etc...).
NB – Number of buses in the system whose voltage magnitude is out of the specified ranges.
w – Real non-negative weighting factor (in general w =1).
Thus, this index measures the severity of the out of limit bus voltages and provides a direct means of comparing the relative severity of the different line outages on the system voltage profile.
2.2 Line Outage’s Severity Ranking
Ranking is performed for all branch outages against their rated power carrying capacity (i.e., a load of 100%),and considering voltage violations outside the range of 0.9 pu to 1.1 pu. The most severe line outages and the performance indices for the two criteria are shown in descending order in Fig. 1 and 2.
Fig. 1 shows the ranking of line outages in terms of the performance index calculated based on the branches overload. It can be seen that the most dangerous line outage is the disconnection of Debre Markos_Sululta 400 kV line that leads to an increase in the path of the power supply to the high load centers from Beles hydropower plant.
On the other hand, Fig. 2 shows the line outages ranking based on the performance index calculated in terms of bus voltage limit violations. It is found that the most dangerous line outages from the voltage point of view are the disconnections of lines of Alamata_Combolcha 230 kV,Akaki I_Kality I 230 kV line I & II, and Sebeta I_Kality I 230 kV lines.
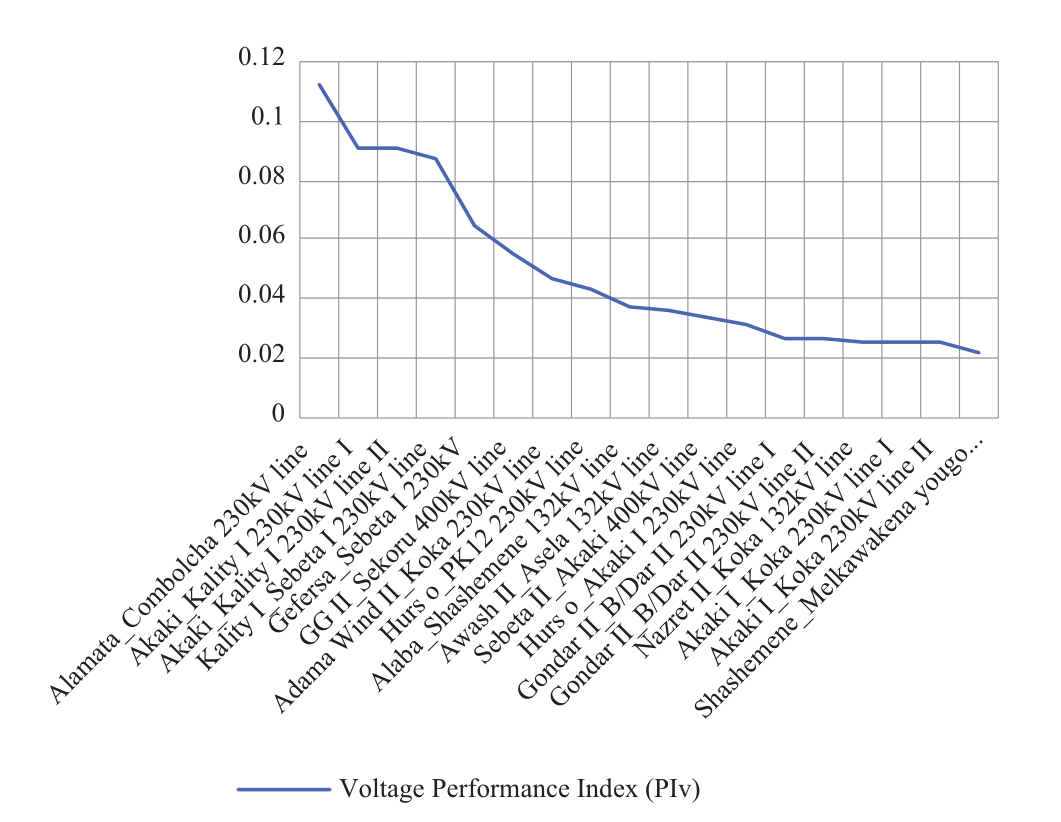
Fig. 2 Line outages ranking in terms of PIv
3 Result Analysis and discussions
3.1 Analysis Results for the Most Severe Line Outages
The above proposed algorithm is used for the snapshot of the EEP grid at 19:00 on July 17, 2016. At this snapshot,the system contained 63 synchronous generators, 104 load buses, 134 substations, 99 two-winding transformers, 26 three-phase transformers, 3 shunt capacitor banks, 45 shunt reactors and 142 transmission lines. The detailed system data is taken from national load dispatch center (NLDC),power system planning department. At this specific time,the system was loaded to 1539.74 MW from which 100 MW was exported to the Republic of Sudan and 50 MW was exported to Djibouti. The full AC power flow is run to get the steady state results, such as bus voltages and line flows. Next, line outage analysis is done by considering a load scaling factor of 1.33, as this factor is used by the planning and operation department of NLDC for daily peak load forecasting and generation dispatch scheduling.This data is fed to DIgSILENT PowerFactory software and computer simulation is then performed for each line outage.
Simulation of the line outages begins with ascertaining a steady state solution of the system at base case, and it is obtained that there is overloading of components.Moreover, there are no voltage limit violations at the load buses.
Next, computer simulation is run for each line outage and, it is obtained that there are 28 severe line outages whose active power flow performance indices are greater than 1.0 pu and voltage level performance indices are greater than 0.02 pu. The ends of the transmission lines associated with the most severe line outages are labeled in Fig. 3. It is evident that most of these line outages are predominantly along the highest voltage transmission lines(400 kV & 230 kV) connecting the regional power systems of the country to the capital, Addis Ababa. Almost all of the line outages affect the high load centers, i.e., Addis Ababa and central regions, as can be seen in Table 1 and Table 2. This knowledge implies that as far as the transmission network is concerned, the main weaknesses of the EEP grid are on the lines feeding Addis Ababa and Central regions from the rest of the regional power systems.
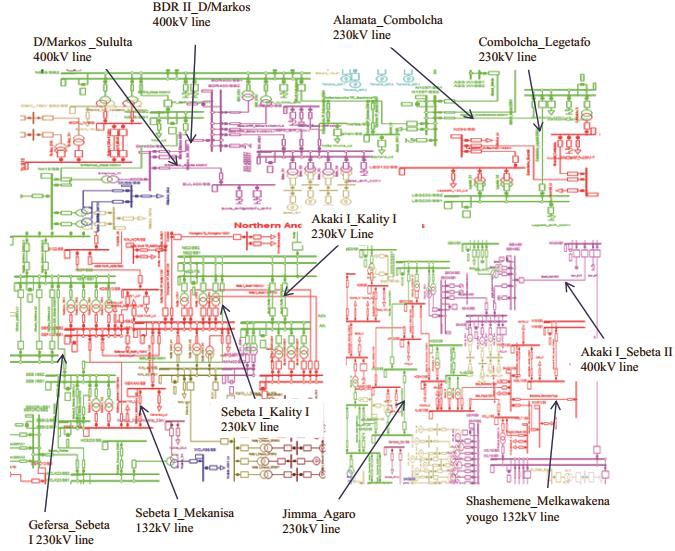
Fig. 3 Portions of the EEP grid showing points of interest
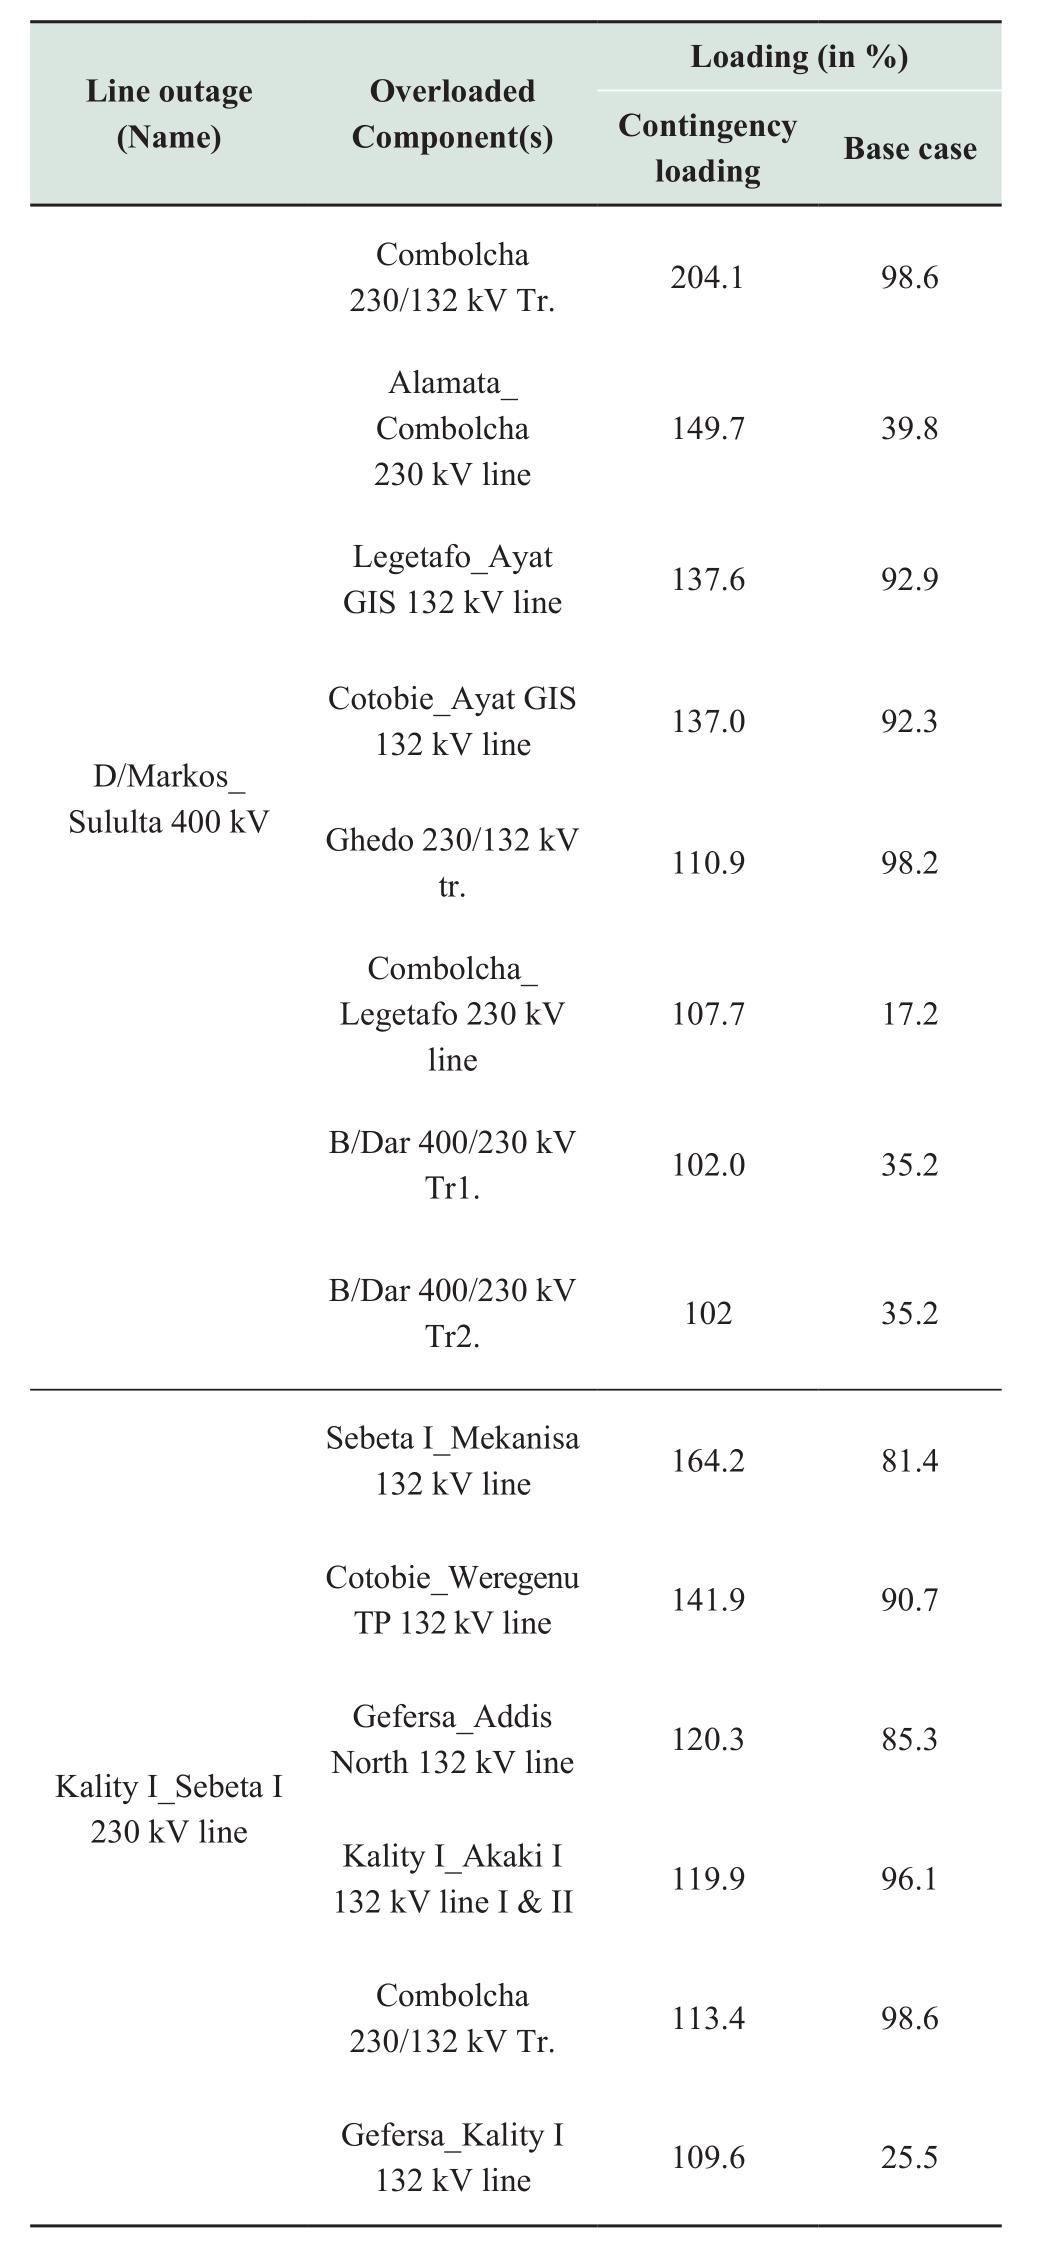
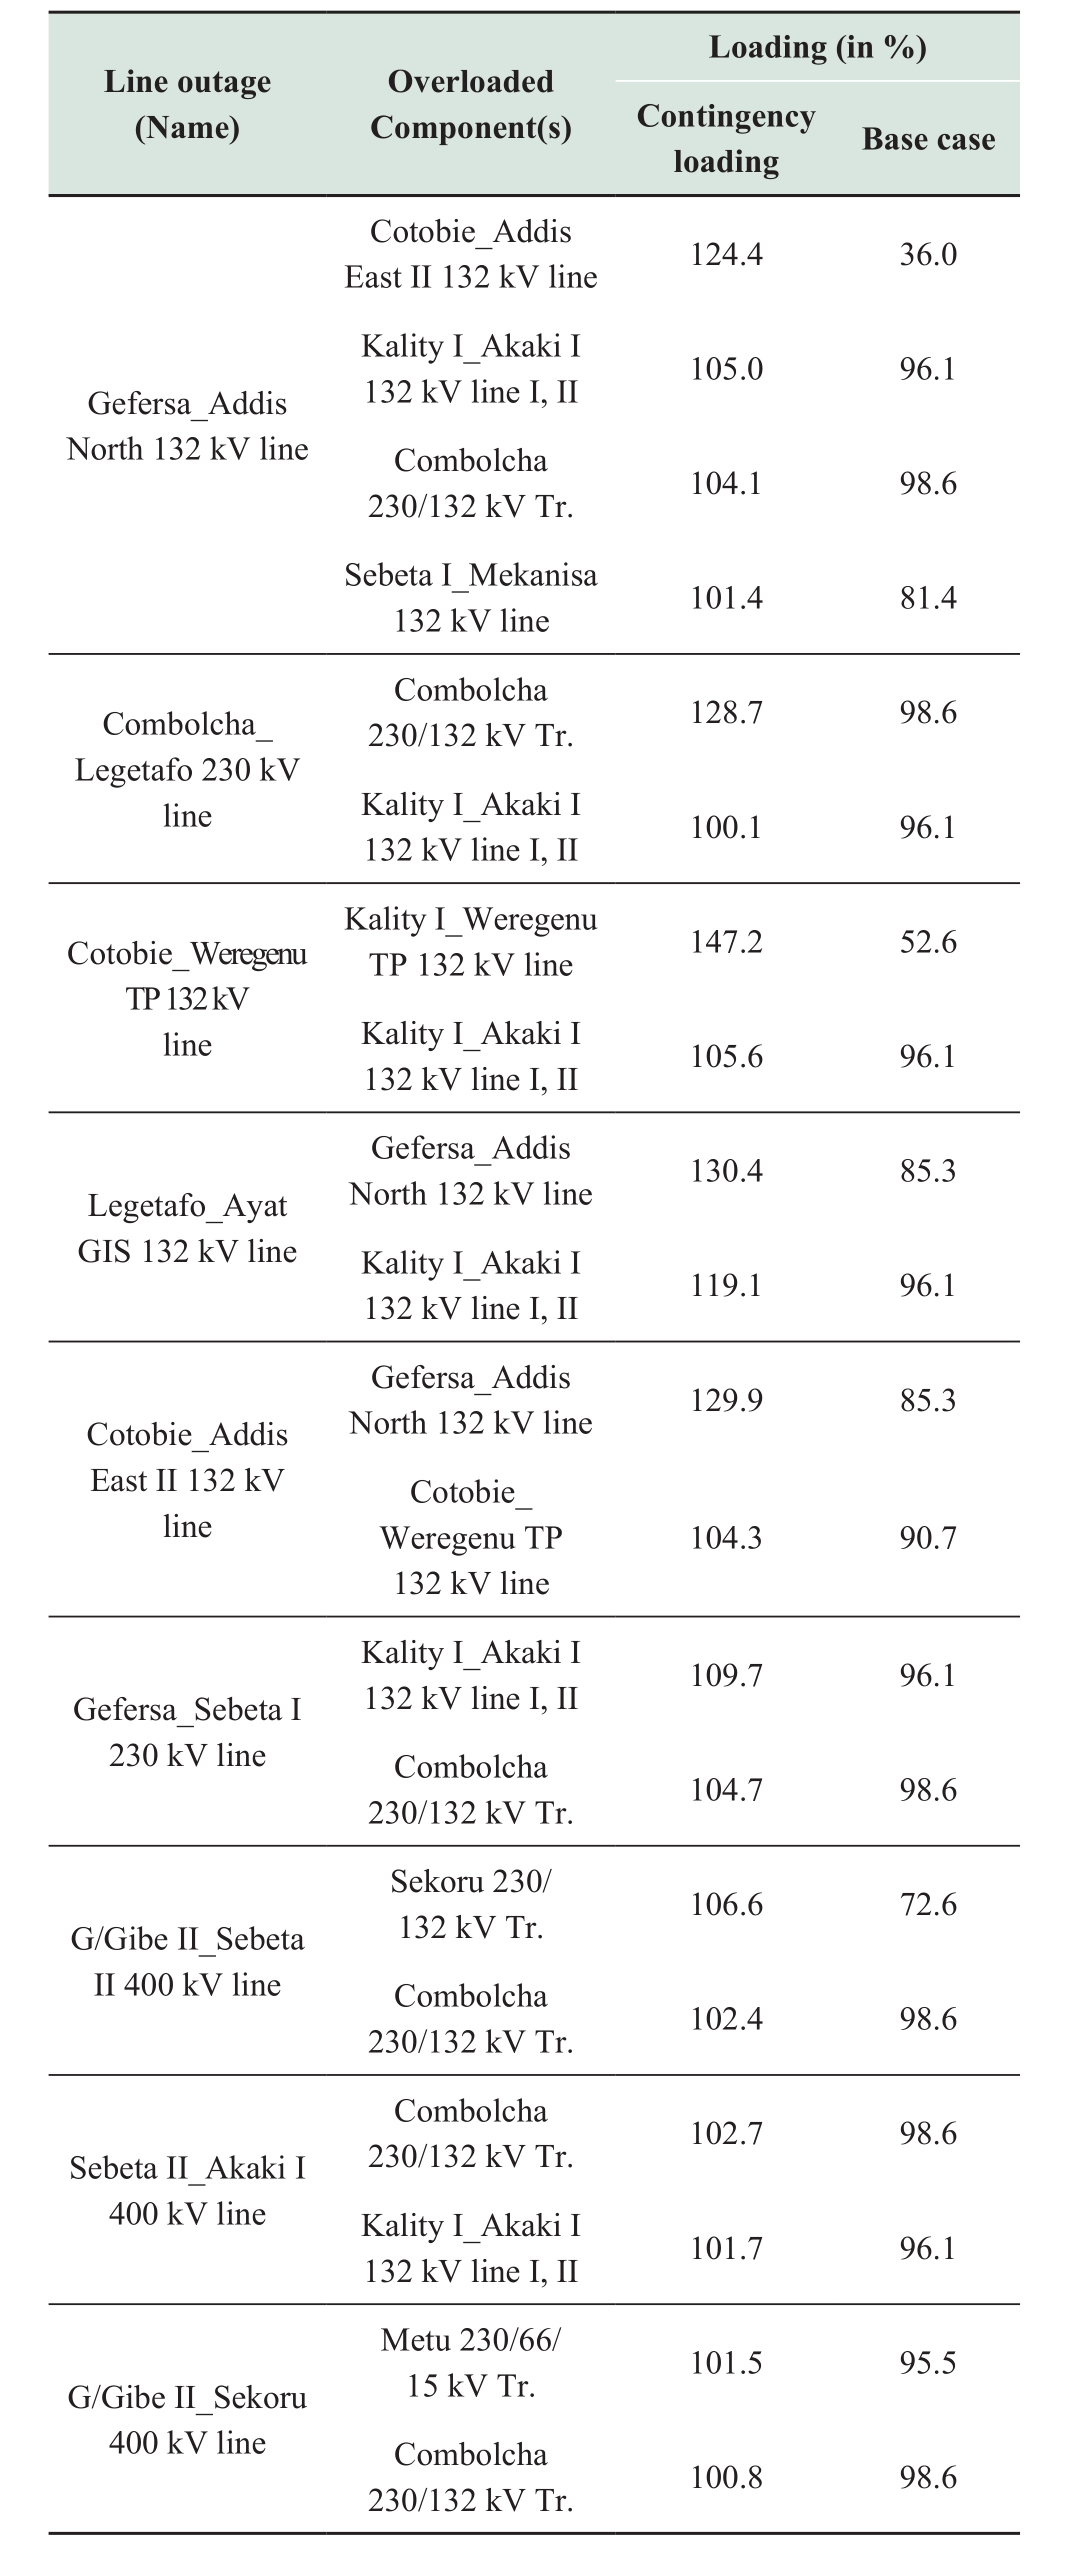
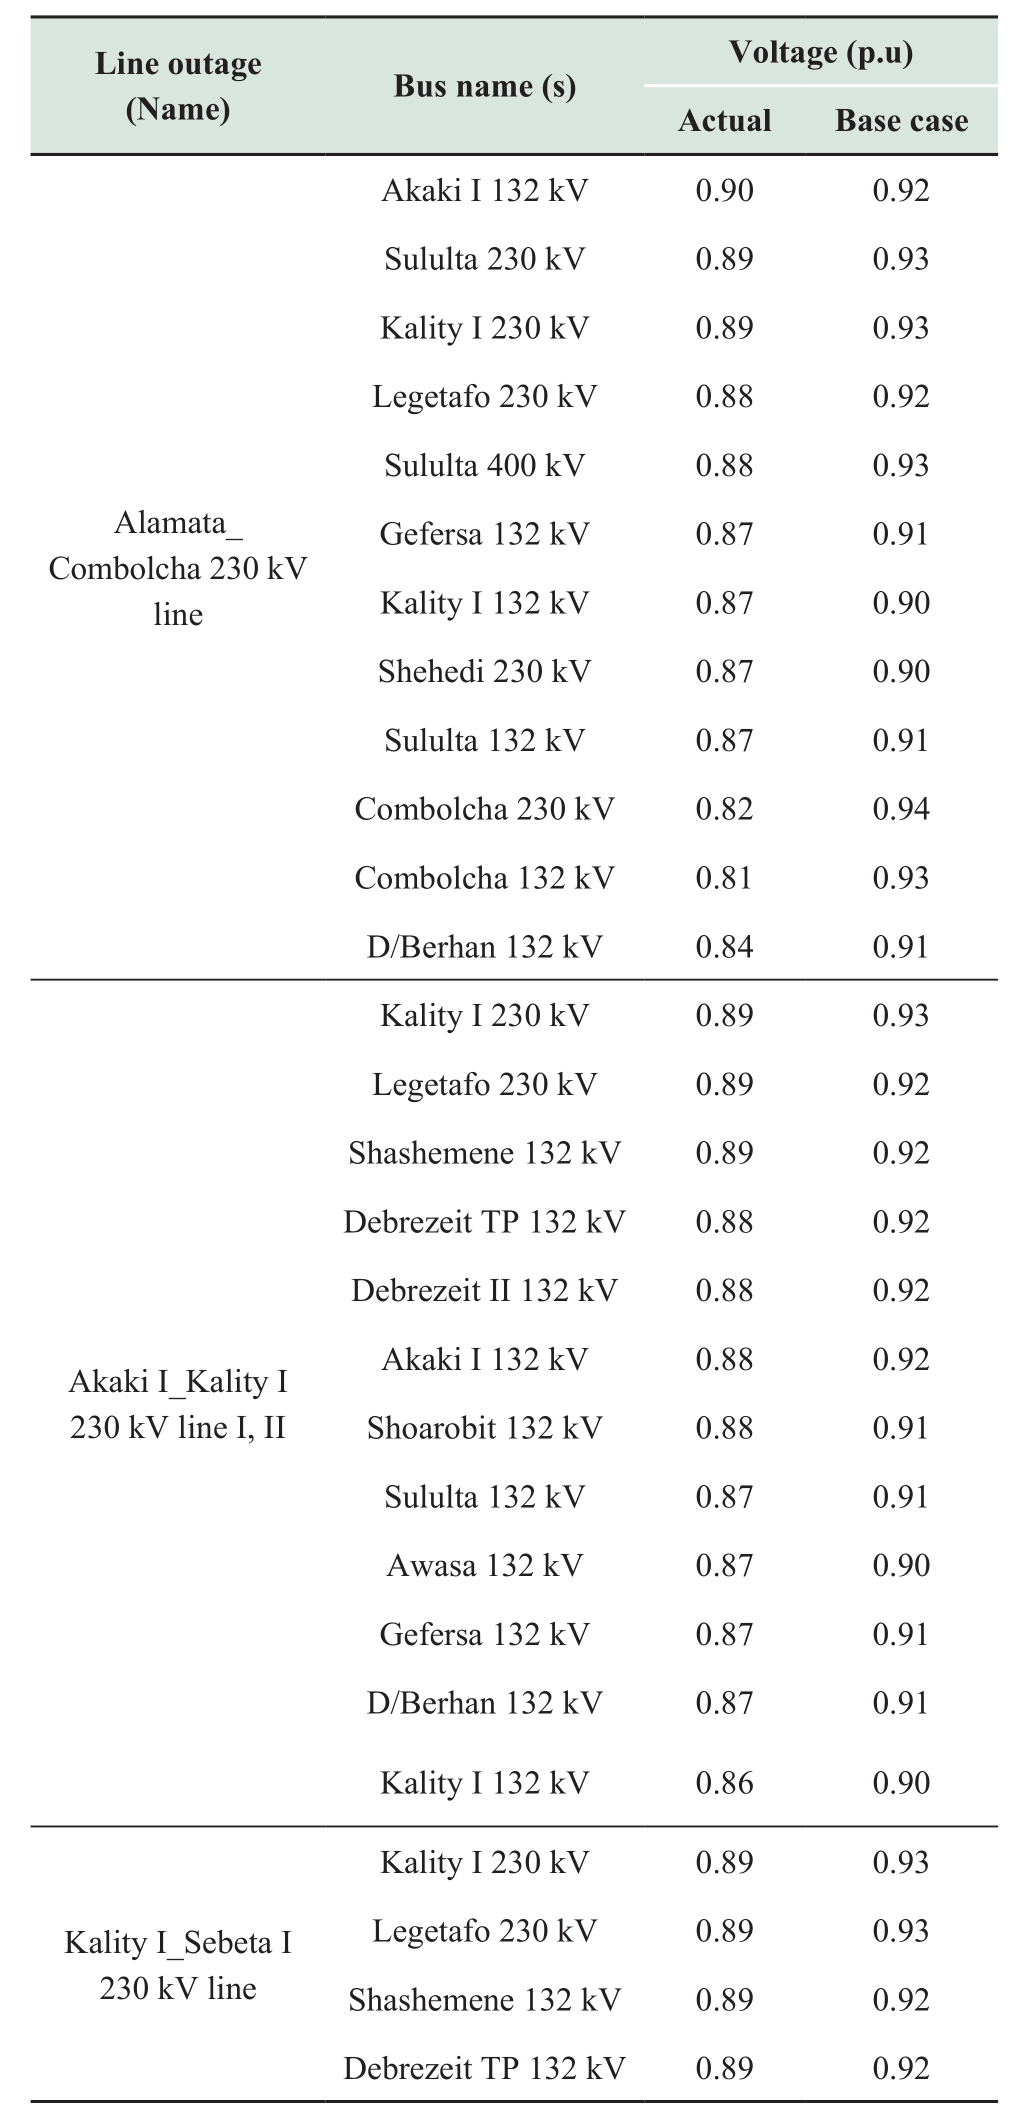
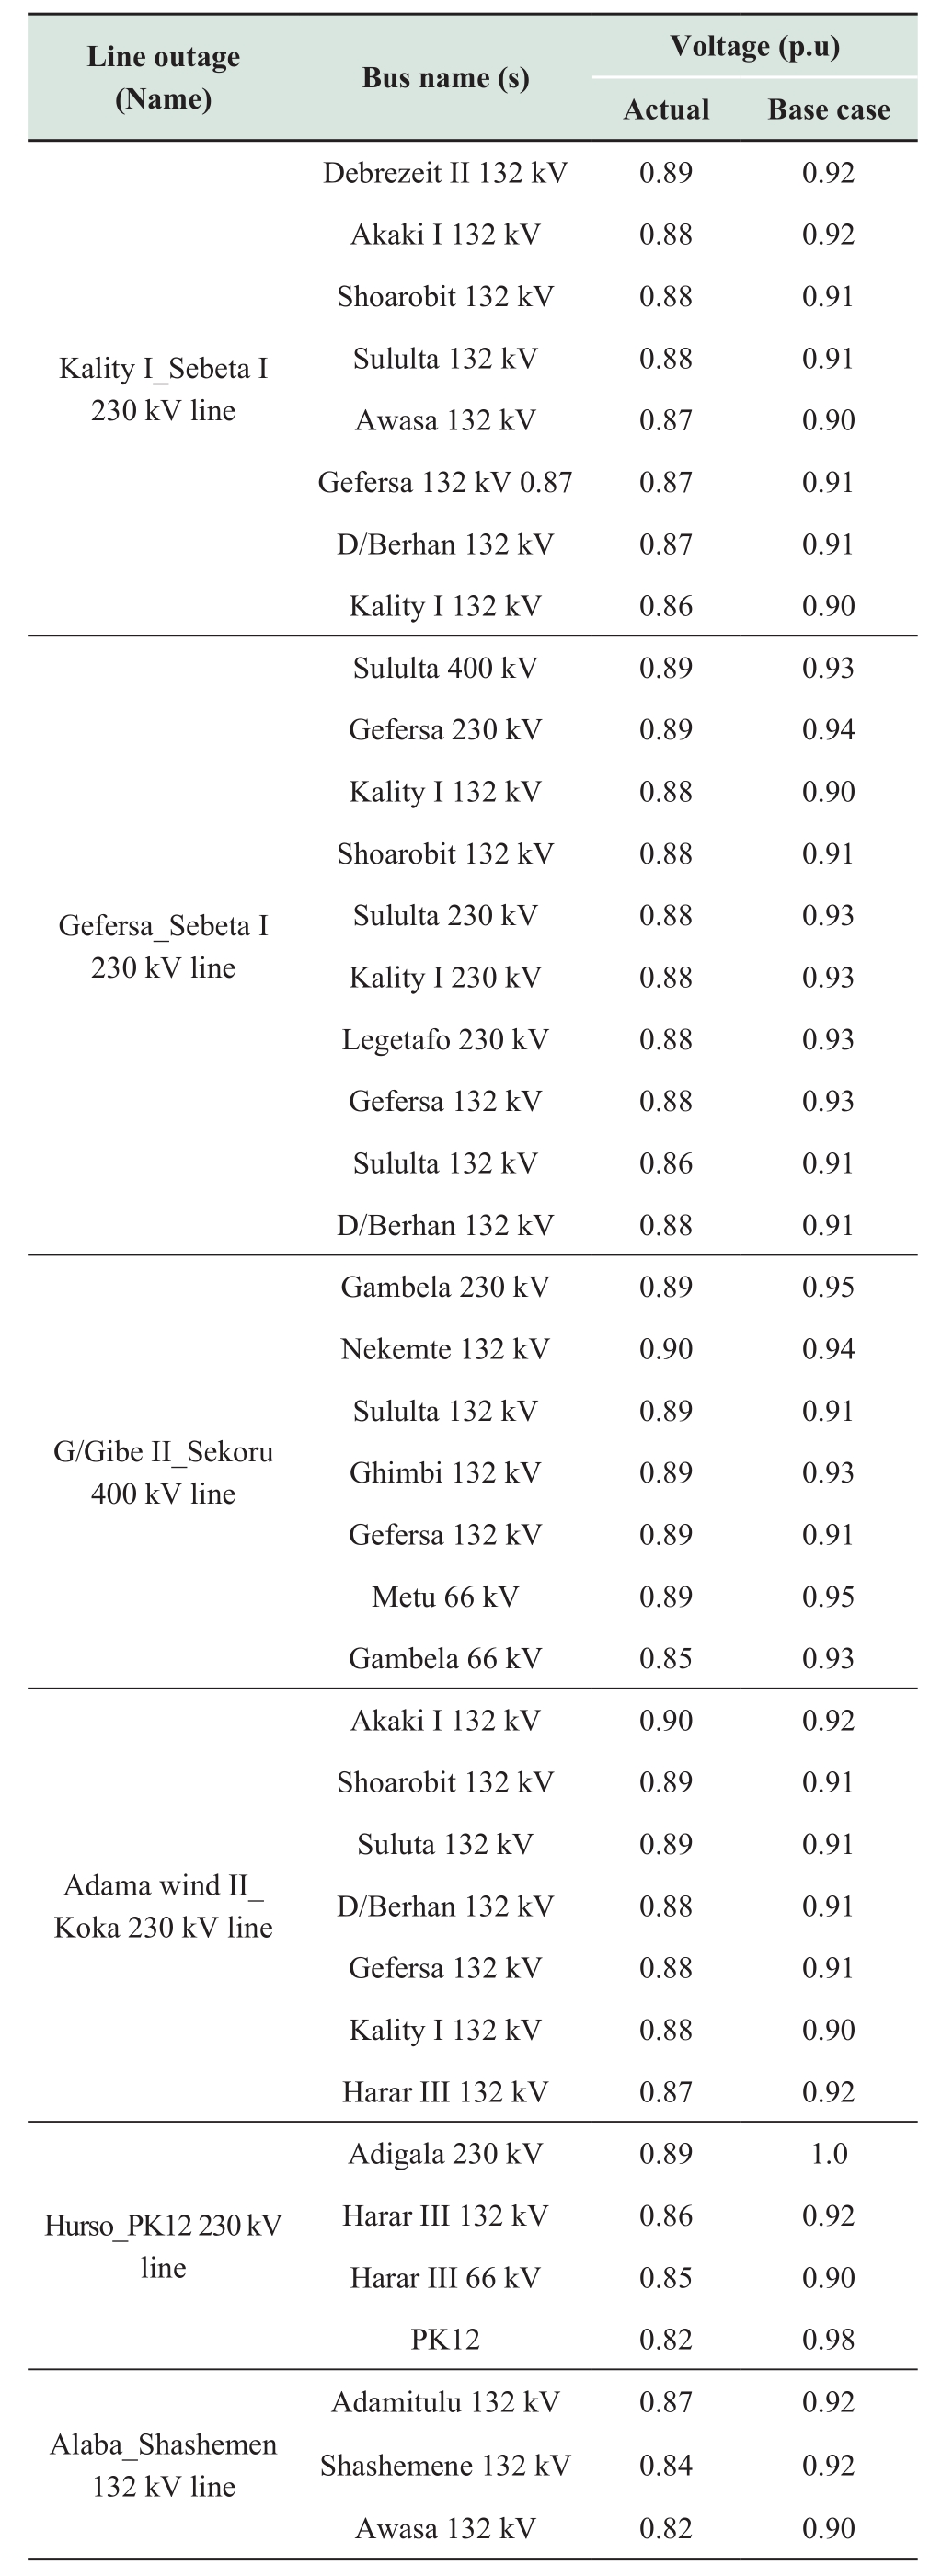
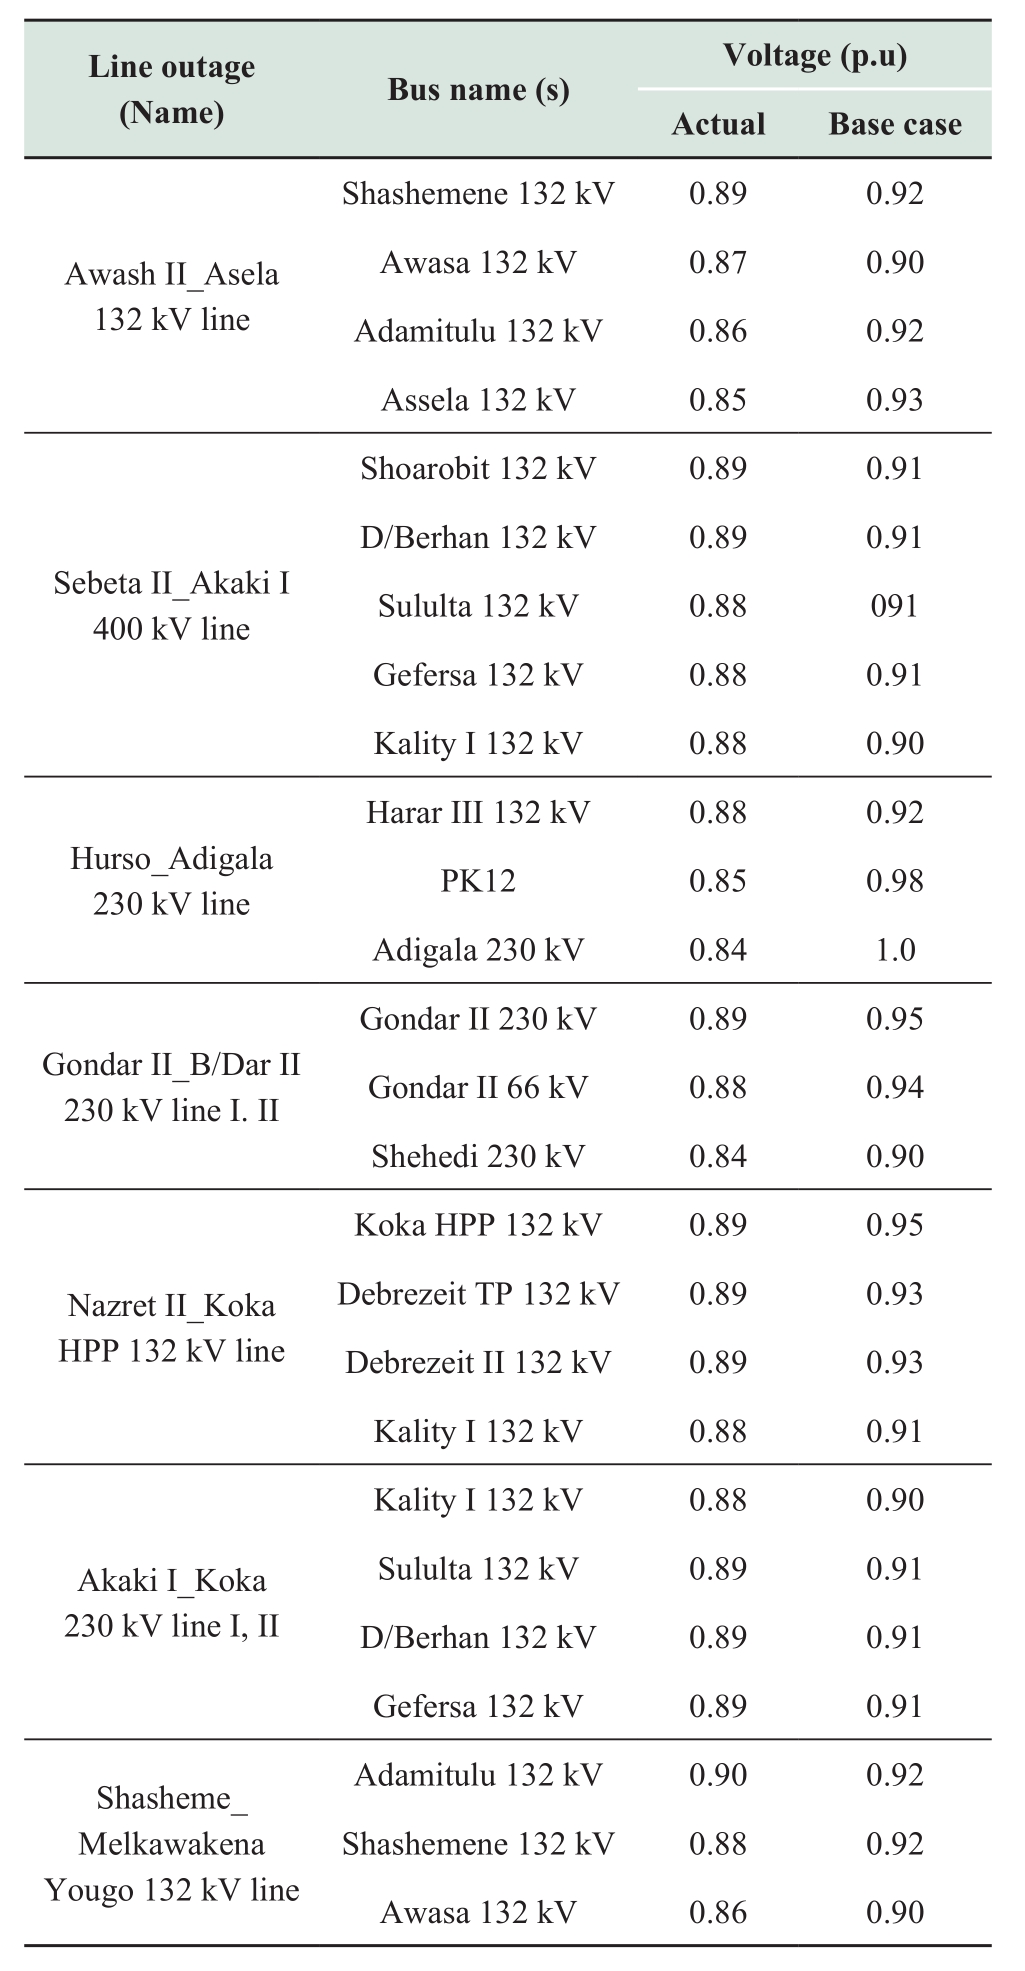
Table 1 and Table 2 show loading and voltage limit violations for the most severe line outages of power system elements and buses respectively.
Table 1 Loding violations per case
continue
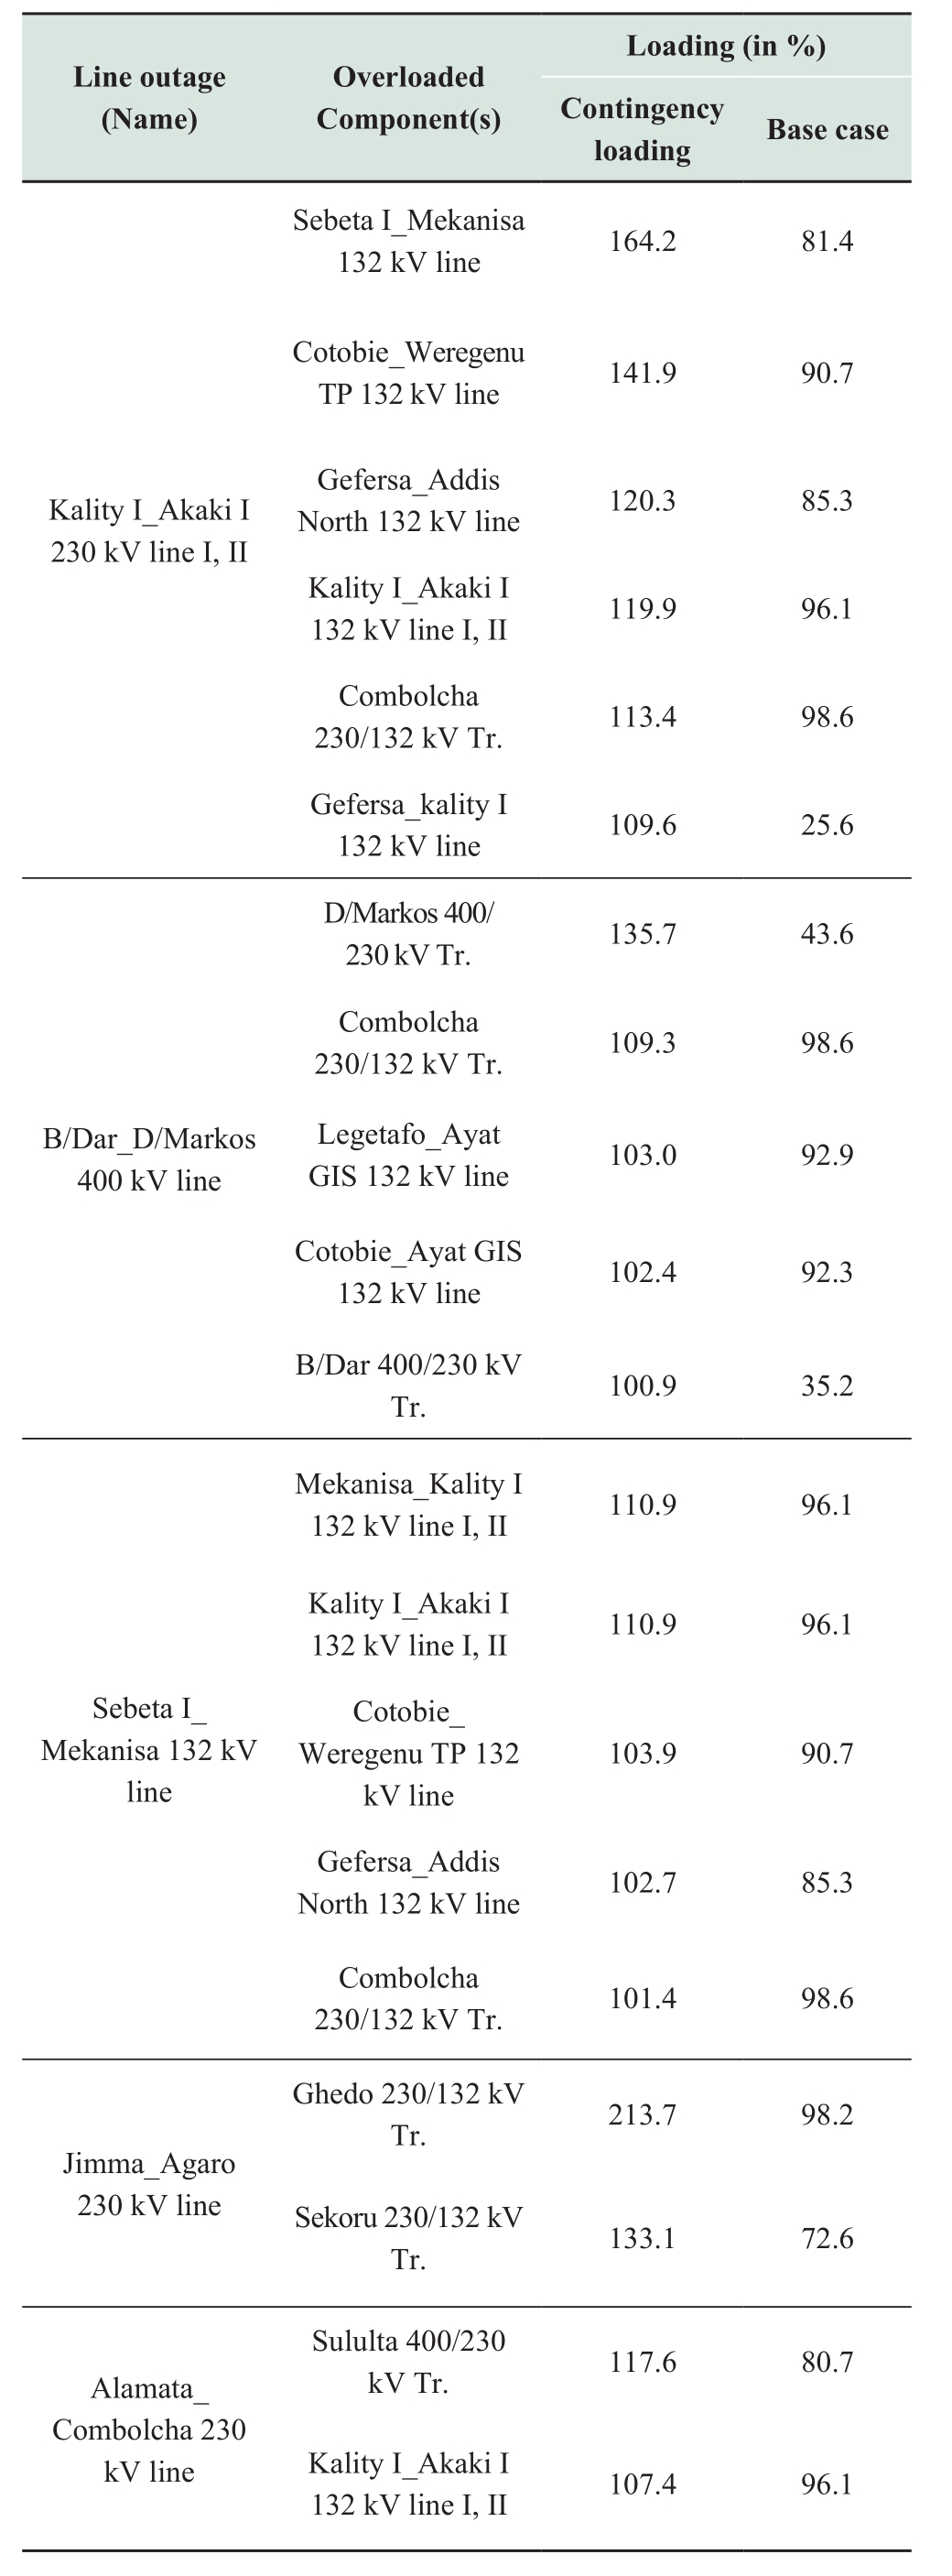
Continue
The result shows several violations as indicated in Table 1 & 2. With these violations, it is unlikely that the system would be able to operate. Voltages outside their limits could lead to widespread instability, failures, and damage of equipment while overloads could permanently damage equipment, also leading to instability [3]. Normally,procedures need to be put in place to prevent the system from reaching such an operating point and may require that part of the system get shut down in a coordinated way to save the system from damage, at the cost of interrupting supply to some customers. Such type of cutting of supply to customers results in forced blackouts, and are very common in the Ethiopian electricity sector and have been widely reported by NLDC in [2] and [8], though scientific publications are not available.
Table 2 Voltage limit violations per case
Continue
Continue
3.2 Determination of Vulnerable Branch Components and Buses
Generally, results of the line outage simulation give an idea about vulnerable buses whose voltages must be maintained within limits by transmission and substation rehabilitation and upgrading (TSRUP) projects. For instance, by installing static shunt compensators at high load buses or by implementing under voltage load shedding(UVLS) protection schemes, voltage instability can be improved. Overloading of lines and/or transformers can be reduced by increasing the capacities the lines and transformers.
Network’s vulnerable buses are those buses that have out of limit voltages in case of line outages. Accordingly,the network’s most vulnerable buses are Sululta and Gefersa 132 kV buses in which 11 different line outages cause them to have out of limit bus voltages. The second most vulnerable buses are Kality I and D/ Berhan 132 kV buses where 9 different line outage cases lead them to have out of limit bus voltages. Fig. 4 shows the network’s most vulnerable cases ranked based on the number of outages that caused voltage limit violations starting from the most vulnerable buses.
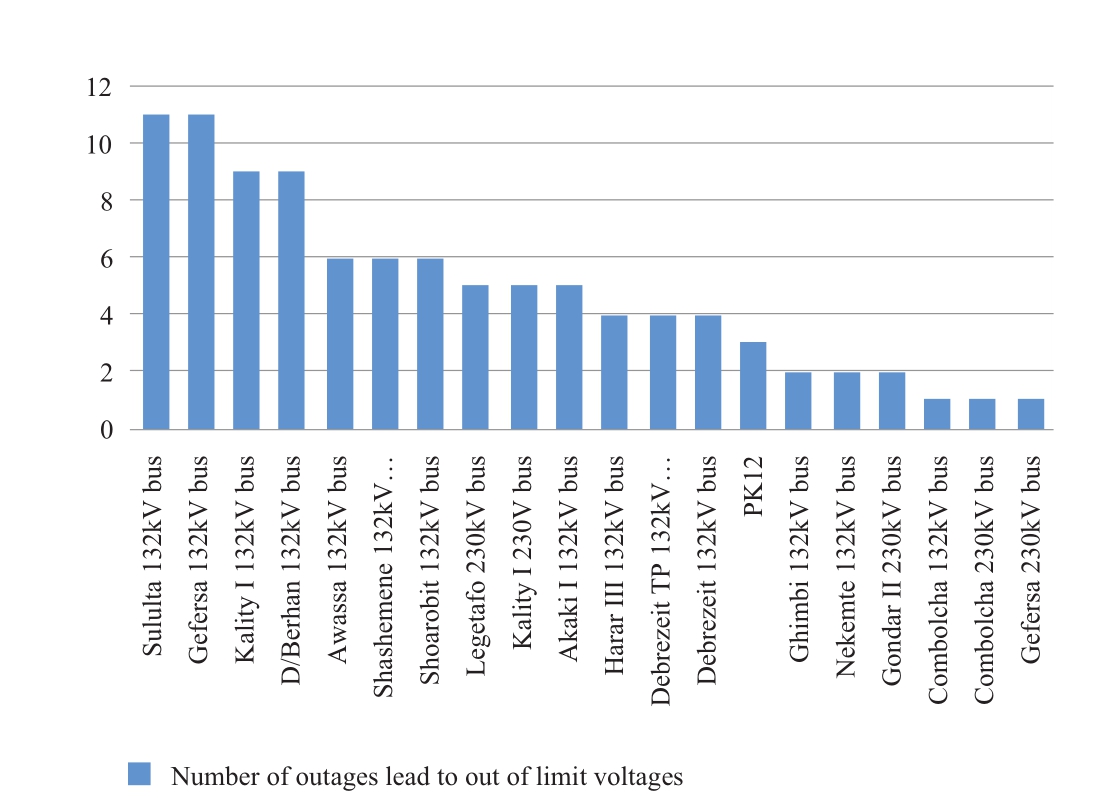
Fig. 4 Vulnerabilities ranked based on number of outages that lead to voltage limit violations of buses
Similarly, results of line outage analysis can also give us an idea about the vulnerable equipment (lines, transformers or generators) whose capacity must be increased by TSRUP to withstand load violations as a result of line outages,and to secure operation during contingencies. Network vulnerabilities with respect to component’s overloading are the lines/transformers which always become overloaded in case of different line outages.
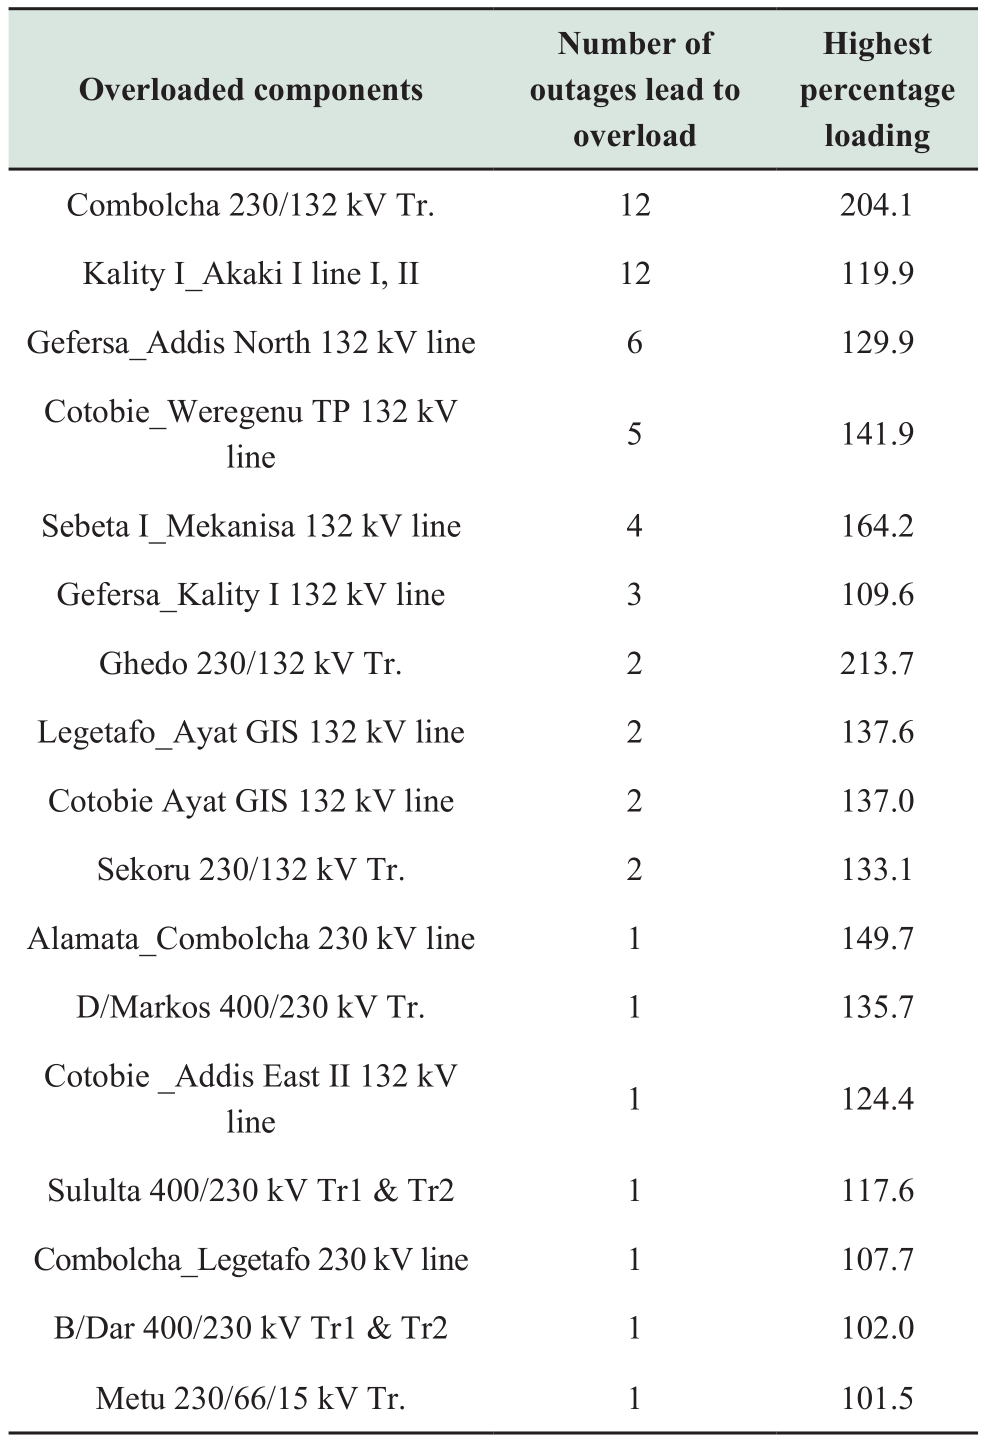
Based on the analysis, it is obtained that the network’s most vulnerable component is the transformer at Combolcha II 230/132 kV substation, in which 12 different line outage cases lead this transformer to overload. Table III shows the network vulnerabilities ranked based on number of line outages lead to lines/transformers overload starting with the most vulnerable component besides each component’s highest percentage load.
To sum up, as can be seen from Table 3 and Fig. 4,most of the network vulnerabilities in respect of voltage limit violations and loading violations of buses and components respectively, are occurred on those buses and components either found at the high load centers or they are major power flow paths to it.
Table 3 Vulnerabilities ranked based on number of line outages lead to component overloads
4 Conclusions
This paper mainly describes a framework for identifying the Ethiopian electric power system vulnerabilities, largely based on performance indices and supported by power flow and line outage analyses.
In the first step, ranking and identification of most severe line outages are done based on performance indices.With these identified line outages, network vulnerabilities are evaluated based on:
Numbers of outages that lead to voltage limit violations of buses.
Numbers of outages that lead to overload.
The highest percentage load of components.
Accordingly, the analysis shows that most of the network vulnerabilities in respect of bus voltage violations and element overloading are occurred on those buses and elements found at the high load centers.
This paper does not only identify the vulnerable lines,transformers and buses but also gives clear technical information related to how these vulnerabilities can be mitigated.
References
[1] World Bank Group - International Development Association,"International Development Association Project Paper on a Proposed Additional Credit to the Federal Democratic Republic of Ethiopia for the Electricity Network Reinforcement and Expansion Project", World bank, Ethiopia, May 6, 2016
[2] National Load Dispatch Centre of Ethiopia, "Partial and Total Blackouts Report" - National Load Dispatch Center, Ethiopian Electric Power, Ethiopia, EEP, Addis Ababa, 2013-2015
[3] Albuyeh F, Bose A, Heath B (1982) Reactive Power Considerations in Automatic Contingency Selection , IEEE Transactions on Power Apparatus and Systems, PAS-101(1):107-112
[4] Ejebe GC, Irisarri GD, Mokhtari S et al (1996) Methods for contingency screening and ranking for voltage stability analysis of power systems, IEEE Transactions on Power Systems,11(1):350-356
[5] Ejebe GC, Wollenberg BF (1979) Automatic Contingency Selection, IEEE Transactions on Power Apparatus and Systems,PAS-98(1):97-109
[6] Wood AJ, Wollenberg BF, Sheblé GB (2013) Power Generation,Operation, and Control, Second Edition, Wiley-Interscience, pp.415-436
[7] Gonzalez-Longatt FM, Rueda JL (2014) PowerFactory Applications for Power System Analysis, Stuttgart Und Umgebung, Deutschland: Springer, August 2014
[8] E. National Load Dispatch Centre, Operating Procedures for National Load Dispatch Centre, Addis Ababa, 2015
Received: 20 November 2017/ Accepted: 12 December 2017/ Published:25 August 2018
Moges Alemu Tikuneh
moges.alemu@dbu.edu.et
Getachew Biru Worku (PhD),
gbiru@yahoo.co.uk
book=365,ebook=69
Biographies

Moges Alemu Tikuneh was born in Motta,Ethiopia, in 1990. He received the bachelor degree in electrical and computer engineering from Jimma University, Jimma, Ethiopia,in 2012, and the master degree in electrical power engineering from Addis Ababa Institute of Technology (AAiT), Addis Ababa,Ethiopia, in 2017.In 2013, he joined the Department of Electrical and Computer Engineering, Debre Berhan University, as an Assistant Lecturer, and in 2017 became a University-Industry Linkage Coordinator at this university. His current research interests include electrical power system operation, control and protection; electrical machines and drives, flexible ac transmission systems, high-voltage dc, and power quality. Mr. Moges is a Fellow of Ethiopian Society Electrical Engineers (ESEE); the professional association in Ethiopia. He was also working as an Electrical Engineer and a supervisor at Ethiopian Electric Power Company, Ethiopia. He had taken various trainings about substation equipments installation and maintenance, SDH/PDH equipment maintenance and configuration, and Telecom power equipments maintenance in Ethiopia and abroad in China. He had also presented his research findings in international scientific conferences.

Dr. Ing. Getachew Biru Worku obtained his master and Ph.D. degrees in Electrical Engineering in Dresden Technical University,Germany. He has more than 25 years of academic and research experience in academic institutions and industry. He has given lectures and advised Postgraduate Students in electrical power in Addis Ababa University,Bahir Dar University, in Adama Science Technology University and Jimma University. He has served as Dean, Department head and Academic Program Officer in Bahir Dar University and Chairman of Electrical and Computer Engineering Department in Addis Ababa University. Dr.-Ing. Getachew Biru has also worked in the Ethiopian Aviation Academy. His research areas are electrical power and renewable energy applications and published more than 13 papers in peer-reviewed International and national journals.
(Editor Zhou Zhou)