0 Introduction
The use of renewable energy sources,such as photovoltaics (PVs),wind power,and hydropower,is an effective way to reduce carbon emissions.Distributed photovoltaics (DPVs) are more flexible to use,are not limited by region,and have considerable economic benefits[1] compared with centralized PV projects,making them an important supplementary means for current clean energy use.Under the promotion of Chinese government policies,DPV power generation will continue to play an important role.In the future,DPV power generation will play a significant role in energy structure adjustment,carbon emission reduction,and environmental protection.
Although cities occupy from 0.4%-0.9% of the global land area [2],they account for 70% of the total emissions[3-5].China,the world’s fastest-growing economy,expects to exhibit an urbanization rate of 65% during 2021-2025.The acceleration of urbanization has exacerbated the energy crisis.As urbanization accelerates,significant changes occur in local climates,resulting in higher temperature differences between urban and suburban areas,giving rise to the urban heat island effect [6].Urban heat islands in turn have a significant impact on building energy consumption[7].Exacerbating residential energy consumption is that used for cooling vehicles and buildings in urban areas,which also increases during summer.This increase further contributes to higher greenhouse gas emissions,intensifying the deterioration of outdoor thermal environments,and creating a vicious cycle.Roofs occupy a large proportion of the urban space,and their design has a significant impact on urban sustainability [8].Optimizing the roof design is of great significance for reducing carbon emissions,saving energy,controlling economic costs,and mitigating negative impacts on the environment.
Recently,there have been a series of studies conducted on improving roof performance,and the results show that the widespread implementation of roof cooling measures can effectively reduce urban temperatures and energy consumption [9-11].As a new type of energy building material,DPV roofs are receiving increasing attention in studies because they can provide the energy needed inside buildings,reduce fossil energy usage and the corresponding carbon emissions.Dominguez et al.[12] measured the influence of rooftop PVs on building insulation in San Diego,California.During daytime in April,the inner surface temperature of a roof with PV modules was 2.5 ℃ less than that of a regular roof,leading to a significant load impact.The impact on the load is less pronounced during the winter heating period,resulting in a reduction of 5.9 kW·h·m-2 in cooling load throughout the year.Masson et al.[13],using a PV roof model,showed that the use of PV roofs during summer could decrease air conditioning energy consumption by 12%.Yang et al.[14]investigated PV roofs with ventilation ducts and explored both the heat transfer and electrical performance.Owing to the shading effect of PV modules and the functionality of the ventilation ducts,the cooling load through the roof decreased by 65% compared to that of a regular roof.PV roofs efficiently convert solar energy into electricity,thereby presenting a viable solution to urban energy shortages.Horváth et al.[15] simulated the installation of PV roofs in Hungary’s Debrécsen urban building area.The simulation results revealed that installing PV roofs within the effective area could generate 212.11 GWh of electricity annually,satisfying approximately 91.4% of the hot-water electricity demand of the residential area.In a simulation involving cities in central and western India,Dondariya et al.[16] demonstrated that the implementation of PV roofs could lead to a reduction of 41.09% in electricity demand,while Chen et al.[17] proposed a comprehensive framework for assessing the potential of rooftop PVs,and showed that the annual potential of rooftop PVs in Daxing District,Beijing,China,is 2832.23 GWh,with significant economic benefits.Pamain et al.[18] used different nonlinear autoregressive artificial neural network algorithms to predict the PV power generation installed on the outdoor roof of the University of Dodoma in Tanzania in winter,and they performed well.
Numerical weather models that incorporate the radiation effects of rooftop DPVs to assess their impact on the urban ecological environment and energy budget have been used in studies [13,19-21].Studies pointed out that installing a DPV roof not only has a direct impact on energy consumption through electricity generation,but also changes the surrounding atmospheric environment by reducing fossil fuel combustion.However,there is no consensus on whether rooftop PVs can effectively cool the thermal environments of cities.Studies have shown that PV roofs can lower roof temperatures,thereby reducing urban near-ground temperatures.Masson et al.[13] used an offline urban canopy model (UCM) to indicate that a DPV roof could decrease surface air temperatures by 0.2 ℃ in the urban area of Paris,France.Salamanca et al.[19] combined parametric schemes of PVs with the Weather,Research and Forecasting (WRF) multilayer UCM to investigate the impact of rooftop PV installation on near-surface air temperatures in Arizona.The results illustrated that rooftop DPVs could reduce summer near-surface air temperatures by 0.8 ℃.On urban rooftops in the Los Angeles area,rooftop DPVs over large areas have a cooling effect of up to 0.2 ℃ [20].However,other studies have shown that registered PV service provider systems can significantly warm cities during the day and cool them slightly at night owing to climate and building type effects [21].
Currently,urbanization in China is progressing at the fastest rate globally.The installation of rooftop DPVs is expected to help mitigate the energy crisis caused by urbanization and the damage to urban thermal environments.However,the impact of PV roofs on the urban thermal environment in China has not been fully investigated.Therefore,in this study we used Jiangsu Province as an example and the WRF model coupled with parameterization schemes for PV roofs was used to investigate the alleviating effects of DPV roofs with different powergeneration efficiencies on high summer temperatures and energy supply.The aim of this study is to provide effective data support for urban planning and energy supply strategies.
1 Model and data
1.1 WRF model and scheme selection
The WRF model is a mesoscale weather prediction model developed collaboratively by the National Centers for Environmental Prediction (NCEP),National Center for Atmospheric Research,and several universities [22].It exhibits extensive applicability from small to global scales.It serves not only for operational weather forecasting but is also used in several domains of atmospheric numerical simulations.
Currently,within the WRF framework,urban canopy schemes available for selection are the UCM,Building Effect Parameterization,and a combination of the Building Effect Parameterization and Building Energy Models.These schemes must be coupled with the Noah land surface scheme,which adequately provides the sensible urban surface and latent heat fluxes within the lower boundary layer.For this simulation,the UCM scheme was adopted.It considers urban geometry,the impact of buildings on short-and long-wave radiation,and the effects of radiation shading.This scheme enhances the model’s representation of urban atmospheric dynamics and thermodynamics by introducing anthropogenic heat sources,thereby better capturing urban heat island characteristics.Other physical parameterization schemes include the rapid radiative transfer model long-wave radiation scheme [23],Dudhia shortwave radiation scheme [24],WRF single-moment 6-class microphysics scheme [25],Mellor-Yamada-Janjić boundary layer scheme,and the Monin-Obukhov surface scheme [26].Because of the higher resolution of the inner domain,the convective parameterization scheme Grell-3 was used only for the outermost layer.
1.2 Cases and urban parameter configuration
In the summer of 2022,Jiangsu Province experienced 34 d with temperatures exceeding 35 ℃,marking this period as one of the hottest since 1961.This study selected the period from 08:00 on August 12,2022 to 08:00 on August 16,2022,the peak of summer high temperatures,for the simulation.A preliminary simulation over 6 h was conducted to stabilize the model before the main analysis.The simulation was conducted using a triple-nested grid with resolutions of 27,9,and 3 km,centered at (33.828°N and 118.992°E) as shown in Fig.1(a).Land-use data,including the innermost layer covering Jiangsu Province,were obtained from the MODIS_15s product data shown in Fig.1(b).The initial and boundary conditions were derived from NCEP’s 0.25° × 0.25° reanalysis data,which were updated every 6 h.The model was configured with 43 vertical layers,of which the lowest 13 layers spanned altitudes < 1 km.
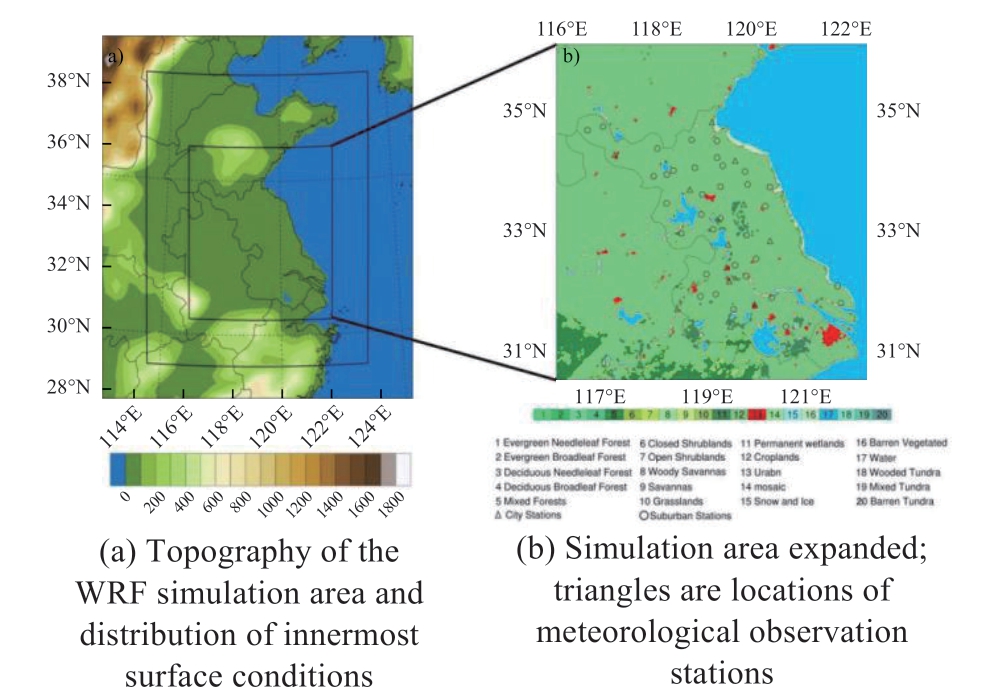
Fig.1 WRF simulation area and land use in the innermost domain
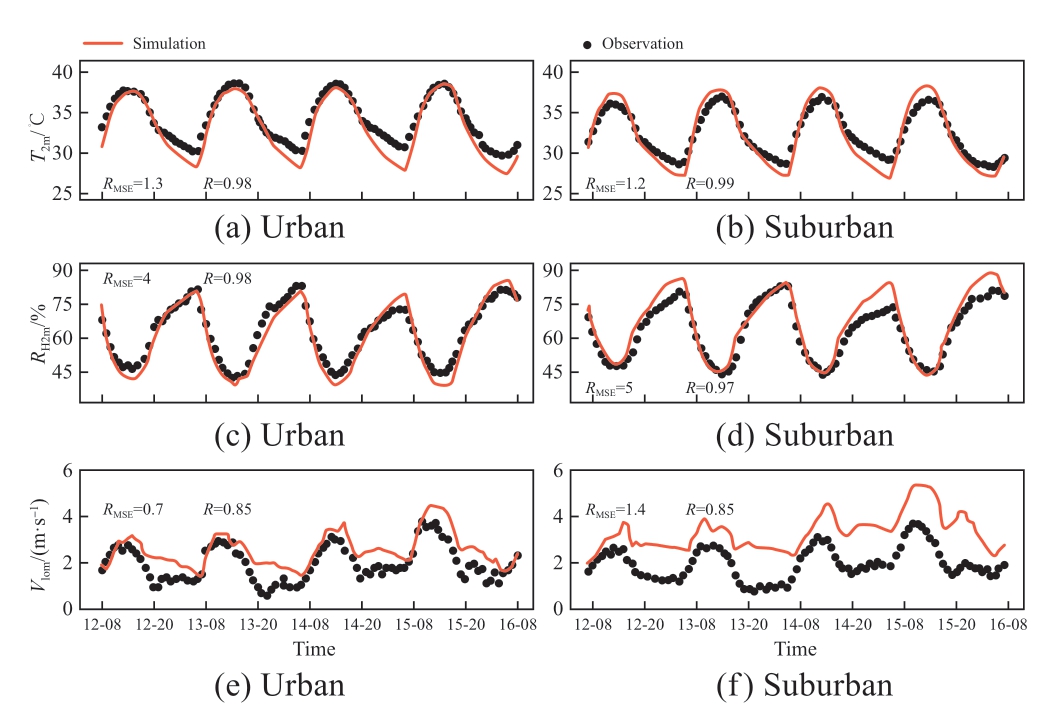
Fig.2 Simulated and observed temperature and relative humidity at 2 m,and wind speed at 10 m at different sites
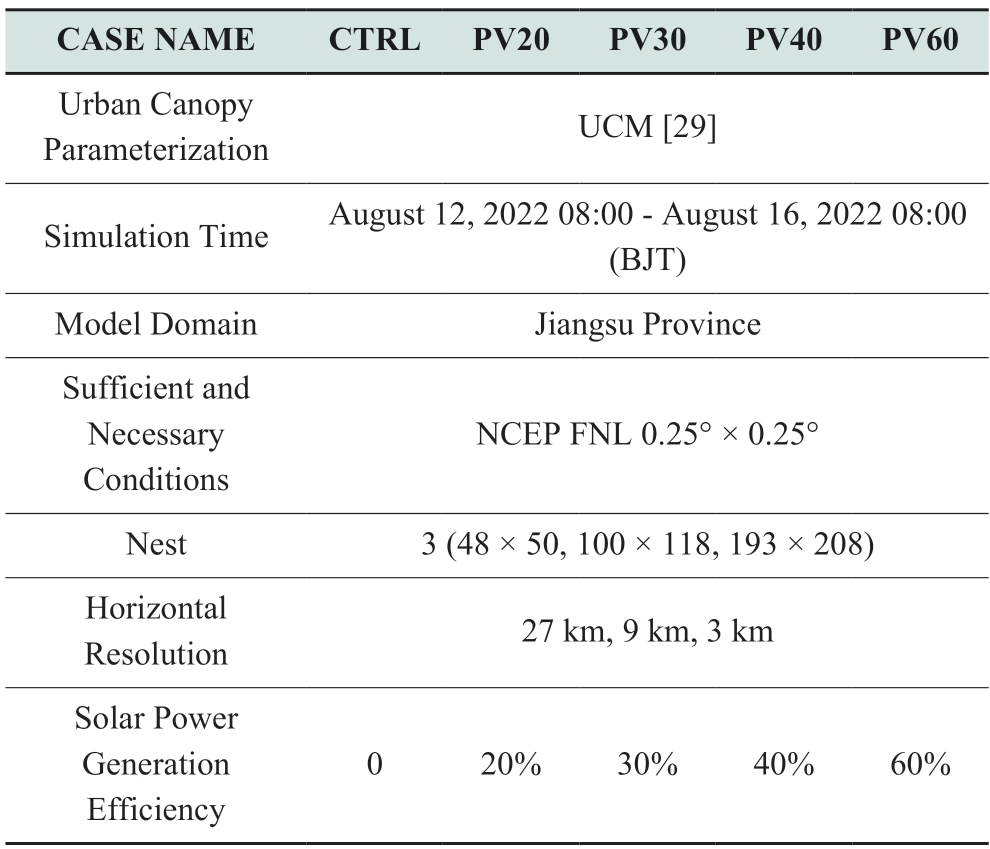
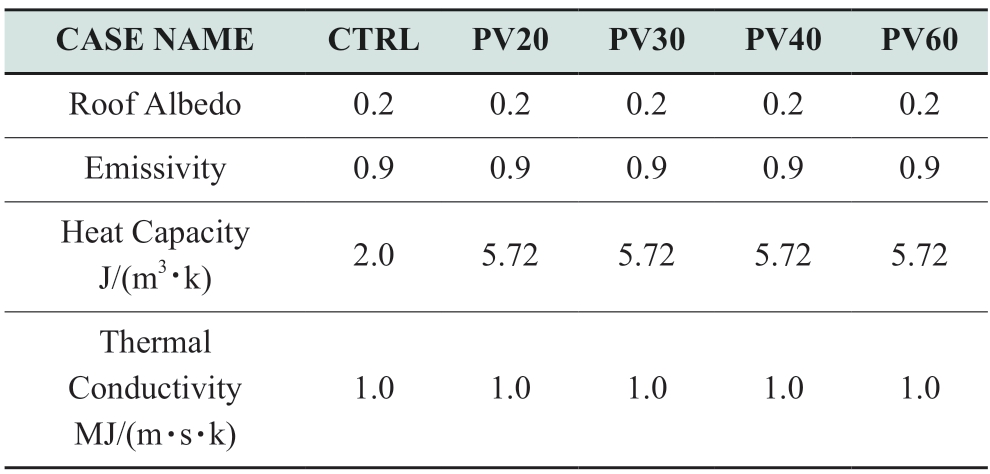
To assess the mitigating effects of rooftop DPVs with different power generation efficiencies at high summer temperatures in Jiangsu Province,five scenarios were established based on solar panel efficiency.The CTRL scenario served as the control and represented regular rooftops without DPVs.The PV20,PV30,PV40,and PV60 scenarios represent rooftop DPVs with efficiencies of 20,30,40,and 60%,respectively.The thermal properties of the rooftop DPVs in these scenarios were set based on the parameters reported by Tan et al.[27].These parameters related to building characteristics such as roof width,street width,building height,and proportion of artificial materials in the urban area,and were determined based on the statistical analyses of urban building forms in Jiangsu Province,as presented by Sun et al.[28].Details are shown in Table 1.
Table 1 Numerical cases and urban parameters
continue
1.3 Parameterization scheme for radiative processes in rooftop DPVs
In this study solar radiation computation methods within the UCM,which is integrated into a WRF model,are modified.The aim is to assess the impact of rooftop DPV systems on urban energy provisioning.In this investigation,it was assumed that the solar panels are affixed to rooftops.Guided by the algorithm governing the rooftop parameters within the UCM scheme [29],key thermal attributes,including roof albedo,emissivity,heat capacity,and thermal conductivity,were systematically adjusted to facilitate the calculation of the rooftop distributed PV characteristics.These parameter modifications were calibrated with reference to prior studies,particularly those by Tan et al.[27]and Zonato et al.[30],as detailed in Table 1.
Traditional PV panels are rapidly developing.The efficiency of PV panels has evolved from < 20% to > 40%,with the expectation of achieving 60% efficiency in the near future [31,32].Consequently,this study introduced four distinct scenarios to represent rooftop distributed PV systems with PV efficiency levels of 20,30,40,and 60%,referred to as PV20,PV30,PV40,and PV60,respectively.The computational framework for these scenarios integrates a comprehensive scheme that accounts for the solar energy absorption by solar panels.For instance,with 30% PV conversion efficiency,the model accounts for the thermal impact of solar panel exposure to shortwave solar radiation,which leads to elevated temperatures.Consequently,this study accommodated additional longwave radiation emissions attributable to solar panel heating within the context of absorbed shortwave radiation.Consequently,a solar panel albedo of 0.2 is obtained,with the panels absorbing 80% of the received solar energy.About 30%of the absorbed energy is effectively converted into electrical energy,whereas the remaining 70% is transmitted through the solar panels and subsequently absorbed by the underlying surface.The combined assessment yielded a PV conversion efficiency of 24% (30% × 80%).
Moreover,the approach formulated by Voyant et al.[33]was used to estimate the electricity generation derived from rooftop DPV systems.
In this equation,Epv is the electricity generation from solar panels,ηpv is the PV panel efficiency,I is the incoming solar radiation,and S is the surface area covered by the solar panels.In accordance with the architectural parameters within the WRF model,it was determined that the total building area within Jiangsu Province accounted for approximately 30.83% of the overall urban expansion.This information serves as the basis for computing electricity generation from rooftop DPV systems.
2 Model Evaluation
The model evaluation used meteorological data from benchmark observation stations in Jiangsu Province,which were subjected to rigorous quality control procedures.The locations of the benchmark stations are shown in Fig.1(b).Hourly data for temperature and relative humidity at 2 m,and wind speed at 10 m were collected from 45 meteorological observation stations in Jiangsu Province.These data,gathered from August 12-16,2022,were used to evaluate the model’s CTRL scenario.The meteorological stations were categorized into two groups based on their underlying surface types: urban stations (11) and suburban stations (34),and their statistics were assessed separately.
Figure 2 provides a comparison between the observed and simulated values of the temperature and relative humidity at 2 m,and wind speed at 10 m for the urban and suburban stations.As indicated by Figs.2(a) and 2(b),the trends in the simulated and observed temperatures at 2 m at urban and suburban stations are well aligned,with R values of 0.98 and 0.99,respectively (as detailed in Figs.2a and b).This demonstrates that the model can capture diurnal variations in temperature.In urban areas,the simulation results for the period from 08:00 to 22:00 matched the observations well,although the simulated lowest temperatures were relatively low compared with the observations.For the suburban stations,the simulations between 08:00 and 12:00 and between 16:00 and 20:00 were consistent;however,the simulated highest temperatures were higher and the lowest temperatures were lower than those observed.The Root Mean Square Error(RMSE) for urban and suburban stations were 1.3 ℃ and 1.2 ℃,and the Mean Bias Error (MBE) were -1.0 ℃ and-0.7 ℃,respectively,indicating that the model slightly underestimates temperatures compared to observations.This means that although there may be some bias in the results of the model when used for analyzing daily minimum temperature,the model can relatively accurately reflect the changes in temperature at 2 m and can be used for analyzing temperature changes.
For the relative humidity at 2 m,the model effectively captured diurnal variations,as shown in Figs.2(c) and 2(d).For the urban and suburban stations,the correlation coefficients are 0.98 and 0.97,respectively.The RMSE values are 4% for urban stations and 5% for suburban stations,with MBE values of 1.8% and 2.8%,respectively.For the urban stations,the simulation results were generally close to the observations during the simulation period.For suburban stations,the simulated values were generally higher than those observed at night.This phenomenon arises because the model simulates lower temperatures at 2 m,which subsequently results in higher relative humidity,as cooler air holds less moisture.Nevertheless,overall,the model accurately reproduces the relative humidity at 2 m in urban areas.
Unlike the temperature and relative humidity at 2 m,the model effectively reproduced the trends of the wind speed at 10 m,although it did not provide precise numerical values.The model was able to reproduce the timing of peaks and troughs of wind speed as observed,as illustrated in Figs.2(e) and 2(f).The correlation coefficients for high wind speeds at both urban and non-urban stations were 0.85,with RMSE values of 0.7 m·s-¹ and 1.4 m·s-¹,and MBE values of -0.57 m·s-¹ and -0.56 m·s-¹.The wind speed simulations tended to overestimate,with urban stations showing slightly lower overestimation than suburban stations.This discrepancy may be attributed to the model’s 3 km resolution,which may not effectively represent the roughness of the actual surface,resulting in diminished drag effects and subsequently leading to simulated wind speeds that are slightly higher than those of the observations.
3 Results
3.1 Impact on temperature at 2 m
The installation of rooftop DPVs significantly influences the temperature at 2 m.The cooling effects of rooftop DPV systems with different power generation efficiencies are shown in Fig.3.Figure 4 shows the average differences in the temperature at 2 m between daytime (08:00-20:00)and nighttime (21:00-07:00) from August 12-16,2022,compared to CTRL.As shown in Fig.3,the cooling effect was the least pronounced at 05:00 and 17:00,and most significant at 09:00 and 21:00.The cooling effect due to the PVs gradually increased with higher power generation efficiency.For PV60,the maximum average cooling effect reached 0.75 ℃.Fig.4 demonstrates that the cooling effect of the rooftop DPV system on the temperature at 2 m becomes more pronounced as the power generation efficiency increases,with nighttime cooling being more effective.For PV20,daytime cooling results in an average temperature reduction of 0.1-0.2 ℃,while nighttime cooling ranges from 0.2-0.4 ℃.For rooftop DPV systems with the highest power generation efficiency (PV60),daytime cooling can exceed 1 ℃,and nighttime cooling is more substantial,in Jiangsu Province.
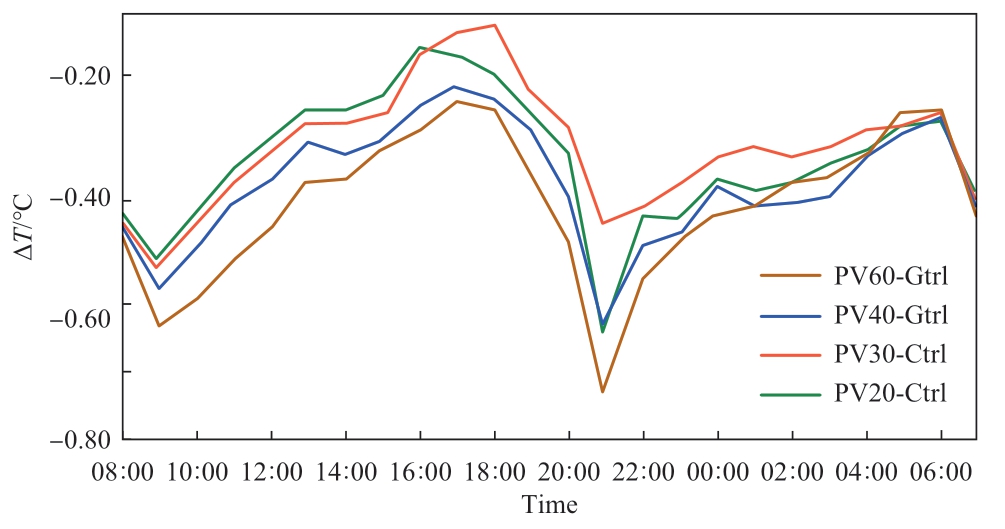
Fig.3 Cooling effects for different PV efficiencies of rooftop DPVs
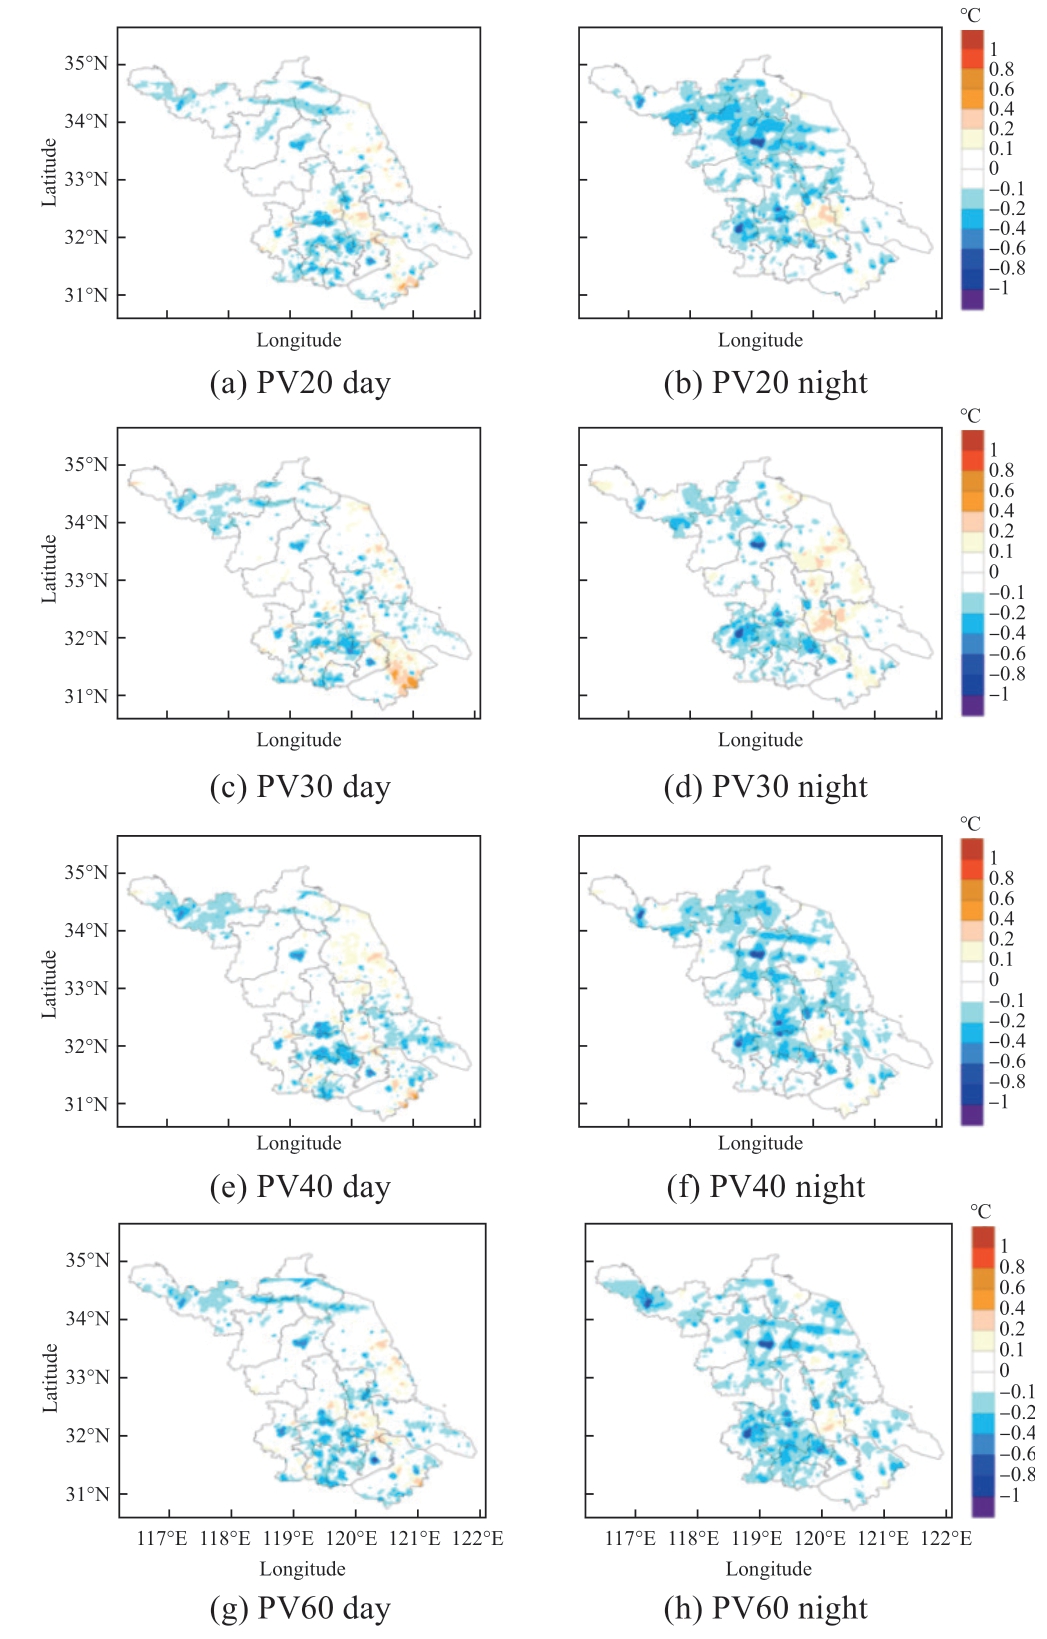
Fig.4 Simulated cooling effects of rooftop DPV for daytime(08:00 -20:00) and nighttime (21:00 -07:00) compared to CTRL
Temperature variations were primarily induced by changes in the urban surface energy balance.To clarify the changes in the urban surface energy,Fig.5 presents the diurnal variations in the urban surface energy components for different scenarios.Net radiation (RN) undergoes slight variations at midday,with the lowest and highest values being exhibited by CTRL and PV60,respectively.This is mainly because the remaining three components (the downward shortwave radiation,the downward longwave radiation and the upward shortwave radiation) affecting RN do not differ significantly across the scenarios.However,the lowest surface temperature in PV60 resulted in the lowest upward longwave radiation,leading to the maximum RN.Compared to the CTRL case,the daytime temperature reduction was mainly attributed to the decrease in the sensible heat flux (SH) and the decline in the roof heat storage (G).The impact on latent heat flux (LH) was relatively minor,with much smaller magnitude of changes compared to those in SH and G.During the day,rooftop DPVs convert a portion of the absorbed solar energy into electricity,causing a reduction in rooftop temperatures and a significant decrease in SH and G.At night,the changes in RN,SH and LH were minimal,with a significant drop in the G contributing to lower night-time temperatures,which were more pronounced.
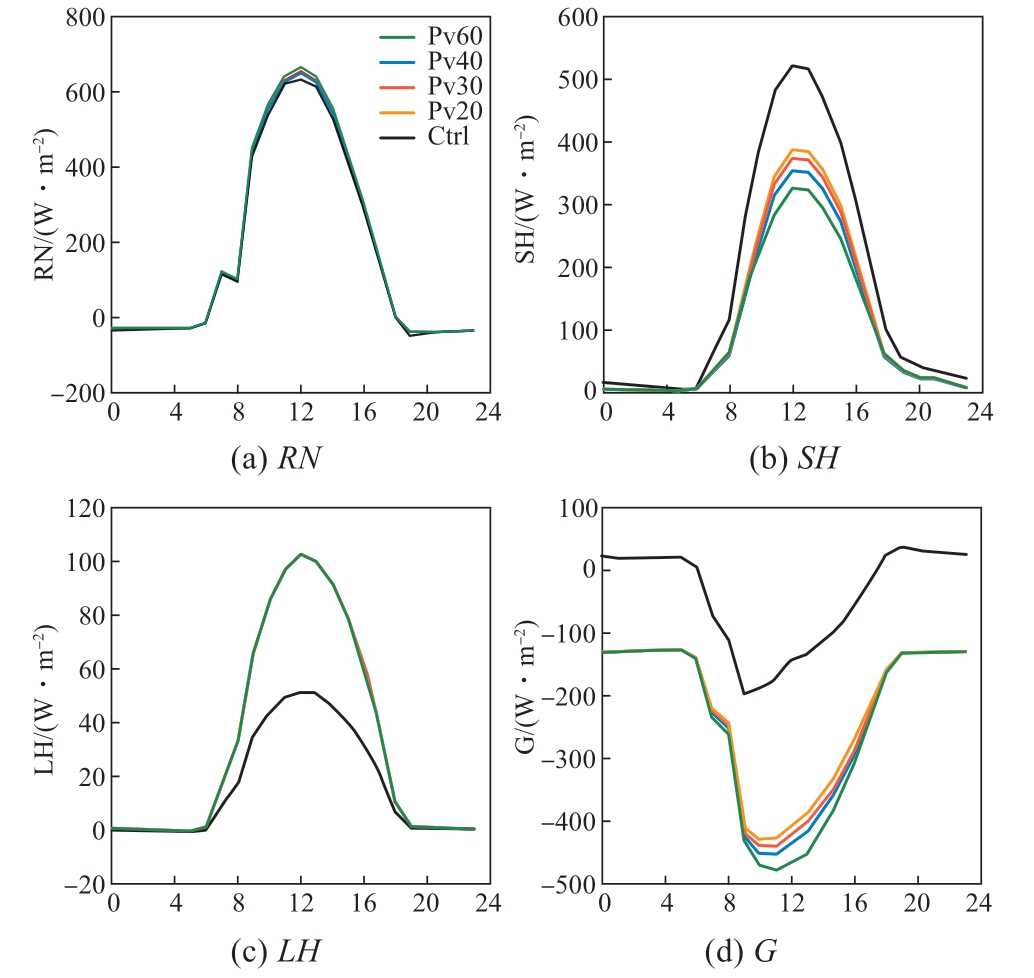
Fig.5 Diurnal variation of urban surface energy balance
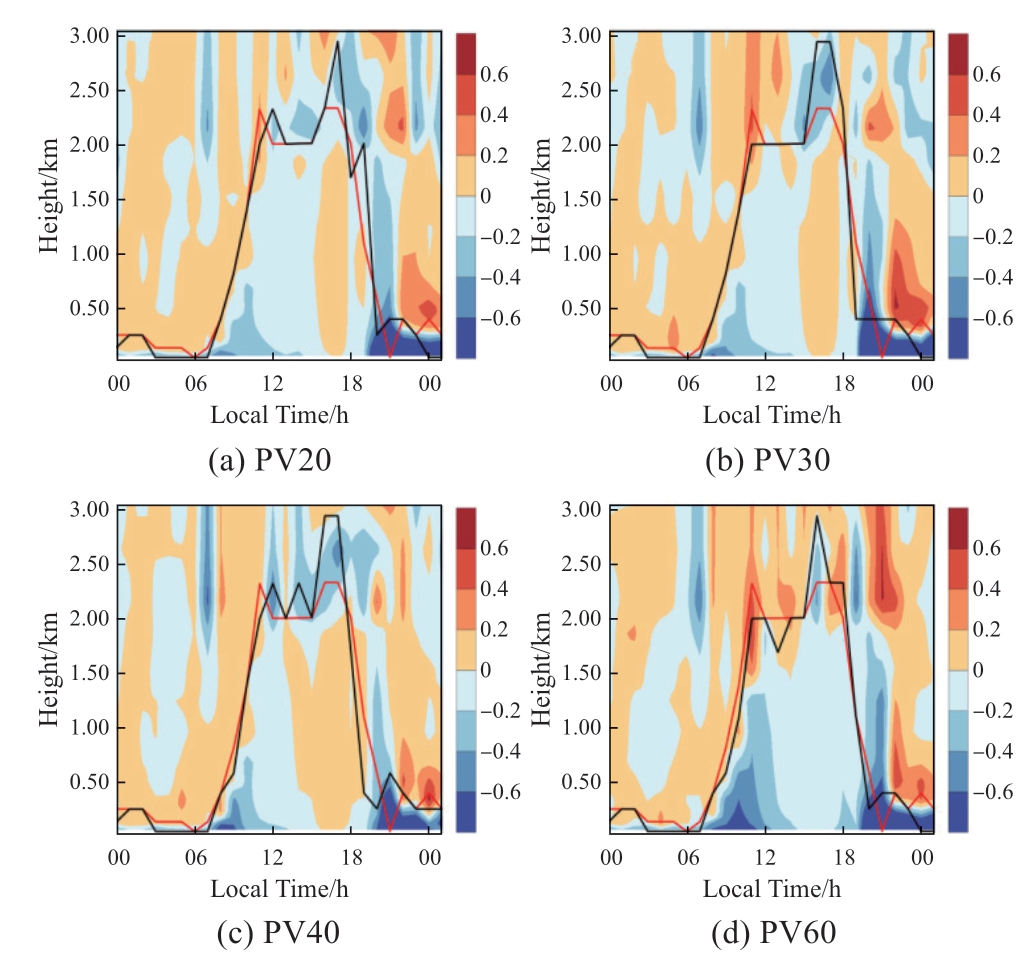
Fig.6 Boundary layer height comparison with CTRL.Black line is CTRL red lines are PV scenarios.Shading shows temperature differences
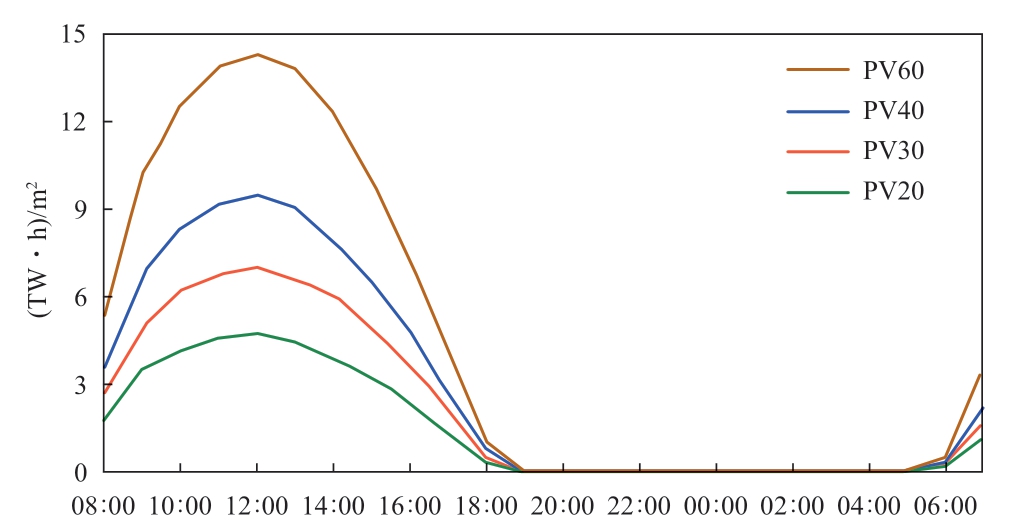
Fig.7 Hourly average electricity generation profiles for different PV rooftop efficiency scenarios over 4-d period
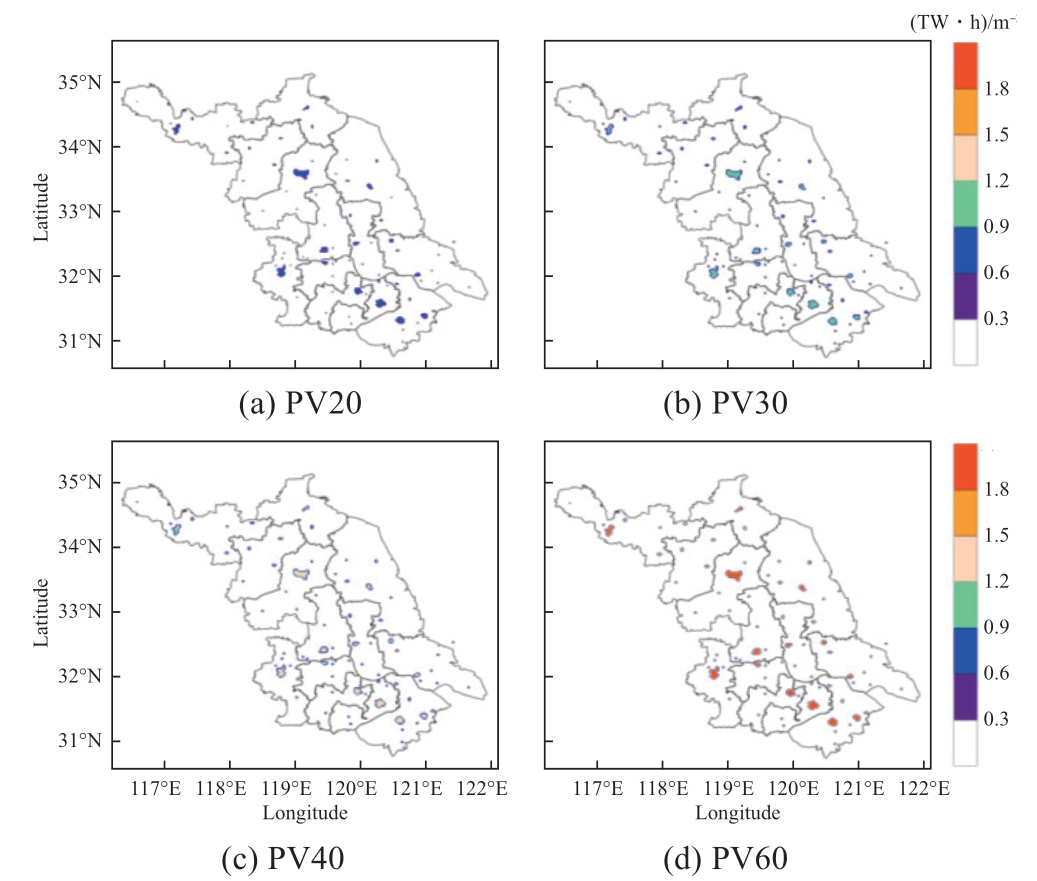
Fig.8 Electricity generation from rooftop PV systems from August 12-16,2022
Moreover,as shown in Fig.5,with increasing solar power generation efficiency,both SH and ground heat flux decrease.This is because the cooling effect becomes more pronounced as the power generation efficiency increases.
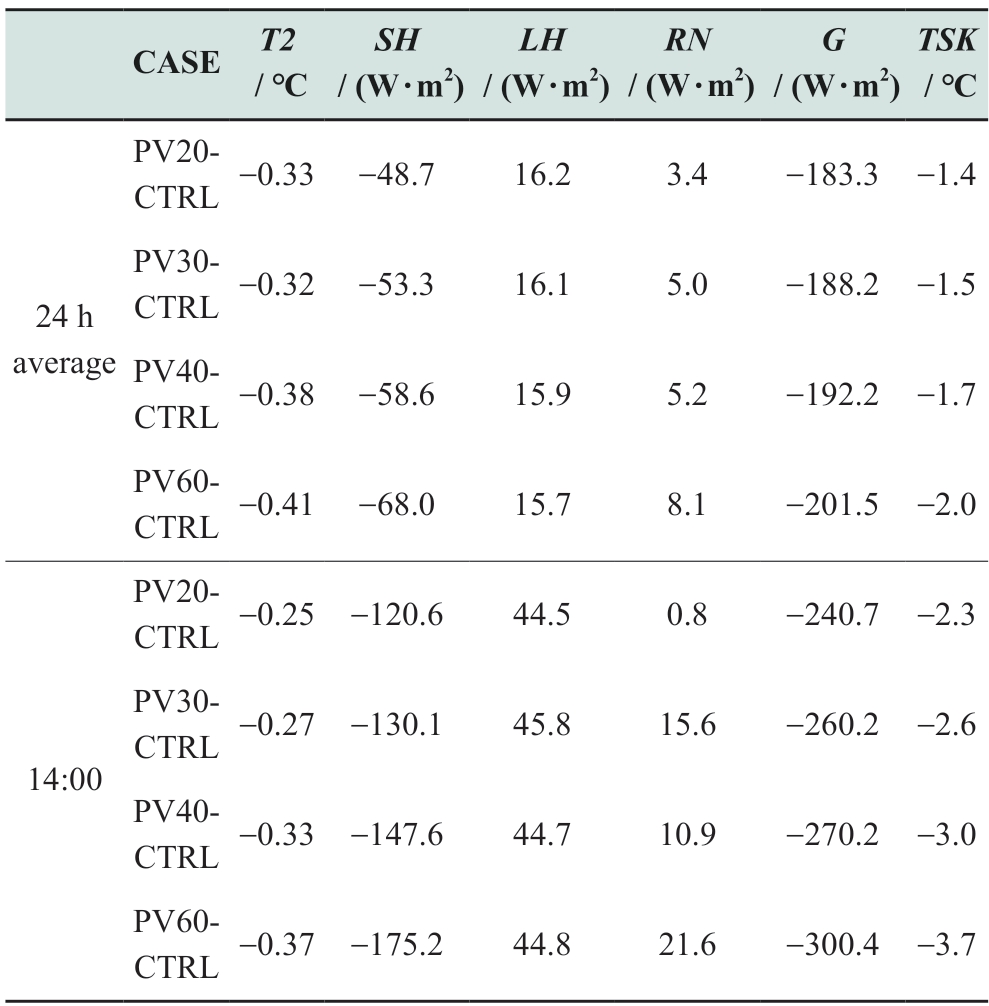
The impact of the rooftop DPV system on the temperature at 2 m at different times also varied.Table 2 illustrates the effects of rooftop DPV systems on the 24-h average,and 14:00 temperature at 2 m (T 2),urban heat flux,and surface temperature (TSK).The table shows that the cooling effect at 14:00 from installing rooftop DPVs in summer is about 0.06 ℃ lower than the average daily temperature reduction.For the TSK,the reduction in temperature at 14:00 is approximately 1 ℃ less compared to the average daily reduction.For the PV60 scenario,both the air and surface temperatures at 2 meters decreasedsignificantly,accompanied by significant reductions in sensible heat.Further substantiating that the daytime temperature changes are primarily due to reduced surface heat flux and SH caused by the installation of rooftop DPV systems.
Table 2 Impact of different efficiency rooftop DPVs on 24 h average and 14:00 temperature and heat parameters
3.2 Impact on boundary layer air temperature
Figure 6 presents the diurnal variation in the boundary layer heights and temperature differences in the boundary layer for the rooftop DPV and CTRL cases from August 12 to August 16,2022.The figure shows that the cooling effect of the rooftop DPV within the boundary layer increases with as the PV efficiency improves.For PV20,PV30,and PV40,rooftop DPVs significantly reduce the temperature within the boundary layer during the day,with a maximum cooling of approximately 0.3 ℃.The impact extended to higher altitudes,reaching the top of the boundary layer at approximately 2-3 km by 12:00.At night,the influence is more pronounced in the near-surface layer,however,it occurs at lower altitudes.The installation of rooftop DPV lowers the temperature within the boundary layer by approximately 0.7 ℃ during the night as shown in Figs.6(a) -6(d).
Furthermore,the mitigation of urban heat not only affects near-surface meteorological conditions but also alters the local boundary layer structure.The installation of rooftop DPVs has led to a decrease in the boundary layer height in urban areas,with the maximum reduction reaching approximately 500 m during the day.At noon,when the turbulence is most pronounced owing to the influence of large-scale motion,the boundary layer changes are more evident.The impact of the PV20 rooftop DPV system on the boundary layer height was slightly weaker;however,as the efficiency of photovoltaic panels increases,the influence of rooftop DPVs on boundary layer height gradually intensifies.The reduction in the boundary layer height may be attributed to the installation of the rooftop DPV systems,which led to a decrease in the near-surface air temperature,weakening turbulent transport,and diminishing vertical air motion.
3.3 Rooftop DPV electricity generation
In contrast to other urban heat mitigation measures,rooftop DPVs offer additional benefits of electricity generation for residential,commercial,and industrial purposes.Figure 7 depicts the hourly average electricity generation curves for rooftop DPVs with different power generation efficiencies,effectively showcasing the diurnal fluctuations in solar power generation.As the sun ascends,solar radiation gradually intensifies,resulting in a peak in electricity generation at 12:00.It then wanes over the course of the day,tapering entirely as solar radiation dwindles to zero by approximately 19:00.Figure 8 presents the total electricity generation from August 12-16,2022,for rooftop DPV systems with differing efficiencies.Electricity generation increases with increasing power generation efficiency.For rooftop installations with a 20% efficiency,electricity generation ranges from 0.6-0.9 kWh·m-2 during the 4-day span.In contrast,rooftop DPVs with the highest efficiency rate (60%) can generate over 1.8 kWh·m-2.
To ascertain whether the rooftop DPV tested in this study can produce sufficient electricity to meet the energy requirements of Jiangsu Province,Figure 9 presents the electricity generation (1 TW·h=109 kW·h) for rooftop DPVs with varying power generation efficiencies from August 12-16,2022.As illustrated in Fig.9,PV20,PV30,and PV60 generated 141.2,285.3,and 435.1 TW·h during the 5-d period,respectively.According to statistics from the Jiangsu Regulatory Office of the National Energy Administration (September 2022),the total electricity consumption for the entire month of August amounted to 620.88 TW·h.Assuming constant daily electricity consumption throughout August,the total electricity consumption over our simulated period was 80.11 TW·h,as depicted by the red line in Fig.9.The data in Fig.9 demonstrate that all four scenarios with varying power generation efficiencies for rooftop DPVs can successfully meet the total electricity demand of the province.However,it is essential to note that this study assumes 100% coverage of urban building rooftops with PV installations,whereas in reality,rooftop coverage typically reaches a maximum of approximately 40%.Therefore,the actual electricity generation was approximately 60% lower than the values above.When the photovoltaic conversion efficiency is set at 30% (PV30),the electricity generation for full rooftop coverage amounts to 213.4 TW·h.Even with rooftop PVs covering only 40% of building areas,the electricity generation reaches 85.36 TW·h,surpassing the actual total electricity consumption of the province.
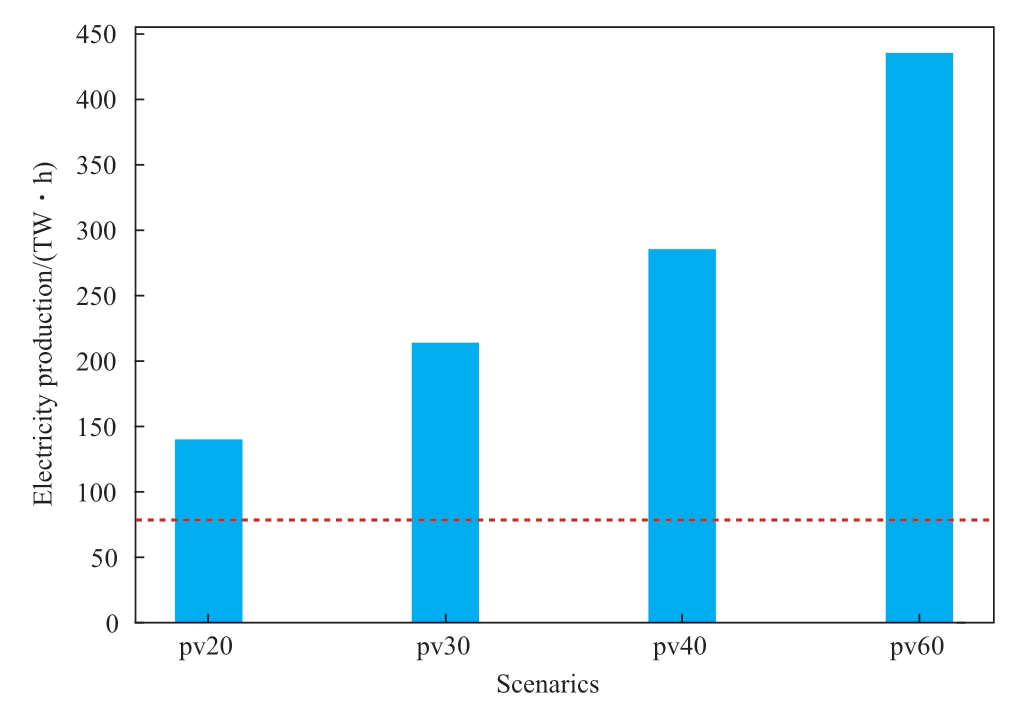
Fig.9 Electricity generation from rooftop PV systems from August 12-16,2022.Red line is total electricity demand during simulated period
4 Conclusion and discussion
The WRF model was used to investigate the regional impacts of large-scale rooftop-DPV installations on the summer thermal environment and energy supply in Jiangsu Province.The assumption of 100% rooftop coverage with solar panels presents a significant limitation for practical rooftop DPV installations.This assumption serves as a reference for assessing the impact of rooftop DPV systems on the urban thermal environment.In contrast to previous strategies for mitigating summer heat (high-reflectivity roofs and green roofs),this study additionally analyzed energy generation and electricity production from rooftop DPVs.
Rooftop DPVs absorb solar shortwave radiation for electricity generation and alter the radiation and energy balance of the rooftop surface.The presence of solar panels leads to a reduction in surface heat flux and,consequently,a decrease in the SH that directly heats the atmosphere in urban areas,resulting in a reduction in the air temperature at 2 m.Nighttime urban surface heat flux decreases,resulting in a decrease in heat storage at the surface,and a decrease in the air temperature at 2 m of from 0.2 ℃-0.6 ℃ at night.These findings are consistent with similar results obtained in previous studies conducted in the Paris area by Masson et al.[13] and simulations of California by Li et al.[34],indicating that rooftop DPVs have the potential to lower the air temperatures at 2 m during both the day and night.Moreover,the cooling effect becomes more pronounced with increasing power generation efficiency,with an average reduction of 0.37 ℃ in air temperature at 2 m at 14:00.
The installation of rooftop DPVs not only impacts near-surface temperatures,but also exerts some influence on the temperatures within the boundary layer.The most significant daytime cooling within the boundary layer occurs around midday,with temperature reductions ranging from 0.1-0.7 ℃,while the maximum nighttime cooling in the boundary layer is approximately 0.6 ℃.Cooling was pronounced below 500 m in the boundary layer during the day and below 300 m during the night.Zhang et al.[35]made similar findings in their studies on high-reflectivity and green roofs,indicating that the temperature decrease in the upper regions of the boundary layer was relatively weaker than that for near-surface temperatures.
Rooftop DPVs provide the most direct benefit for generating electricity for users,thereby reducing the dependence on fossil fuels and mitigating global warming.From August 12-16,2022,assuming that all building rooftops were entirely covered with solar panels,even at a 20% efficiency rate (PV20),electricity generation was sufficient to meet the total electricity demand.At a 40% efficiency rate,the electricity generation amounted to 285.3 TW·h,and at a 60% efficiency rate (PV60),the electricity generation reached 435.1 TW·h,surpassing the actual total electricity consumption during this period.In a more conservative scenario,assuming a PV conversion efficiency of 30% (PV30),full rooftop coverage generated 213.4 TW·h.Even with only 40% of building areas covered by PV rooftops,electricity generation still reached 85.36 TW·h,exceeding the total actual electricity consumption of 80.11 TW·h.These findings further substantiate the results obtained by Ma et al.[36] in their simulation of rooftopdistributed PV installations in the Sydney region,indicating that such installations can offset regional societal electricity consumption.Future research should implement different rooftop-DPV calculation schemes in the WRF model to better inform the development of urban energy supply solutions.
Acknowledgments
The authors thank the editors and reviewers for their comments,suggestions,and valuable time and effort in reviewing the manuscript.This study was supported by the National Key R&D Program of China (Key Techniques of Adaptive Grid Integration and Active Synchronization for Extremely High Penetration-Distributed Photovoltaic Power Generation,2022YFB2402900).
Declaration of competing interest
We declare that we have no conflict of interest.
References
[1] Zhang Z,Chen M,Zhong T,et al (2023) Carbon mitigation potential afforded by rooftop photovoltaic in China.Nat Commun 14,2347
[2] Esch T,Heldens W,Hirne A,et al (2017) Breaking new ground in mapping human settlements from space—the global urban footprint.Photogramm.Remote Sens,134: 30-42
[3] Johansson T B,Patwardhan A P,Nakićenović N,et al (2012)Global Energy Assessment: Toward a Sustainable Future.(Cambridge University Press,Cambridge)
[4] Seto K,et al (2014) Climate Change 2014: Mitigation of Climate Change.IPCC Working Group III Contribution to AR5(Cambridge University Press,New York)
[5] Ribeiro H V,Rybski D,Kropp J P (2019) Effects of changing population or density on urban carbon dioxide emissions.Nat Commun 10,3204
[6] Oke T R (1982) The energetic basis of the urban heat island.Quarterly Journal of the Royal Meteorological Society,108(455):1-24
[7] Wang S,Wang Z,Zhang Y,et al (2022) Characteristics of Urban Heat Island in China and Its Influences on Building Energy Consumption.Appl.Sci,12
[8] Guzmán-Sánchez S,et al (2018) Assessment of the contributions of different flat roof types to achieving sustainable development.Building and Environment,141(15),182-192
[9] Li D,Bou-Zeid E,Oppenheimer M (2014) The effectiveness of cool and green roofs as urban heat island mitigation strategies.Environmental Research Letters,9(5)
[10] Bevilacqua P,Mazzeo D,Bruno R,et al (2017) Surface temperature analysis of an extensive green roof for the mitigation of urban heat island in southern mediterranean climate.Energy and Buildings,150: 318-327
[11] Alonso-Marroquin F,Qadir G (2023) Synergy between Photovoltaic Panels and Green Roofs.Energies,16
[12] Dominguez A,Kleissl J,Luvall J C (2011) Effects of solar photovoltaic panels on roof heat transfer.Solar Energy,85(9):2244-2255
[13] Masson V,Bonhomme M,Salagnac J L,et al (2014) Solar panels reduce both global warming and urban heat island.Frontiers in Environmental Science,2
[14] Yang H,Zhu Z,Burnett J,et al (2001) A simulation study on the energy performance of photovoltaic roofs.ASHRAE transactions,107
[15] Horváth M,Kassai-Szoó D,Csoknyai T (2016) Solar energy potential of roofs on urban level based on building typology.Energy and Buildings,111: 278-289
[16] Dondariya C,Porwal D,Awasthi A,et al (2018) Performance simulation of grid-connected rooftop solar PV system for small households: A case study of Ujjain,India.Energy reports,4: 546-553
[17] Chen B,Che Y,Wang J,et al (2022) An estimation framework of regional rooftop photovoltaic potential based on satellite remote sensing images.Global Energy Interconnection,5: 281-292
[18] Pamain A,Kanaka Rao P V,Tilya F N (2022) Prediction of photovoltaic power output based on different non-linear autoregressive artificial neural network algorithms.Global Energy Interconnection,5: 226-235
[19] Salamanca F,Georgescu M,Mahalov A,et al (2016) Citywide impacts of cool roof and rooftop solar photovoltaic deployment on near-surface air temperature and cooling energy demand.Boundary-layer meteorology 161(1): 203-221
[20] Taha H (2013) The potential for air-temperature impact from large-scale deployment of solar photovoltaic arrays in urban areas.Sol.Energy,91,358-367
[21] Sailor D J,Anand J,King R R (2021) Photovoltaics in the built environment: A critical review.Energy and Buildings,253
[22] Klemp J B (2004) Weather research and forecasting model:A technical overview.Proceedings of the 84th AMS Annual Meeting,Seattle,WA,USA,10-15
[23] Mlawer E J,Taubman S J,Brown P D,et al (1997) Radiative transfer for inhomogeneous atmospheres: RRTM,a validated correlated-k model for the longwave.Journal of Geophysical Research: Atmospheres,102(D14): 16663-16682
[24] Dudhia J (1989) Numerical study of convection observed during the winter monsoon experiment using a mesoscale twodimensional model.Journal of the atmospheric sciences,46(20):3077-3107
[25] Hong S Y,Dudhia J,Chen S H (2004) A revised approach to ice microphysical processes for the bulk parameterization of clouds and precipitation.Monthly Weather Review,132(1): 103-120
[26] Paulson C A (1970) The mathematical representation of wind speed and temperature profiles in the unstable atmospheric surface layer.Journal of Applied Meteorology,9(6): 857-861
[27] Tan H C,Kotamarthi R,Wang J,et al (2023) Impact of different roofing mitigation strategies on near-surface temperature and energy consumption over the Chicago metropolitan area during a heatwave event.Science of the Total Environment,860
[28] Sun Y,Zhang N,Miao S,et al (2021) Urban Morphological Parameters of the Main Cities in China and Their Application in the WRF Model.Journal of Advances in Modeling Earth Systems,13(8)
[29] Kusaka H,Kondo H,Kikegawa Y,et al (2001) A Simple Single-Layer Urban Canopy Model For Atmospheric Models:Comparison With Multi-Layer And Slab Models.Boundary-Layer Meteorology,101: 329-358
[30] Zonato A,Martilli A,Gutierrez E,et al (2021) Exploring the effects of rooftop mitigation strategies on urban temperatures and energy consumption.Journal of Geophysical Research:Atmospheres,126
[31] Green M A,Emery K,Hishikawa Y (2016) Solar cell efficiency tables (version 47).Progress in Photovoltaics Research and Applications,24:3-11
[32] Lewis N S (2007) Toward cost-effective solar energy use.Science,315(5813): 798-801
[33] Voyant C,Muselli M,Paoli C,et al (2009) Predictability of PV power grid performance on insular sites without weather stations:use of artificial neural networks.European Photovoltaic Solar Energy Conference and Exhibition,4141-4144
[34] Li D,Sun T,Liu M,et al (2015) Contrasting responses of urban and rural surface energy budgets to heat waves explain synergies between urban heat islands and heat waves.Environmental Research Letters,10(5)
[35] Zhang C L,Chen F,Miao S G (2009) Impacts of urban expansion and future green planting on summer precipitation in the Beijing metropolitan area.Journal of Applied Meteorology and Climatology,48: 484-501
[36] Ma S,Goldstein M,Pitman A (2017).Pricing the urban cooling benefits of solar panel deployment in Sydney,Australia.Scientific Reports,7

Scan for more details
Received: 5 June 2024/Revised: 31 July 2024/Accepted: 5 August 2024/Published: 25 December 2024
 Hai Zhou
zhouhai@epri.sgcc.com.cn
Siyu Hu
husiyu@epri.sgcc.com.cn
Weidong Chen
chenweidong@epri.sgcc.com.cn
Fan Yang
yangfan4@epri.sgcc.com.cn
2096-5117/© 2024 Global Energy Interconnection Group Co.Ltd.Production and hosting by Elsevier B.V.on behalf of KeAi Communications Co.,Ltd.This is an open access article under the CC BY-NC-ND license (http://creativecommons.org/licenses/by-nc-nd/4.0/).
Biographies

Hai Zhou (1975),male,master’s degree,professor level senior engineer,research interests in electric meteorology and renewable energy power prediction.

Weidong Chen (1989),male,master’s degree,senior engineer,research interests in electric meteorology and renewable energy power prediction.

Siyu Hu (1997),female,master’s degree,engineer,research interests in renewable energy power output prediction.

Fan Yang (1997),male,master’s degree,engineer,research interests in renewable energy power output prediction..
(Editor Yanbo Wang)
