0 Introduction
Power system transmission lines, which are characterized by long spans, high voltages, and complex terrains, are highly susceptible to unplanned outages caused by abnormal objects and environmental factors.In severe cases, this can lead to unplanned line outages, posing significant risks to the safe and stable operation of transmission lines [1, 2].In recent years, national and provincial transmission line failures have occurred frequently because of the effects of abnormal objects and adverse environmental factors, which not only cause high economic losses but also seriously affect the quality of residents’ lives [3, 4].As carriers for the transmission and distribution of electrical energy,transmission lines are characterized by their widespread distribution and deployment at the edges.Their safe and reliable operation is crucial for the sustained and stable operation of power grids [1, 2].However, traditional manual inspection and maintenance of transmission lines suffer from issues such as low efficiency, difficulty in ensuring safety,high workload, and poor accuracy, making it challenging to meet practical demands [5, 6].Therefore, undertaking the construction of smart transmission lines and improving the level of digitization of transmission lines is extremely important for ensuring the safe and stable operation of transmission lines, reducing economic losses, enhancing the living standards of residents, and guaranteeing worker safety [7, 8].
Convolutional neural networks (CNNs) have been widely used in image object detection because of their advantages over traditional detection methods in terms of category recognition, detection accuracy, and efficiency [9].With the increasing effectiveness and strong capabilities of deep CNN technology demonstrated in various image object detection tasks, its application in the construction of smart power transmission lines in power systems has become a recent research focus for improving the intelligence levels of power transmission lines [10, 11].A series of CNN models,such as FastRCNN, FasterRCNN, YOLOv3, and YOLOv4,have been applied to the intelligent recognition of power transmission line images [10-12].However, these models entail significant computational and parameter load [13-15],directly affecting the real-time performance and hardware resource consumption of target detection.For example, the FasterRCNN model has a computational complexity and parameter count of approximately 207 B (1 B=109 scale)and 40 M (1 M=106 scale), respectively.The YOLOv4 model has a computational complexity and parameter count of approximately 12 M and 52 M, respectively, whereas those of the YOLOv3 model are approximately 19 B and 61 M, respectively.Even for lightweight models like YOLOv3-tiny [16, 17], the computational complexity and parameter count of the standard model reach approximately 5.56 B and 8.44 M, respectively.In environments with limited access to power and computational resources at the edges of power transmission lines, the resource consumption of such models remains a significant overhead item.
The immense computational loads and parameter counts of the aforementioned CNN models pose challenges when applied to resource-constrained power-edge environments.Achieving a balance between the accuracy and efficiency of power-edge target detection is crucial for practical applications.Informed by the research on artificial intelligence hardware architecture [18-21] and inspired by[20], this study proposes a novel quantization method based on Exponential Pre-Alignment (EPA).This approach aims to significantly reduce hardware resource consumption while maintaining high-precision target detection.
The proposed EPA method is experimentally validated using a real-world dataset of anomalous target images collected from power transmission lines.The results demonstrate that the method maintains high accuracy while significantly reducing the data bit width.Compared with standard models based on the single-precision floatingpoint format (FP32), the EPA-based quantization approach achieves an exceptional balance between precision and efficiency.It consumed only 31.25% of the resources, with a mere 1.2% loss in accuracy (mean Average Precision,or mAP@0.5 decreased from 56.4% in FP32 to 56% after EPA-based quantization).Additionally, the EPA-based quantization enables floating-point data to be directly accumulated using integer arithmetic, which can be adapted to the efficient hardware architecture of compute-in-memory(CIM), aligning well with the potential and trends of energy-efficient computing hardware architecture in power grids [21].The proposed method and research findings are applicable for realizing efficient real-time target detection at the edges of power transmission lines and can be extended to other application scenarios.
1 Proposed transmission line abnormal object detection-oriented energy-efficient low-bit-width data method
This study proposes an EPA-based quantization method to perform floating-point quantization on networks.This method can reduce network hardware resource consumption while maintaining high accuracy, thereby improving network energy efficiency and making it more suitable for resource-constrained applications at the edge of the power grid.Specifically, after applying the EPA method to floating-point quantization, the data format closely aligns with the highly efficient CIM hardware architectures.If a network is deployed on the CIM hardware circuits designed as described in [20], its energy and network efficiencies can be maximized.This approach can achieve strong coupling between hardware circuits and software algorithms and can significantly improve the effectiveness of abnormal target detection in transmission circuits.
1.1 Floating-point EPA method
Object detection networks generally operate based on the number of floating points.Although low-bit quantization of integers can further reduce network resource consumption and improve detection efficiency, changing the data format results in a significant loss of precision performance.This study ensures precision while improving the detection efficiency by employing EPA and its associated floatingpoint quantization method without altering the data format.This can achieve a favorable balance between precision and performance efficiency.
1.1.1 Floating-point representation in computers
The Institute of Electrical and Electronics Engineers(IEEE) 754 standard 32-bit floating-point (FP32) format is shown in Fig.1 [22].The highest bit, sign, serves as the sign bit, determining the sign of the number, occupying 1-bit width, denoted by S.The exponent represents the exponent code, occupying 8 bits in width, and is denoted by E.
The mantissa accounts for 23 bits, represented by M, and the 1 implied in the floating-point number is added to M.
According to (3), the decimal equivalent of the FP32 format data in Fig.1 is -0.375.
Evidently, the data bit width is a crucial factor affecting both detection accuracy and efficiency.Although the FP32 format ensures precision in network training and inference,longer data bit widths require more hardware resources,which is not conducive to deployment at the edge.Clearly,quantizing data to reduce the bit width is a worthwhile research endeavor.

Fig.1 FP32 representation of a decimal number (-0.375)under the IEEE 754 standard
1.1.2 Floating-point quantization-aware training
The deep structure and vast number of parameters of deep neural networks endow them with the ability to learn higher-level features from large datasets.However, this also imposes strict hardware requirements for efficient computation and storage.With the rise of edge artificial intelligence (AI), the efficient processing of deep neural networks has become particularly crucial.Edge devices have strict resource and energy budget requirements,while also requiring that tasks are handled in real time.Merely relying on hardware architecture improvements is insufficient to meet the computational demands of the continuous growth of model parameters.Therefore, it is worthwhile to explore the data quantization of models from an algorithmic perspective.The principles of the quantization-aware training (QAT) method proposed in this study are as follows:
The core concept of QAT is the implementation of a quantization simulator during network training, thereby introducing quantization errors into the training process [23].In the inference process of quantized fixed-point numbers,the quantization operations primarily involve quantizing weights and each layer’s output activation values.Therefore,QAT embeds quantization/dequantization operations (also known as pseudo-quantization) for weights and activations in each layer during the forward propagation process.Employing dequantization means that the data actually used during training remain in the floating-point form, but the quantization error for each layer is introduced into the network training process, allowing for the minimization of this quantization error through gradient descent.
Based on the characteristics of the base generated by the quantization function, it can be divided into nonuniform and uniform quantization.Nonuniform quantization divides the quantization range unequally using different strategies,resulting in varying intervals between different quantization levels.Uniform quantization divides the quantization range equally and ensures uniform intervals between quantization levels.If the range of the floating-point number x is (xmin,xmax), and it needs to be quantized to a range of (0, Nlevels-1),for instance, with 8-bit quantization where Nlevels=256, Δ is defined as the quantization scale, representing the step size between different quantization levels, i.e., the quantization resolution.z is defined as the zero-point offset.The quantization formula is as follows:

where xint represents the integer part of the floating-point conversion and the round function is used for rounding.xQ denotes the final quantized result where the clamp function serves as a truncation function, as expressed in (6), to prevent an impact on the quantization resolution when there is a large sparse distribution of inputs.

The de-quantization formula is given by (7), using the quantized value to represent the floating-point value.
When the zero-point offset z is set to zero, the quantization process described above becomes symmetric.The formulations of symmetric quantization are shown in(8)-(10), where (10) represents the symmetric quantization process.


A simulated quantization approach was employed in the subsequent training and testing processes.This involved a process in which quantization was immediately followed by dequantization.Specifically, the quantization process was simulated during the forward propagation.In this process, both the weights and activation values were first quantized to a predetermined low bit width and then dequantized back to floating-point numbers with a higher bit width, introducing errors.The overall training remained in floating-point numbers, whereas the gradients obtained during backpropagation represented the gradients of the quantized weights.These gradients were then used to update the weights before quantization, incorporating errors into the training process and enhancing the detection accuracy of the quantized network.
1.1.3 Principle of the EPA method
Existing computer chips, such as CPUs/GPUs, are manufactured based on the von Neumann architecture,where the computing units are separated from the storage units, and the majority of the energy consumption occurs in the data transfer between these units.Two prominent issues affecting the computational efficiency of von Neumann architecture chips in executing dense multiply-accumulate(MAC) operations in neural networks are identified.First,the separation between computation and storage leads to a significant amount of data transfer, resulting in low computational efficiency.Second, when performing MAC operations on floating-point data, an exponent alignment of the operands is required before each addition operation can be carried out.
To address the aforementioned issues, a novel floatingpoint MAC (FP MAC) data operation method with EPA was proposed in [20] along with the design of a corresponding CIM hardware circuit to address the two challenges affecting the computational efficiency of neural network algorithms.By employing EPA and mantissa shifting, floating-point numbers are adapted to integer MAC operations suitable for CIM architectures, thereby avoiding frequent exponent alignment operations before each addition operation, leading to a significant enhancement in computational efficiency.The principle of this approach is illustrated in Fig.2.The EPA extraction method is described as follows:
1) In the first step, the exponents Ei and mantissa Mi(including sign bit Si) of the data (including the inputs and weights) are separated from the original data.
2) In the second step, the data are compared to obtain the maximum exponent, Emax.
3) In the third step, the difference between each input data exponent and the maximum exponent is calculated as Esubi=Emax-Ei.
4) In the fourth step, the corresponding mantissa is shifted based on each difference value as Mshifti= Mi>>Esubi.

Notably, EPA must be performed separately for the input and weight data.The specific Python code for the EPA is provided in Appendix A, Part 1.
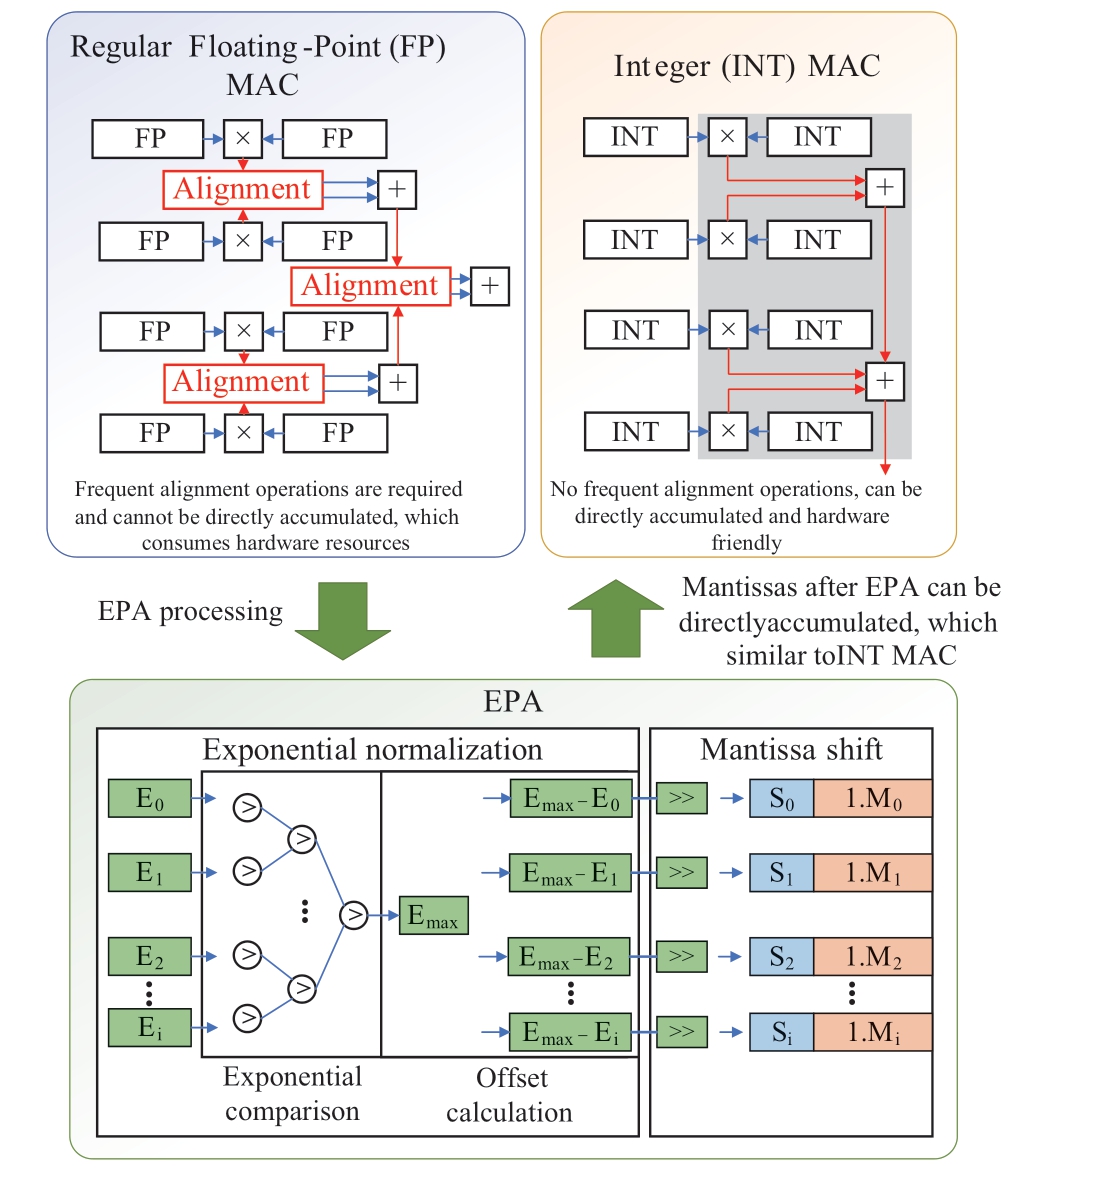
Fig.2 Schematic diagram of the EPA method
1.2 EPA processing and improved low-bit-width quantization training method for object detection networks
The most fundamental and time-consuming operation of an object detection network is convolutional computation.Building on the EPA method proposed in the previous section, an algorithm is devised to improve the convolutional operations of specific network models by adopting EPA data formats.This enhancement enables the network to be trained with EPA, thereby addressing the potential loss of precision owing to mantissa shifting caused by EPA during training, consequently reducing errors and enhancing the inference accuracy of the network.
The EPA modification process for the convolutional computation code in the network is conducted as follows:
Step 1: Calculate to obtain the number of data, nMAC,that perform MAC operations in the convolution operation;that is, the number of data points in the convolution kernel.
Step 2: Divide the nMAC data in the input and weight into N groups, with n_EPA for each group.If the nMAC is not divisible by n_EPA, zeros are added.
Step 3: Apply EPA and mantissa shifting to each group of n_EPA data for both inputs and weights, following the method described in Section 1.1.3.
Step 4: Perform MAC operations on the n_EPA data corresponding to the inputs and weights to obtain N MAC results.
Step 5: Similar EPA processing is performed for N MAC results according to Steps 1-4.
Step 6: Sum up the N MAC results.
The specific Python code for EPA in the convolutional computation is provided in Part 2 of Appendix A.
After summing the results, the data must be restored to a floating-point representation according to the following steps:
Step 1: Extract the exponent E from the data.
Step 2: Based on the extracted E and the required number of mantissa bits nM, extract the mantissa and roundtruncate the mantissa bit width.
Step 3: Restore exponent E and truncate the mantissa to the floating-point form.
Part 3 of Appendix A provides the Python code for restoring the floating-point format after convolutional computation.
After modifying the convolutional computation code in the network, training can be conducted using the EPA method.Applying EPA to a network reduces the frequency of the exponential alignment operations.Notably, the data bit width is also a critical factor affecting computational efficiency.Based on the proposed method, further adjustments can be made to the bit widths of network inputs,outputs, weights, and biases.By combining the reduction in bit widths with the EPA concept for network training, the hardware resource overhead can be further reduced while maintaining accuracy, thereby enhancing the efficiency of target detection.
Notably, the EPA method in this study does not employ specific regularization techniques, such as scaling and normalization steps; instead, it adopts regularization methods inherited from the open-source YOLOv3-tiny version itself to ensure the numerical stability of the algorithm.
2 Testing of the EPA-based quantification method for transmission line abnormal object detection
Because they are widely distributed and often situated in complex environments at the edge, power transmission lines possess characteristics such as the need to consider equipment deployment costs, limited hardware resources,and high real-time requirements.These characteristics are consistent with those of YOLOv3-tiny.Therefore, this study employed a specific YOLOv3-tiny network as the test network and applied it to a collected dataset of anomalies in power transmission lines to evaluate the effectiveness of the proposed method.
2.1 YOLOv3-tiny model and computational flow
The network model of YOLOv3-tiny is illustrated in Fig.3 and is divided into a feature layer fusion structure,Darknet-19 backbone network, and classification detection structure [24].The domain block list (DBL), the minimal component of the network, consists of convolutional layers(conv), batch normalization (BN) layers, and activation function layers (Leaky ReLU).The contact layer is utilized for tensor concatenation, the upper layer performs upsampling, and Maxpool represents the maximum pooling layer.Z1 and Z2 serve as the two output layers of the YOLOv3-tiny network, which are also referred to as YOLO layers.
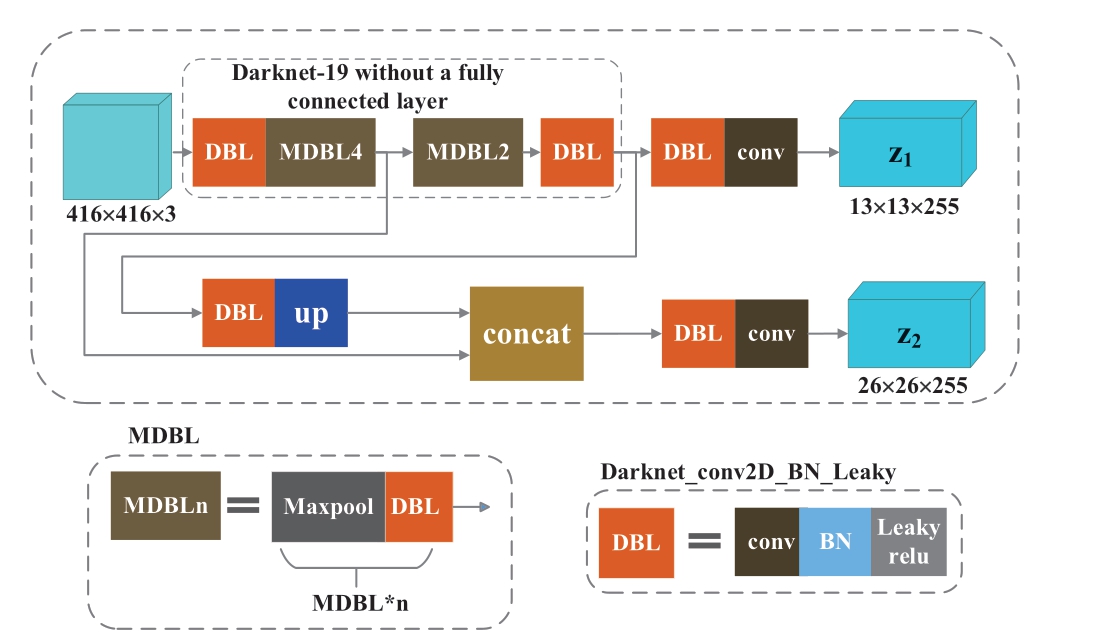
Fig.3 Network structure of YOLOv3-tiny [24]
The detailed computational process of the YOLOv3-tiny network is shown in Fig.4 [14], with an input image size of 416×416 fed into Darknet-19 for multiple convolutional computations.After feature parameter extraction, the size of the feature maps became 13×13 and 26×26, which can directly represent the target recognition information, but was insufficient to fully reflect the output of the target detection.Therefore, feature fusion was required.Finally, by stacking,fusing, and convolving feature maps of the same size,outputs Z1 and Z2 were obtained with output image sizes of 13×13×255 and 26×26×255, respectively.The network consisted of 24 layers, including 13 convolutional layers,six pooling layers, two route layers, one upsampling layer,and two output layers.The core idea of the algorithm is classifying and locating the target images directly without the need for region generation, extracting bounding boxes,and class probabilities as a single regression problem.YOLOv3-tiny utilizes multiple convolutional layers to extract feature maps, and its computational capacity directly affects the efficiency of target detection.
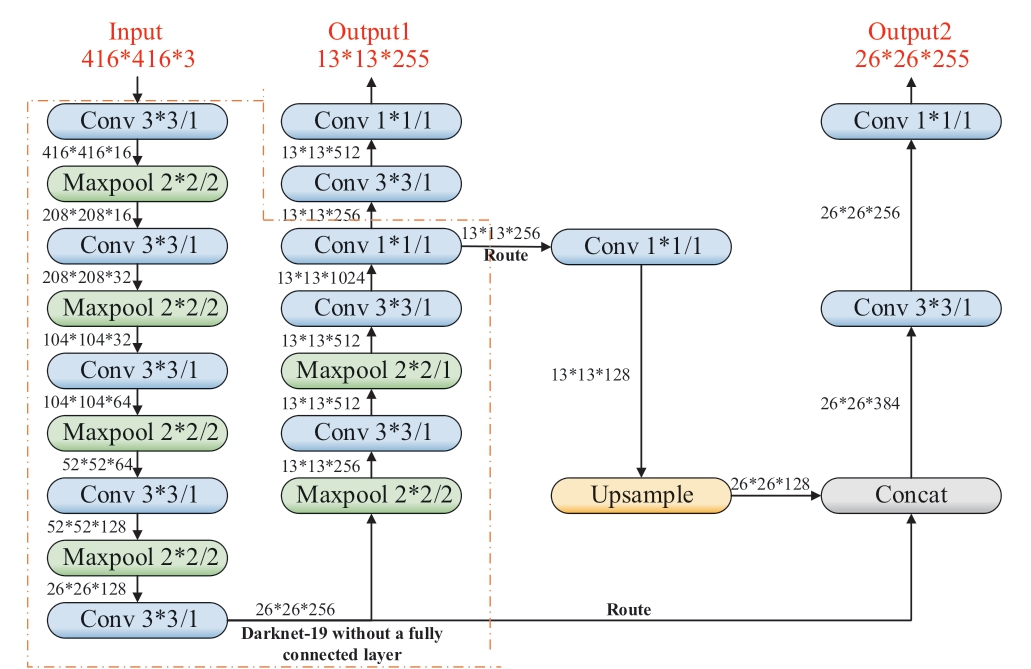
Fig.4 Detailed calculation flow of the YOLOv3-tiny network
2.2 Quantization training based on YOLOv3-tiny
2.2.1 Dataset preparation
In the application scenario of abnormal target detection in power transmission lines, the common targets that the detection algorithm must identify include cranes,pyrotechnics, tower cranes, construction machinery, and foreign conductor objects.Intelligent classification and localization of these targets are important for ensuring the safe and stable operation of power transmission lines and reducing economic losses.
The quality of the dataset is crucial for training effectiveness.The dataset used in this study was sourced from nonpublic real image data in.jpg format, collected by the China Electric Power Research Institute over several years.This dataset represents real scenarios of power transmission lines at the edge end and is extremely representative.The dataset preparation process, as shown in Fig.5, involves data cleaning, boundary box correctness verification, and dataset partitioning after obtaining the original dataset of abnormal targets in the power transmission lines.This ensures data quality and accuracy.Initially, a series of data cleaning operations, such as data deduplication, outlier handling, and data transformation,were performed to unify the relevant names of the five label categories: cranes, pyrotechnics, tower cranes, construction machinery, and conductor foreign objects.Subsequently,the bounding boxes in the label files of each image in the dataset were visualized and compared with those in the corresponding XML files of the original dataset to ensure the accuracy of the label information for each image,thereby enabling smooth model training and achieving optimal values for target detection.The label format for the abnormal target dataset in the power transmission lines in this study is a normalized.txt file, with label information represented as Y=(class, center_x, center_y, w, h), where the class is the category number of the detected target,center_x and center_y represent the center position of the object bounding box, and w and h denote the width and height of the bounding box, respectively.
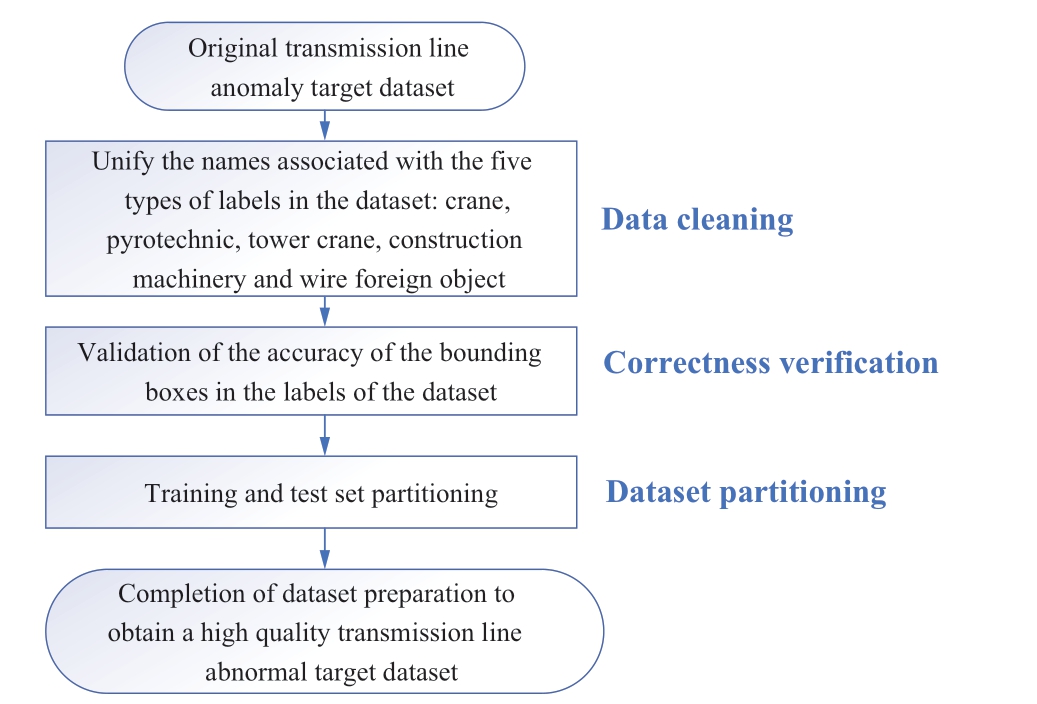
Fig.5 Preparation flow of dataset
The dataset for training and testing abnormal targets in power transmission lines consists of a total of 15,500 images, with a specific division as follows: 14,000 images for model training and 1,500 images for testing.The training set was further divided into training and validation subsets with 12,600 and 1,400 images, respectively, as shown in Fig.6.The validation set was used to determine the network structure and adjust the hyperparameters of the model, and the testing set was used to evaluate the generalizability of the model.
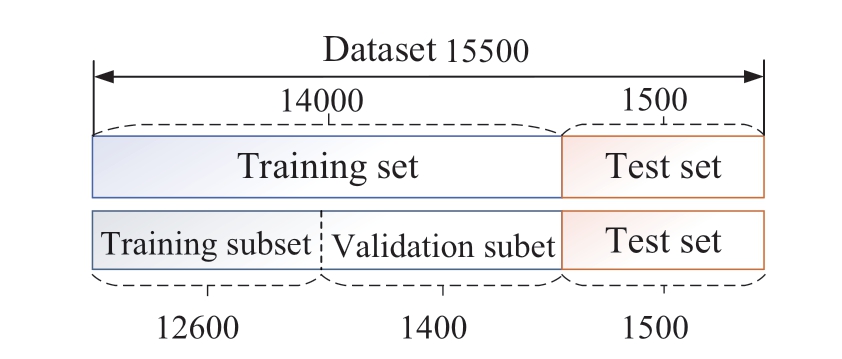
Fig.6 Partitioning of the abnormal target dataset of transmission lines
2.2.2 Training parameter setting
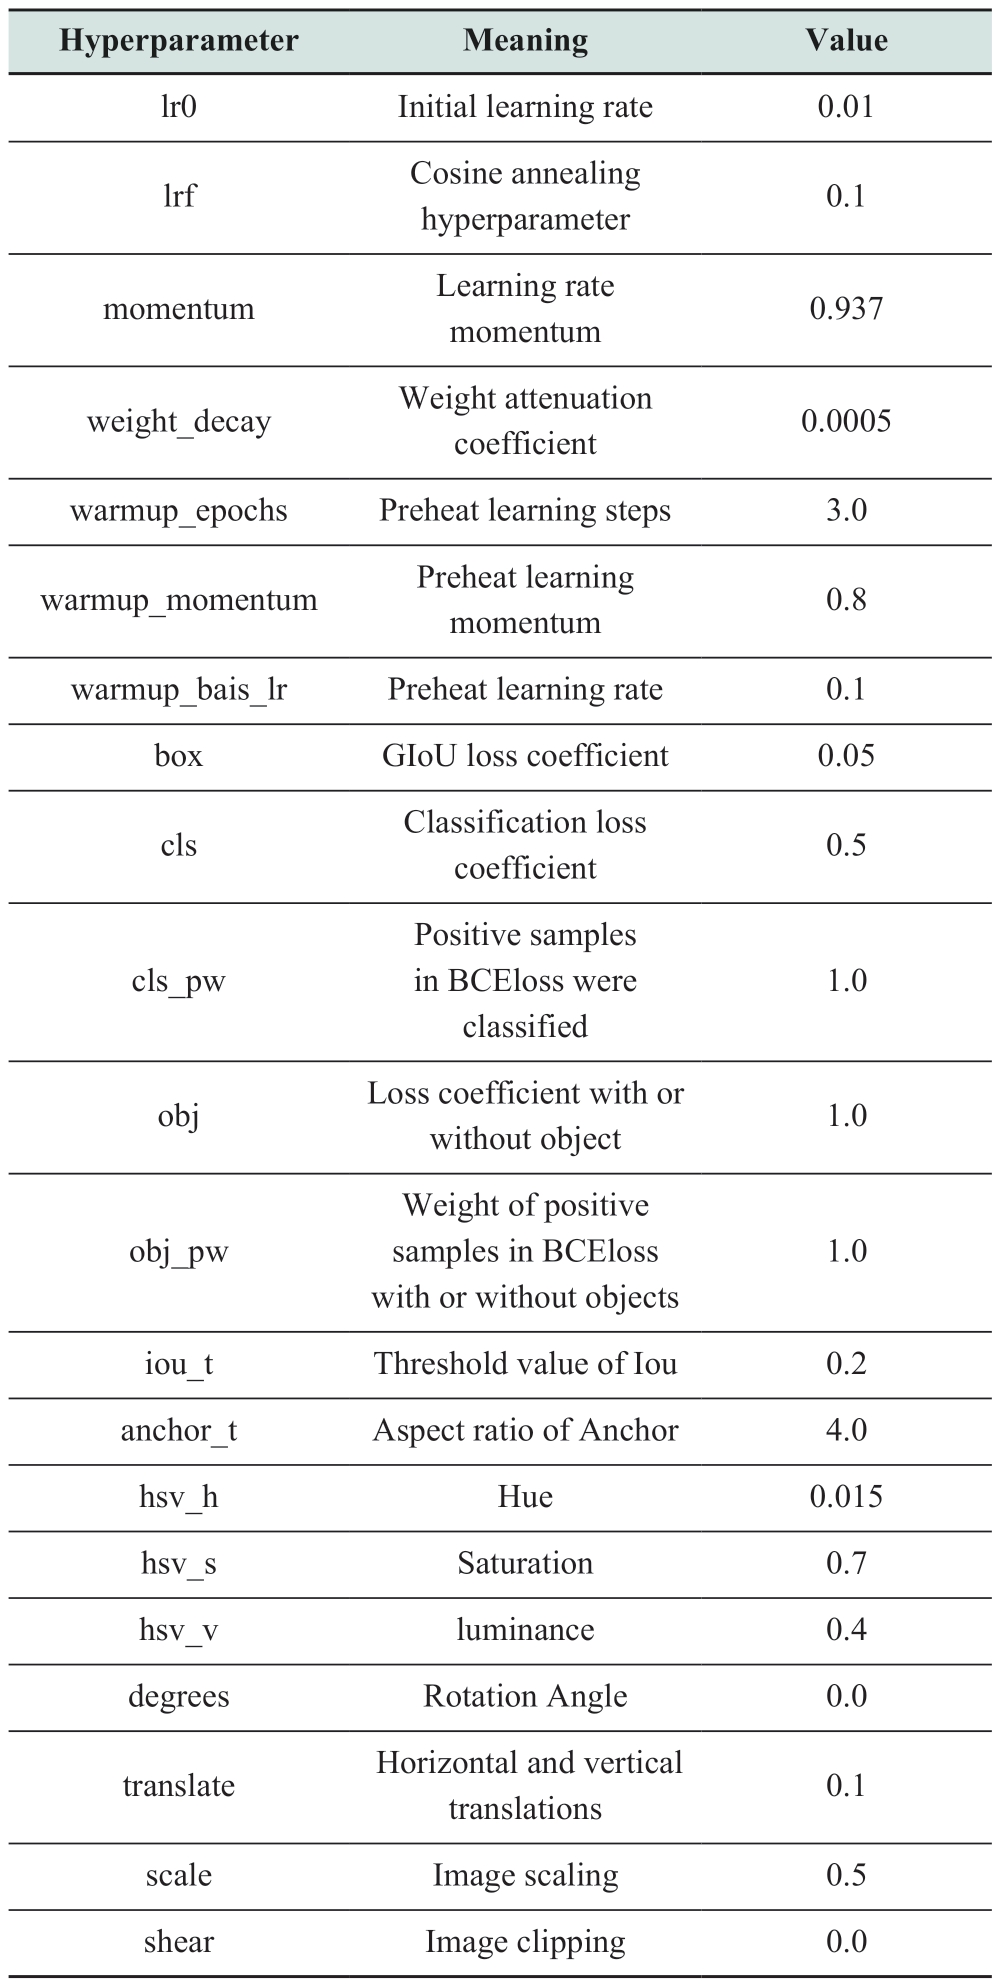
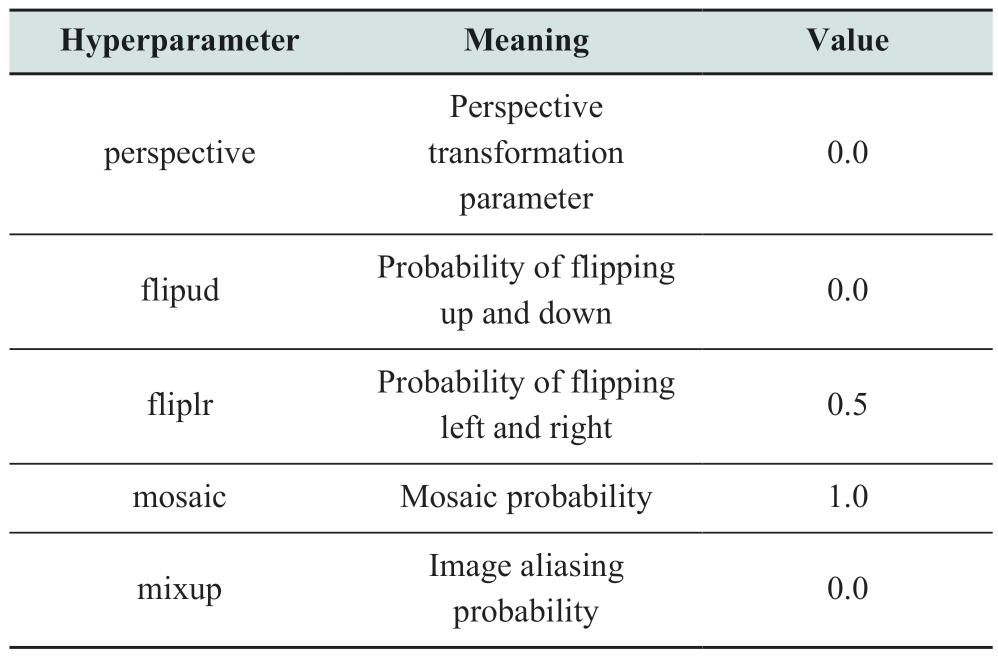
The meanings and settings of the hyperparameters for the YOLOv3-tiny network applied to the abnormal target dataset of power transmission lines are listed in Table 1.Parameters lr0 to anchor_t are essential for the training process, whereas parameters hsv-h to mixup are related to data augmentation.During the training, the total number of epochs was set to 300, the batch size for each iteration was set to 4, and the image size was set to 640×640 (the network was automatically resized to 416×416).The initial weights were obtained from YOLOv3-tiny.
Table 1 Hyperparameter settings of YOLOv3-tiny training process
continue
3 Testing of the EPA-based quantification method for transmission line abnormal object detection
Under the PyTorch framework, the YOLOv3-tiny network was processed using the EPA method, as described in Section 1.1.3, and then trained and tested on the abnormal target dataset of power transmission lines to obtain the target detection accuracy using different bit-width data, to find the optimal balance between accuracy and efficiency.Based on training experience, the number of EPA data points per group was set to 64, meaning that each batch of objects for prealignment processing consisted of 64 items.During training, adjustments were made to the data bit width of the input (IN), output (OUT), weights (W), and biases(B) to verify the accuracy.Based on the characteristics of the abnormal target dataset of power transmission lines,the exponential bit width for the input and weights was determined to be 4 bits.The verification of the target detection accuracy of the improved YOLOv3-tiny network with EPA for different combinations of bit widths for IN, OUT, W,and B (for simplicity, the IN, OUT, W, and B variables are divided into two groups) is presented in Table 2.
By training and testing the accuracy of target detection under different combinations of bit widths, it was found that when the bit widths of IN, OUT, W, and B were all 4 bits, mAP@0.5 reached 56%.This accuracy is comparable to that achieved with FP32 data (mAP@0.5=56.4%), yet with significantly reduced exponential and mantissa bit widths, and the ability to perform MAC operations directly after the EPA.Notably, in the EPA-based quantization method, an additional sign bit and an implicit fractional bit are required for the mantissa, meaning that the actual bit width for the 4-bit mantissa is six bits (4-bit mantissa + 1-bit sign + 1-bit fraction), resulting in a total bit width of 10 bits(4-bit exponent + actual 6-bit mantissa).Compared to FP32(1-bit sign + 8-bit exponent + 23-bit mantissa), the EPAbased quantization method can reduce the bit width by 22 bits, exchanging 31.25% (10/32) of bit-width resources for only a 1.2% loss in accuracy, achieving a good balance between accuracy and efficiency (significant reduction in hardware resource consumption, leading to efficiency improvement), thereby offering better overall performance.
From the results in Table 2, it can be observed that, in real-world applications, the EPA method does not exhibit significant rounding errors, as conventionally assumed.This observation can be attributed to the fact that the data distribution is not particularly wide and rounding errors can be mitigated by varying the group size (in this study, each aligned data group consisted of 64 elements).Furthermore, by training networks based on the EPA with different exponents and mantissa bit widths using datasets for detecting abnormal targets on transmission lines, the errors introduced during training can effectively ensure the accuracy of target detection.The proposed method leverages the precision advantages of floating-point calculations while circumventing the complexity of alignment operations and avoiding the limitation of the data size that fixed-point calculations can represent.
Table 2 Detection accuracy of transmission line anomaly target dataset corresponding to different parameter bit widths of the YOLOv3-tiny network (mAP@0.5)
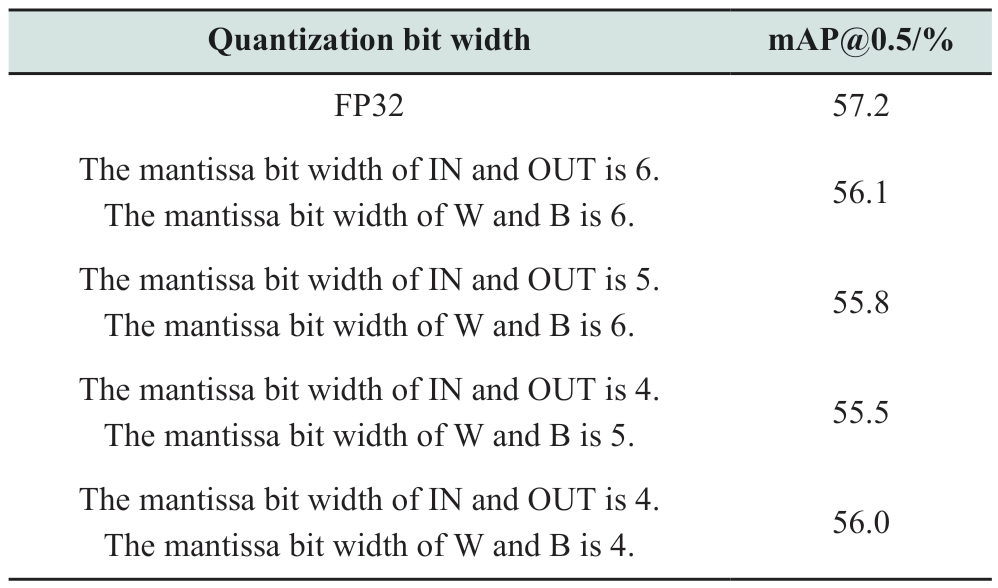
Table 2 demonstrates the effectiveness of the proposed method, indicating the possibility of identifying a low-databit-width combination that, based on the proposed EPAbased training method, can achieve highly accurate results.This assertion can be inferred from the results in Rows 4 and 5 of the table.Theoretically, these two combinations of data bit widths may offer higher accuracy; however, one possible reason for the contrary result is inadequate training.When a combination with lower data bit widths achieved 56% accuracy (mAP@0.5), we considered it to represent a better compromise between efficiency and accuracy.
Based on the YOLOv3-tiny model, Table 3 presents the inference accuracy results for the power transmission line anomaly target dataset after QAT in several data formats (i.e., introducing errors into training to achieve a fair comparison with the EPA-based training method proposed in this study).This table summarizes the characteristics of the tested data formats.From the table, it can be observed that the proposed EPA-based quantization method demonstrated superior comprehensive performance.Compared to traditional floating-point formats, such as FP32, it significantly reduces hardware resource overhead and is highly compatible with the CIM high-efficiency hardware architecture.Compared to traditional integer formats, such as INT8, it markedly improves the accuracy with a small increase in the data bit width (only 2-bit).
Table 3 Comparison of accuracy and characteristics in several different data formats under EPA-based and non-EPA QAT method
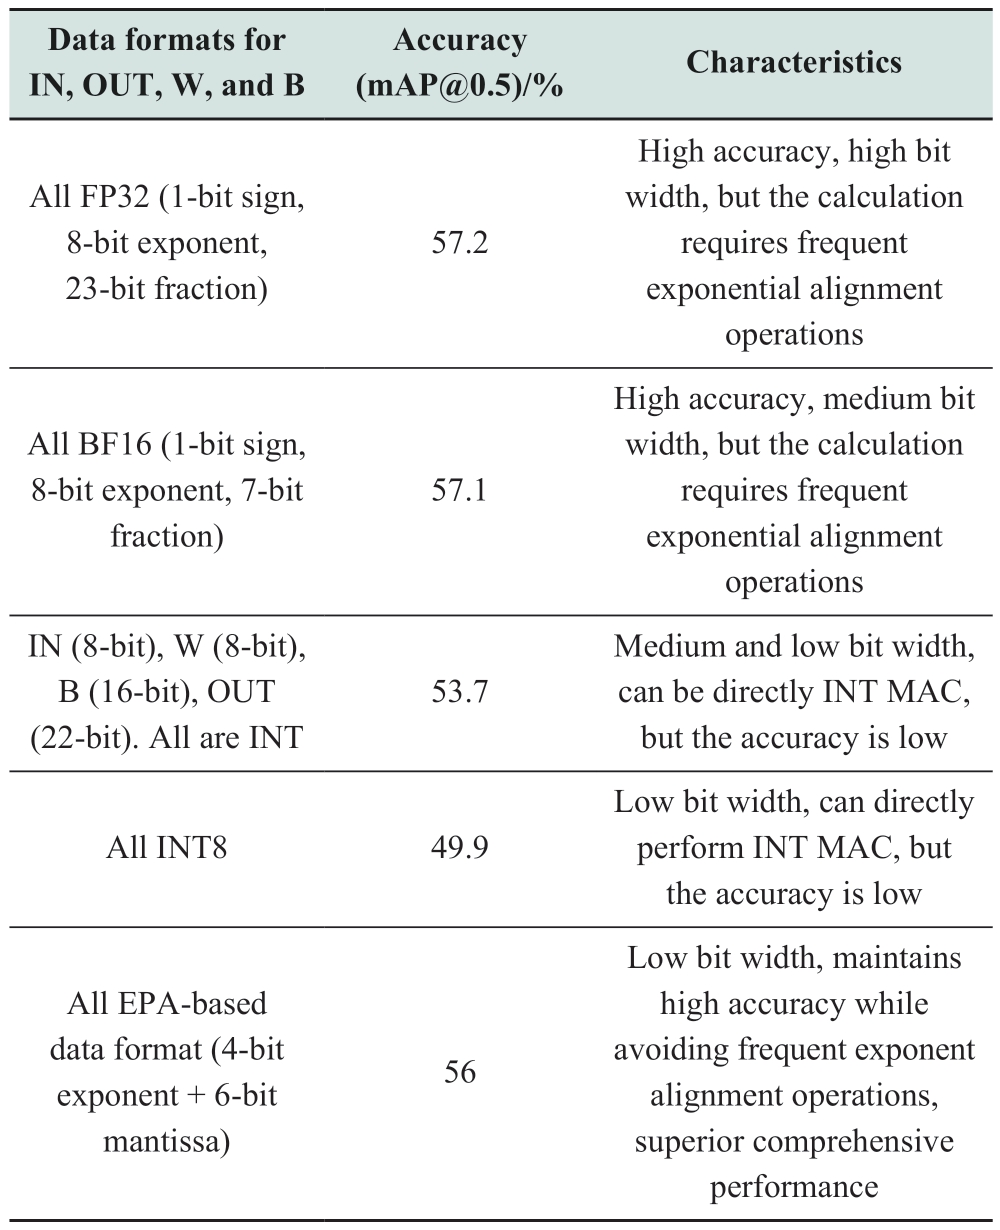
As summarized in Table 3, low-bit-width data methods possess the potential for low hardware resource consumption, implying high efficiency, but with compromised accuracy.Conversely, high-bit-width data methods offer high precision but come with increased computational complexity or greater consumption of hardware resources.The EPA-based QAT quantization method proposed in this study can achieve relatively high precision with a low bit width while avoiding frequent exponential alignment operations, thus demonstrating obvious comprehensive advantages.
With the trained inputs and parameters, and with IN,OUT, W, and B, all having a 4-bit exponential bit width,the weight data achieved a mAP@0.5 of 56%.The results of the abnormal target detection of power transmission lines based on the YOLOv3-tiny network are illustrated in Fig.7, demonstrating the ability of the system to recognize five classes of objects: cranes, pyrotechnics, tower cranes,construction machinery, and conductor foreign objects, in practical applications at the edge of power transmission lines.
Improving the target detection network using the EPA method not only reduces the computational complexity of the network but also significantly reduces hardware resource consumption based on further quantization with the EPA method, thereby reducing the memory requirements for network computation and further enhancing computational efficiency.This can accelerate network inference, which is crucial for deploying models at the hardware-limited edges of power transmission lines.Simplified prealignment operations and smaller bit widths can reduce the size of hardware computing units, increase the parallelism of convolutional calculations using the same computing resources, and enhance data exchange and channel reuse, ultimately leading to higher energy efficiency and lower computational costs.Moreover, these benefits were achieved with minimal impact on target detection accuracy.The method proposed in this study has certain guiding significance for how neural network algorithms in other application scenarios can maintain a good balance between accuracy and efficiency and has great potential for transferability.
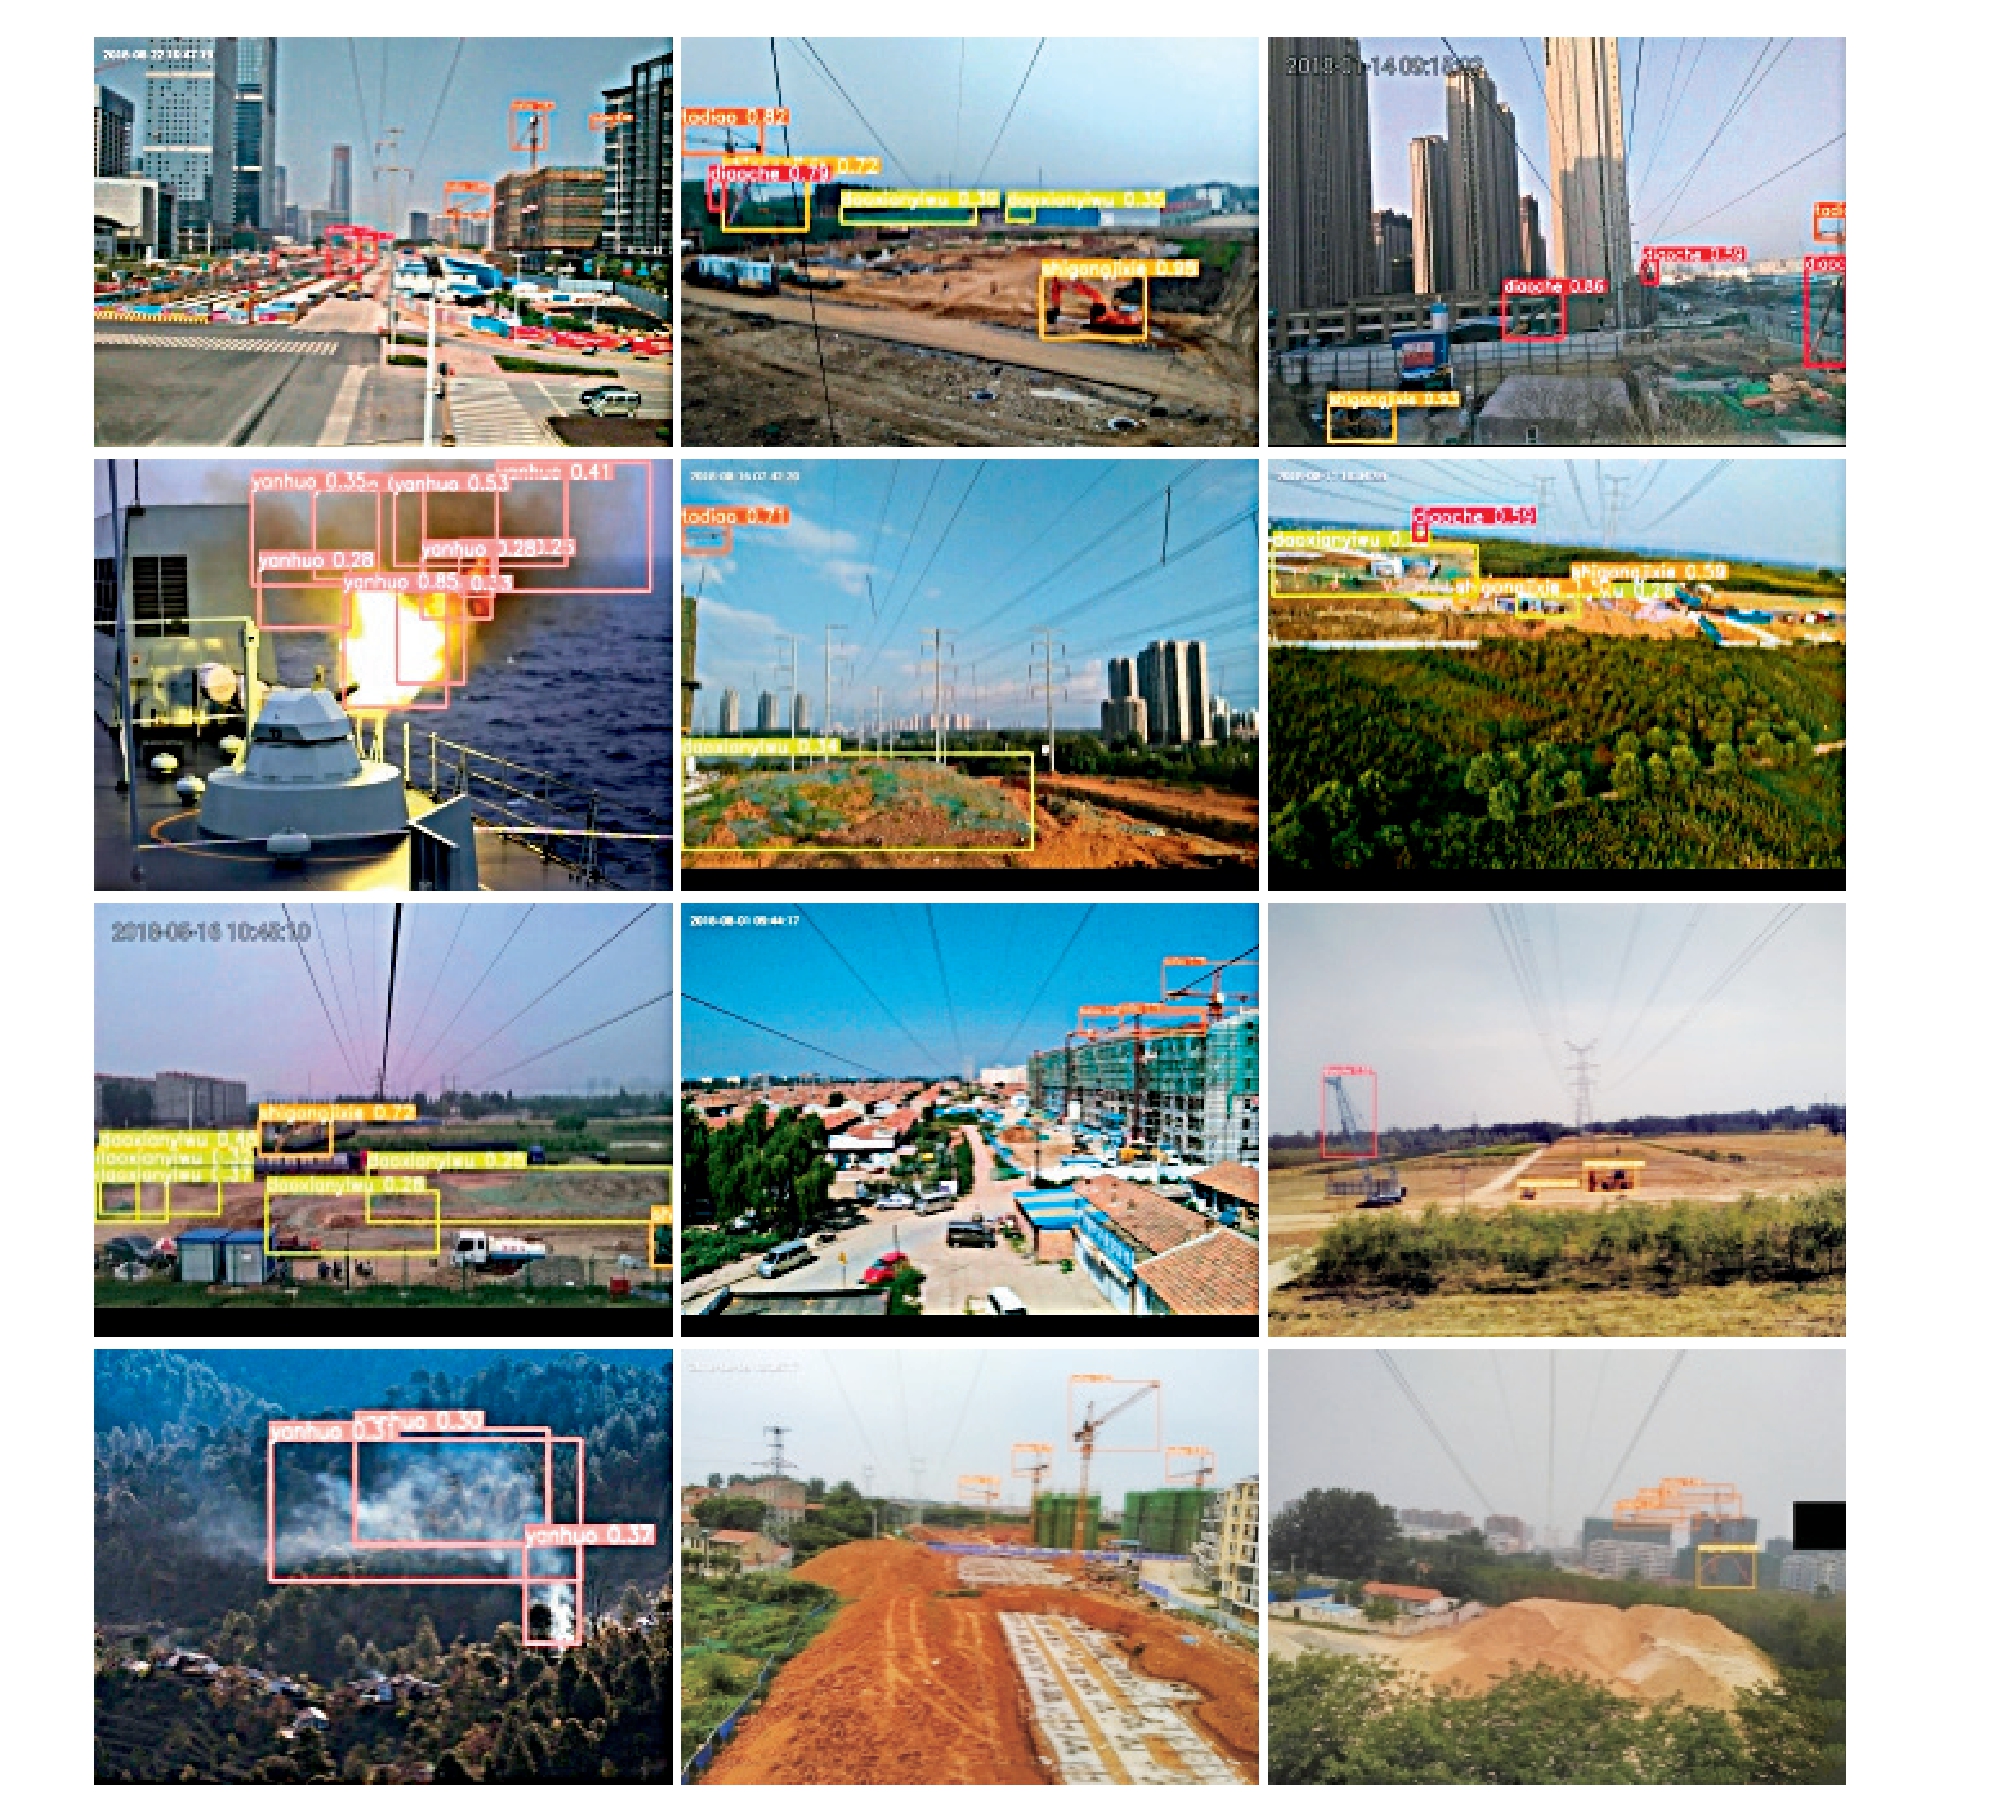
Fig.7 The results of transmission line abnormal target detection
4 Discussion and conclusion
The EPA method aims to match the CIM hardware architecture.Inspired by this, the low-bit-width floatingpoint data quantization method based on EPA proposed in this study inherits characteristics suitable for CIM hardware architecture circuits and can further reduce hardware resource consumption.Therefore, if the proposed method is adopted in combination with reconfigurable CIM hardware architecture chips [20] or directly designed CIM hardware architecture chips that are highly adapted to algorithms, it will better leverage the higher energy efficiency capabilities of the proposed method.
The demand for real-time performance in power-edge transmission circuit target detection applications is high,and existing detection methods struggle to balance accuracy and efficiency.To address this dilemma, this study proposes a floating-point quantization method capable of effectively reducing the data bit width of a network.Specifically,tailored for target detection application scenarios of poweredge transmission lines, an EPA-based low-bit-width quantization improvement was conducted.The experimental results demonstrate that the proposed method achieves a favorable balance between accuracy and efficiency, with a mere 1.2% loss in accuracy exchanged for a 31.25%reduction in bit-width resource consumption.This indicates superior comprehensive performance.The method proposed in this study offers valuable guidance on how neural network algorithms can maintain a good balance between accuracy and efficiency in other application scenarios,thereby exhibiting promising potential for transferability.Furthermore, the quantization approach presented in this paper has significant implications for lightweight hardware deployment of CNNs.
In the future, more comprehensive performance of the EPA-based quantization method will be validated using more object-detection models.In addition, a comparative analysis will be conducted on performance metrics such as hardware-side inference speed, model size, and inference latency.
Acknowledgments
This work was supported by State Grid Corporation Basic Foresight Project (5700-202255308A-2-0-QZ).
Declaration of Competing Interests
The authors have no conflicts of interest to declare.
References
[1]Hu Y, Liu K, Wu T, et al.(2014) Analysis of influential factors on operation safety of transmission line and countermeasures.High Voltage Engineering, 40(11): 3491-3499
[2]Miao X, Lin Z, Jiang H, et al.(2021) Fault detection of power tower anti-bird spurs based on deep convolutional neural network.Power System Technology, 45(1): 126-133
[3]Coal, electricity, oil transport and emergency response Command Center of The State Council.Report on rescue and disaster relief work and post-disaster reconstruction arrangements.http://www.gov.cn/gzdt/2008-02/20/content_894317.htm, 2008.2
[4]Lu J, Zhou T, Wu C, et al.(2016) Fault statistics and analysis of 220 kV and above power transmission line in province-level power grid.High Voltage Engineering, 42(1): 200-207
[5]Liu Z, Miao X, Chen J, et al.(2020) Review of visible image intelligent processing for transmission line inspection.Power System Technology, 44(3): 1057-1069
[6]Zhao L, Wang X, Yao H, et al.(2021) Survey of power line extraction methods based on visible light aerial image.Power System Technology, 45(4): 1536-1546
[7]Cen Bi, Cai Z, Wu Z, et al.(2022) Microservice modeling and computing resource allocation methods for edge computing terminals in power IOT.Automation of Electric Power Systems,46(5): 78-91
[8]Wu R, Liu B, Fu P, et al.(2023) Convolutional neural network accelerator architecture design for ultimate edge computing scenario.Journal of Electronics & Information Technology,45(6): 1933-1943
[9]Mane S, Mangale S (2018) Moving object detection and tracking using convolutional neural networks.Proceedings of the Second International Conference on Intelligent Computing and Control Systems (ICICCS), pp1809-1813
[10]Hao S, Ma R, Zhao X, et al.(2021) Fault detection of YOLOv3 transmission line based on convolutional block attention model.Power System Technology, 45(8): 2979-2987
[11]Qiu Z, Zhu X, Liao C, et al.(2022) Intelligent recognition of bird species related to power grid faults based on object detection.Power System Technology, 46(1): 369-377
[12]Ma P, Fan Y (2020) Small sample smart substation power equipment component detection based on deep transfer learning.Power System Technology, 44(3): 1148-1159
[13]Nguyen D T, Nguyen T N, Kim H, et al.(2019) A highthroughput and power-efficient FPGA implementation of YOLO CNN for object detection.IEEE Transactions on Very Large Scale Integration Systems, 27(8): 1861-1873
[14]Zeng Y, Zhang L, Zhao J, et al.(2021) JRL-YOLO: a novel jump-join repetitious learning structure for real-time dangerous object detection.Computational Intelligence and Neuroscience,2021: 5536152
[15]Nepal U, Eslamiat H (2022) Comparing YOLOv3, YOLOv4 and YOLOv5 for autonomous landing spot detection in faulty UAVs.Sensors, 22(2): 464
[16] Ge P, Guo L, He D, et al.(2022) Light-weighted vehicle detection network based on improved YOLOv3-tiny.International Journal of Distributed Sensor Networks, 18(3): 15501329221080665
[17]Fu L, Feng Y, Wu J, et al.(2020) Fast and accurate detection of kiwifruit in orchard using improved YOLOv3-tiny model.Precision Agriculture, 22(3): 754-776
[18]Gong L, Xu W, Lou M (2021) An overview of SRAM inmemory computing.Microelectronics & Computer, 38(9): 1-7
[19]Wu P, Su J, Chung Y, et al.(2022) A 28nm 1Mb time-domain computing-in-memory 6t-sram macro with a 6.6ns latency,1241gops and 37.01tops/w for 8b-mac operations for edge-ai devices.Proceedings of 2022 IEEE International Solid-State Circuits Conference (ISSCC), San Francisco, CA, USA, 1-3
[20]Tu F, Wang Y, Wu Z, et al.(2022) ReDCIM: Reconfigurable digital computing-in-memory processor with unified FP/INT pipeline for cloud AI acceleration.IEEE Journal of Solid-State Circuits, 58(1): 243-255
[21]Jiao F, Song R, Zhang J, et al.(2023) Development of computein-memory technology and its potential implementation in the power grid.Power System Technology, 48(1): 300-314
[22]ANSI/IEEE Std 754-1985.IEEE Standard for Binary Floating-Point Arithmetic
[23]Hawks B, Duarte J, Fraser N J, et al.(2021) Ps and Qs:Quantization-aware pruning for efficient low latency neural network inference.Frontiers in Artificial Intelligence, 4: 676564
[24]Redmon J, Farhadi A (2018) YOLOv3: An Incremental Improvement.arXiv:1804.02767
Appendix A
1 EPA code for network input and weight data
The Python code for the exponent pre-alignment of the input and weight data is as follows:
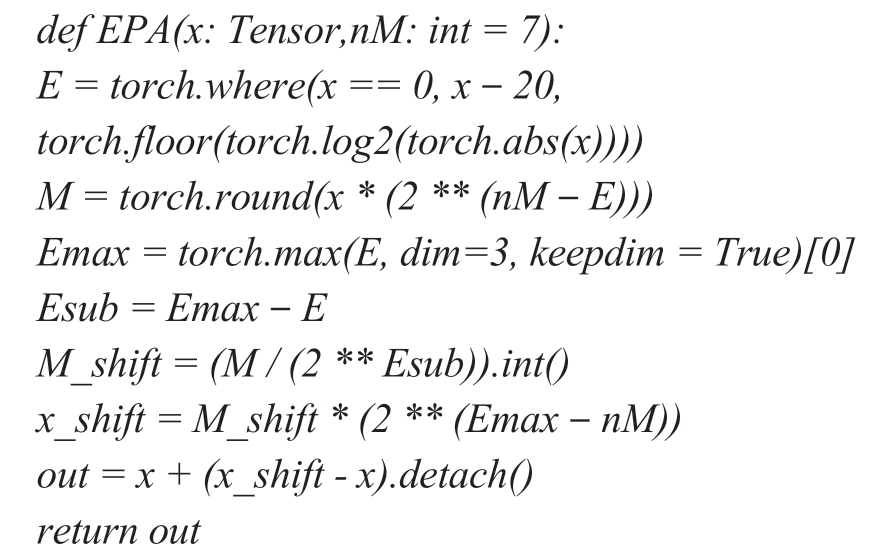
EPA refers to the comparison of exponent bits of the same group of data (based on the hardware architecture and precision requirements, involving a tradeoff between precision and efficiency), selecting the maximum exponent bits, aligning the exponent bits of other data with the maximum exponent, and shifting the corresponding mantissa bits accordingly.
2 EPA code for convolutional computation in networks
Below is the Python code for exponent prealignment in convolutional computation.
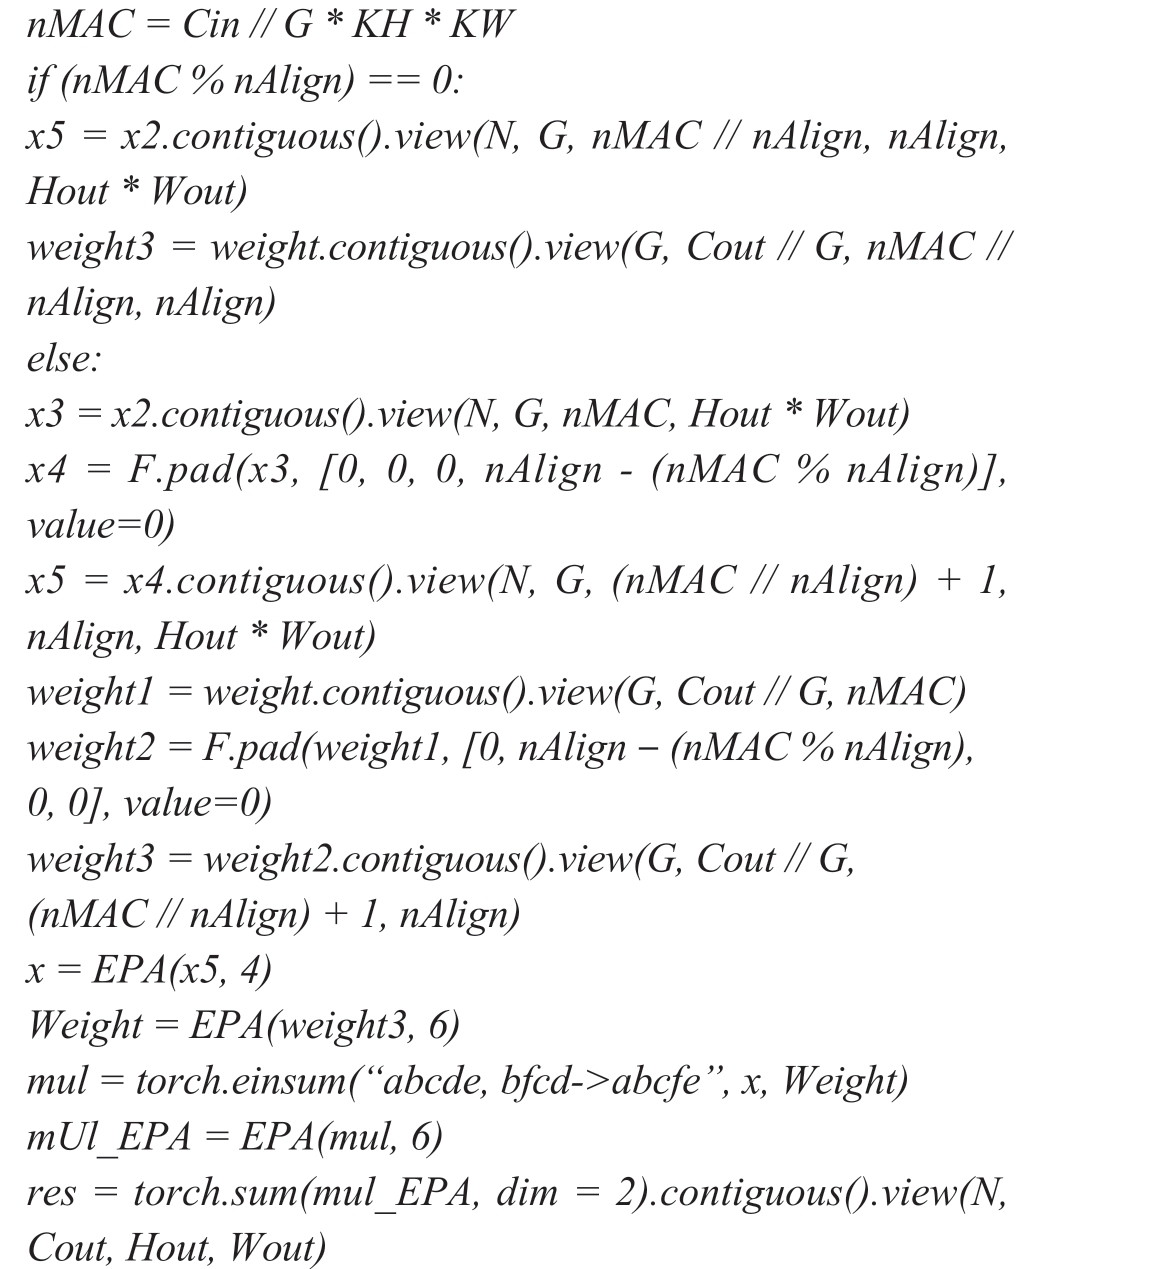
During the convolutional computation, the number of convolution calculations in a group may exceed the set group size, necessitating the grouping of convolution calculations according to the set group size for EPA computations.The code used to divide a group for the MAC calculation is as follows:
nMAC = Cin // G * KH * KW
where Cin represents the number of input channels; G denotes the number of groups; and KH and KW denote the height and width of the convolutional kernel, respectively.
The final computation result was obtained by summing the outcomes of each group after the EPA calculation.An EPA was required during the summation process.Certain parameters in this illustrative code were set accordingly.For instance, in “Weight=EPA(weight3, 6)”, the number 6 indicates a mantissa bit width of 6.In practical training,this value can be adjusted by using the EPA method.By incorporating these errors into the training process, a better balance between accuracy and efficiency can be achieved.
3 Code for modifying the convolution result bit width
Because the output of each convolution computation serves as the input data for the next layer of the network,it is necessary to truncate the mantissa of the final result obtained after each group of convolution computations based on the EPA method.This truncation ensures that the mantissa bit width of the convolution computation result matches that of the input data.The Python code for changing the bit width of the convolution computation results is as follows:
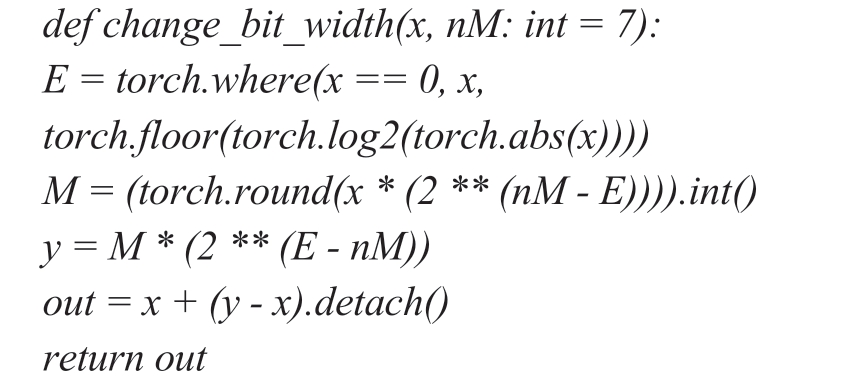
where change_bit_width(x, nM: int = 7) indicates that the initial default mantissa bit width is set to 7.

Scan for more details
Received: 7 January 2024/Revised: 7 May 2024/Accepted: 20 May 2024/Published: 25 June 2024
Jun Zhang
18801191780@139.com
Chen Wang
532911178@qq.com
Guozheng Peng
pengguozheng@sgcc.epri.com.cn
Rui Song
songrui@sgcc.epri.com.cn
Li Yan
617498012@qq.com
2096-5117/© 2024 Global Energy Interconnection Group Co.Ltd.Production and hosting by Elsevier B.V.on behalf of KeAi Communications Co., Ltd.This is an open access article under the CC BY-NC-ND license (http: //creativecommons.org/licenses/by-nc-nd/4.0/ ).
Biographies
Chen Wang received her doctor’s degree in University of Chinese Academy of Sciences in 2020.Since 2020, she has been working in artificial intelligence application department,China Electric Power Research Institute(CEPRI).Her research areas include power equipment inspection, image processing, and edge intelligence.


Guozheng Peng received B.S.and the M.S.degrees in Electrical Engineering and Automation from the North China Electric Power University, Beijing, in 2003 and 2006.He is a Senior Engineer with China Electric Power Research Institute Company Ltd.His research interests include power edge intelligence and smart sensing.Rui Song received the B.Eng.degree in Electrical Engineering and Automation from North China Electric Power University,Beijing, China, in 2014, and the M.Sc.degree in Electronics and the Ph.D.degree in Integrated Micro and Nano Systems from the University of Edinburgh, Edinburgh, U.K., in 2015 and 2019, respectively.He is currently an Engineer with China Electric Power Research Institute Company Ltd.His research interests include analog and mixed-signal electronics,power edge intelligence and smart sensing.

Jun Zhang received the B.S.degree in electrical engineering and automation from North China University of Science and Technology, Tangshan, China, in 2013, and the M.S.degree with Northeast Electric Power University, Jilin, China, in 2016.He is currently pursuing the Ph.D.degree in electrical engineering, Hunan University,Changsha, China.He is also with China Electric Power Research Institute Company Ltd.His current research interests include power edge intelligence and smart sensing.

Li Yan received master degree at Tsinghua University, Beijing, 2006.She is working in Information & Telecommunication Company State Grid Shandong Electric Power Company,Jinan.Her research interests includes big data and AI.
(Editor Yajun Zou)
