0 Introduction
In today’s power systems, with the continuous proliferation of renewable energy and the accelerating trend towards electrification, the power system faces numerous challenges.The volatility and uncertainty of renewable energy pose new challenges to the stable operation of the power system [1], while the introduction of large-scale adjustable loads such as electric vehicles complicates load forecasting and management.Therefore, accurately identifying and extracting the aggregation characteristics of adjustable loads has become an important issue in the construction and operation management of smart grids,which is crucial for achieving the operation and management of smart grids.Adjustable loads refer to loads whose power demand can be changed through external control, including electric vehicles, distributed energy resources, and flexible loads [2].By effectively identifying and extracting the aggregation characteristics of adjustable loads, it is possible to achieve more accurate load forecasting, more flexible scheduling, and more efficient energy utilization in the power grid.
Researchers are actively exploring new aggregation modeling methods for decentralized and limited controllable user-side load resources.To more accurately describe temperature-controlled loads, the thermal-electric equivalent parameter model (ETP) is commonly used [3].Current research primarily adopts clustering methods based on physical model parameters to group massive air conditioning loads, addressing the heterogeneity of load parameters in the air conditioning aggregation process.These studies analyze the operating states of load clusters using methods such as Monte Carlo sampling, state transitions, and state queues[4-6] and derive the probability distribution of aggregate power or state variables of load clusters.Additionally, some studies focus on the virtual energy storage characteristics and human comfort requirements based on air conditioning,investigating the impact of air conditioning temperature setpoints and environmental variables on virtual energy storage characteristics using Monte Carlo methods [7].Furthermore, estimating the operating states of individual loads using methods such as Kalman filtering is also an important aspect of research [8].In the aggregation modeling of electric vehicles, in addition to considering charging behavior, factors such as driving patterns and route planning need to be taken into account [9, 10].Therefore,researchers not only analyze the probability distribution characteristics of initial charging time and the initial state of charge (SOC) of electric vehicles but also describe the driving and charging decision-making behavior of electric vehicle users through methods such as Markov chains to better reflect the comprehensive usage characteristics of electric vehicles [11, 12].Moreover, some studies combine intelligent transportation system data and urban transportation planning to predict the driving demands of electric vehicles, providing more accurate scheduling strategies for cluster charging of electric vehicles [13, 14].
Research on load feature extraction methods has attracted widespread attention among domestic and foreign scholars, primarily focusing on two major categories: time domain and frequency domain.These methods aim to extract representative feature parameters from load data,involving active power, reactive power, voltage, current,and other aspects.
Time domain feature extraction methods mainly analyze the time information of load data to reveal the variation patterns of loads.For example, literature [15] extracted parameters such as load factor, peak-to-valley ratio,maximum utilization hours, and load rate to describe the morphological characteristics of loads.Meanwhile, literature[16] extracted features such as the time of maximum load occurrence to perform cluster analysis on daily load curves.Frequency domain feature extraction methods mainly conduct spectrum analysis on load data to reveal the energy distribution of loads at different frequencies.For instance,literature [17, 18] extracted harmonic signals and lowpower characteristics from load data to analyze power quality issues.Some studies aim to extract parameters that reflect the load regulation characteristics, such as load regulation coefficient, step change rate, and load stability.These parameters can help evaluate the adjustability and stability of loads, providing important references for power system scheduling and operation.Literature [19] proposed parameters like load regulation coefficient to characterize the adjustability of loads.Some studies attempt to combine time information with active power and other information to achieve load separation identification.For example,literature [20] utilized a method combining time information with active power to achieve load separation identification.
Research on load identification methods covers the identification of both static and dynamic load characteristics and gradually receives attention in adjustable load identification.Scholars both domestically and internationally have conducted extensive research aimed at improving the understanding and identification of load characteristics.In[21], a method for online correction of load composition proportions is proposed.By establishing industry-typical feature matrices and combining membership calculation, it achieves the correction of various types of load composition proportions in daily load curves.This method can effectively identify different types of loads and adjust load composition proportions in real time, thereby more accurately reflecting load characteristics.In [22], researchers propose a load identification method based on fuzzy clustering theory for adjustable/interruptible loads.This method effectively distinguishes adjustable loads from other loads, providing an important reference for load scheduling and control.In the field of non-intrusive monitoring, load identification is a highly researched area.In [23], researchers explore the application of negentropy estimation theory and successfully apply it to the non-intrusive decomposition of residential electricity loads.Additionally, other research literature [24] proposes various methods for unsupervised intelligent identification, such as sparse coding algorithms,hierarchical Dirichlet hidden semi-Markov models, and pattern mining.These studies provide important theoretical and methodological support for further development in the field of load identification.
Although there has been in-depth research on load characteristic identification and extraction, the study of identification and extraction of aggregation characteristics of wide-area adjustable loads is still in its early stages.The online identification and extraction of aggregation characteristics of adjustable loads are important issues in the construction and management of smart grids, which can provide technical support for the intelligent operation and management of power systems, and promote the sustainable development and efficient operation of power systems.
This paper aims to propose an effective method for online identification and extraction of aggregation characteristics of regional large-scale adjustable loads to address the challenges faced by power systems and promote the construction and development of smart grids.Firstly, this paper presents the aggregation model of largescale adjustable load resources and proposes a dynamic aggregation method for large-scale adjustable loads that support high proportions of new energy integration.The innovations lie in:
1) Using online identification techniques and feature extraction algorithms, central air conditioning loads are taken as the research objects.Considering the impact of user load characteristics and adjustable potential on user electricity consumption behavior, experimental analysis is conducted based on load aggregation principles, leading to practical conclusions.
2) Introducing a two-layer clustering model based on the reverse adjustment principle, which improves the poor clustering results of traditional K-means clustering algorithms and self-organizing competitive neural networks,thereby enhancing clustering accuracy.
3) Proposing a comprehensive classification method for different scenarios and different coverage rates of user basic information, which exhibits strong generalization ability.
1 Research on load aggregation characteristics based on online identification techniques and extraction methods
1.1 Extraction of characteristic parameters of wide-area adjustable loads
According to the regulation characteristics, wide-area adjustable load can be subdivided into three categories:discrete adjustable load, continuous adjustable load, and time-shift adjustable load.The main difference between it and the traditional load is that it adjusts its power usage pattern by responding to the scheduling commands of the power grid.Discrete regulated loads and continuous regulated loads increase power consumption within a specified period through their respective regulatory means; time-shifted regulated loads change their power consumption within a specific period.Wide-area controllable loads can show significantly different load response curves after regulation than those predicted before regulation because of their autonomy in participating in regulation.In contrast, since conventional loads lack such autonomy, the difference between their actual load profiles and the predicted profiles is very small in the context of the current load prediction accuracy, which is already very high.Accordingly, by analyzing the differences in specific indicators between the integrated load curve after regulation and the integrated load forecast curve before regulation, the proportion of different types of wide-area regulated loads in the integrated load can be identified.Key indicators such as load response speed, load regulation capability index,load recovery efficiency, and load stability coefficient were selected for this study.Load response speed refers to the time required for a load to reach the established regulation target after receiving a regulation signal, which helps to distinguish the response sensitivity of different loads.The load regulation capability index, as a comprehensive index,aims to quantify the maximum capability of load regulation,including the range of power that can be regulated at a given time and its duration, which is crucial for identifying different types of regulated loads.The Load Recovery Efficiency evaluates the time and energy efficiency required for a load to return to normal operation after regulation,reflecting the effectiveness of load recovery.The load stability coefficient, on the other hand, evaluates the stability of the load regulation process by analyzing the fluctuation of the load power after regulation, which is of great significance in evaluating the impact of the regulation behavior on the stability of the grid.The following is the definition and quantitative analysis of the characteristic parameters.
1) Load response speed
Load response speed is an important index to measure the agility of load regulation response.The load response speed is selected as the characteristic parameter U1, which is defined as the length of time required for the load to reach the predetermined regulation target from receiving the regulation signal.The mathematical expression is:
where Ttarget denotes the time point to reach the predetermined regulation target and Tsignal denotes the time point to receive the regulation signal.The U1 is usually the reciprocal of seconds, reflecting the response speed of load regulation.
2) Load regulation capability index
The load regulation capability index is a comprehensive index reflecting the maximum regulation potential of the load in a given time.As a characteristic parameter U2, it is defined as the ratio of the maximum power change of load regulation in a given time to the base load power multiplied by the regulation duration.The mathematical expression is:
where ΔPmax is the maximum regulation power change, Pbase is the base load power and Tduration is the regulation duration.This index integrates the capacity of load regulation and the sustainability of regulation.
3) Load recovery efficiency
Load recovery efficiency is a measure of the efficiency of the load returning to the normal operating state after regulation.It is designated as the characteristic parameter U3, defined as the ratio of the time required for the load to return to the normal operating state from the completion of the regulation action to the energy consumed in the regulation process.The mathematical expression is:
where Tnormal is the time required to return to the normal state, Tadjust is the time required to complete the regulation,and Econsumed is the energy consumed in the regulation process.U3 reflects the efficiency of recovery after load regulation.
4) Load stability coefficient
The load stability coefficient is an index describing the power fluctuation after load regulation.Defined as the characteristic parameter U4, it is expressed as the ratio of the standard deviation of load power after regulation to the standard deviation of load power before regulation.The athematical formula is as follows:
where σafter is the standard deviation of the post-regulation load power and σbefore is the standard deviation of the preregulation load power.The coefficient quantifies the effect of load regulation behavior on power stability.
1.2 Online recognition techniques
Feature extraction algorithms are algorithms that, when a set of measurements is converted in some form, enable the representation of all representative features in that form [25].It works by using a computer to extract feature information from an image, which is then analyzed and transformed using image techniques to extract the required elemental features from the image [2].The application of the data generation framework in the feature extraction algorithm is shown in Fig.1.This paper proposes a twostage load feature extraction method.The first stage is feature aggregation and decomposition of load based on a neural network to form a feature matrix.The second stage is based on the bias-SVD matrix decomposition algorithm to decompose the feature matrix in the case of insufficient data to obtain the feature parameters of each load.
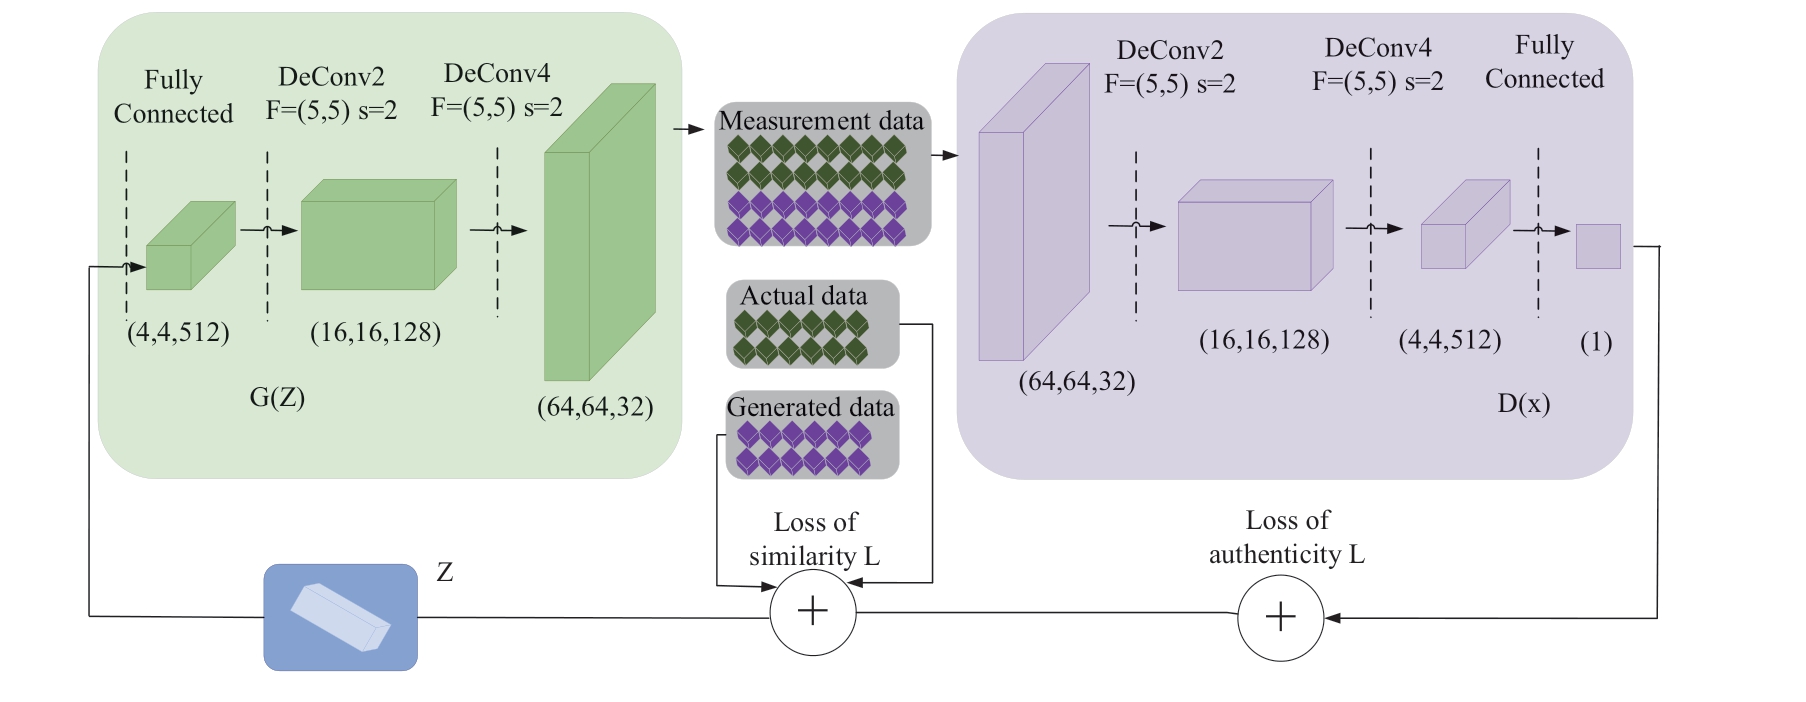
Fig.1 Application of data generation framework in feature extraction algorithm
Firstly, the middle layer of the Convolutional Neural Network (CNN) is analyzed and studied in this paper to fully analyse the adjustable load aggregation at the regional scale.Deep learning techniques are used to train the CNN model for load aggregation under a grid system and then the model is used to classify the features of load aggregation.The CNN structural model is shown in Fig.2.
The deep neural network is operated by the following formulae:
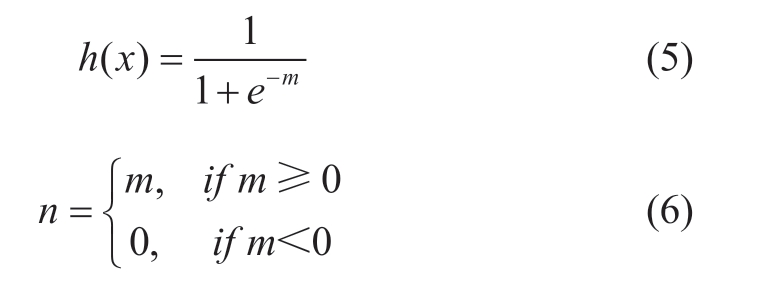
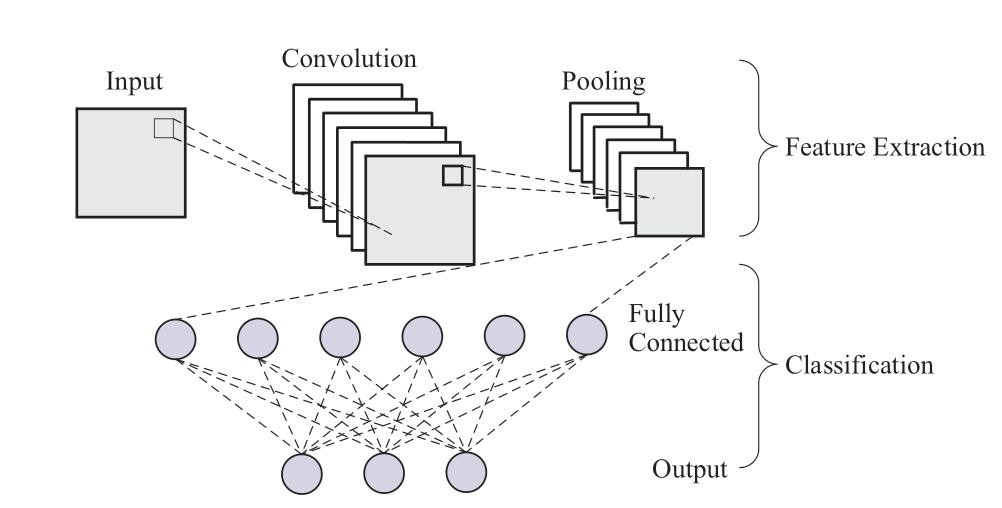
Fig.2 Structural model of convolutional neural network
For the first feature form of the first layer in the CNN network, the segmentation method can generate 5 feature data.The feature vectors generated from the whole feature data and the 5 feature data generated by the segmentation are calculated separately with the formula:
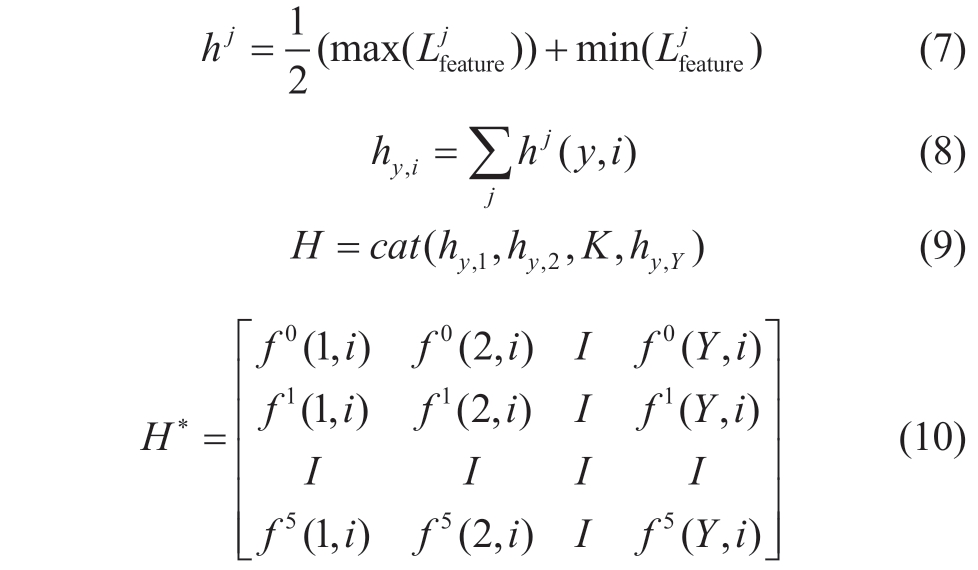
where hy,i is the eigenvalue obtained from the eigenvector values calculated in (7).H is the eigenvector and H*is the feature matrix.
Secondly, sample data of various parameters before and after the loads participate in demand response regulation are obtained by the feature extraction method described above,and for m parameters of n loads, they are noted as n× m order matrices Cn ×m.By matrix decomposition algorithm,the matrix Cn×m is decomposed into load matrix Un×q and label matrix Bq ×m , then it can be expressed by the following equation:
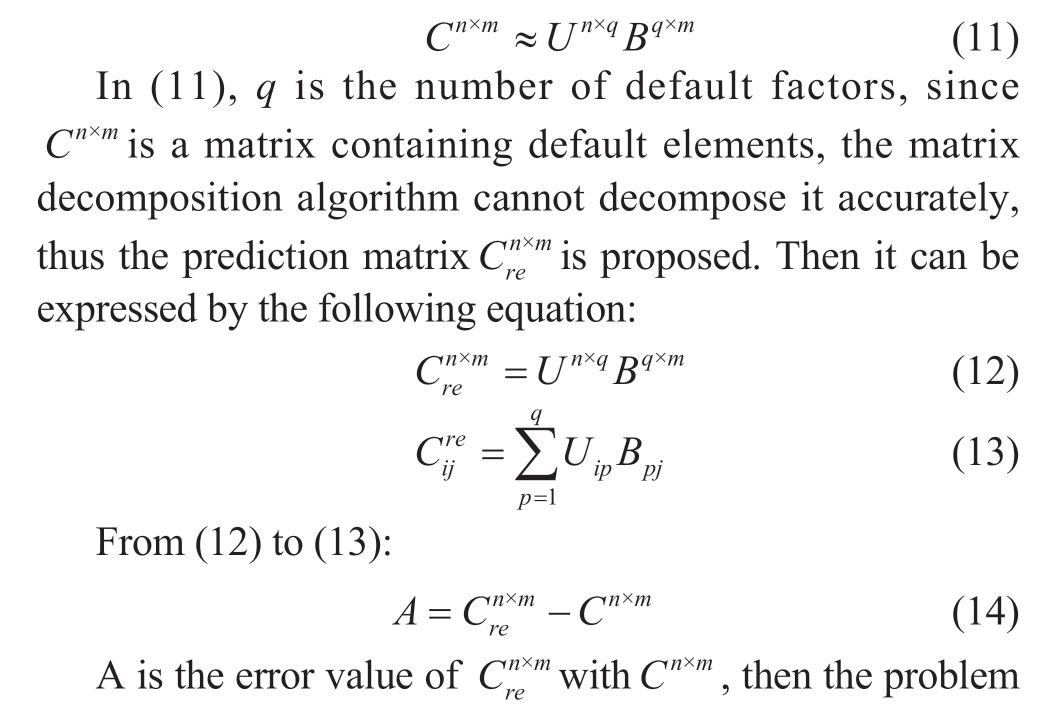
However, there may be certain deviations in the process of extracting the characteristic parameters of the load,such as method differences, standardization differences,etc., and these deviations will lead to unclear identification of the load characteristics, in order to solve the problem,this paper is based on the deviation singular value matrix decomposition algorithm to correct Eq.(15), as shown in the following equation:

The stochastic gradient descent (SGD) method is then used to solve the load matrix Un×q , the label matrix Bq×m and the characteristic intrinsic deviation b [26].
In this paper, the accuracy of Bias-SVD matrix decomposition algorithm is evaluated using mean absolute error (MAE) and root mean square error RMSE as shown in the following equation:

1.3 Feature extraction algorithms
In order to reduce computer memory requirements and improve real-time performance, online recognition algorithms are generally in the form of temporal inference algorithms [27].Online recognition models provide knowledge about the operation of the control system on the one hand, and input data and self-correct in real time on the other hand [28].In this paper, we propose a load recognition method based on the BP neural network.The method takes the characteristic parameter matrix of loads and the composition ratio matrix of different classes of loads as sample data and uses BP neural networks for training, which can achieve online load recognition.
In the training stage, the loads are divided by the criteria of four typical load categories, namely, discrete loads, continuously adjustable loads, time-shiftable loads,and fixed loads, and the load samples are formed after data collection.Next, the characteristic parameters of the four types of typical loads are obtained based on the fuzzy C-mean clustering algorithm, based on which the mixed load analysis is carried out to obtain the characteristic parameter vectors Z = (z1, z2,..., z4).For the four types of typical load cluster center Z, the integrated load characteristic parameters, to obtain the affiliation matrix B,and the known load composition ratio matrix A input into the BP neural network model for iteration, to obtain the two mapping relationship.
In the identification process, the active power data samples before and after regulation of the integrated load response are collected to obtain the characteristic parameter vectors and their affiliation vectors with the four typical load clusters, which are inputted into the BP neural network model to obtain the proportion of each type of load in the integrated load.Combining the fuzzy C-mean clustering algorithm with the BP neural network achieves the identification of a large range of adjustable loads.
In general, the identification can be regarded as a mapping from data Xt to parameters ω, which is formulated as follows:
However, (20) cannot be used for online recognition algorithms.Because the size of the data Xt is not fixed, the computation time t is unpredictable.
For online identification, the following algorithmic formula needs to be satisfied:
where M(t) denotes the current online identification state,n(t) denotes the sampling value, and u(t) denotes the fixed time of each cycle.
During the operation of the grid system, other influencing factors also change with the load, which determines whether the identification of the grid system is timely and the results are accurate.In order to achieve online identification of the normal operation of the grid system, the calculation formula is as follows:
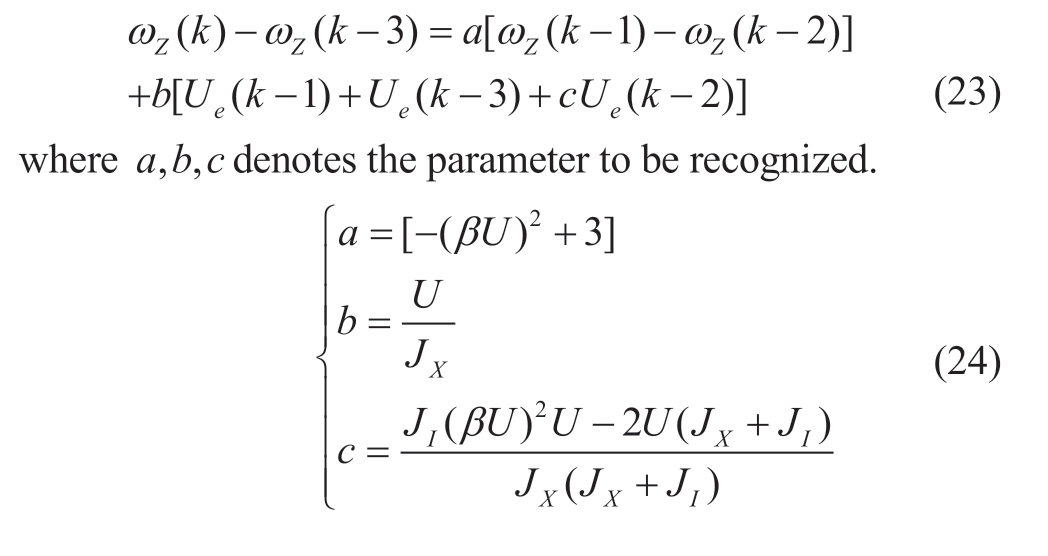
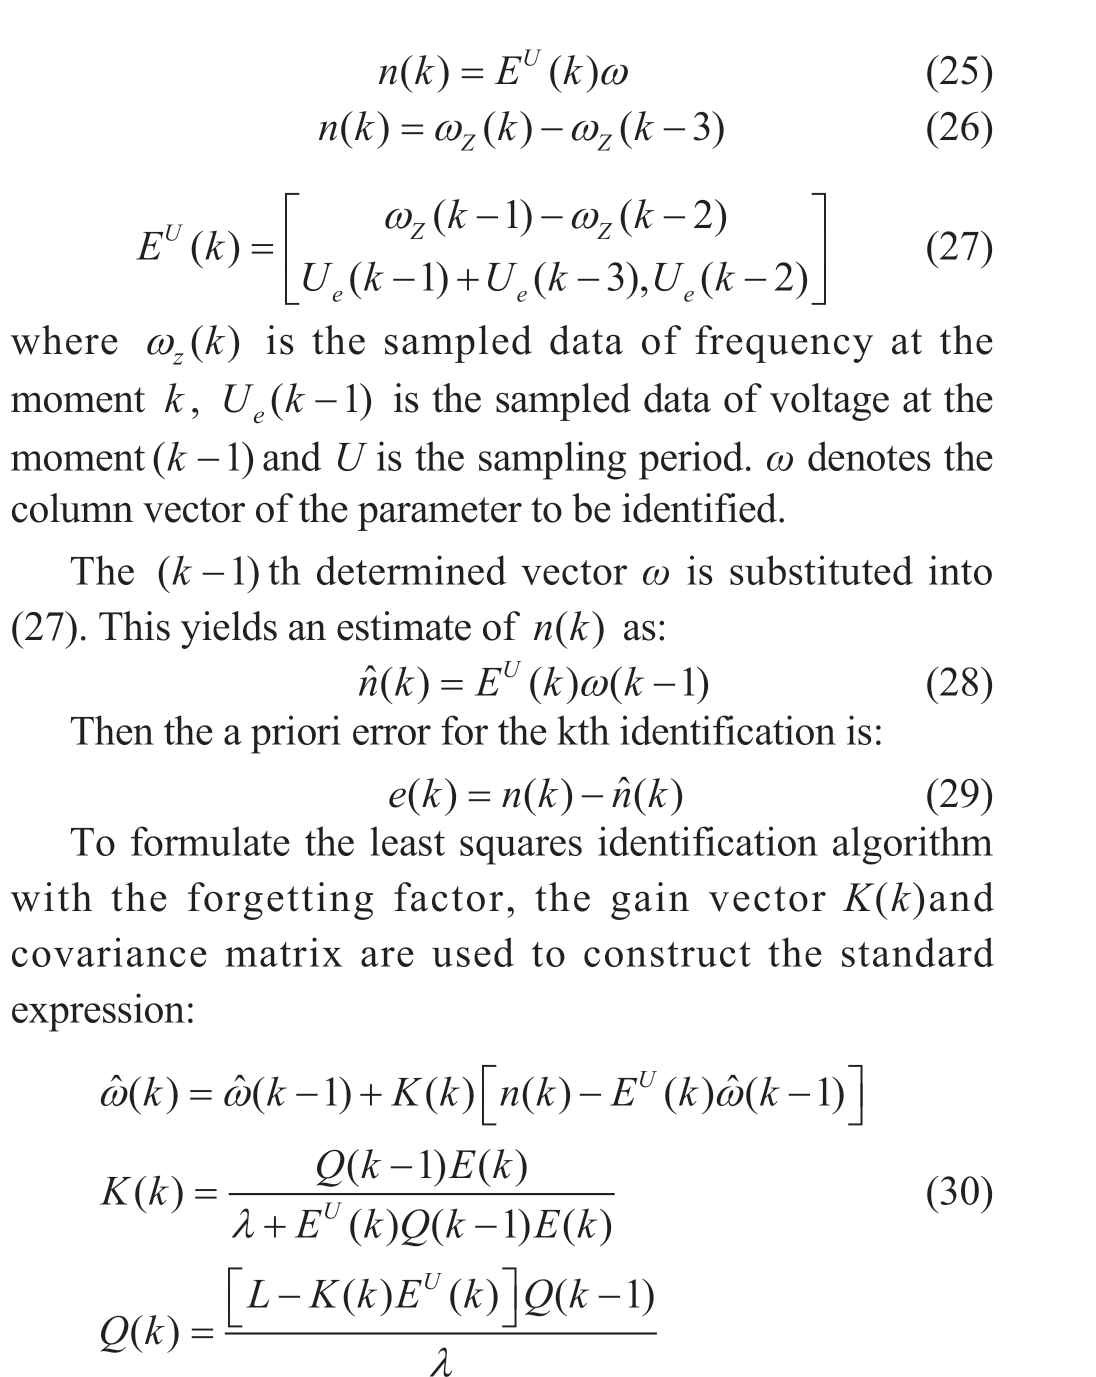
where λ is the forgetting factor.When λ is small, the recognition algorithm is sensitive to changes in the parameters, but the algorithm’s ability to recognize the results is weakened and the value of the stabilization error increases accordingly.The opposite is true when the value λ is large [29].In summary, in order to improve the recognition ability of load aggregation, it is necessary to change the range of values of the forgetting factor in the recognition error value.
Denoted λ( k+1) as the forgetting factor for the ( k-1) th identification:
where all elements g, i, d, x are constants.g and i control the range of the value of λ( k+1).d and x control the convergence of the hyperbolic orthogonal function and the change of the shape of the top of the curve after the transformation.When the value of d increases and the value of m decreases, the convergence efficiency of the identification results is also accelerated, the tracking ability of the parameters is also stronger, and the real-time identification value of the load aggregation of the grid system can be obtained by continuously looping the online identification algorithm.
2 Experiments on regional large-scale tunable load aggregation properties
This article conducts an essential analysis of the regulation performance, economy, and comfort of central air conditioning, using the load aggregation characteristics of central air conditioning as the experimental object.
A.analysis of air conditioning load aggregation characteristics
1) Aggregation characteristics of central air conditioning load cluster
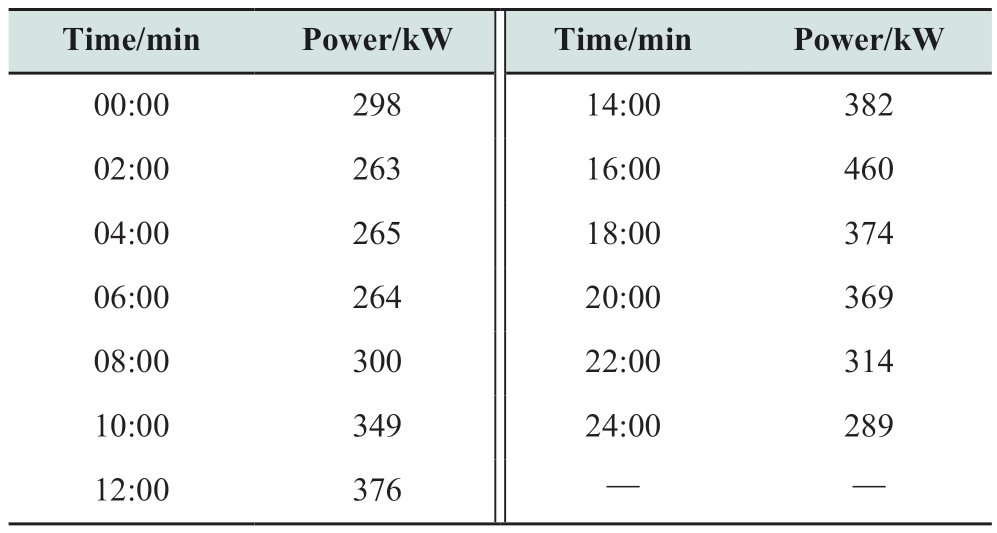
Based on the outdoor temperature curve and the aggregation model of air conditioning units, we simulated a certain office building and obtained the 24-hour air conditioning load power curve when the central air conditioning cluster is set to 22 °C, as shown in Table 1 with specific data.While maintaining a constant indoor environmental temperature in the office building, the output of air conditioning load power shows a clear correlation with changes in outdoor environmental temperature, reflecting the sensitive response of user comfort to environmental changes.
Table 1 24-hour air conditioning load power of a certain office building with central air conditioning cluster set to 22 °C
2) Aggregation characteristics of residential area air conditioning load
Based on the air conditioning ownership of residential users in a certain area, a typical daily temperature variation curve for summer was selected.The changing patterns of air conditioning load power for each household were obtained, and by aggregating these air conditioning loads,the aggregated power characteristics of 2500 households’air conditioning were obtained, as shown in Table 2.
Based on the 24-hour air conditioning load power of a certain residential air conditioning cluster set to 22 °C,significant trends in power variation can be observed from the data:
1) During the early morning hours (00:00-04:00) and late night hours (22:00-24:00), the air conditioning loadpower is relatively low, indicating that most residential air conditioners may be in sleep or low-load mode during these periods.
Table 2 The 24-hour air conditioning load power of a certain residential air conditioning cluster set to 22 °C
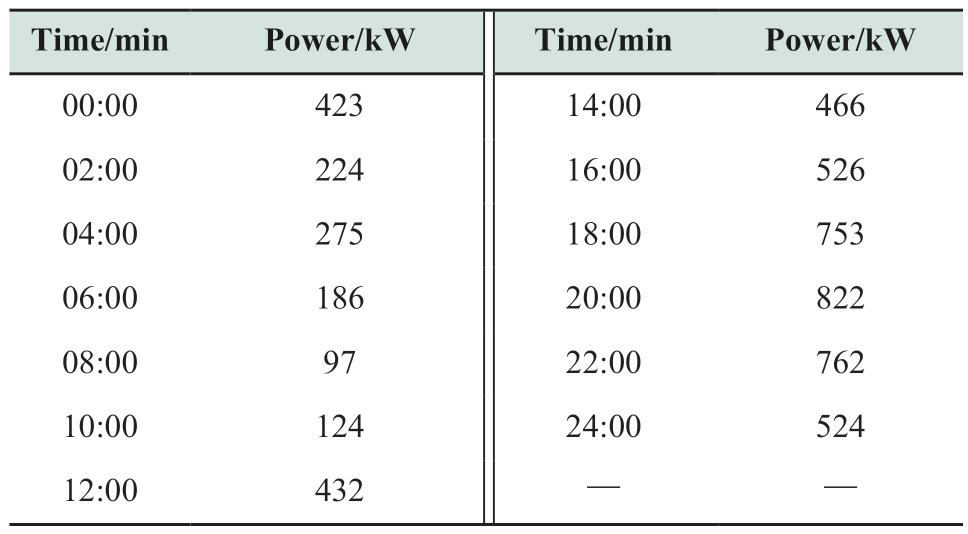
2) The air conditioning load power significantly increases in the morning (06:00-08:00) and afternoon(16:00-20:00), possibly due to residents requiring more cooling or heating services.
3) The peak power during midday (12:00-14:00)indicates that the residential air conditioning cluster requires higher power to meet comfort demands at noon.
These data reveal the load characteristics of residential air conditioning systems at different times, which is crucial for arranging energy supply rationally, optimizing energy utilization, and improving energy efficiency.
Based on the aggregation statistics results and comparison with the power curve of individual air conditioners, the following conclusions are drawn:
Increased duration of high-power periods: The aggregated air conditioning load exhibits longer durations of high-power periods compared to the power curve of individual air conditioners.This could be attributed to the overall higher demand when multiple air conditioners operate simultaneously, leading to prolonged high-power periods.
Reduction in peak-to-valley difference percentage: The peak-to-valley difference percentage of the aggregated air conditioning load power curve is smaller compared to the power curve of individual air conditioners.This indicates reduced load fluctuations and a smoother overall load with multiple air conditioners running simultaneously, resulting in decreased peak-to-valley differences.
Experimental results were conducted on 300 air conditioners with a capacity of 520 kW each, with varying coefficients of indoor heat load impact distributed between[0, 1].Therefore, these 300 air conditioners operate in different environments and have varying initial operating states.The power system issues instructions to users to provide 1.3 MW of power within 5 minutes.Based on the calculation results in Table 3, the adjustment potential and adjustable time for each air conditioner can be obtained.
Table 3 The 24-hour air conditioning load power of a certain residential air conditioning cluster set to 22 °C
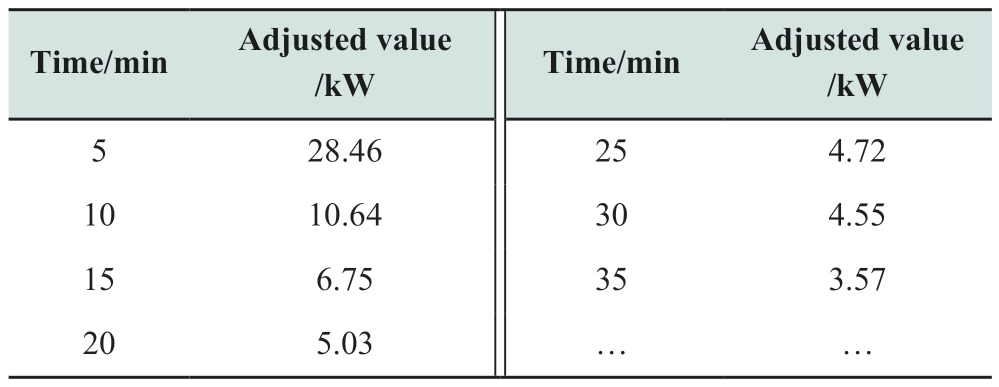
Considering the large number of air conditioners,we have divided the 300 air conditioners into 5 groups,with each group containing 60 air conditioners.The air conditioners within each group have similar operating states,and the adjustment characteristic curves for each group are shown in Fig.3.
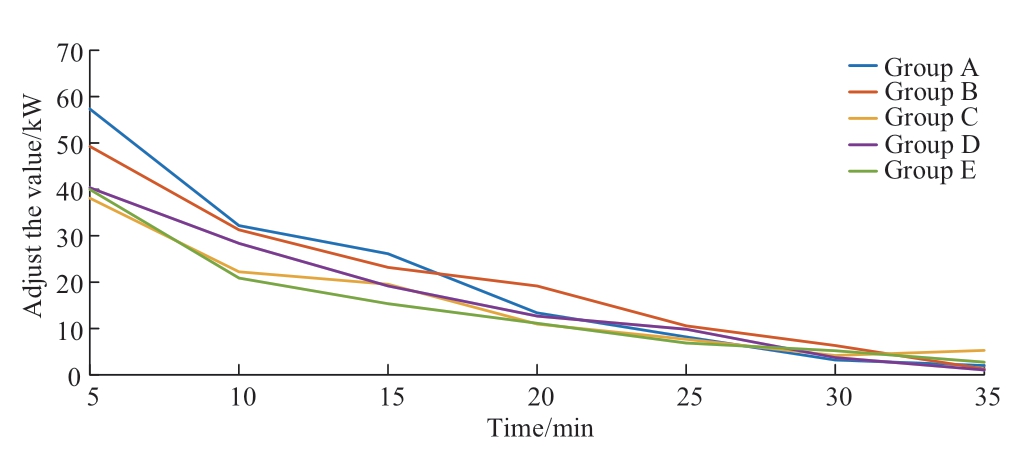
Fig.3 Air conditioning adjustment characteristic curve
B.Analysis of controllable potential of residential air conditioning cluster
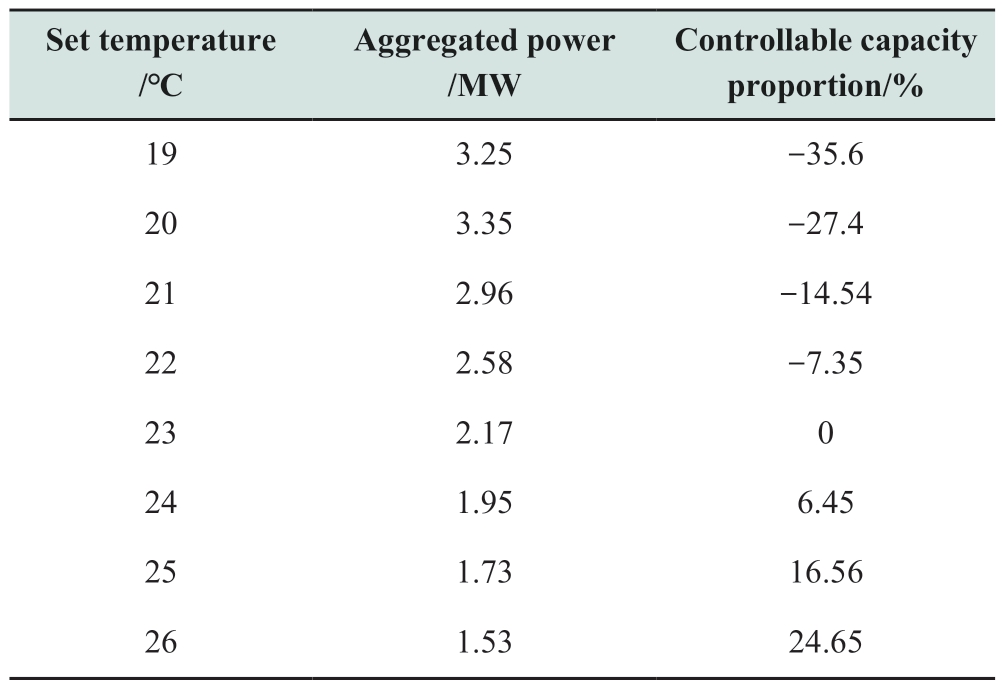
Based on the results shown in Table 4, when the outdoor temperature is 30 °C, conclusions regarding the aggregation power and controllable potential proportion of 2500 households’ air conditioners at different set temperatures are drawn as follows:
1) Controllable potential is proportional to the change in set temperature: As the set temperature increases, the proportion of controllable potential also increases.This indicates that as residents raise the set temperature of their air conditioners, the adjustment space for the aggregation load of air conditioners also increases.
2) Large and fluctuating adjustment capacity: Under conditions that do not significantly affect the user experience of residential users, the aggregation load of residential air conditioners has a considerable adjustment space.Especially during peak evening hours, the controllable potential reaches 45.5% of the maximum load, while during the early morning hours, it can approach 60% of the maximum load.This demonstrates significant fluctuations in the adjustment capacity of residential air conditioning loads during different periods.
These results indicate that under typical daily outdoor temperatures, the adjustment potential of the aggregation load of residential air conditioners varies with changes in the set temperature and exhibits different adjustment capabilities during different periods.This is significant for grid load management and energy scheduling.
Table 4 The 24-hour air conditioning load power of a certain office building with the central air conditioning cluster set to 22 ℃
C.Analysis of power reduction under different control durations for air conditioning cluster
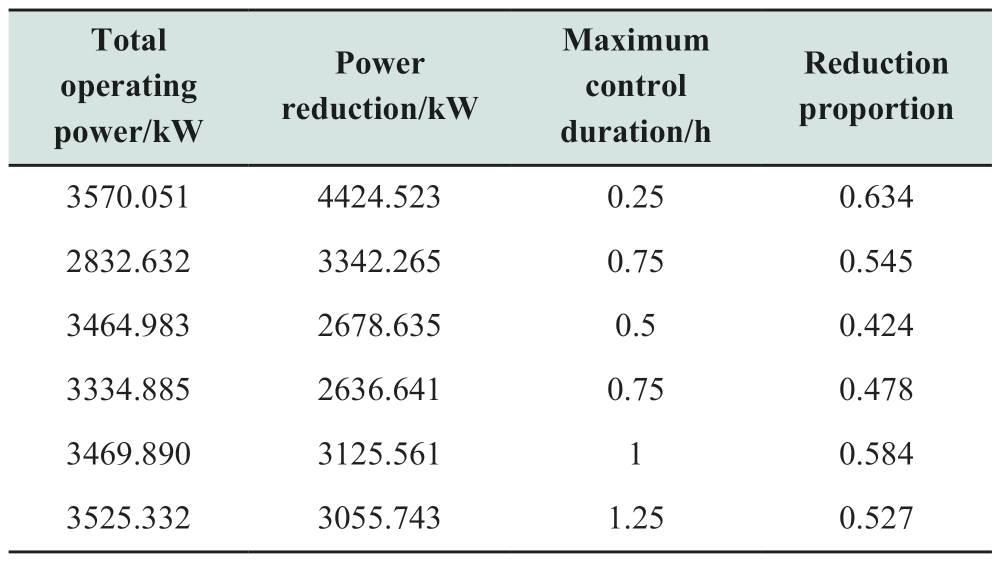
Based on simulation results, calculations were performed using 18000 variable-frequency air conditioners with parameters following a normal distribution.The total rated power of the air conditioning cluster is approximately 6,323 kW.Considering reasonable requirements for human comfort, the upper limit of the set temperature is 26 °C, with each air conditioner having a power of approximately 4024 kW, and the control duration for each group is approximately 15 minutes.According to the simulation results listed in Table 5, the power reduction situation of the air conditioning cluster under different control durations is presented.
Power reduction decreases with increasing control duration: As the maximum control duration increases, the power reduction gradually decreases.This indicates that the adjustment capacity of the air conditioning cluster decreases as the control duration extends, but the reduction proportion is not linear.
Fluctuations exist in the reduction proportion: There are certain fluctuations in the reduction proportion under different durations.This may result from dynamic adjustments of the air conditioning cluster in different operational states, requiring further analysis.
Table 5 Power reduction results under different control durations for air conditioning cluster
D.Results of electric power system characteristics extraction
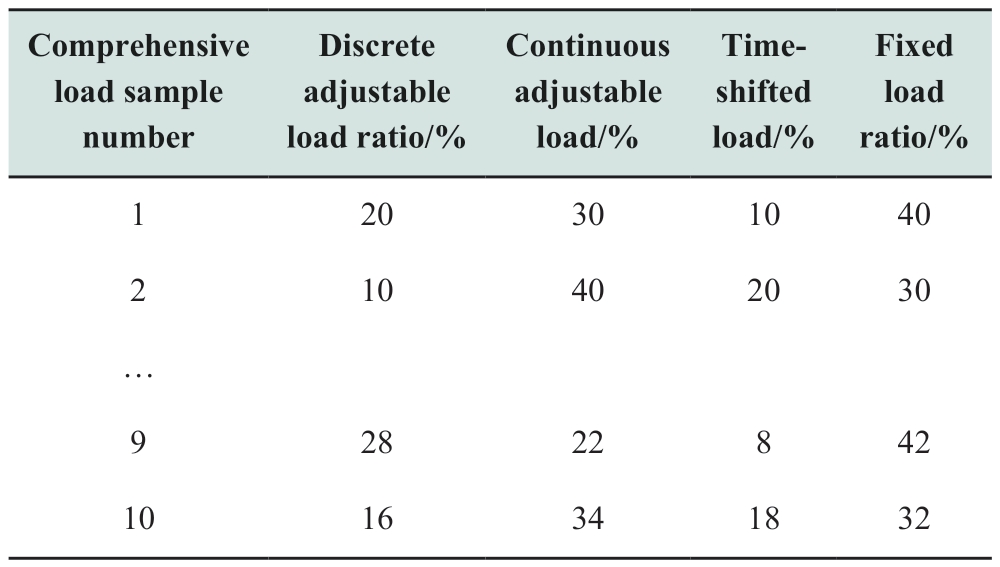
As an example of identifying the composition ratio of comprehensive load, we demonstrate the simulation verification process of load identification methods based on FCM (Fuzzy C-Means) and BP neural network.It is known that the comprehensive load consists of discrete adjustable load, continuous adjustable load, time-shifted load, and fixed load.Therefore, we superimposed typical adjustment curve data of these four types of loads according to certain ratios, resulting in 10 known samples of comprehensive load composition ratios.These known samples of comprehensive load composition ratios are shown in Table 6.
Table 6 Known samples of comprehensive load composition ratios
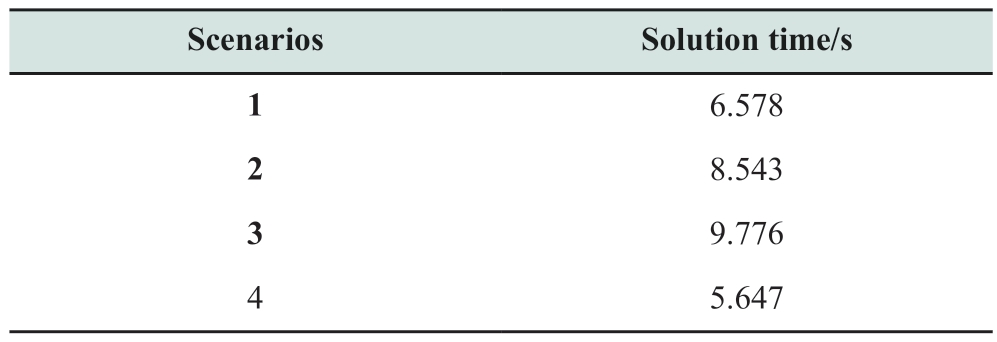
Based on the data in Table 7, we can observe the solution time under different scenarios.In these scenarios,we consider different types of load scheduling and conduct model-solving.Specifically, Scenario 1 may involve fewer types of load scheduling, while Scenario 4 may involve more types of load scheduling.Overall, although there are differences in the solution time for different scenarios,the solution time for all scenarios is within 10 seconds.This indicates that the algorithm proposed in this paper is efficient and fast in handling comprehensive load samples with different composition ratios.The algorithm can effectively deal with different types of load scheduling scenarios and complete the solution in a short time, which is of significant importance for practical applications.
Table 7 Solution time in different scenarios
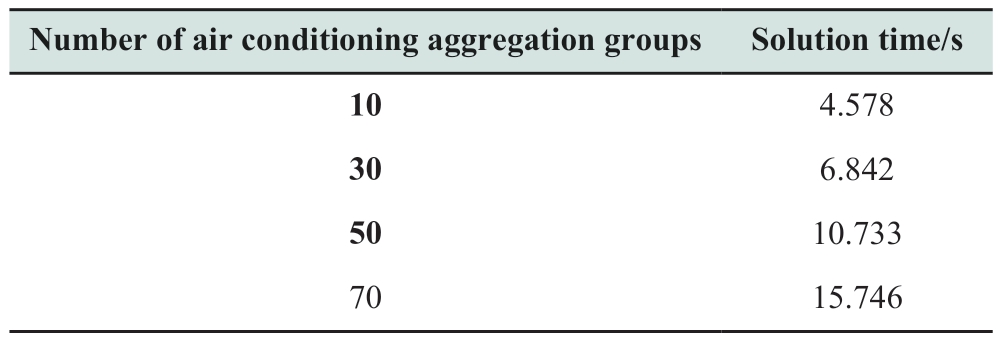
The solution time for different numbers of aggregation groups is shown in Table 8.With the same feature parameter extraction, the solution time of the model proposed in this paper increases as the number of air conditioning aggregation groups increases.This is because the model needs to process more data and variables, leading to an increase in solution complexity and corresponding solution time.As the number of air conditioning aggregation groups increases, the amount of data that the system needs to process also increases.Each air conditioning aggregation group may have different feature parameters, such as temperature, humidity, power, etc.When the number of air conditioning aggregation groups increases, the number of feature parameters that the system needs to process also increases.This leads to the model needing to handle more variables and constraints, thus increasing the complexity of the solution.
Table 8 Solution time for different numbers of aggregation groups
3 Discussion
During the study of large-scale controllable load aggregation characteristics, we have identified some shortcomings in the current approach, which require further improvement.The proposed improvements are as follows:
1) More accurate time-variable air conditioning power formulas need to be established when studying air conditioning loads.The current air conditioning energy consumption models are limited by the control cycle length and require high demands on time scales such as air conditioning frequency regulation.Therefore, it is necessary to establish more accurate models.
2) The operation of the energy system requires broad participation.However, in the current research on air conditioning load aggregation, there is still a lack of relevant theoretical research on the adoption of online identification methods and feature extraction methods.
3) Aggregated air conditioning load adjustment has shown good results with low costs and can participate on a large scale in peak shaving, load distribution,and other aspects.However, the sample size in this study is insufficient, and the experimental data are not comprehensive enough.To improve the accuracy of the experimental results, it is necessary to increase the sample size.Additionally, we can also refer to the research results of grid energy storage devices to further improve the study of air conditioning load aggregation characteristics.
In summary, when using air conditioning equipment,factors such as frequency and voltage should also be considered to ensure the stable operation of the energy system.
4 Conclusions
This study conducted experimental analysis on the aggregation of air conditioning loads in temperaturecontrolled loads using online identification techniques and feature extraction methods.Through comprehensive discussions on the aggregation characteristics of air conditioning loads, the controllable potential of residential air conditioning clusters, and the power reduction of air conditioning clusters under different control durations,the following conclusions were drawn: The power of air conditioning loads is closely related to outdoor temperature changes, reflecting users’ sensitivity to environmental changes; The aggregated power characteristics of air conditioning loads differ from those of individual air conditioners, and residential air conditioners exhibit different adjustment capabilities at different set temperatures; As the maximum control duration increases, the power reduction gradually decreases, but there is fluctuation in the reduction proportion, indicating that the adjustment capability of air conditioning clusters has certain variability.These research findings provide important references for air conditioning load management and energy scheduling, contributing to optimizing energy utilization, improving energy efficiency,and ensuring user comfort.
Acknowledgments
This work was supported by the State Grid Science &Technology Project (5100-202114296A-0-0-00).
Declaration of Competing Interest
We declare that we have no conflict of interest.
References
[1]Wang J, Fang K, Yang Y, et al.(2018) A game theory based interaction strategy between residential users and an electric company.Journal of Electrical Engineering & Technology, 13(1):11-19
[2]Zheng M, Sun J, Meinrenken C J, et al.(2019) Pathways toward enhanced techno-economic performance of flow battery systems in energy system applications.Journal of Electrochemical Energy Conversion and Storage, 16(2): 021001
[3]Vázquez-Canteli J R, Nagy Z (2019) Reinforcement learning for demand response: A review of algorithms and modeling techniques.Applied Energy, 235: 1072-1089
[4]Teufel B, Sentic A, Barmet M (2019) Blockchain energy:Blockchain in future energy systems.Journal of Electronic Science and Technology, 17(4): 100011
[5]Padghan P R, Samuel A D, Pitchaimuthu R (2023) Aggregatorinduced demand response and bidding strategy for electricity market environment based on Ethereum smart contracts.Energy Sources, Part A: Recovery, Utilization, and Environmental Effects, 45(1): 299-318
[6]Dong F, Meng Z, Chi L, et al.(2023) A multi-timescale optimal operation strategy for an integrated energy system considering integrated demand response and equipment response time.Journal of Renewable and Sustainable Energy, 15(4): 045501
[7]Iwafune Y, Ikegami T, Fonseca J G D S, et al.(2015)Cooperative home energy management using batteries for a photovoltaic system considering the diversity of households.Energy Conversion and Management, 96: 322-329
[8]Luo F, Dong Z, Xu Z, et al.(2018) Distributed residential energy resource scheduling with renewable uncertainties.IET Generation, Transmission & Distribution, 12(11): 2770-2777
[9]Kong X, Wang Z, Liu C, et al.(2023) Refined peak shaving potential assessment and differentiated decision-making method for user load in virtual power plants.Applied Energy, 334:120609
[10]Javaid N, Naseem M, Rasheed M B, et al.(2017) A new heuristically optimized Home Energy Management controller for smart grid.Sustainable Cities and Society, 34: 211-227
[11]Correa-Florez C A, Michiorri A, Kariniotakis G (2018) Robust optimization for day-ahead market participation of smart-home aggregators.Applied Energy, 229: 433-445
[12]Amir K, Ram R, Martin F (2015) Ranking appliance energy efficiency in households: Utilizing smart meter data and energy efficiency frontiers to estimate and identify the determinants of appliance energy efficiency in residential buildings.Energy and Buildings, 99: 220-230
[13]Zhou R, Xiang Y, Wang Y (2020) Non-intrusive extraction and forecasting of residential electric vehicle charging load.Proceedings of the 2020 IEEE Sustainable Power and Energy Conference (iSPEC), 23-25 Nov 2020
[14]Ma Y, Zhang C, Mi Z (2023) A real-time control strategy of air conditioner clusters for slow reserve service.Proceedings of the 2023 8th Asia Conference on Power and Electrical Engineering(ACPEE), 14-16 Apr 2023
[15]Zhao K, Cheng D, Kou Q, et al.(2022) Sequences consistency feature learning for video-based person re-identification.Electronics Letters, 58(4): 142-144
[16]Xiong P (2021) Development and application of demand response control platform for load aggregators.Popular Electricity, 36(11):33-34
[17]Karimi H R, Liang B, Basin M, et al.(2021) An online identification approach for a nonlinear ship motion model based on a receding horizon.Transactions of the Institute of Measurement and Control, 43(13): 3000-3012
[18]Lin G Y, Lee S C, Hsu Y J, et al.(2010) Applying power meters for appliance recognition on the electric panel.Proceedings of the 5th IEEE Conference onIndustrial Electronics and Applications(ICIEA), Taichung, Taiwan, 2010, pp 2254-2259
[19]Kato T, Cho H S, Lee D (2009) Appliance recognition from electric current signals for information-energy integrated network in home envirionments.Proceedings of the 7th International Conference on Smart Homes and Health Telematics (ICOST),Tours, France, July 1-3, 2009, pp 150-157
[20]Kim B, Kim N, Hwang Y Y, et al.(2021) Molecular identification of coccidioides posadasii in synovial fluid in Korea.Laboratory Medicine Online, 11(1): 60-63
[21]Dong H, Cai Y, Li Z, et al.(2022) Multiscale feature extraction and its application in the weld seam quality prediction for plasma arc welding.The International Journal of Advanced Manufacturing Technology, 119(3): 2589-2600
[22]Lin Y, Tsai M (2014) Development of an improved timefrequency analysis-based nonintrusive load monitor for load demand identification.IEEE Trans on Instrumentation and Measurement, 63(6): 1470-1483
[23]Teng S, Chen G (2022) Deep convolution neural network-based crack feature extraction, detection and quantification.Journal of Failure Analysis and Prevention, 22(3): 1308-1321
[24]Bansal T, Jindal N (2022) An improved hybrid classification of brain tumor MRI images based on conglomeration feature extraction techniques.Neural Computing and Applications,34(11): 9069-9086
[25]Kong X, Zhao X, Wang C, et al.(2022) Promote the international development of Energy Internet technology standards based on key competition mode.Sustainable Cities and Society, 86:104151
[26]Zhang Z (2023) Research on operation strategy optimization of electricity retailers considering energy deviation settlement and demand response.Dissertation, Zhejiang University
[27]Zhang N, Zhou Z, Zhan G, et al.(2021) How does online brand community climate influence community identification? Journal of Theoretical and Applied Electronic Commerce Research,16(4): 922-936
[28]Du H (2022) Research on technology of intelligent management and control platform for virtual power plant.Instrumentation,29(12): 66-69
[29]Liang M, Zhou K (2022) Probabilistic bearing fault diagnosis using Gaussian process with tailored feature extraction.The International Journal of Advanced Manufacturing Technology,119(3): 2059-2076

Scan for more details
Received: 26 July 2023/Revised: 13 November 2023/Accepted: 30 January 2024/Published: 25 June 2024
Liang Yue
545096320@qq.com
Siwei Li
lisiwei2@sgitg.sgcc.com.cn
Xiangyu Kong
eekongxy@tju.edu.cn
Chengshan Wang
cswang@tju.edu.cn
2096-5117/© 2024 Global Energy Interconnection Group Co.Ltd.Production and hosting by Elsevier B.V.on behalf of KeAi Communications Co., Ltd.This is an open access article under the CC BY-NC-ND license (http: //creativecommons.org/licenses/by-nc-nd/4.0/ ).
Biographies

Siwei Li is working in Beijing Fibrlink Communications Co., Ltd.He is working towards Ph.D degree at Tianjin University.His research interests include demand response and optimal operation and control of power systems.

Liang Yue received Master’s degree at NanKai University, Business College,2021.She is working in Beijing Fibrlink Communications Co., Ltd.Her research interests include demand response and optimal operation and control of power systems.

Xiangyu Kong received the B.S., M.S., and Ph.D.degrees in electrical engineering from Tianjin University, Tianjin, China, in 2001,2003, and 2007 respectively.He is currently a Professor with the School of Electrical Engineering and Automation, Tianjin University.His research interests include smart grids, power big data analysis and application, new energy, and power system analysis and control.

Chengshan Wang is an academician of the Chinese Academy of Engineering.He is currently a professor at the School of Electrical Engineering and Automation,Tianjin University.His research interests include distribution system planning and operation, grid security and stability,distributed energy and microgrids.
(Editor Yajun Zou)
