0 Introduction
The extensive landmass and rich solar-energy resources of China offer exceptional potential for research and development in rural rooftop photovoltaics (PVs).In 2014, the National Energy Administration and Poverty Alleviation Office of the State Council issued the “Notice on Organizing and Conducting Pilot Photovoltaic Poverty Alleviation Projects” [1].This directive propelled the growth of the distributed PV industry, leading to the rapid expansion of PV systems connected to power grids in rural regions.Furthermore, the formulation of China’s “carbon peaking and carbon neutrality” targets in 2022 presented a significant opportunity and challenge for the development of PV projects in rural areas.
Distribution power grids in rural areas exhibit distinctive characteristics, including vast coverage, considerable scale,uneven regional development, and relatively decentralized loads [2, 3].The high penetration of distributed PV power generation into power grids in rural areas introduces fluctuations that can pose adverse effects when it reaches a certain proportion of the total capacity of the power grid [4-6].Additionally, simulation experiments involving chaindistribution networks and distributed constant-power static loads have demonstrated that strategically distributed PV-power sources can stabilize voltage levels in ruraldistribution power grids [7, 8].However, the current scenario reveals a lack of proper planning regarding the locations and capacities of distributed PV-power access points in rural grid areas, resulting in line losses within distribution networks.This, in turn, leads to voltage deviations and fluctuations at certain nodes within rural power grids, negatively impacting relay protection, dispatch control, operational procedures,and maintenance practices, and hindering safe operation[9-12].Consequently, this study focuses on modeling and analyzing the load distribution within each rural grid area,providing a calculation model to determine the maximum PV capacity that can be accommodated in rural grid areas.This endeavor plays a pivotal role in planning access to distributed PV capacity within rural grid areas and has significant implications for ensuring the stable operation of the power grid.
Various approaches to address the challenge of load distribution have been explored.In a previous study [13],user-level load data served as the base sample and were clustered based on the electricity-consumption patterns of residential users.The impact of different clustering effects on the load-forecasting accuracy was analyzed.Another study [14] developed a computing platform utilizing Spark Graph X based on the massive data accumulated by powergrid companies.Vertex Cut and Pregel computing models were employed to address the computation-speed challenges of style="font-size: 1em; text-align: justify; text-indent: 2em; line-height: 1.8em; margin: 0.5em 0em;">Significant advancements in image-recognition technology in recent years have resulted in widespread application and expansion in the field of photovoltaics.In[19], unmanned aerial vehicles captured thermal images,which were then utilized by convolutional neural networks to identify faulty PV components, contributing to the development of an unmanned inspection system.Reference[20] employed neural networks to recognize building data in aerial images combined with sunlight-irradiance simulation algorithms and power-generation algorithms to predict the PV-generation potential of any urban area.
To address the challenges of limited information in rural grid areas and the difficulty of analyzing the loaddistribution, this study proposes a load-model extraction and analysis scheme based on remote-sensing image recognition.First, the load distribution in rural grid areas was associated with the distribution of houses and was estimated based on the housing distribution.Based on the distribution characteristics of rural grid-area houses, both uniform-interval and clustering node-placement methods are employed to analyze grid areas with evenly distributed houses and those with clustered houses, respectively.The access points of user loads on the distribution lines are calculated.Finally, by calculating the connectivity matrix of the nodes, the minimum spanning tree structure of the node set is extracted, and the structural parameters of the distribution-line load model are calculated according to the formula.
This method is a general and easy-to-reproduce solution, which provides a new method to address the problem of “analyzing load distribution in rural areas”.Finally, the integration and demonstration of the above solution is accomplished through programming, and the remote-sensing images of the rural grid are selected for testing.The results verify the feasibility and versatility of the solution, which meets the needs of rural PV-grid current calculations.
1 Model description and problem analysis
1.1 Description of load-distribution modeling of rural grid areas
The development of a distribution-network model for rural areas is fundamental for the subsequent optimization of PV access.This constitutes the ultimate goal of this study, which is to analyze the load distribution in rural grid areas.Furthermore, rural low-voltage grid areas have several primary modes of access for both PV systems and loads, including the 380 V centralized access mode,380 V decentralized access mode, and 220 V decentralized access mode [21, 22].Generally, the 220 V decentralized access mode is a typical access method, as shown in Fig.1.It is free of additional low-voltage distributionline transformations and is more suitable for PV-access transformations and load-model extraction for a large number of rural grid areas.

Fig.1 220 V decentralized access model [21]
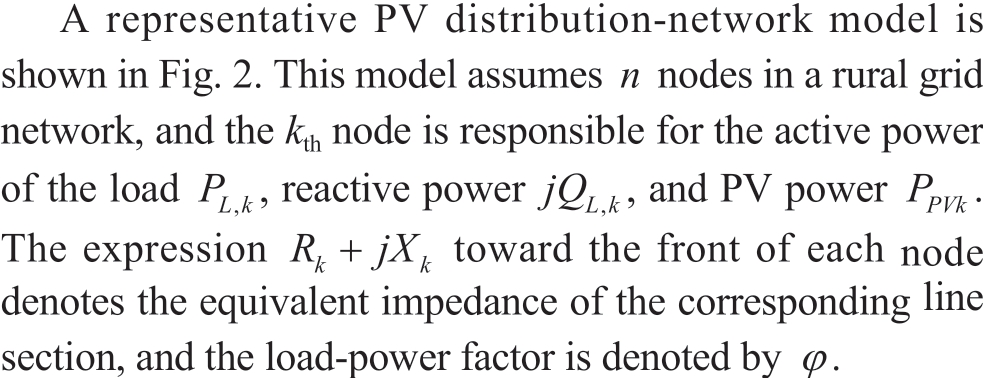

Fig.2 PV distribution network model [23]
The decentralized PV distribution-line model for rural grid areas can be equated to a single-source radiating circuit.The effects of the mutual inductance and distributed capacitance on the ground between the lines are negligible and are omitted from the model analysis.Moreover,assuming that the rated voltage in the distribution network is UN and that the power-distribution grid provides sufficiently large power, PV access causes voltage fluctuations at each node of the distribution network.To ensure the stable operation of the distribution network, these voltage fluctuations cannot exceed the specified value (the fluctuation limit according to the national power-quality standard is ±7% [24]).This specified value limits the maximum PV access.When rural grid areas have not yet accessed the distributed PV power (i.e., PPVi =0), the nodal voltage deviation of the rural grid areas can be denoted as follows:

For rural areas connected to distributed PV power,considering that the power factor of a distributed PV powergeneration inverter typically falls within the range of -0.95 to 0.95, the impact of its reactive power can be disregarded.Therefore, the voltage deviation at the node can be expressed as follows:
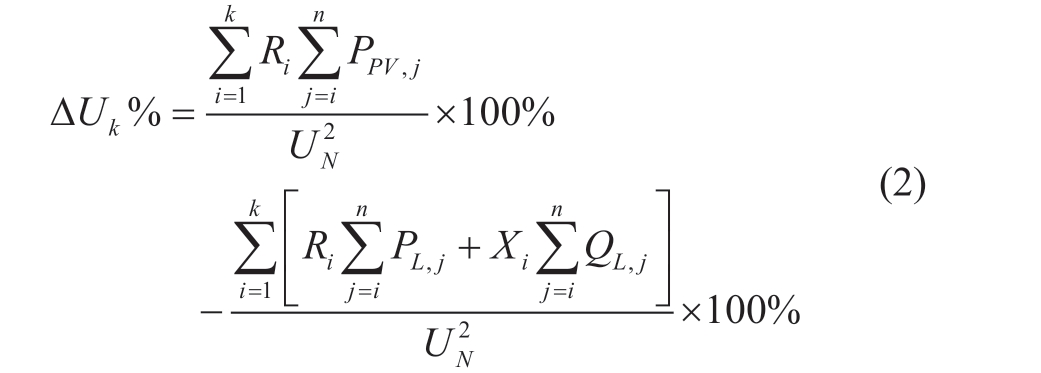
Equations (1) and (2) demonstrate that following the extraction of the load-distribution model in rural areas,the following parameters must be determined: the number of nodes n, the loads at these nodes PL,i and QL,i, and the impedance of each node line segment Ri and Xi.
1.2 Analysis of challenges and solutions
To calculate the parameters required in (1) and (2), the existing approach [16, 17] relies on the development of a specific scheme for each rural area based on its unique characteristics.However, this approach is labor-intensive,which hinders its widespread implementation.In response,this study introduces an analysis scheme based on remotesensing image recognition (all remote-sensing images in this study were sourced from Class 18 maps with a spatial resolution of 1.07 m/pixel).This scheme enables load-distribution analysis using satellite images and line topologies.This process involves recognizing the number and roof areas of houses in remote-sensing images using deep-learning techniques.Subsequently, based on the distribution characteristics of rural grid-area houses, both the uniform-interval and clustering node-placement methods are employed.They are applied to analyze grid areas with evenly distributed and clustered houses, thereby calculating the access points of user loads on the distribution lines.Finally, by calculating the connectivity matrix of the nodes,the minimum spanning tree structure of the node set is extracted, and the structural parameters of the grid-load model are calculated according to the equations.However,several challenges must be addressed to effectively implement this scheme.
First, when recognizing house distributions in rural areas based on satellite remote-sensing images, the following extreme cases may arise:
1) A single remote-sensing image often contains house targets at varying scales, as shown in Fig.3(a).Even at the same resolution, significant differences are observed in the features of different buildings.The factory buildings inside the red box exhibit a significant scale difference compared with the surrounding houses.
2) Visible remote-sensing images are influenced by lighting, cloud cover, and other factors.As shown in Fig.3(b), under the influence of cloud cover, the images of the houses inside the red box appear blurred compared with the unobstructed conditions in Fig.3(a).
3) Houses may be densely distributed in rural areas.As shown in Fig.3(c), the houses in the red box are compact,and their recognition efforts tend to interfere with each other.

Fig.3 Difficulties of house recognition under high-resolution remote-sensing image
Second, node setting within rural-grid areas is complicated because when determining the number and location of nodes, both house distribution and distributionline structures must be considered.However, the diversity of environments around the different grid areas, influenced by features such as rivers and highways, results in the absence of consistent patterns in the distribution of houses and distribution lines.
Finally, the extraction of the distribution-line structure parameters relies on a remote-sensing image containing distribution lines.Determining the hierarchical relationships between nodes based on an image is required to calculate the structural parameters.
To address these challenges, the following sections present corresponding solutions.
2 Modeling scheme based on remotesensing image recognition
The process of rural-grid load analysis based on satellite remote-sensing images proposed in this study is outlined in Fig.4.The proposed method can be divided into three main stages: recognition of house information within the rural grid areas, analysis of load-distribution characteristics,and extraction of structural parameters of distribution lines.First, under the assumption that housing distribution correlates with grid-load distribution, an image-recognition algorithm is utilized to identify the number, location,and area of houses in the remote-sensing image, thereby obtaining the housing information h( x, y ,s ) for the rural grid.Second, based on the obtained housing information, an analysis of load-distribution characteristics (such as uniform or clustered distribution) is conducted to establish rural griddistribution line nodes v ( x, y , cnt ).Finally, employing the distribution transformer as the root node of the distribution line, a tree structure model G of the grid load is derived,and parameters between nodes are calculated to achieve the final rural-grid load-distribution model.
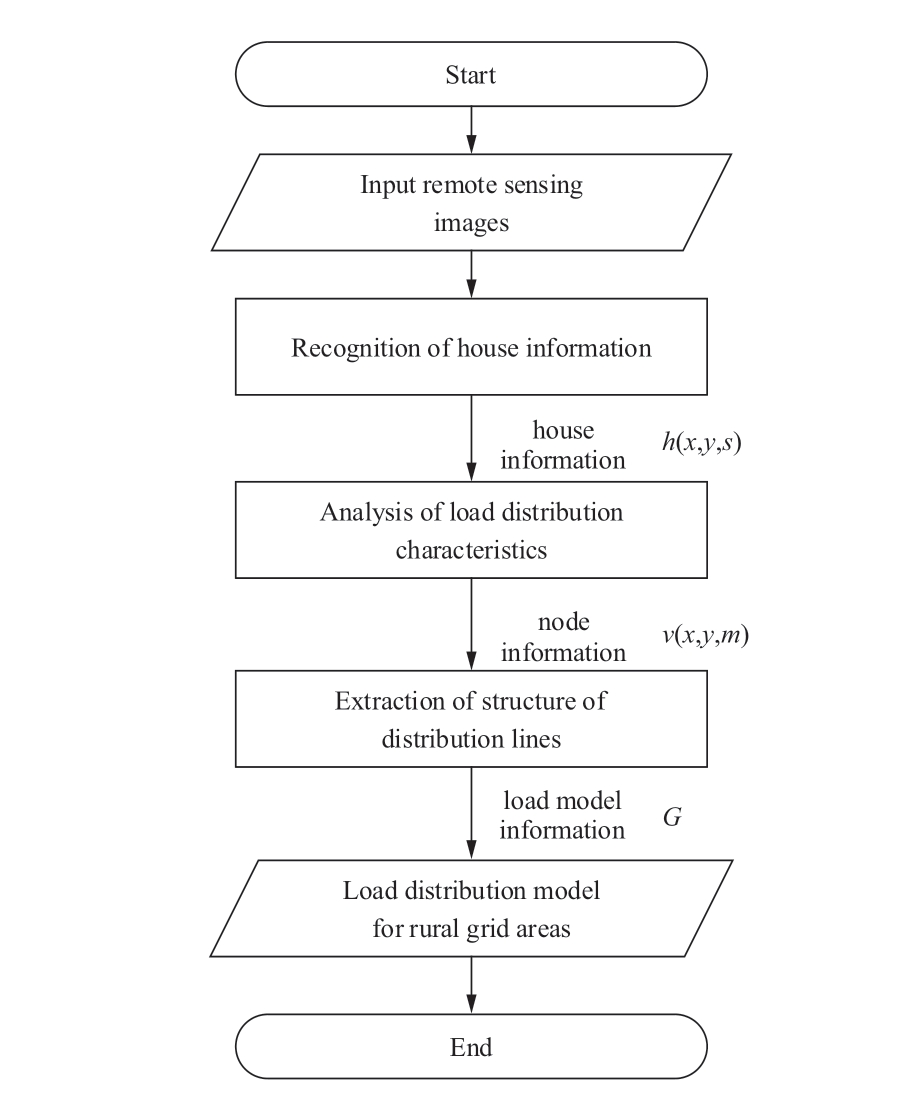
Fig.4 Scheme flowchart
The remote-sensing image of a rural grid area, shown in Fig.5, is used as an example to illustrate the scheme, in which the white line segments indicate the 220 V overhead lines,and the white five-pointed star in the red box indicates the location of the distribution point of the distribution transformer.
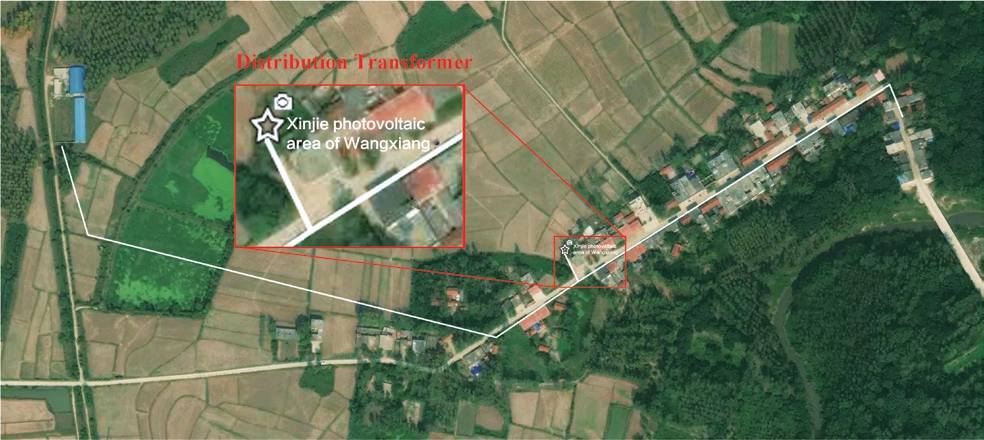
Fig.5 High-resolution remote-sensing image of rural grid area
2.1 Identification of rural grid-load area houses
A potential interdependence exists between the distribution of load resources in a rural grid -oad area and the distribution of houses in that area, and this subsection identifies houses from remotely sensed images to screen information about the location, area, and number of houses on the map.
Existing image-recognition techniques are sophisticated and capable of recognizing a target in an image and pinpointing its pixel location under the image coordinate system.In this study, the YOLOv5 modeling algorithm of the widely used YOLO algorithm family [25] is selected to recognize houses in remote-sensing images.To simplify the expression, the function fdet is used to represent the information-extraction function of the YOLOv5 algorithm for remote-sensing images, and the main formula is expressed as follows:
where H ={h 1 , h2 ,..., hn } denotes the recognition result obtained using the YOLOv5 algorithm on a remote-sensing image img.Each detection target h can be represented as a tuple ( x, y , s) , which represents the coordinate ( x, y) and area s of the house target in the pixel coordinate system.
This study focuses on illustrating the load-model extraction and analysis scheme based on remote-sensing image recognition under the conditions of the limited information of rural stations.The function fdet is not specific to a target-detection algorithm, and the reader can subsequently switch the house-detection algorithm for remote-sensing images according to reader requirements.
In this study, transfer learning is conducted on the YOLOv5 algorithm by labeling pertinent remote-sensing image datasets.This process enhances the ability of the model to robustly recognize houses in high-resolution remote-sensing images.The recognition data include details such as the precise pixel location of the bounding boxes of houses within the image, along with the corresponding confidence level for each bounding box, among other attributes.Fig.6 shows the recognition effect of the remotesensing image shown in Fig.5.The powerful semanticextraction capability of the YOLOv5 algorithm overcomes the difficulty of recognizing houses in different areas exhibiting large differences in roof structure and color and effectively obtains the location information of each house point in the rural power grid area.
Furthermore, after extensive testing using numerous remote-sensing images of rural grid areas, the algorithm demonstrates its efficacy in overcoming challenges such as varying house scales at the same resolution, mild cloud cover, and a dense distribution of houses.
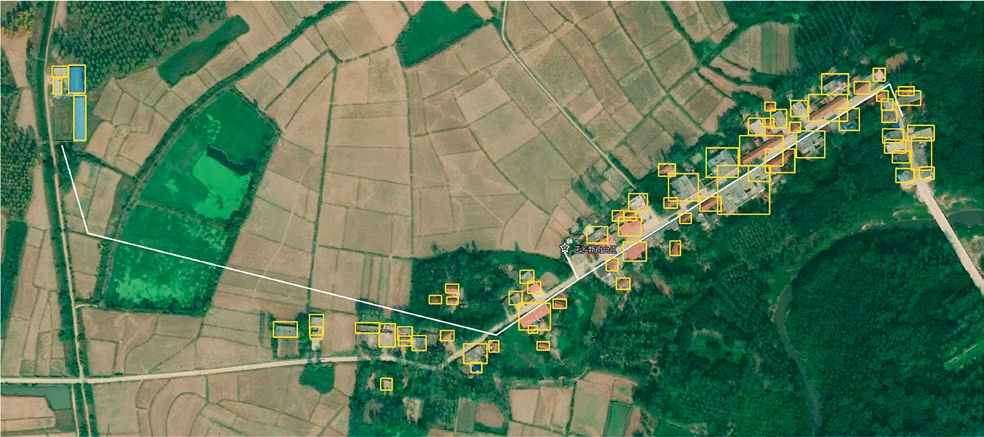
Fig.6 Result of recognizing houses in a rural grid area
2.2 Analysis of load-distribution characteristics
To analyze the load distribution in rural grid areas clearly and effectively, this study reflects the usage of electrical energy by setting up nodes along the distribution lines, as shown in Fig.2.After identifying the positions and sizes of the houses in the remote-sensing images, the houses are associated with nodes on the distribution lines, allowing them to receive electrical energy from the distribution lines via the corresponding nodes.The specific formulae are as follows:

In the equations, the distribution-line node vi is associated with mi houses, PL is the total load power of the rural grid area, φ is the power factor of the grid area,msum is the total number of houses in the grid area, and PL ,i ,QL ,i denote the load power of node vi in proportion to the number of houses.
Owing to the low degree of informatization in rural grid areas, obtaining accurate information on actual nodes is challenging.In this section, rational planning is performed based on the distribution lines in the remote-sensing images to determine the coordinates ( x , y) of the position of node v( x , y , m) with the number of houses to which it belongs, m,to obtain the node loads PL ,i and QL ,i , and thereby calculate the voltage deviation of the node.
The distribution of houses in rural areas is diverse owing to differences in topography and landscape, and the shapes of the distribution lines are also different.However,most rural houses are generally characterized by “small aggregation” or uniform distribution along main roads.Therefore, based on the fact that the distribution of rural houses is statistically positively correlated with the load distribution, this study proposes two models to estimate the load distribution and set up the nodes: the equally spaced distribution model and clustered distribution model.
i.Equally spaced distribution model
In rural areas where houses are typically distributed along rivers or main roads, as depicted in Fig.5, the equally spaced distribution model is applied.This approach uniformly distributes nodes to minimize node-establishment costs, effectively share voltage fluctuations and deviations across nodes, and reduce line costs between nodes and house points.This approach establishes nodes with similar distances by considering the house points and connects all nodes with a similar number of houses.
The implementation steps for the equally spaced distribution algorithm are outlined below:
1) The distribution line in the remote-sensing image is a white marked line, which can be distinguished from other backgrounds using the binarization operation.The set of pixels of the distribution line in the remote-sensing image is extracted as Vp, as shown in (5) below, where k denotes the number of pixels of the distribution line:
2) The second step involves iterating through the pixelpoint information in the set and calculating the Euclidean distances between each pixel point and all other pixel points.This process generates a distribution-line pixel-point distance matrix, denoted as D, which is calculated as follows:


4) The fourth step involves taking the vs pixel point as the starting point, coping it to the set of planned nodes Vn,disabling its neighboring pixel points, traversing the data in the s row of the pixel-distance matrix D, and selecting the line pixel point closest to the set equidistance value dthr as the next traversal point v's , as follows:

5) The fifth step involves coping v's to vs and repeating Step 4 until no pixel point meets the requirements for a node.Vn is the set of distribution-line nodes using the equally spaced distribution model.
The results of the implementation of the equally spaced distribution algorithm are depicted in Fig.7.In the righthand side of Fig.7, the nodes are evenly distributed along the length of the line to efficiently receive loads from nearby houses.In the left-hand side of Fig.7, the algorithm eliminates nodes without house associations and retains only the nodes containing houses at the end of the distribution lines.
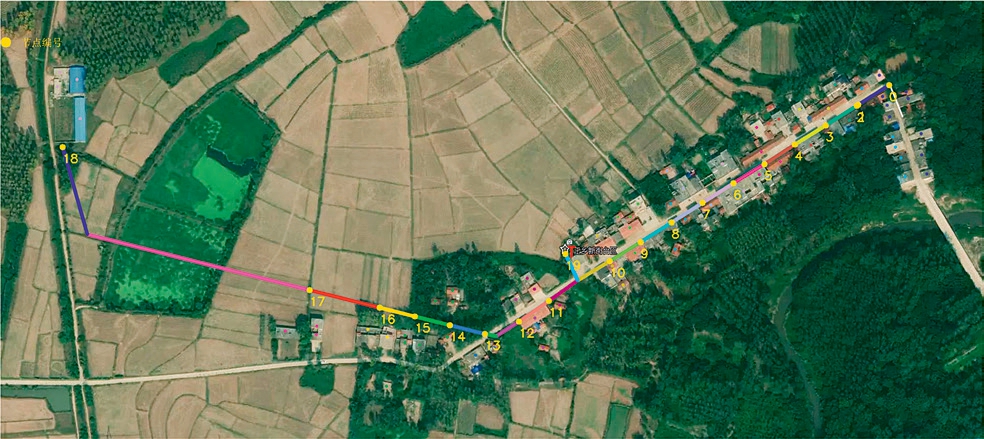
Fig.7 Outcome of applying the equally spaced distribution model
Table 1 lists the correspondence between each node number and its yellow counterpart, as shown in Fig.7.It also details the number of houses and area associated with each node.Furthermore, this table establishes a link between the number of houses that can be allocated to a node in the rural grid area and the area of the houses, which serves as a constraint in the subsequent calculation of the PV access capacity for each node.Node 19 in the diagram, which serves as the transformer connection point, is not associated with any house.Other nodes without house associations are omitted from the calculations and are only displayed when required in the subsequent topological diagrams.
Table 1 Node information for the equally spaced distribution model
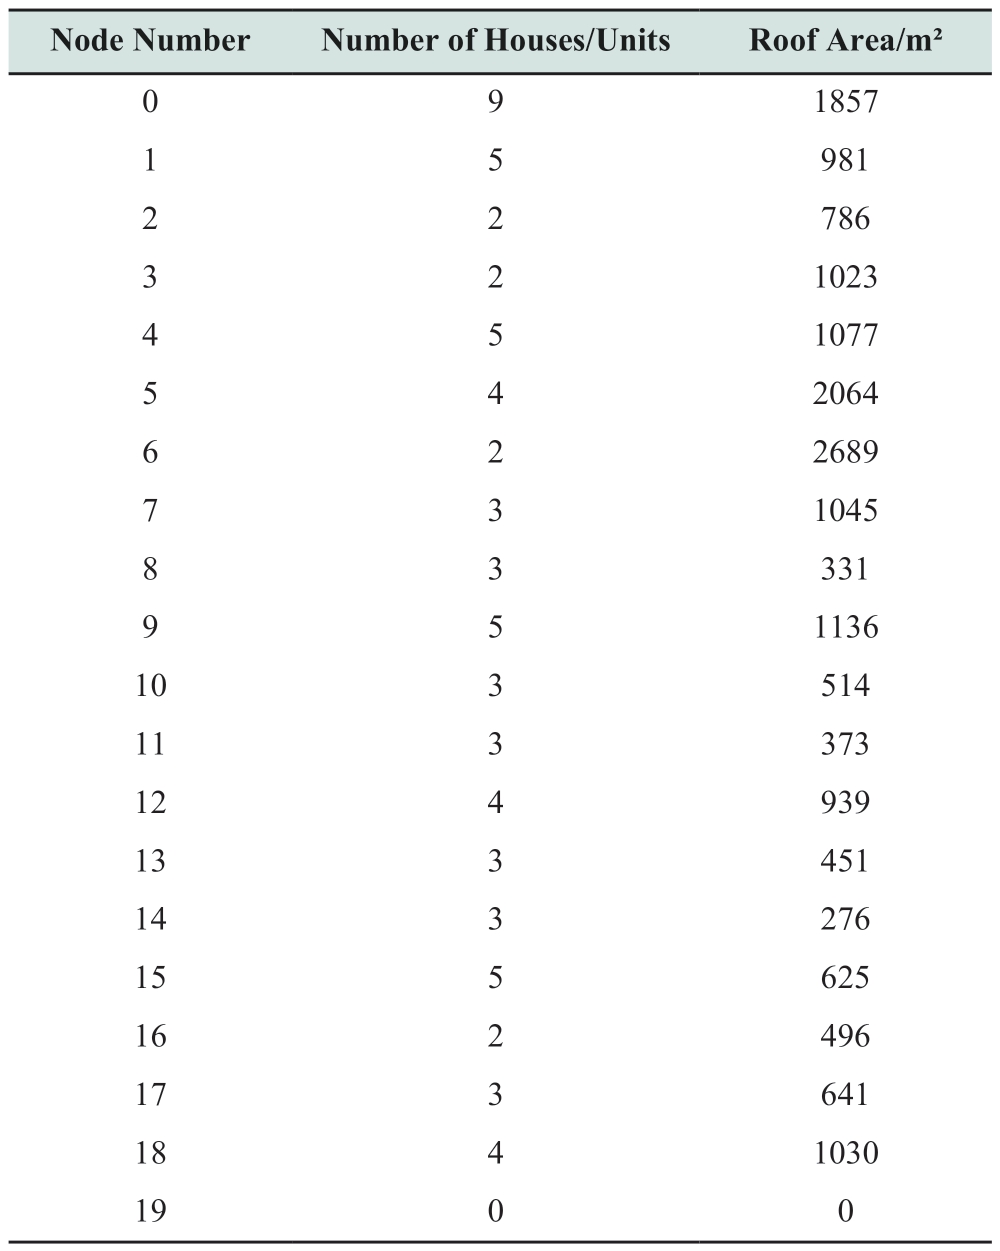
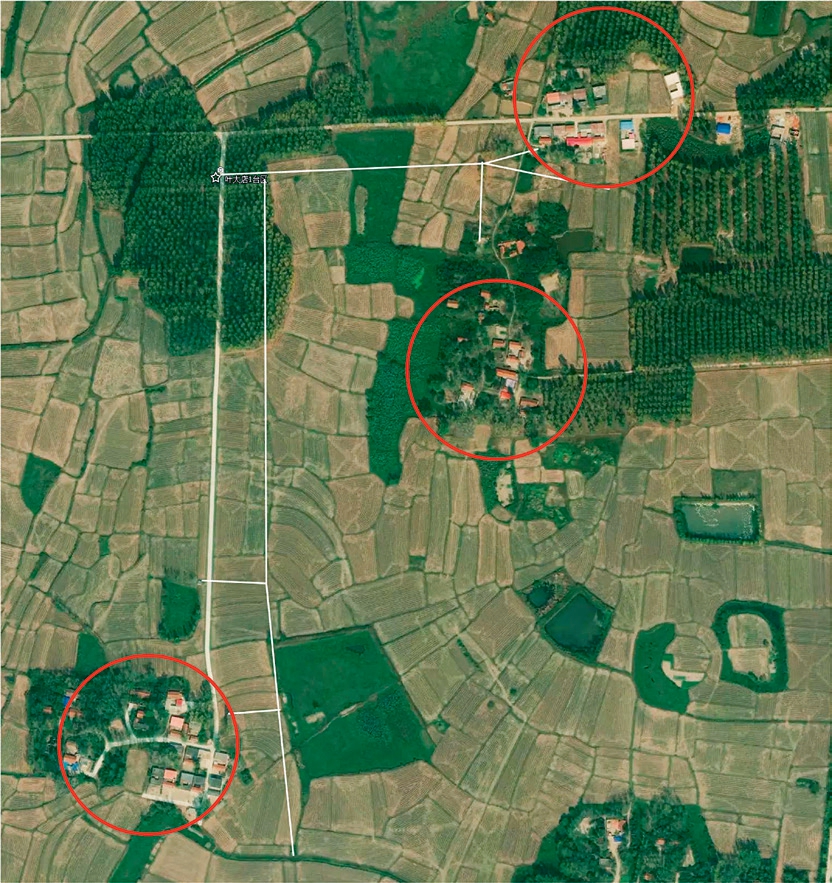
Fig.8 Remote-sensing image showing clustered houses
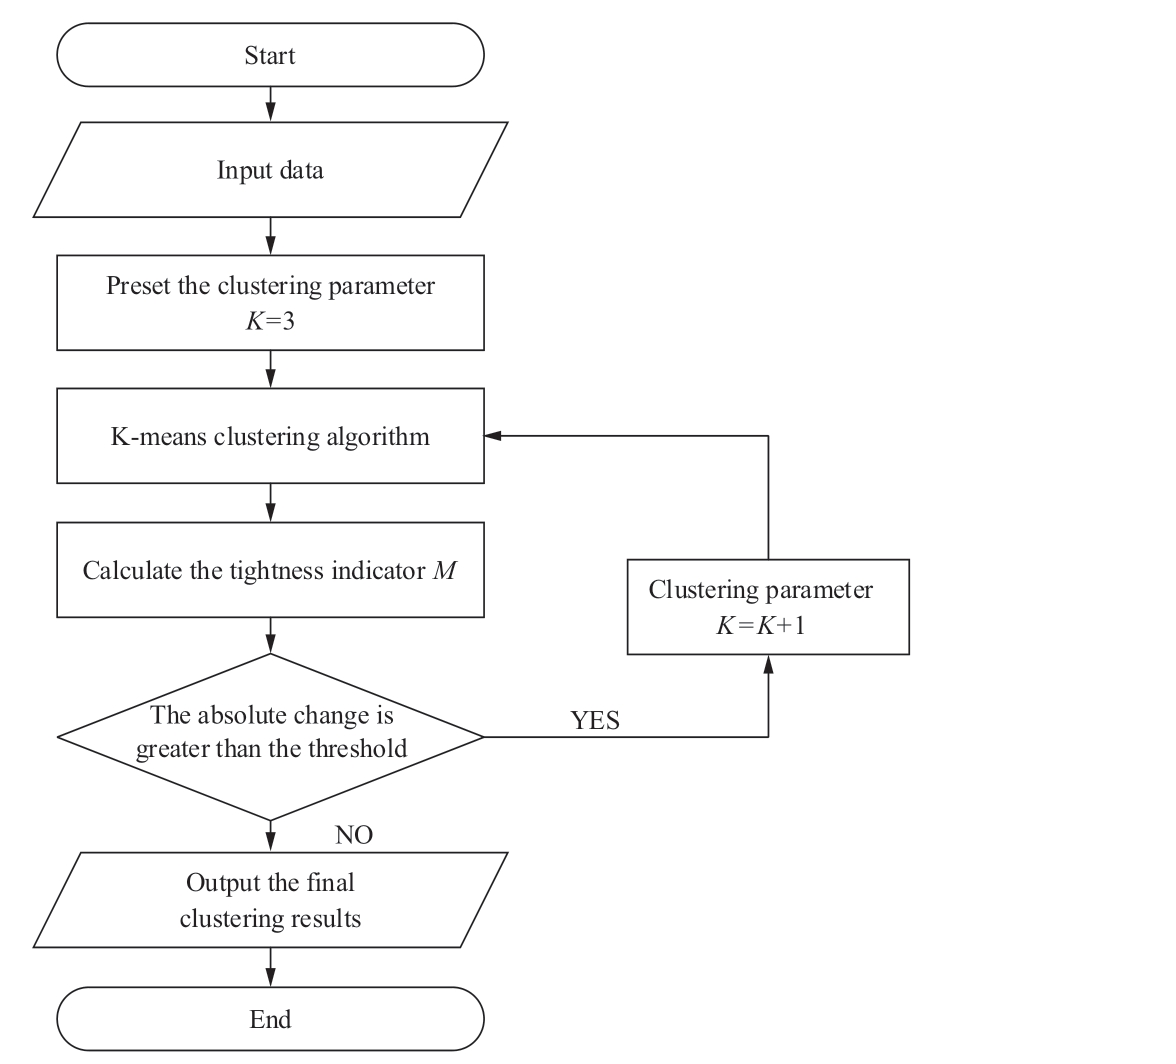
Fig.9 Flow chart of the improved K-means algorithm
ii.Cluster distribution model
Rural houses are often characterized by clusters of distributions, exhibiting a clear clustering effect in remotesensing images, as shown in Fig.8.
To address the distribution characteristics of rural houses, a clustering algorithm should be used to complete the classification of houses, obtain the clustering centers of different house clusters, and reasonably set the nodes.
In this study, the K-means algorithm [26] is improved and the “tightness” index M is introduced to evaluate the clustering effect of the algorithm.When the index no longer changes significantly, the number of clusters has been saturated, and increasing the number of clusters does not significantly improve the clustering effect.This realizes the effect of the adaptive determination of the number of clusters.The steps for improving the K-means algorithm in this study are shown in Fig.9.
1) Initially, the number of clusters k is set to 3.
2) Using the parameter k, the K-means algorithm is executed to compute the tightness index M, as follows:

3) The tightness indicator M is recorded, and the absolute change in its value ΔM is obtained.If the change is greater than the predefined threshold, M M last = is made,the number of clusters k is increased by 1, and step 2 is repeated.If the change is less than the threshold, the number of clusters k is determined.
After obtaining the clustering center of the housing cluster, it is mapped to the nearest point in the set of distribution-line pixel points as nodes that are responsible for the load of this housing cluster, as expressed in the following equation:
The effects of setting the nodes according to the clustering-distribution model are shown in Fig.10.The clustering algorithm adaptively determines the number of clusters into four classes according to the distribution of the houses and maps the cluster center point of each class to the nearest distribution line to be used as a node of that house cluster.The model considers the distribution characteristics of house-point clustering types and can adaptively determine the number of clusters, effectively saving human and material resources.
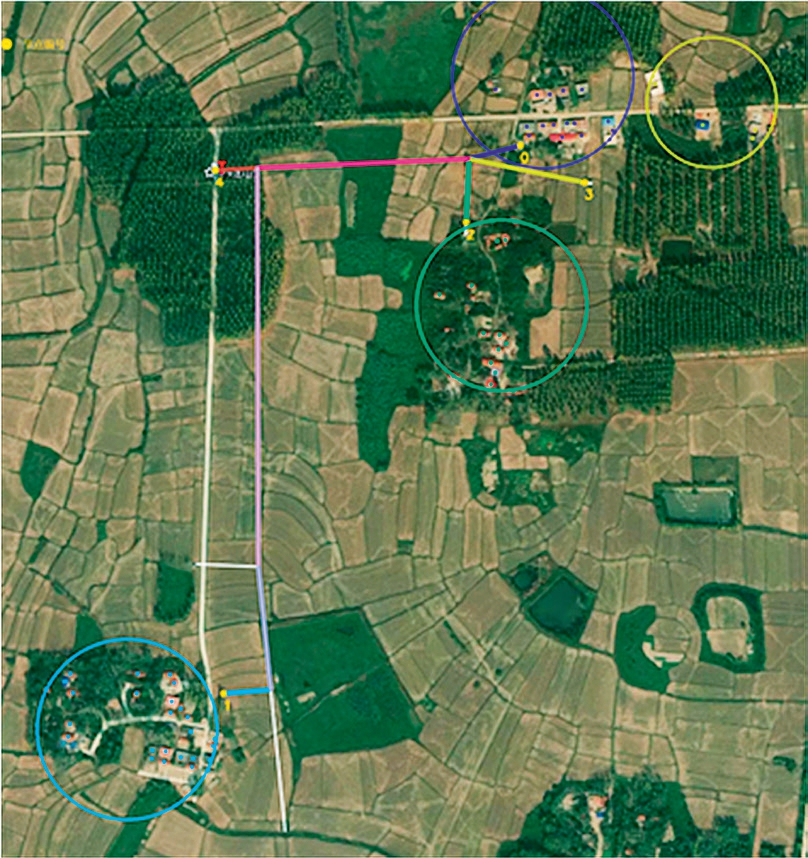
Fig.10 Outcome of clustering-node algorithm
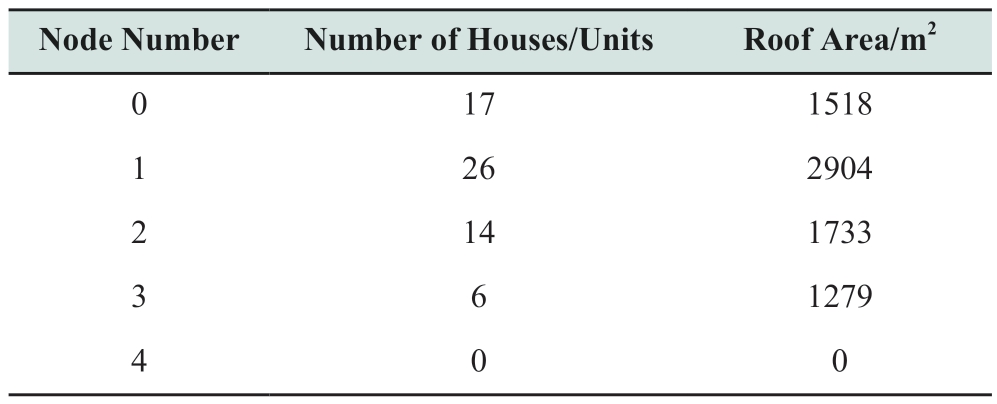
By comparing the data in Table 2 with those in Fig.10,the number of houses and house areas for each clustered node can be determined.This enables the depiction of the distribution of resource loads within the rural-grid areas and the assigning of individual houses to their respective access nodes.
Table 2 Node information for the clustering distribution model
2.3 Extraction of the structural parameters of the distribution line
After obtaining the location ( x, y) of the node v of the distribution line in the grid area through load-distribution characterization, the connectivity and upper and lower relationships between the nodes must be determined and the distribution-line structure must be extracted.Thus, the impedance R, X corresponding to the node-line segments are determined and the node voltage under the load distribution in the grid area is calculated.
The connectivity relationship between the nodes is determined by the distribution lines in the remote-sensing image.The connectivity relationship is analyzed by determining whether the midpoints of nodes vi and vj are in the set of pixel points Vp of the distribution lines, thereby constructing the connectivity matrix A of the set of nodes Vn, which is given as follows:

In (12), if the pixel coordinates![]() of the midpoints of nodes vi and vj are not in the distribution line Vp, no connectivity relationship exists between nodes vi and vj; therefore, Ai ,j and Aj ,i are set to 0.If a connectivity relationship exists between two nodes, the pixel distances are calculated as the weights of the connecting edges of the nodes.Based on this, the connectivity matrix for the topology graph of the set of nodes Vn is constructed as A.
of the midpoints of nodes vi and vj are not in the distribution line Vp, no connectivity relationship exists between nodes vi and vj; therefore, Ai ,j and Aj ,i are set to 0.If a connectivity relationship exists between two nodes, the pixel distances are calculated as the weights of the connecting edges of the nodes.Based on this, the connectivity matrix for the topology graph of the set of nodes Vn is constructed as A.
In the topology graph constructed using the connectivity matrix A, a node may have connectivity edges with multiple nodes.To form the single-source radial-circuit model shown in Fig.2, which preserves the minimum weight-connectivity edges between nodes, a minimum spanning tree algorithm is required to extract a tree G containing all nodes and ensure that the sum of the weights of all connectivity edges in the tree G is minimized.As shown in Fig.11, the nodeconnectivity matrix A in Fig.7 is extracted, demonstrating the effect of the node-topology graph constructed using the minimum spanning tree algorithm.

Fig.11 Extraction of the line structure of a rural grid area
Based on the minimum spanning tree G, the distribution point of the distribution transformer is considered as the root node, the power-flow direction between the nodes is determined, and the impedance corresponding to the node line segments is calculated.The impedance of a line is directly related to the length of that section of the line, such that

where li denotes the length of the ith node line, and Rd and Xd represent the equivalent resistance and reactance of the distribution line per unit length, respectively.
According to the map level of the remote-sensing image,the proportional relationship between the pixel distance and actual distance is obtained, and the pixel distance between nodes is converted to the corresponding actual distance l.The equivalent impedance Rd and Xd under unit length are determined by the wire-diameter model of the rural grid.They are combined with (13) to obtain the line structure parameters, thereby providing accurate line-structure information for subsequent line analyses and research.
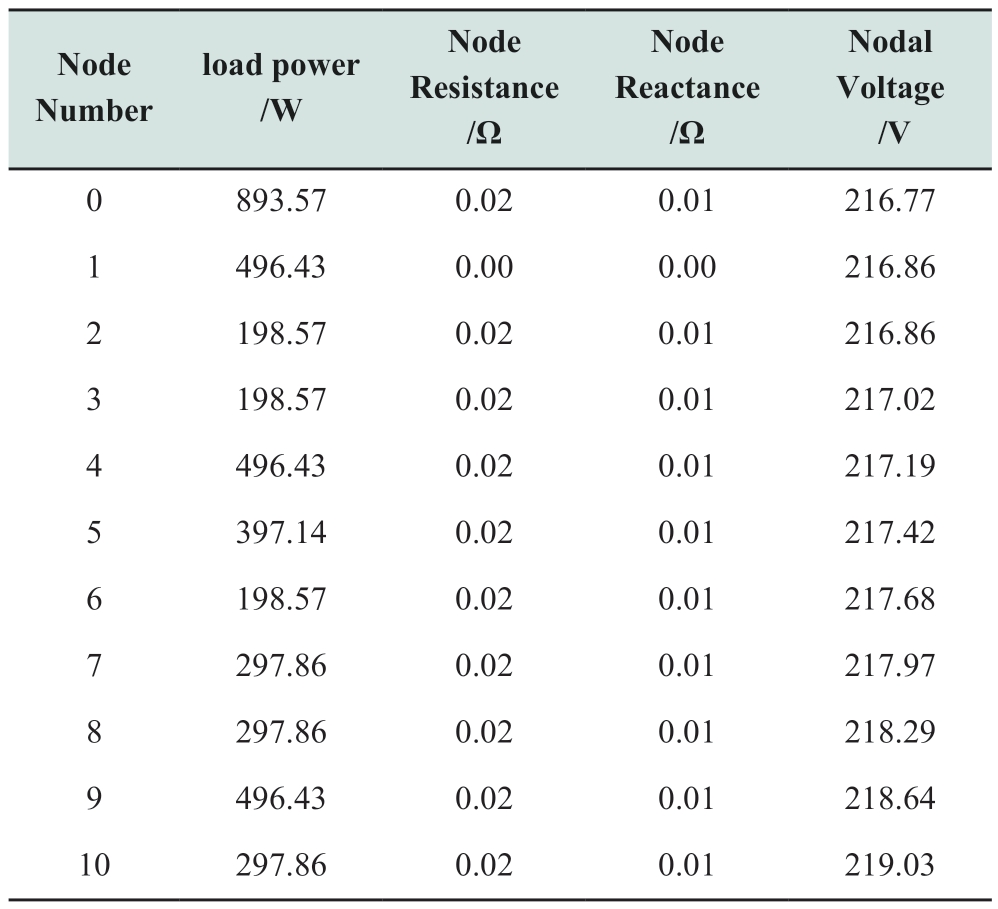
Considering the grid area shown in Fig.11 as an example, the distribution-line diameter model is LJ-70.Combined with map-scale information, the impedance parameters of each node-line segment can be calculated.Under the parameters of the total load power (6.95 kW),power factor (91.4%), and transformer voltage (220 V) in the grid area, the load power of each node and voltage after the voltage drop can be calculated by combining Equations 1 and 4, and the results are shown in Table 3.
Table 3 Main node parameter information
continue
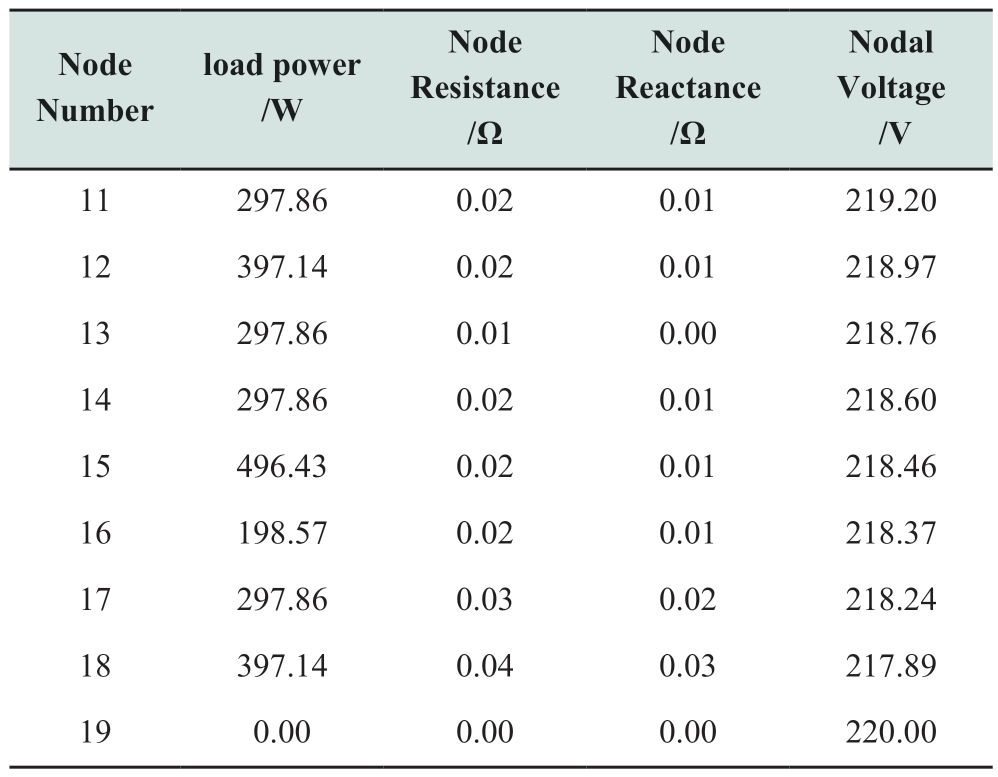
Figure 11 and Table 3 show that the node information contains data on the power of the house load for which the node is responsible, node-line-segment impedance, and node voltage under load.
By following the three aforementioned steps, namely,rural-house information recognition, load-distribution characteristics analysis, and distribution-line structure parameter extraction, the parameters of each node can be derived as outlined in (1) and (2).This forms the basis of an estimation model used in power-flow calculations, which, in turn, supports the development of PV resources in rural grid areas.
3 Programming implementation of the scheme and case analysis
3.1 Programming implementation
The scheme is implemented through programming and an interface program designed for the Windows 10 platform is developed.For clarity and better understanding, related GIF animations available for demonstration purposes.1 The readers are referred to the websites below for GIF animations of our software.Based on the request of the project supporters, we are unable to disclose the original software package, but the readers of interest may contact the corresponding author for using the software in academic purpose.[1]https://pan.baidu.com/s/1weFAgwPeGYYsaP215WhWTw?pwd=m0gg;[2]https://drive.google.com/file/d/1zUSM4WqyJQgQDSrmSUfAAEFU9 ujvaNfB/view?usp=drive_link.
The upper section of the interface serves as the display area for remote-sensing images and is used to view both the input and processed images.The lower-left corner contains the parameter-configuration area, where various settings can be adjusted.On the lower-right corner, the node-information area presents the calculated load distribution across rural grid areas.
In this study, relevant datasets are produced to train the YOLOv5 algorithm and improve the accuracy of ruralarea house information recognition.An image-annotation tool (LabelImg) is used to annotate 9,310 original images containing typical rural house features, which are partitioned into 7,432 training sets and 1,878 test sets for deep-learning training according to a ratio of 8:2.The recognition effect of the trained model is shown in Fig.12.
Figure 12 shows the effect of using the YOLOv5 algorithm for remote-sensing image recognition in difficult cases such as large variations in house scale,cloud cover, and dense houses.Because the YOLOv5 algorithm adopts a multi-scale detection strategy, it can effectively adapt to the scenario of large differences in house-category features, and the specific effect is shown in Fig.12(a).In the training phase, the YOLOv5 algorithm also utilizes the style="vertical-align: middle; text-align: center;">
Fig.12 Complex remote-sensing image recognition
3.2 Housing-identification index analysis
To evaluate the accuracy of the algorithm, precision and recall are employed as identification metrics.The precise definitions are outlined below:
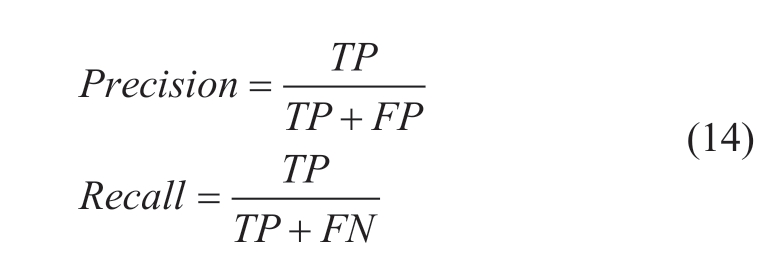
where TP refers to the number of houses correctly identified by the algorithm, FP represents the number of houses incorrectly recognized, and FN signifies the number of unidentified houses.The precision quantifies the accuracy of house recognition among the houses recognized by the algorithm, whereas the recall measures the proportion of houses correctly recognized by the algorithm relative to the total number of actual houses to be recognized.These two metrics can be used to assess the accuracy of the housinginformation identification.
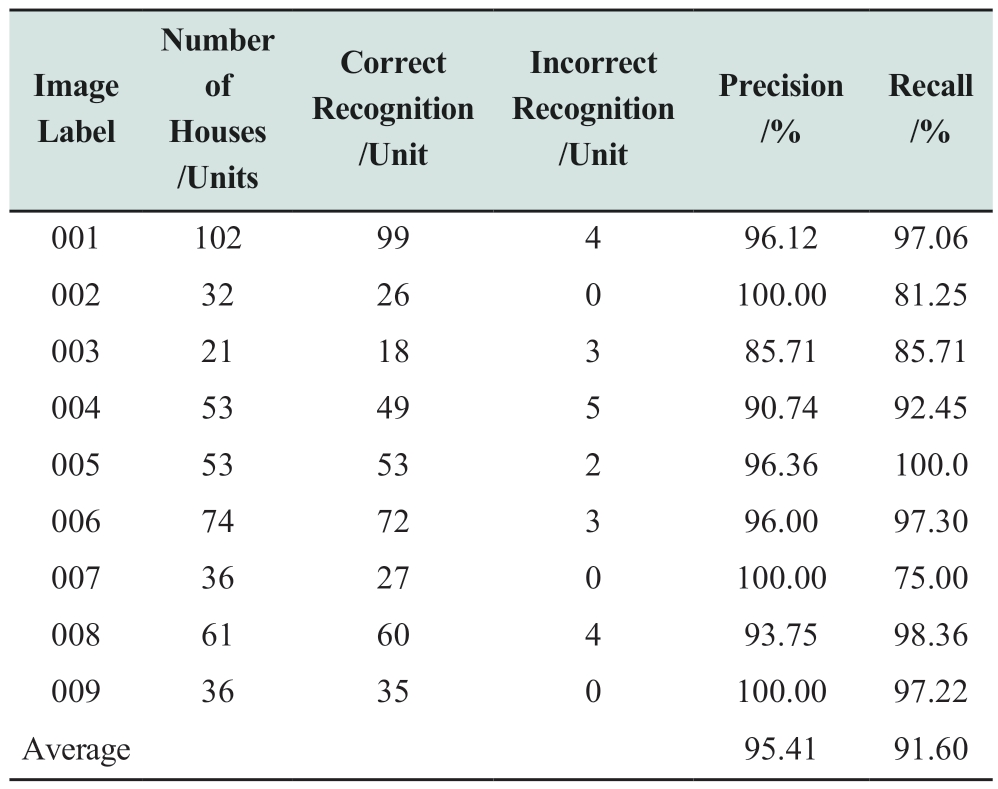
In this study, nine images of various landforms captured under diverse weather conditions are selected for testing.The precision and recall statistics are presented in Table 4.
Table 4 Key metrics of the algorithm
3.3 Case analysis
To effectively analyze the effect of the key parameters in the methodology of this study on the modeling results of the rural-grid load distribution, a comparative analysis of certain steps is conducted.
By identifying houses in the grid area, information on the pixel positions and quantities of houses is obtained.This directly affects subsequent steps, such as node establishment and load calculation, thereby influencing the final modeling results.As shown in Fig.13(a), houses identified within the red box are excluded, and the equidistant distribution model is used again for the load-distribution characteristic analysis.The resulting node graph is presented in Fig.13(b).
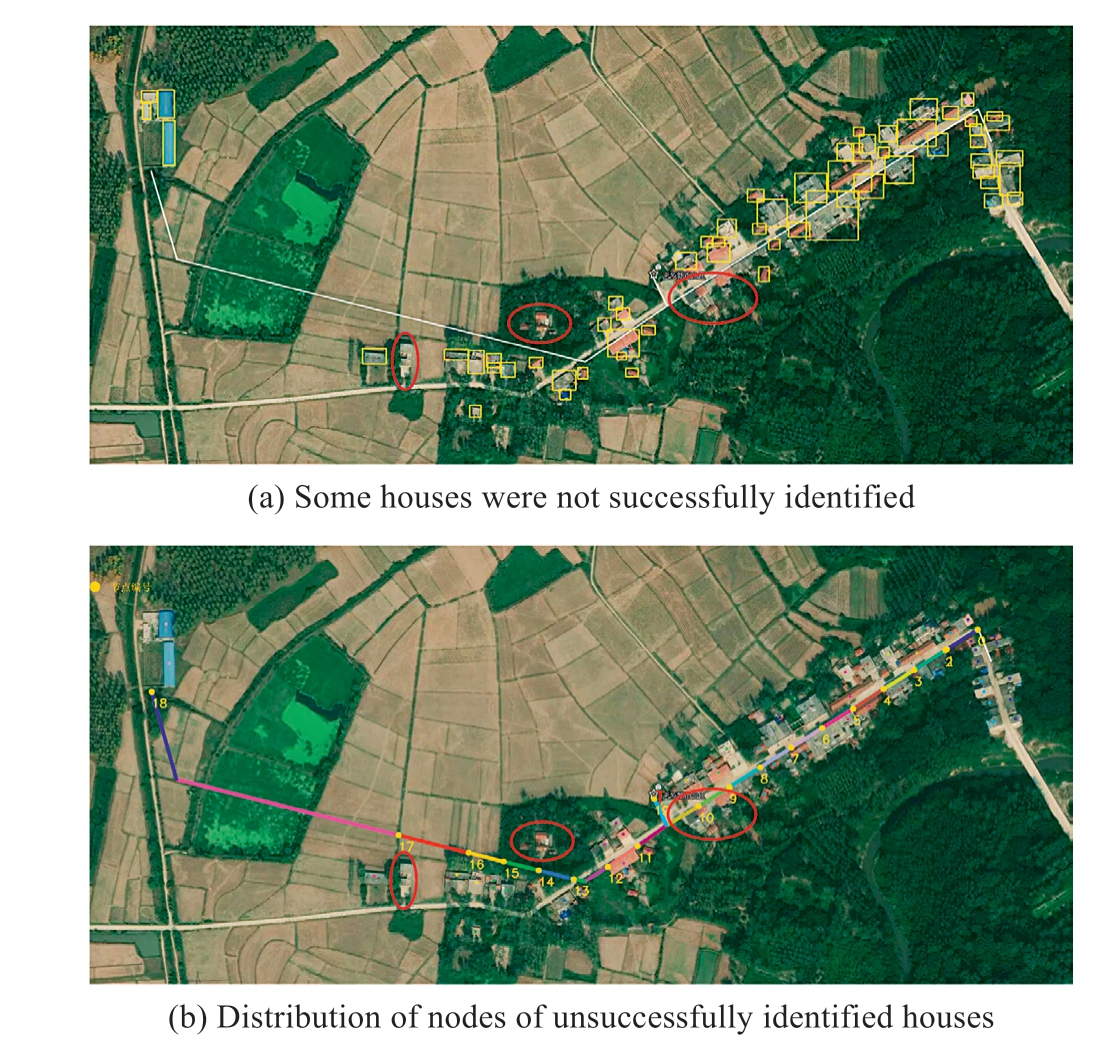
Fig.13 Some houses are not identified
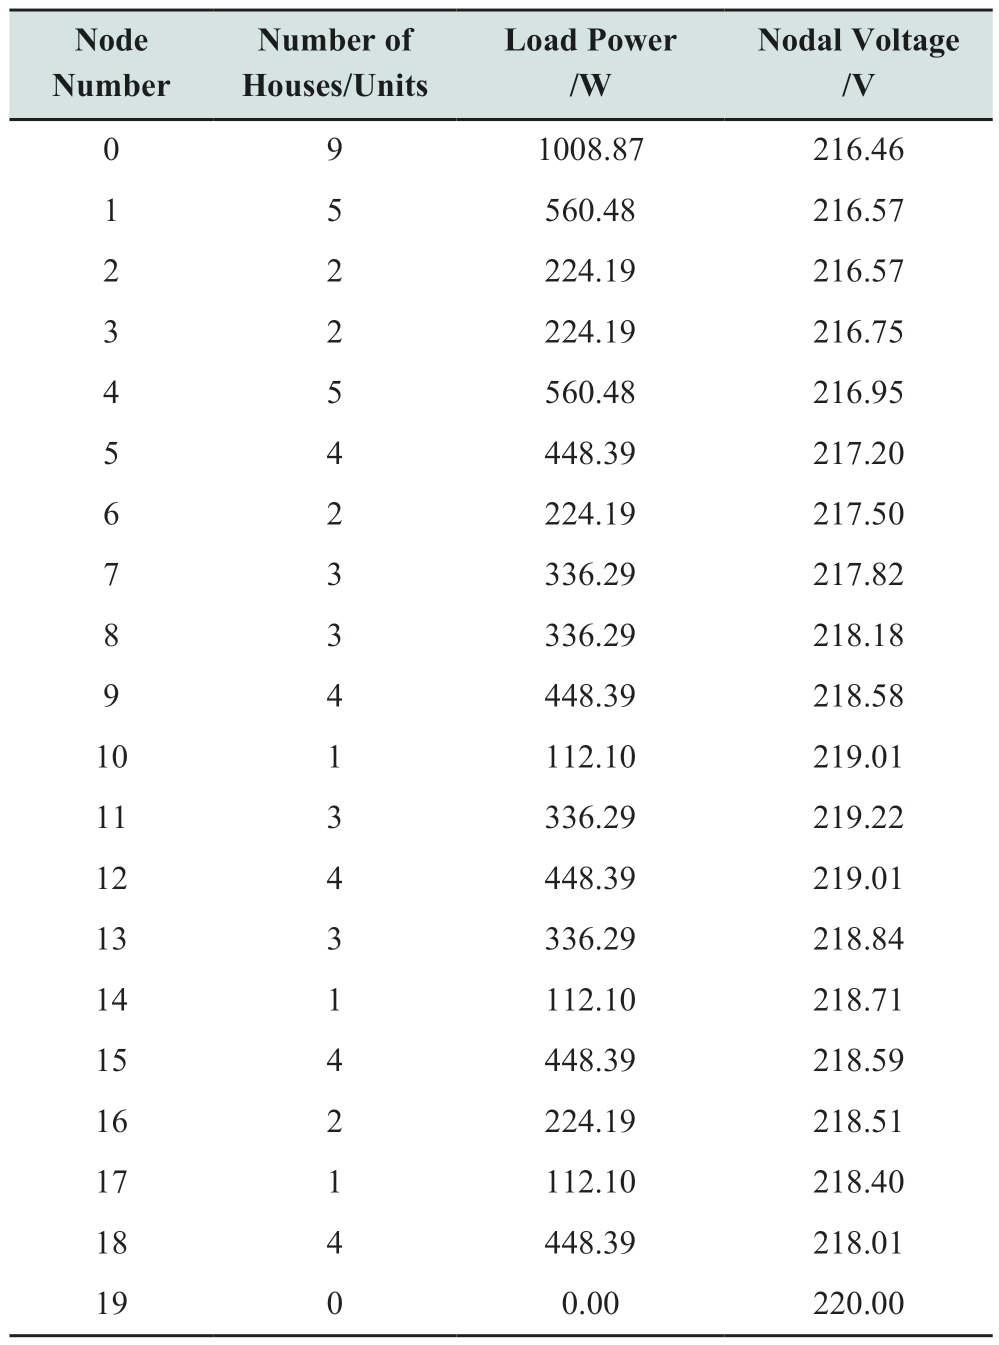
As shown in Fig.13, although some houses are not successfully recognized, no significant impact was observed on the establishment of the nodes.Thus, the connectivity between the nodes remains unchanged, and the equivalent impedances R and X of the corresponding node-line segments do not change.However, the unsuccessful identification of some houses inevitably leads to changes in the number of houses associated with some nodes, which, in turn, affects the node load power and voltage, as shown in Table 5.
The data in Table 5 and (5) suggest that the average load power of the houses increases when some houses are not recognized.Therefore, the load power of the corresponding nodes also increases.However, the houses associated with nodes 10, 14, and 17 are not successfully recognized,resulting in a decrease in the load power of these nodes.A comparison with Table 3 shows that the average difference in the node-load power is approximately 68 W and the average difference in node voltage is approximately 0.15 V.Despite the large change in node-load power, this does not significantly affect the voltage of each node.This indicates that although image-recognition calculations maynot achieve completely accurate identification results from a statistical perspective, they can still intuitively reflect the load situation in this grid (the influence of individual users on the overall distribution of the grid load can be neglected).Therefore, the load power of the nodes may be statistically estimated based on the identified number of houses, and the node voltage can be calculated accordingly.
Table 5 Main node-parameter information for unsuccessfully recognized houses
In addition to the impact of the results of the house identification of the grid area on the results of the loaddistribution model, the selection of the node model in the load-distribution characterization session also affects the final results.The two distribution-modeling algorithms,equispaced distribution and clustered distribution, affect the number of nodes, load distribution, and other important structural parameters of the station area.The difference in the effects can be determined by running the two clustering algorithms separately to set the nodes for the same station area and calculating the model structural parameters and voltages under the same grid-area parameters, as shown in Fig.14 and Table 6.
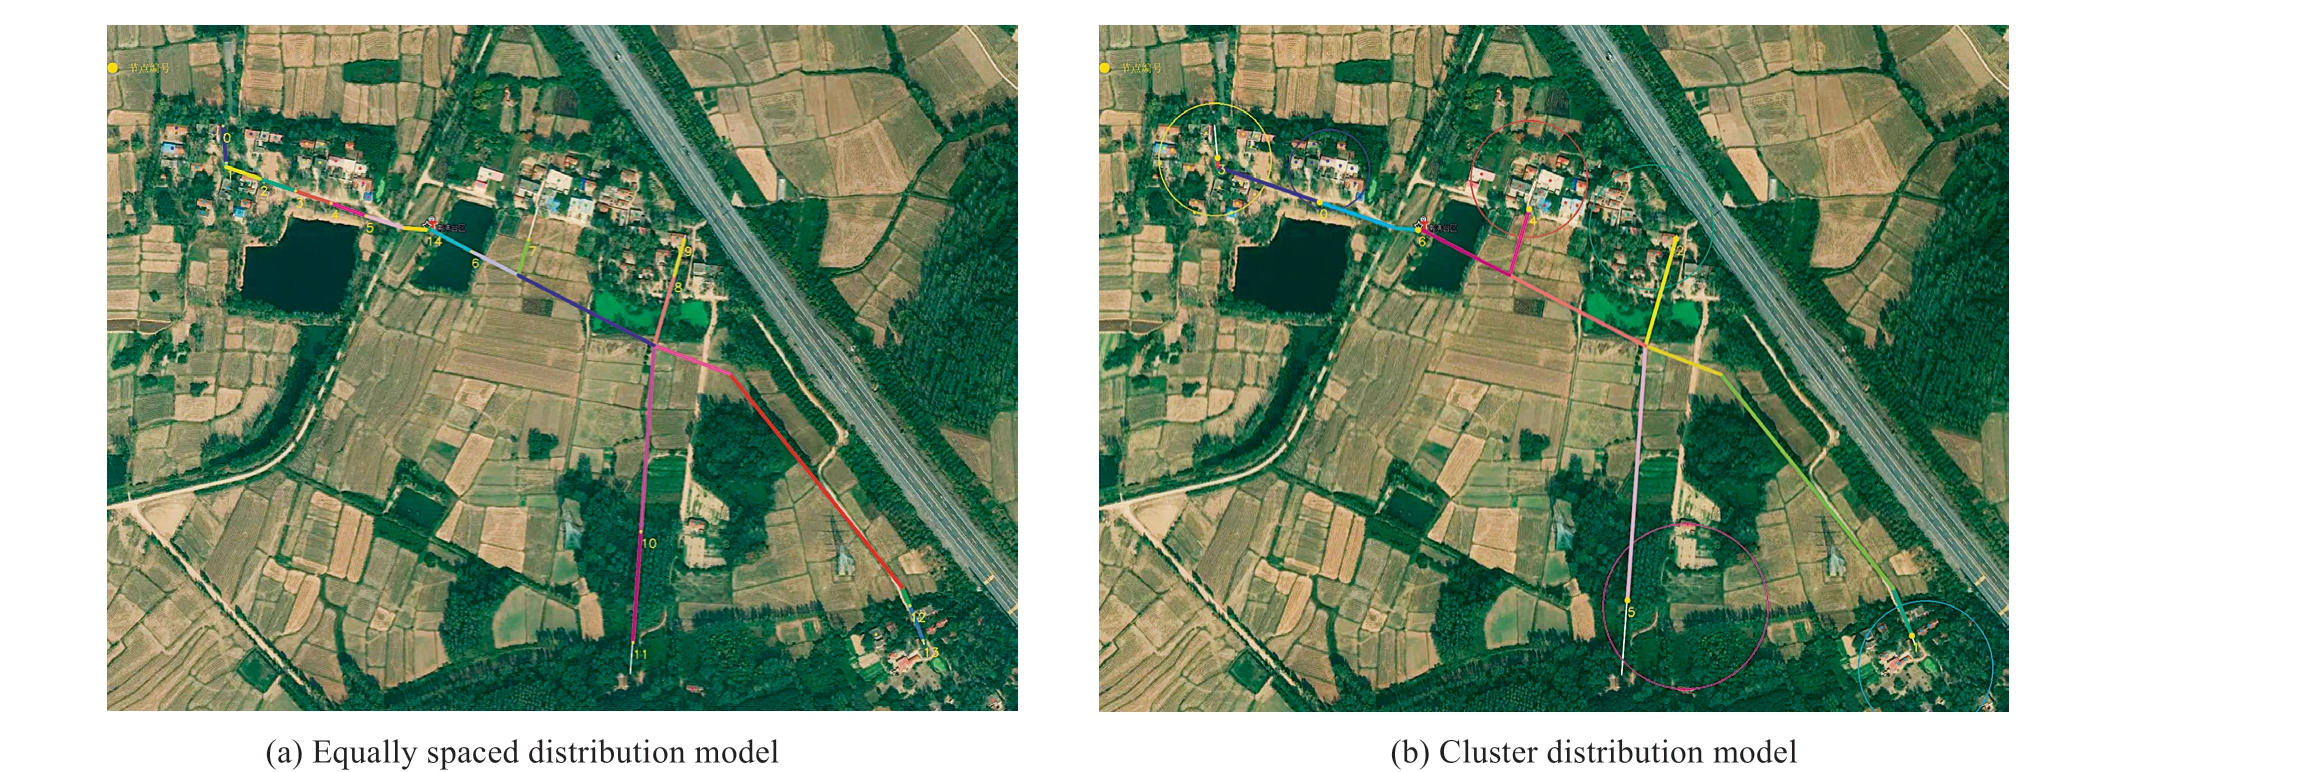
Fig.14 Differences in obtained nodes depending on the chosen algorithm
Table 6 Differences in obtained results between the equally spaced and clustering algorithms
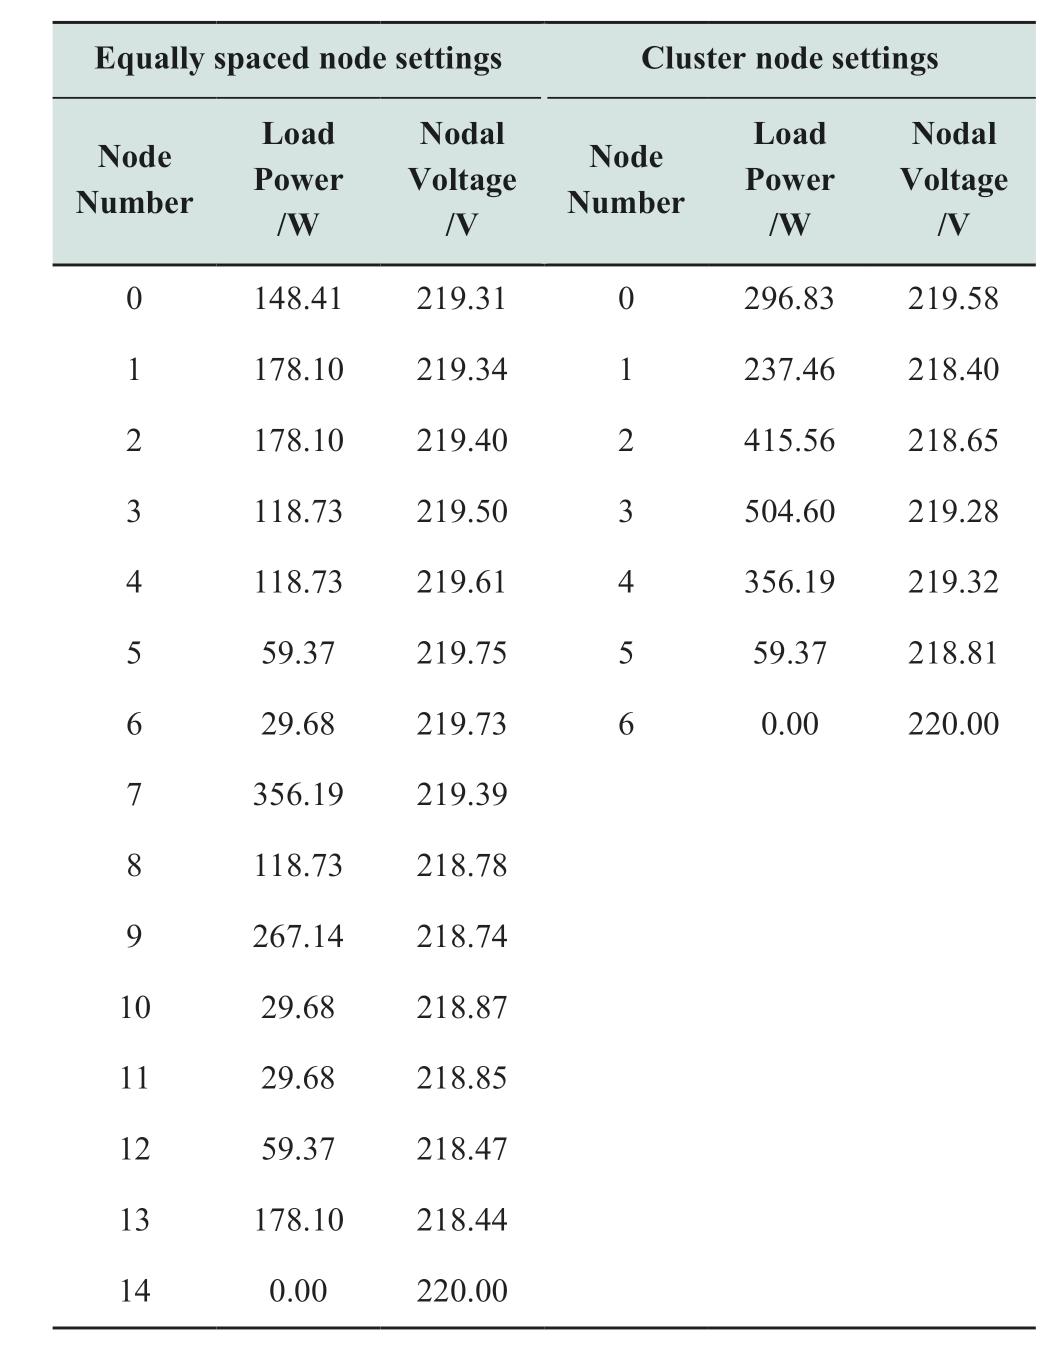
The distribution-line structure of this grid area is complicated by longer lines and multiple branch lines,and houses are primarily distributed at the ends of the line structure.Therefore, using the clustering distribution model is more suitable to set the nodes.In addition, the equispaced distribution model sets more nodes, which can reflect the voltage fluctuation of the distribution lines under the load distribution of the station area in detail.By comparison,the voltage deviation of neighboring nodes under the two distribution models is calculated to be approximately 0.05 V,indicating that both models can accurately represent the load model of the station area and that the load-distribution model results are consistent.
4 Conclusions
This study investigated the modeling of load distribution in rural-grid PV resource-development areas.Given the limited availability of information in rural grid areas, this study innovatively proposes the use of the house distribution to map the load distribution in these areas,and this study employs image-recognition technology for load-distribution modeling.The proposed approach includes two methods for node placement considering the characteristics of rural house distribution: equidistant and clustered distributions.Experimental validation demonstrated that both models yielded consistent results and effectively extracted the relevant parameters of the distribution-line nodes.
In this study, the establishment of nodes still requires manually drawn distribution lines in the power grid area.Future work will be dedicated to the use of distribution line data acquired by UAVs to realize the automatic drawing of distribution line topology in remote sensing images and the automatic establishment of nodes, thereby realizing the automatic modeling of load distribution in rural grid areas.
Acknowledgments
This work was supported by the State Grid Science &Technology Project of China (5400-202224153A-1-1-ZN).
Declaration of Competing Interest
We declare that we have no conflict of interest.
References
[1]Kou L, Xu Y, Hou X (2017) The application mode of photovoltaic power station and optimization planning of photovoltaic penetration level in rural poverty alleviation areas.Distribution &Utilization, 34(10): 14-18
[2]Shi C, Liang Y, Meng X, et al.(2011) Research on the development of the smart rural power network under urbanrural integration.Automation of Electric Power Systems, 35(06):1-5+19
[3]Yao T, Li Y, Qiao X, et al.(2022) Hosting capacity optimization of distributed photovoltaic in distribution network considering security boundary and coordinate configuration of SOP.Electric Power Automation Equipment, 42(04): 63-70
[4]Liserre M, Sauter T, Hung J (2010) Future energy systems:Integrating renewable energy sources into the smart power grid through industrial electronics.Industiral Electronics Magzine,4(1): 18-37
[5]Kato T, Yamawaki H, Suzuoki Y (2009) A study on dumping power flow fluctuation at grid-connection point of residential mi-cro-grid with clustered photovoltaic power generation systems.Proceedings of IEEE PES/IAS Conference on Sustainable Alternative Energy (SAE) IEEE, Sep 2009, pp 1-6
[6]Wang H, Ge L, Li H, et al.(2017) A review on characteristic analysis and prediction method of distributed PV.Electric Power Construction, 38(07): 1-9
[7]Wang Z, et al.(2004) Impacts of distributed generation on distribution system voltage profile.Automation of Electric Power Systems, (16): 56-60
[8]Li Y, et al.(2016) Effect of distributed PV grid on voltage of distribution network.Chinese Journal of Power Sources, 40(06):1257-1259+1306
[9]Tong Y, Wu X, Tang F (2015) Coordinated development of distributed photovoltaic generation and active distribution network.Electric Power Construction, 36(01): 72-75
[10]Xu X, Huang Y, Liu C, et al.(2010) Influence of distributed photovoltaic generation on voltage in distribution network and solution of voltage beyond limits.Power System Technology,34(10): 140-146
[11]Liang C.(2001) Distribution generation and its impacts on power system.Automation of Electric Power Systems, 25(12): 53-56
[12]Zhang L, et al.(2011) Analysis of DG influences on system voltage and losses in distribution network.Power System Protection and Control, 39 (05): 91-96+101
[13]Yang D, et al.(2018) Aggregated load forecasting based on massive household smart meter data.Power System Technology,42(09): 2923-2929
[14]Jiang W, Huang L, Qi H, et al.(2018) Research on load forecasting technology of transformer areas based on distributed graph computing.CSEE, 38(12): 3419-3430+1
[15]Goehry B, Goude Y, Massart P, et al.(2019) Aggregation of multi-scale experts for bottom-up load forecasting.IEEE Transactions on Smart Grid, 11(3): 1895-1904
[16]Zhong Q, Wu J, Huang W (2003) Researches on electric network plannings based on spatial load forecasting (II) special load forecasting.International Electric Power for China, (04): 39-41
[17]Liu S, Fu X, et al.(2017) Spatial load distribution based on clustering analysis and non-parametric kernel density estimation.Power System Technology, 41(02): 604-610
[18]Zhang H, Chen J, Chen G (2022) An SEELM-based ensemble method for load forecasting in a distributed photovoltaic systems.Power System Protection and Control, 50(10): 69-75
[19]Herraiz Á H, Marugán A P, Márquez F P G.(2020) Photovoltaic plant condition monitoring using thermal images analysis by convolutional neural network-based structure.Renewable Energy,153: 334-348
[20]Mainzer K, Killinger S, McKenna R, et al.(2017) Assessment of rooftop photovoltaic potentials at the urban level using publicly available geodata and image recognition techniques.Solar Energy, 155: 561-573
[21]Meng Y, et al.(2019) Analysis of maximum capacity of distributed photovoltaic poverty alleviation with multiple access,proceedings of the CSU-EPSA, 31(10): 110-116
[22]Shao Y, Li H, Chen J, et al.(2020) The impact of the large-scale poverty alleviation photovoltaic upon rural distribution network in Jibei grid.Distribution & Utilization, 37(12): 46-53
[23]Huang W, Liu J, Wei H (2015) Extreme capacity limitations of photovoltaic generators in distribution grids.Power System Protection and Control, 43(03): 22-28
[24]Liu J, Huang W (2015) Analysis on grid-connectible capacity of distributed PV generation in case of PV generation distribution close to load distribution.Power System Technology, 39(02):299-306
[25]Redmon J, Farhadi A (2017) YOLO9000: better, faster, stronger.Proceedings of the IEEE Conference on Computer Vision and Pattern Recognition, pp 7263-7271
[26]MacQueen J (1967) Classification and analysis of multivariate observations.Proceedings of the Fifth Berkeley Symposium on Mathematical Statistics and Probability, pp 281-297

Scan for more details
Received: 16 October 2023/Revised: 26 February 2024/Accepted: 27 March 2024/Published: 25 June 2024
Bowen Shang
shangbw69@163.com
Ning Zhou
zhouningznzz@sina.com
Jinshuai Zhang
1228444163@qq.com
Mingming Xu
240409976@qq.com
2096-5117/© 2024 Global Energy Interconnection Group Co.Ltd.Production and hosting by Elsevier B.V.on behalf of KeAi Communications Co., Ltd.This is an open access article under the CC BY-NC-ND license (http: //creativecommons.org/licenses/by-nc-nd/4.0/ ).
Biographies

Ning Zhou graduated with a bachelor’s degree in Thermal Power from Shanghai Jiao Tong University in 1992, and graduated as a postgraduate from North China Electric Power University in the major of Electrical Engineering in 2012.Has been working at the Electric Power Research Institute of State Grid Henan Electric Power Company since 1999.The main research direction is in the field of safe operation of distribution networks and new energy consumption technology.

Bowen Shang received the B.S.degree from the School of Electrical Engineering, Northeast Electric Power University, Jilin, China, in 2018, and the M.S.degree from the School of Electrical Engineering, Xi’an Jiaotong University, Xi’an, China, in 2021.She currently works with the State Grid Henan Electric Power Research Institute, Zhengzhou, China.Her current research interests include novel distribution networks, image recognition, and power electronic fault diagnosis technology.

Jinshuai Zhang graduated with a bachelor’s degree in Physics from Southwest University in 2016, and graduated with a doctorate in Condensed Matter Physics from Wuhan University in 2021.From 2021 to present,he is a postdoctoral fellow in the direction of Electrical Engineering at the Electric Power Research Institute of State Grid Henan Electric Power Company.The main research direction is the development and consumption of distributed power sources in the power system.

Mingming Xu graduated with a bachelor’s degree in Electrical Engineering and Automation from Xi’an Jiaotong University in 2007, and graduated with a doctorate in Electrical Theory and New Technology from the Institute of Electrical Engineering of China Electric Power Research Institute in 2015.He has been working at the Electric Power Research Institute of State Grid Henan Electric Power Company since 2015.At present, he mainly engages in research work in the aspects of distribution network fault handling technology and the development and grid connection of distributed new energy.
(Editor Zedong Zhang)
