0 Introduction
Offshore wind power plays a crucial role as strategic support for achieving the transition to low-carbon energy.The Chinese offshore wind power industry has developed rapidly.During the “14th Five-Year Plan” period, the capacity of wind power projects under construction in coastal provinces such as Jiangsu, Zhejiang, Guangdong,and Fujian surpassed 1,000 MW [1].With the saturation of offshore wind power resource development, it is progressively expanding into deep sea areas.The 400 MW high-capacity wind farms currently in operation in Germany are located approximately 100 km offshore.The Sandbank wind farm, commissioned in 2017, has an installed capacity of 288 MW, with the farthest offshore distance reaching 123 km.The EnBW He Dreiht offshore wind farm, which has received approval, is expected to have an installed capacity of 900 MW at an offshore distance of 103.6 km.The UK established the Dogger Bank wind farm,boasting an installed capacity of 3,600 MW at an offshore distance ranging from 131-290 km.The average distance of offshore wind power farms in China is expected to exceed 100 km in the future, with the expected installed capacity reaching 40,000 MW by 2050 [2].The integration of deepsea wind power through long-distance sea cables results in communication delays between centralized control centers and offshore wind turbines [3].
Frequency stability is a fundamental requirement for the secure and stable operation of power systems.In recent years, with the continuous grid connection of lowinertia power sources such as wind power and photovoltaic systems, achieving flexible regulation of the grid frequency has encountered significant challenges [4, 5].Currently,several countries have established grid-connected wind power standards [6], explicitly mandating that wind farms be equipped with active power control systems and possess the capability to participate in power system frequency modulation [7, 8].There are two main methods by which wind turbines participate in the frequency regulation of power grids.One approach is to enhance the inertia of new energy units through virtual inertia control [9] or virtual synchronization technology [10], providing them with shortterm frequency support.The second method involves using droop control [11, 12] to endow wind turbines with longterm frequency support capability, also known as one-time frequency modulation capability.
With the continuous development of offshore wind power, nearshore resources are becoming increasingly saturated, and the distances from the shore to offshore wind power systems are increasing.The initial experimental results indicated that the primary frequency response lag time of offshore wind turbine units is relatively long,generally reaching the second level [13].However, the frequency response must be activated within a few hundred milliseconds, making it difficult to meet the grid-connection requirements.
Several studies have been conducted to address this issue.A coordinated communication method was used to transmit grid frequency information to the rotor-side converter of wind turbine units via generator simulation control [14].To address the virtual inertia delay of wind turbine units, an analytical expression for the system frequency response considering the inertia delay was established [15].However, this study only simulated the delay component with a first-order inertial link and did not model wind turbine units under different wind speed conditions.A delay-dependent robustness method was proposed for the time delay generated by communication channels, and was used to evaluate the robustness of the system to time delay and delay estimation margins [16].The relationship between the secondary frequency control gain and delay margin was investigated, and a gain-scheduling method was proposed to compensate for the impact of communication delays on frequency control [17].However,existing studies primarily simulate the delay component using a first-order inertial link, and wind farm simulations often use a single wind-speed condition.
This study focuses on the frequency response model of a grid-connected offshore wind power system.In this study, the wind farm was operated under low, medium,and high wind speed conditions.A frequency modulation control strategy based on the kinetic energy release of the fan rotor was combined with a frequency modulation control strategy based on the power-load reduction reserve, and the delay link was simulated using the higher precision Padé formula.The model built in this study is more accurate, the frequency modulation control strategy is more comprehensive, and the frequency modulation effect is better than those from previous grid-connected wind power system frequency response models.Based on this model, a quantitative analysis of the delay coefficients and other important parameters was conducted to clarify the detailed mechanisms affecting the stability of the grid-connected offshore wind power system frequency response model.Using this model, the corresponding delay compensation control strategies were designed to enhance the system stability.It is extremely important to improve the primary frequency modulation performance of offshore wind turbines and enhance the frequency stability of gridconnected offshore wind power systems.
1 Frequency response modeling
1.1 Traditional power system model
A simplified system frequency response (SFR) model based on the inertia center of the system was established and is depicted in Fig.1 [18].Focusing on the reheat steam turbine generator, this model uses a mathematical model for its governor-prime mover system, which neglected small time constants and limiting elements and was integrated with the rotor motion equations.This model is suitable for a traditional power system consisting mainly of steam turbine units.It does not consider in detail the relationship between the thermal system dynamics of the boiler and the output of the turbine unit, or the relationship between the prime mover time constant and the output of the turbine unit.In Fig.1, Hs and Ds are the inertia time constant and damping coefficient of the synchronous generator,respectively, Km is the mechanical power gain, FH is the work proportion of the high-pressure cylinder, TR is the reheat time constant of the prime mover, R is the adjustment coefficient, Δfs is the frequency deviation of the system, and ΔPd is the active disturbance on the system side.
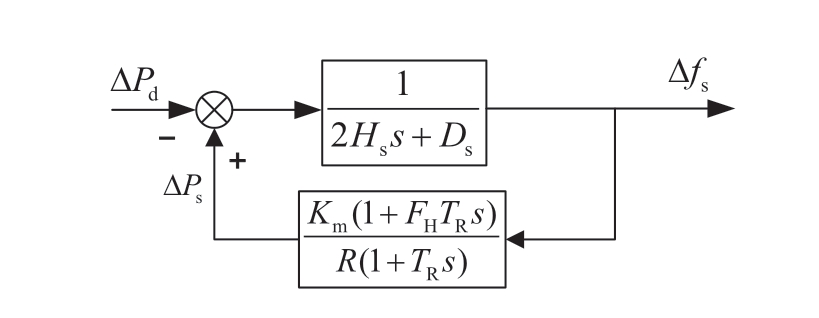
Fig.1 SFR model of traditional power system
1.2 Frequency response of wind turbines model
To derive the frequency response model of a gridconnected offshore wind power system, it is common to integrate the frequency response model of the wind power generation system with the simplified SFR model of the traditional power system.
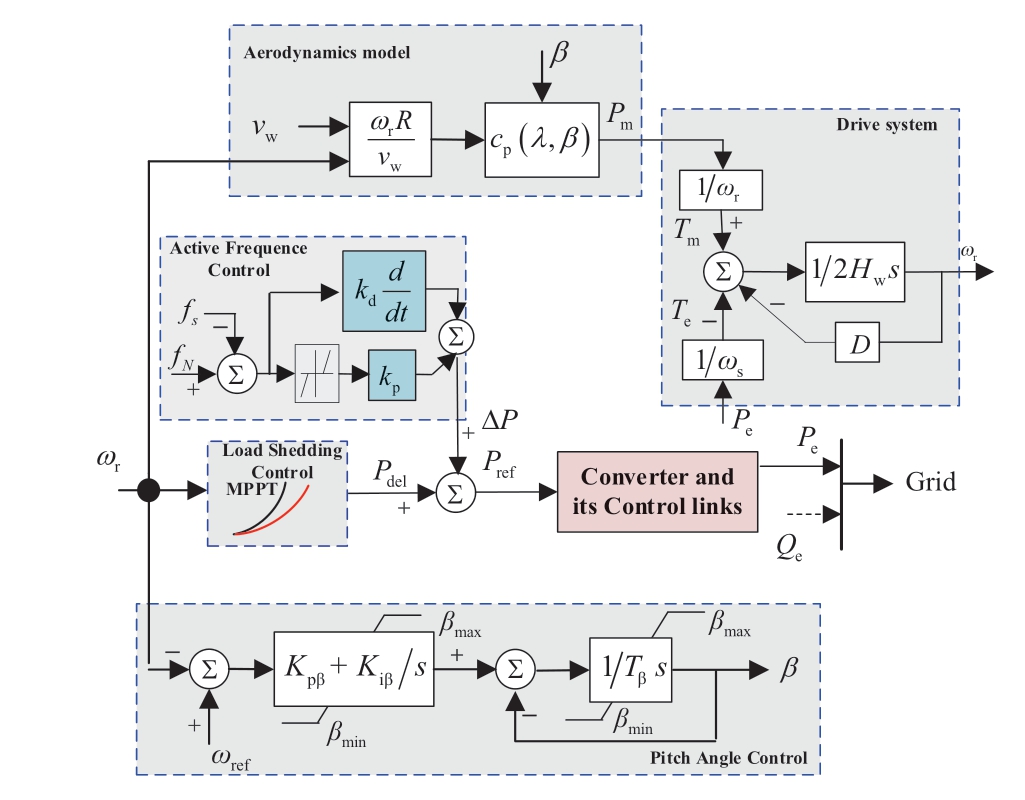
Fig.2 Active power model of direct-drive permanent magnet synchronous generator (DPMSG) wind turbine considering primary frequency control
A load-shedding frequency regulation control strategy involving overspeed and pitch cooperative frequency control was proposed [19].It used the directly driven wind turbine with a direct-drive permanent magnet synchronous generator (DPMSG) featuring deceleration and pitch cooperative frequency control as an example.The principle is to prioritize overspeed control and then engage in pitch control when the overspeed control reaches its extreme value.Fig.2 shows the active power model of the DPMSG wind turbine considering primary frequency control.
The frequency regulation control includes additional inertia and droop controls.The additional inertia control uses the rate of frequency change as the input, whereas the droop control uses the frequency deviation as the input.The additional power ΔPa obtained by active frequency control is expressed as:
where Δfs = fs - fN signifies the system frequency deviation,where fs and fN are the system frequency and rated frequency,respectively; kd is the virtual inertia time constant; and kp is the droop control proportional coefficient.For the dynamic coupling between the generator and machine-side converter, given that the electromagnetic transient process is significantly faster than the electromechanical transient process of the system, the electromagnetic adjustment process of the DPMSG and converter can be disregarded.It has been suggested that it can be equivalently represented as a first-order inertia section [20].
where Pw.e and Pw.e_ref are the electromagnetic power and electromagnetic power reference values of the wind turbine,respectively; and Ts is the equivalent time constant of the generator and the machine-side converter.
The load-shedding frequency regulation control strategy for wind turbines is intricately linked to wind speed.Based on the load-shedding power Pdel of wind turbines at different wind speeds [21], a simplified frequency response model was formulated.The details are as follows.
1) Low wind speed unit
When the wind turbine operates under low wind speed conditions, load-shedding control is achieved through the rotor overspeed control mode.During this period, the pitch angle is set to β = 0.The dynamic behavior of wind turbines[12,22] can be described as follows:

where Pw.m and Pw.e are the mechanical power and electrical power of the wind turbine, respectively; Hw and Sw are the inertia and apparent power of the wind turbine, respectively;vw is the wind speed; ρ is the air density; R is the blade radius; cp is the wind energy utilization coefficient; λ is the tip speed ratio; ωr is the rotor speed; Pdel_l is the power of the low wind speed unit after load reduction; d% is the load reduction rate; Pmppt is the output power running in maximum power tracking; and kdel is the load reduction coefficient.
2) Medium speed unit
When a wind turbine operates under medium wind speed conditions, load reduction is achieved through cooperative overspeed and pitch control.The mathematical model of the pitch angle is

where β is the pitch angle; ωr.ref is the reference value of the rotor speed; kpβ and kiβ are the proportional and integral coefficients of the pitch angle controller, respectively; Tβ is the time constant of the pitch angle controller; and x is the intermediate variable.
The power of the wind turbine after load reduction is given by:

3) High wind speed unit
When the wind turbine operates under high wind speed conditions, as the wind turbine speed reaches its maximum value, all the load-shedding power is executed through pitch control.The power of the wind turbine after the load reduction can be expressed as follows:
where Te0 = Pdel/ωr.max.
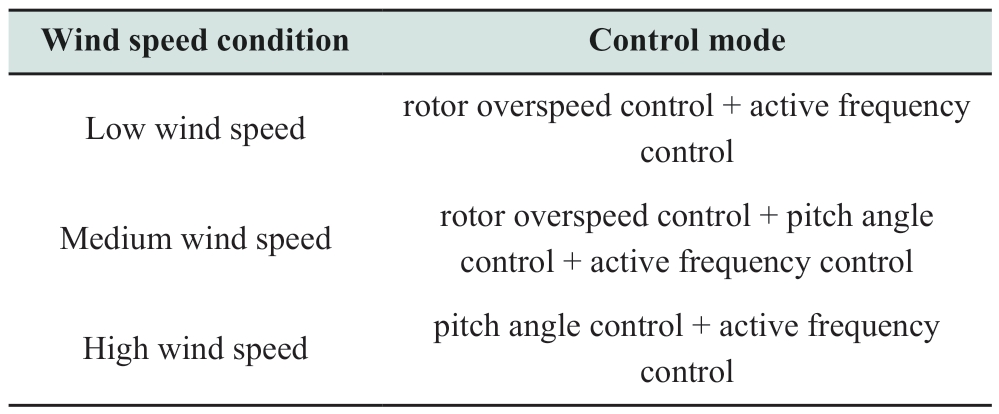
In this study, the wind farm frequency modulation control strategies were divided into frequency modulation control based on the power reserve, and rotor kinetic energy control.The control methods for wind turbines under different wind speed conditions are summarized in Table 1.speed conditions can be established based on the behavioral equations from Equations (1) - (7).This can be summarized by the following differential algebraic equations:
Table 1 Frequency modulation control strategy of wind turbine under different wind speed conditions

where Xw is the state variable of the fan system, Yw is the output variable of the fan system, Uw is the input variable of the fan system, A is the state transition matrix, B and D are the input matrices, and C is the output matrix.Equation (8)was linearized at the system equilibrium point to obtain a small-signal model of the wind turbine.It can be expressed as:

Based on the mathematical relationship between the state-space models, the transfer function between the input quantity Δfs and the output quantity ΔPw.e can then be obtained:

Therefore, the frequency response linearization model of the wind turbine under all operating conditions can be obtained as follows:
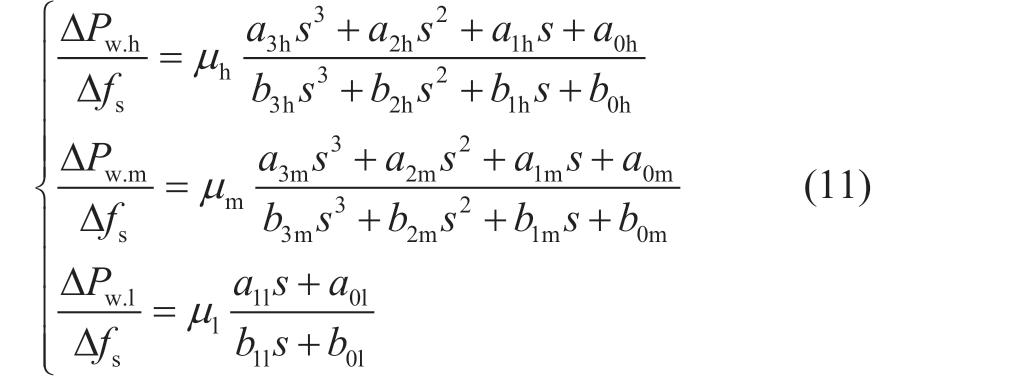
where ΔPw.h, ΔPw.m and ΔPw.l are the power deviations of the high, medium, and low wind-speed units, respectively;a3h ~ a0h and b3h ~ b0h are the coefficients of the numerator and denominator of the transfer function of the high wind-speed units, respectively; a3m ~ a0m and b3m ~ b0m are the coefficients of the numerator and denominator of the transfer function of the medium wind-speed units,respectively; a1l ~ a0l and b1l ~ b0l are the coefficients of the numerator and denominator of the low wind-speed unit transfer function, respectively; ΔPw is the power deviation of all wind turbines; and μh, μm and μl are the power proportions of the high, medium, and low wind speed units,respectively, defined as
1.3 Grid-connected offshore wind power system
For the DPMSG system frequency response model, the state-space model of the wind turbine under different wind

By combining the SFR model of the traditional power system, the frequency response model of the grid-connected offshore wind power system was obtained, as shown in Fig.3.
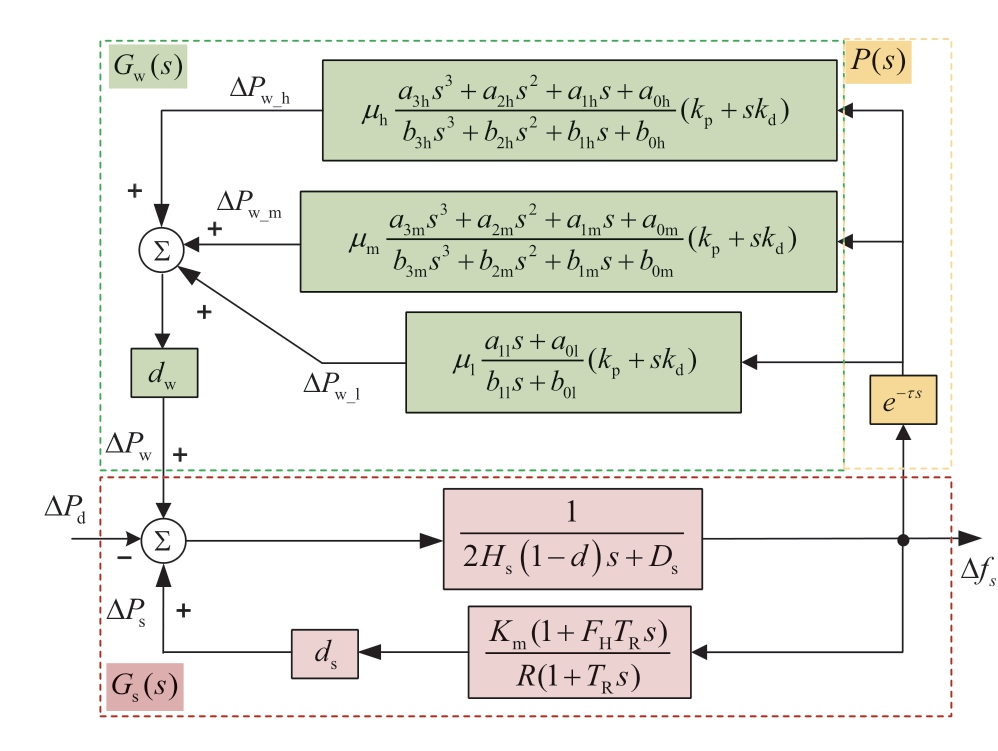
Fig.3 SFR model combined with grid-connected offshore wind power system
Gw(s) is the SFR model of the wind turbine, and Gs(s)is the SFR model of the traditional power system.dw and ds are the proportions of offshore wind power installed capacity Pwn and synchronous generator installed capacity PGn, respectively, and are defined as
1.4 SFR model combined with grid-connected offshore wind power system considering communication delay
As the onshore distance of offshore wind farms increases and a communication coordination control strategy is adopted, the communication time delay caused by the transmission of the land alternating current system to the offshore wind turbines gradually increases.The measurement, processing, transmission, and reprocessing of remote information cause communication delays in reaching the second level.For an alternating current system, the inertial response must act within a few hundred milliseconds, and a communication delay that is too large will affect the active frequency support of the offshore wind farm directly.
1) Measurement Time
This is the time required to measure the rate of frequency change and frequency deviation signals from the electrical grid.
2) Communication Time
This is the time needed to transmit the measured system frequency signals to the power control segment of the wind turbine unit’s rotor-side converter.
3) Response Time
This is the time it takes for the wind turbine units to receive the power conversion instruction and start responding [15].
There is a time lag of τ seconds in the system frequency measurement signal.The frequency measurement section in the SFR model in Fig.3 incorporates the additional time lag e-τs Rational functions are typically used to approximate the time-delay e-τs to analyze the dynamic characteristics of time-delay systems.This study used the Padé expressions for approximation [23], specifically,

where the Padé approximation formula varies with orders l and k, and the larger the value of l + k, the more accurate the approximation.When l = k = 2, a second-order Padé expression is obtained as follows:
We define the state variables x1 and x2, where y is the system output and u is the system input.The state-space expression is as follows:
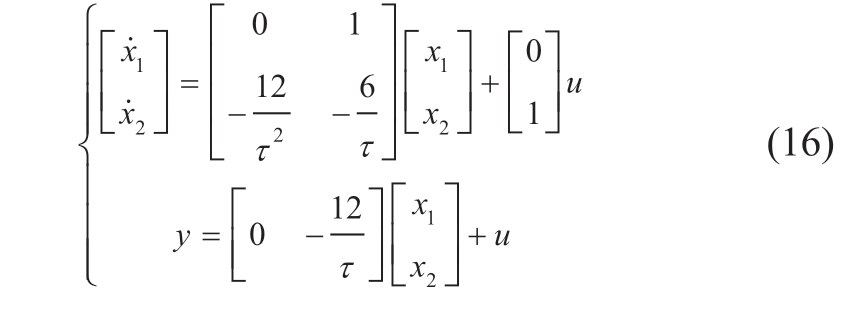
When integrating the DPMSG into the power grid and considering communication delays, the SFR model of the grid-connected offshore wind power system, as shown in Fig.3, is linearized at the system balance point.The smallsignal model of the entire system containing a DPMSG can be expressed in the form of the following differential algebraic equation:

where X is the state variable of the whole system; Y is the output variable of the whole system; U is the input variable of the whole system; A is the state matrix of the system, and the eigenvalues of A represents the oscillation modes of the power system.
2 Impact of delayed frequency support on frequency stability of power systems
2.1 Linearization of grid-connected offshore wind power system model
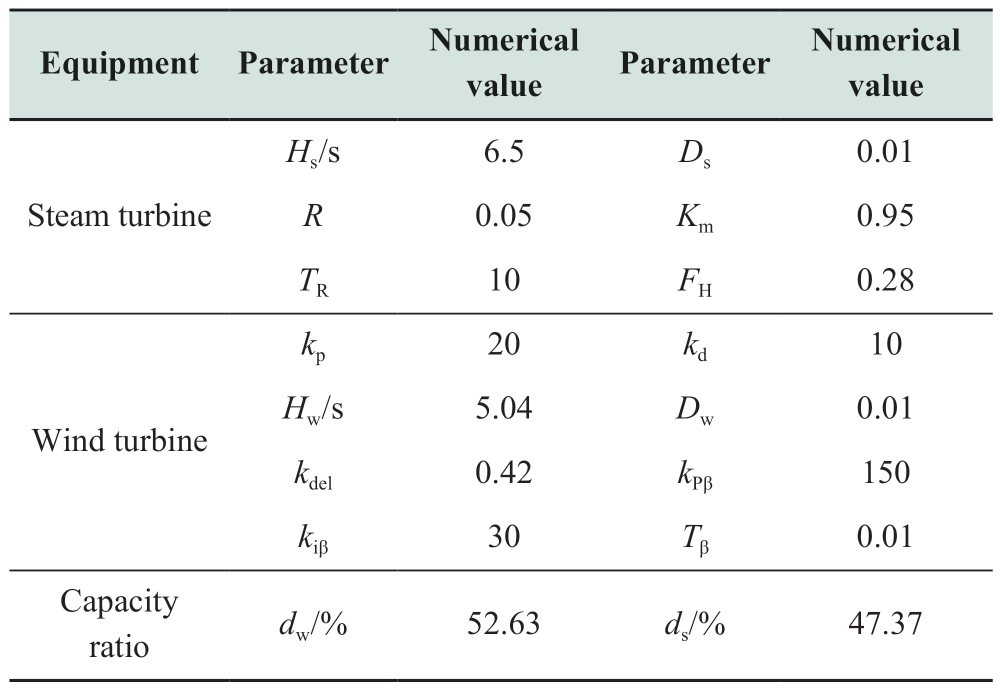
Considering the integration of offshore wind power into a regional grid as an example, as illustrated in Fig.4,Gs is the synchronous generator with an installed capacity of 900 MVA.The transformers at the generator end, T1,and at the wind farm, T2, both have voltage levels of 20 kV/230 kV and an installed capacity of 900 MVA.The active load,PL, is 854 MW.The disturbance load, ΔPL, is 70 MW.The synchronous generator, Gs, is located 80 km away from the disturbance load ΔPL.Meanwhile, the wind farm, Gw, is situated 10 km away from the disturbance load ΔPL.Line impedance, Zl = (2.88 + j9.90) × 10-3 Ω/km.The topological structure diagram of the wind farm is shown in Fig.5.WT1, WT2, and WT3 are wind farms under three different wind speed conditions, 9.76 m/s, 12.27 m/s and 19.59 m/s, respectively.The installed capacity of the wind farms is 200 × 1.5 MW, and each wind turbine operates at a 10% load reduction in the initial state.Boost transformers TW1, TW2, and TW3 correspond to low,medium, and high wind turbine units, respectively, with voltage levels of 575 V/20 kV and an installed capacity of 300 MVA.The impedances of the wind farms are respectively Z1l = (0.33 + j1.20) × 10-3 Ω, Z2l = (0.93 + j3.30) × 10-3 Ω,Z3l = (4.33 + j13.28) × 10-3 Ω.Additional system parameters are listed in Table 2.

Fig.4 Power system with offshore wind power
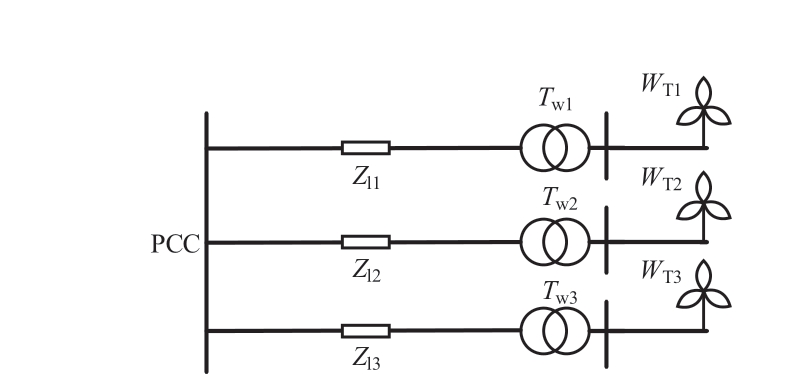
Fig.5 Topological structure diagram of wind farm
According to the frequency response model in Fig 3, the linearized equations of the system can be established based on Equation (17) by considering the impact of the timedelay component.The influence of the communication delayon the system frequency can be analyzed by substituting the parameters in Table 1, and the results are discussed below.
Table 2 System parameters of offshore wind power
2.2 Dynamic impact of communication delay on system frequency response
To assess the influence of communication delays on the system frequency stability, different time delays were set at 0, 0.5, 0.8, 0.85, 0.9, and 1.0 s.The eigenvalues of the frequency response model were computed as shown in Table 3.
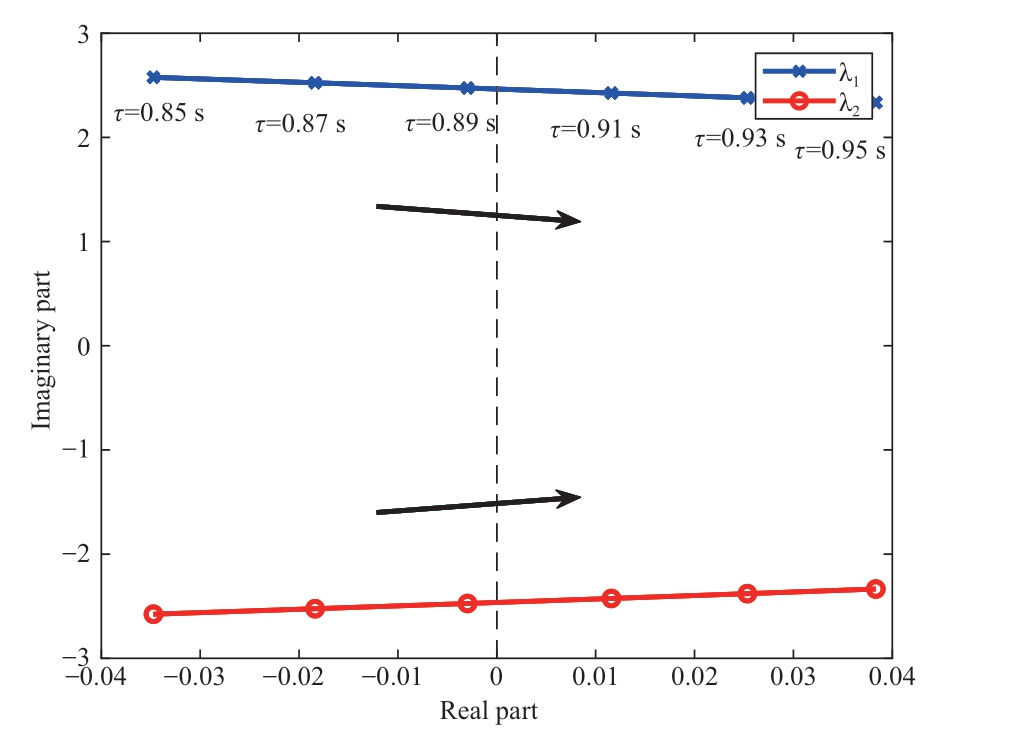
Fig.6 Eigenvalues λ1,2 with different delays
Table 3 indicates that different time delays have a significant impact on the eigenvalues λ1,2, while the influence on the other eigenvalues is relatively small.Fig.6 further illustrates the variation patterns of the real and imaginary parts of the eigenvalues λ1,2 under different delays.
From Table 3 and Fig.6, it is evident that:
1) When the system frequency measurement has no delay, i.e.τ = 0 s, the system state equation is of the 10th order, with the real parts of all eigenvalues being less than 0,indicating system stability.When the influence of the delay section is considered, the order of the system state equation increases to 12.
Table 3 Eigenvalues under different time delay
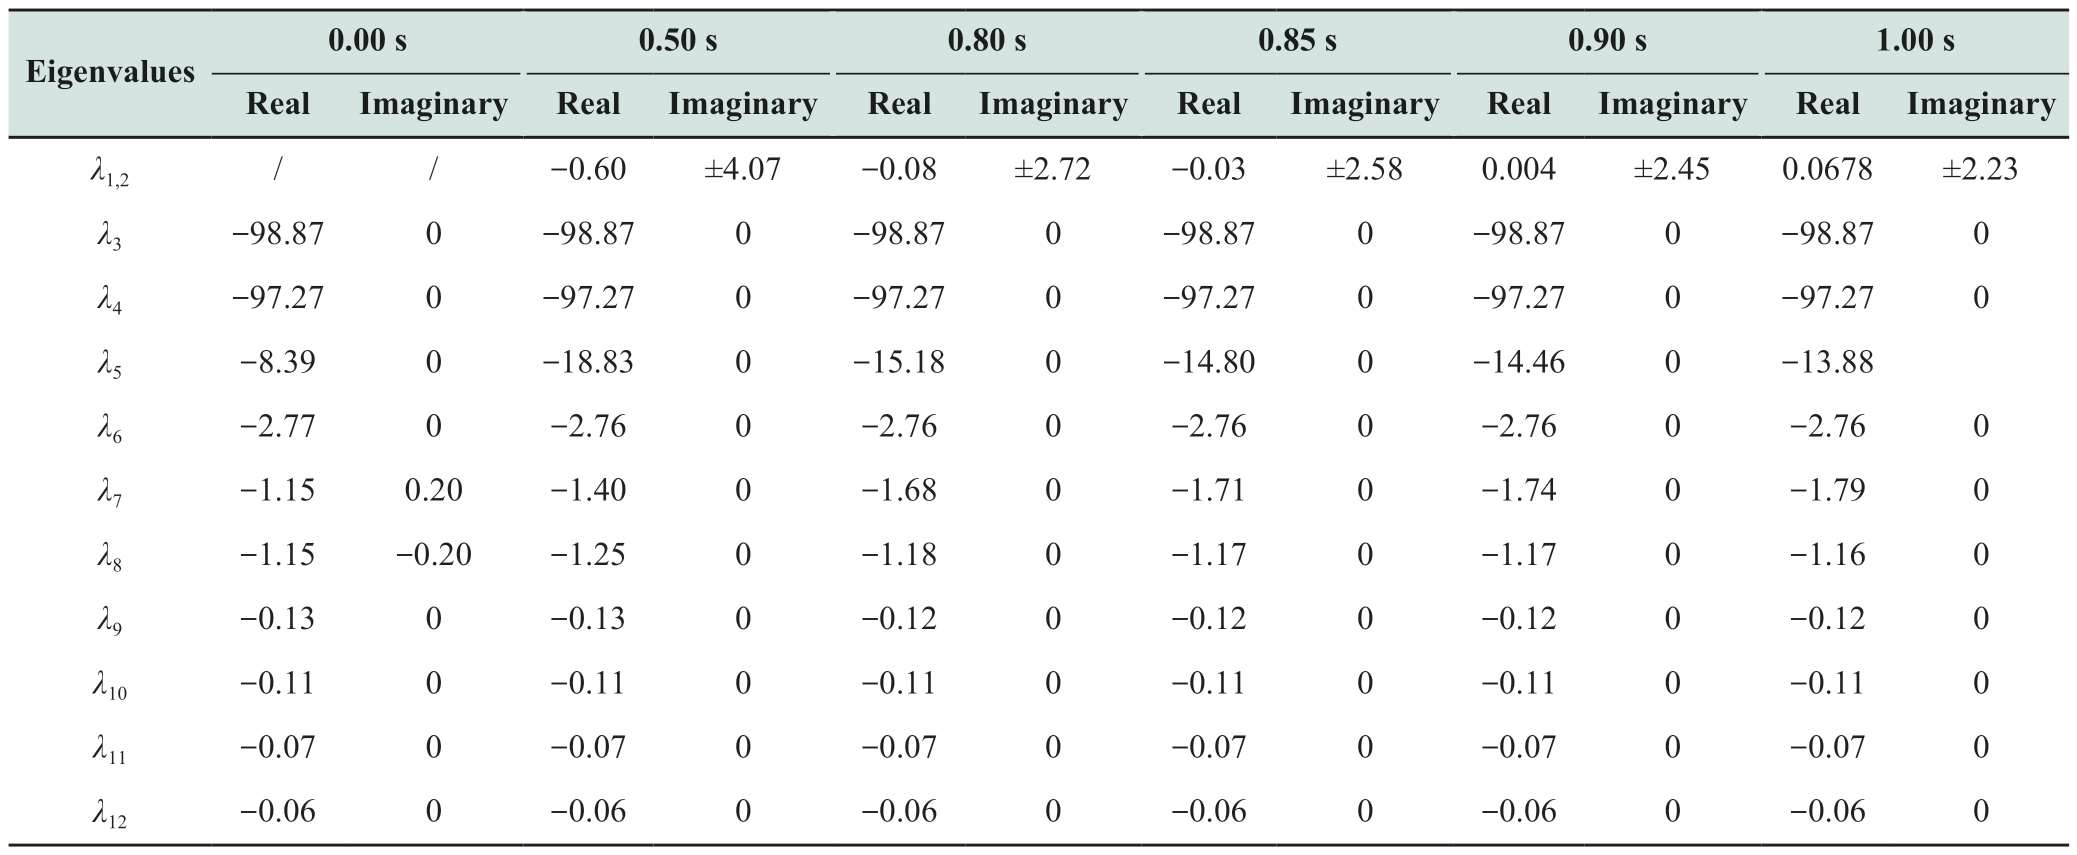
2) As the time delay gets gradually longer, the real parts of the eigenvalues λ1,2 increase, and the imaginary parts decrease.The unstable mode of the system is the oscillation mode, and measurement delay is the key factor that causes frequency instability in the system.
3) When τ = 0.89 s, the system is critically stable; further increasing the delay τ will lead to system instability.
To verify the accuracy of the λ1,2 eigenvalue results, a disturbance was introduced into the system at t = 1 s to the system in Fig.4.A 70 MW active load was added to Node 3, and the time lag τ was set to 0, 0.5, 0.8, 0.89, and 0.9 s,respectively.The system frequency-response trajectory is shown in Fig.7.
The frequency response result of the system aligned with
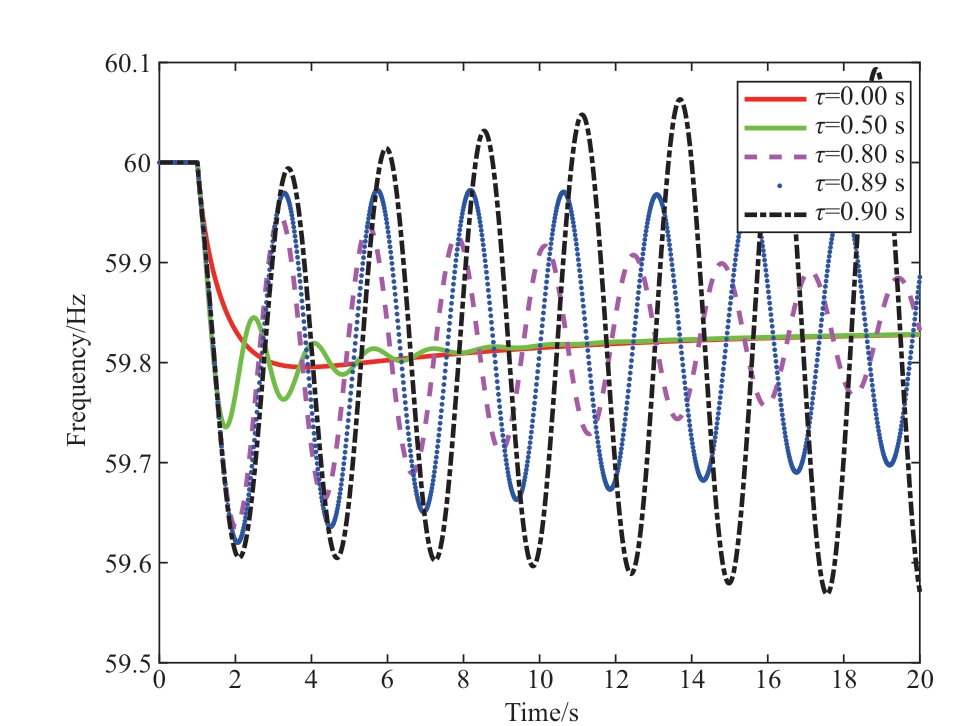
Fig.7 System frequency responses under different delay
the eigenvalue result.When the delay τ < 0.89 s, the system is stable, and when τ > 0.89 s, the system becomes unstable.As the time lag increases, the fluctuation amplitude of the disturbed trajectory also increases.
2.3 Key factors affecting system stability considering time delay
With a fixed delay of 0.89 s, the impact of the wind power installed capacity and different frequency modulation parameters on the frequency stability of the system were analyzed.1) Proportion of installed wind power In the scenario described above, the installed capacity of the offshore wind power was 1000 MVA, and the synchronous generator’s installed capacity remained at 900 MVA.By modifying the rated installed capacity of wind power (while keeping the installed capacity of the synchronous generator constant), the variations in the eigenvalues λ1,2 under different proportions of wind power dw were then analyzed and are presented in Table 4.This table shows that when the proportion of wind power installed capacity increases, the real part of the eigenvalues λ1,2 gradually increase, signifying a transition of the system from a stable to an unstable mode.Hence, the proportion of installed wind power capacity has a significant impact on the system stability.Specifically, a higher proportion reduced the system stability.2) Frequency modulation parameters of different wind turbines In the given computational instance, the frequency regulation parameters for the wind turbine were kp = 20 and kd = 10.The subsequent analysis was continued usingthe system parameters listed in Table 2 as a reference.The fluctuation pattern of the system’s eigenvalues λ1,2 under distinct frequency modulation parameters is examined, as depicted in Fig.8.The arrow in the figure illustrates the direction of increasing time delay (τ).
Table 4 Eigenvalues λ1,2 under different wind power ratio

As illustrated in Fig.8:
1) In the presence of a frequency measurement delay,an increased proportional coefficient kp in the droop control(with kd held constant) is less beneficial for the stability of the system.The underlying reason for this is that an increase in the proportional gain coefficient kp results in a higher supplied active power, leading to greater absorption of the rotor kinetic energy.In turn, this is detrimental to system stability.
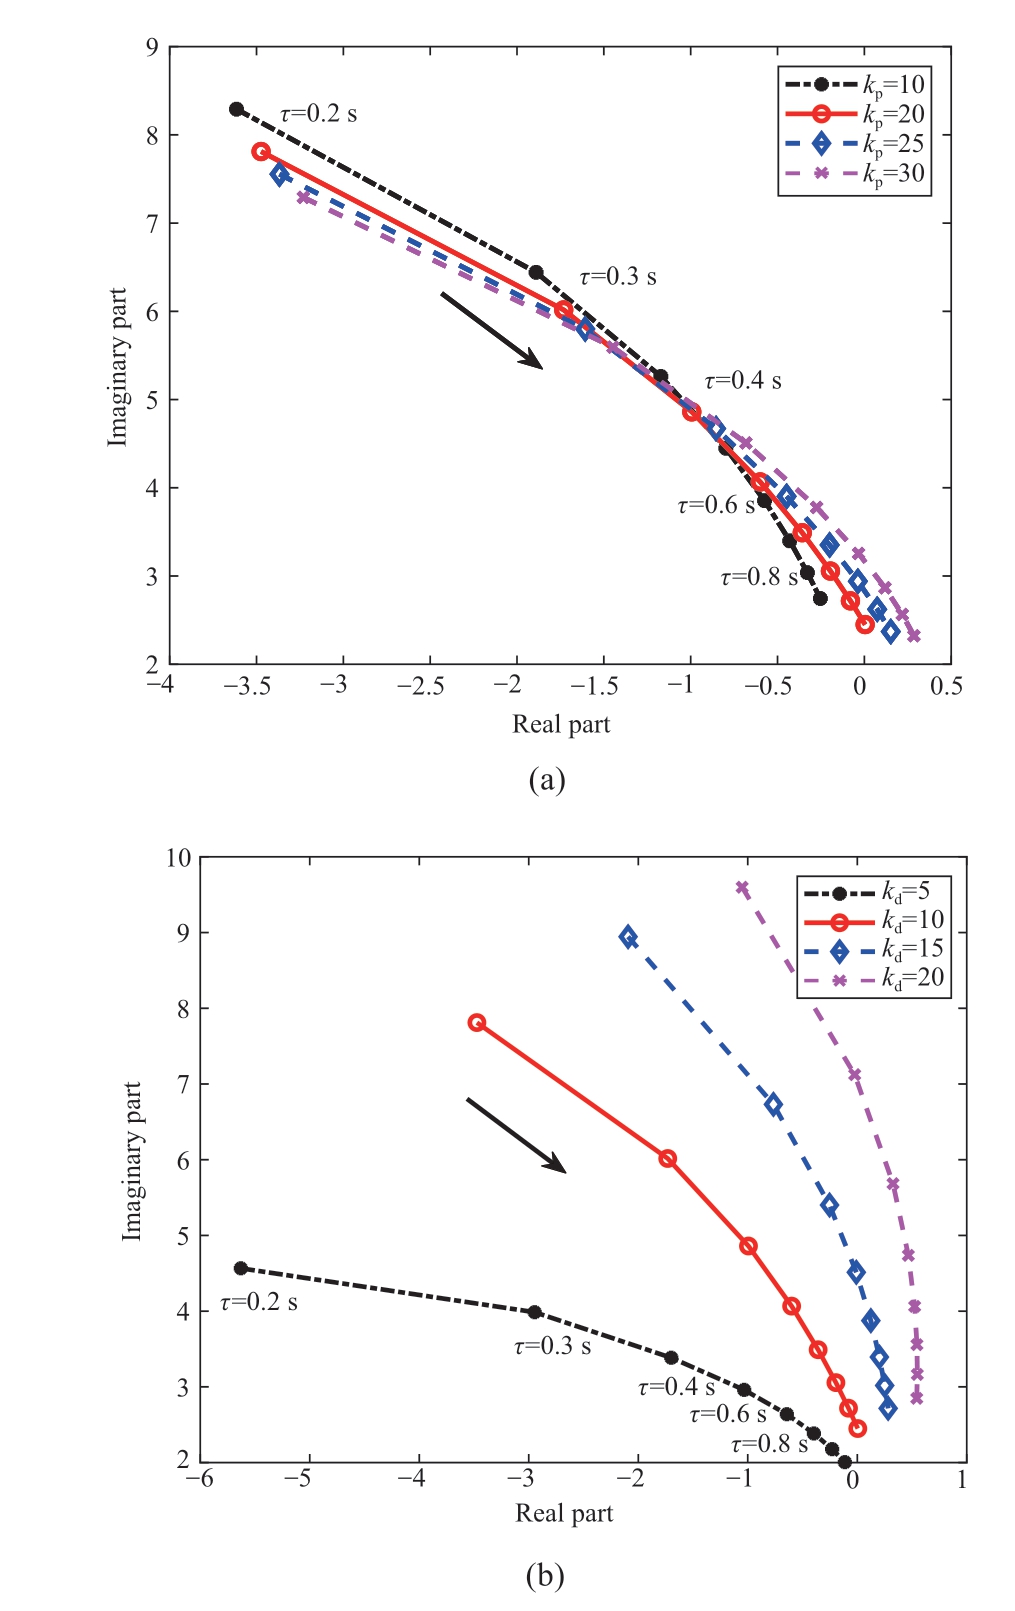
Fig.8 Effects of frequency regulation parameters on the main eigenvalues: (a) kp; (b) kd
2) The impact of the virtual inertia time constant kd (kp remains constant) on the frequency stability of the system is not solely dependent on the size of its own parameters but is also influenced by the length of the delay; when kd is low (less than 10 in the example), the longer the delay,the worse the stability of the system.However, when kd is high (greater than 10 in the example), the stable state of the system changes more slowly with the variation in the delay.This is because when kd is low, a longer delay leads to a slower system frequency support, making the system more unstable.However, if kd is high and causes inherent instability of the system, a longer delay indicates a later control that leads to instability, making it more difficult for the system to change its unstable state.
3 Design of delay compensation control strategy
From the above analysis, we can conclude that communication delays significantly impact the frequency regulation performance of wind turbines and may even lead to frequency instability in the system.To address the instability issue caused by communication delays, a delay compensation control strategy is proposed to enhance the frequency modulation performance of offshore wind turbines and improve the overall frequency stability of the system.
3.1 Smith delay compensation control strategy
The distance between the offshore wind farm and onshore concentration center remained constant, and the variation in distance caused by the unit distribution was generally negligible.Consequently, the communication delay in frequency measurement can be determined more accurately.In systems with a more precise delay prediction,using the Smith prediction method for delay compensation can yield more effective control outcomes.
The basic principle of Smith’s estimation method is to use parallel compensation links such that the characteristic equation no longer contains a delay term, thereby improving the stability and dynamic performance of the system.The corresponding Smith estimation compensation circuit for the SFR model in Fig.3 is shown in Fig.9, where the parameter τd is the estimated communication delay.
Fig.9 shows a schematic of the delay compensation control strategy incorporating the Smith controller, where the blue section represents the parallel delay compensation control loop.This control loop takes the active power output

Fig.9 Primary frequency control with Smith predictor control
of the wind turbine generators under different wind speed conditions as the input and performs a feedback adjustment based on the original setup of the wind turbine generators.The output signal from the parallel loop, combined with the delayed signal from the system, collectively served as the input signal for the wind turbine generators.The control loop includes the traditional power system frequency response model transfer function Gs(s) and the compensation item for the estimated communication delay(1 - e-τd s).From this figure, the following can be inferred:

From Equation (18), it is evident that if the communication delay can be predicted precisely, i.e., τd = τ,the denominator of the system transfer function no longer contains the delay term.Consequently, the characteristic equation becomes 1 + Gs(s) Gw(s) = 0, and the system stability becomes independent of the communication delay.
3.2 Simulation
For the simulation analysis, the system shown in Fig.4 was used, and a Smith delay compensation loop was introduced.It is assumed that the system delay can be accurately estimated using τd = τ.A disturbance was applied by adding a 70 MW active load to node 3 at t = 1 s.The frequency-response trajectories of the system for different time delays are shown in Fig.10.
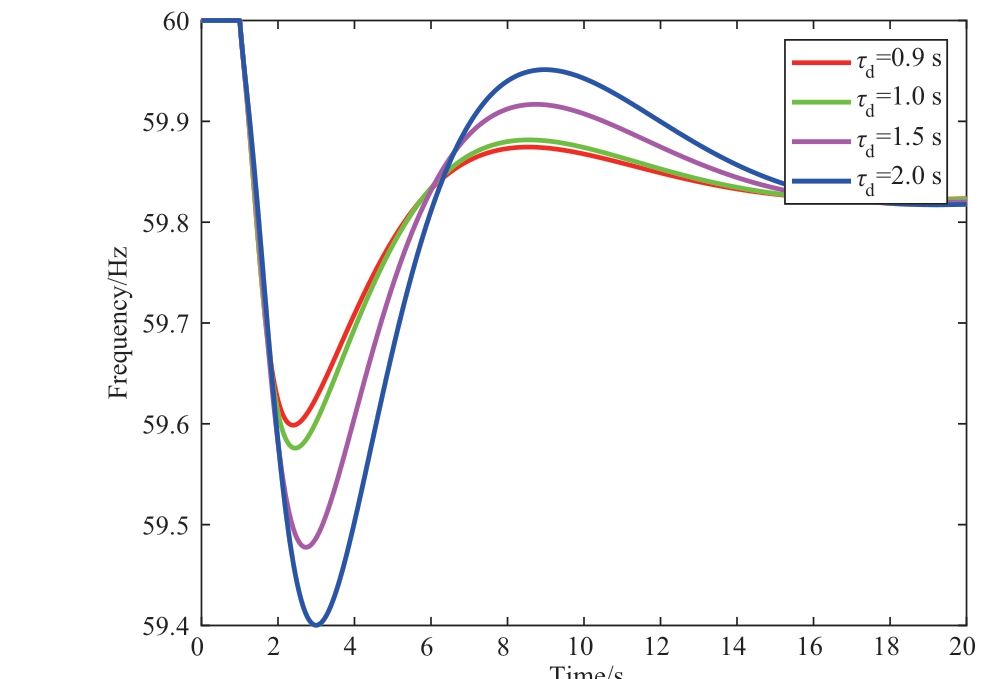
Fig.10 The system frequency responses with Smith delay predictor control
From Fig.7, it can be observed that the original system becomes unstable when the delay > 0.89 s following a disturbance.However, it can be seen from Fig.10 that with the introduction of a delay compensation control loop, the system remained stable even with delays of 0.9, 1.0, 1.5,and 2.0 s.This demonstrates the feasibility and effectiveness of the proposed delay compensation control strategy.
3.3 The influence of delay prediction error
The Smith predictive controller is well-suited for scenarios with accurate delay predictions.Given the distribution characteristics of offshore wind turbines, the actual distance between each turbine and the offshore concentration center varied to some extent.The subsequent analysis delves into the repercussions of delay-prediction errors.
Taking the system depicted in Fig.4 with a time delay of 1 s as an example, and assume that the time delay prediction error range is ±20% due to the distribution characteristics of the units.The intervals are therefore 0.8, 0.9, 1.0, 1.1, 1.2 s, respectively.The eigenvalues of the system are listed in Table 5, and the frequency response of the system under the same load disturbance is shown in Fig.11.
Table 5 Prediction errors of four models
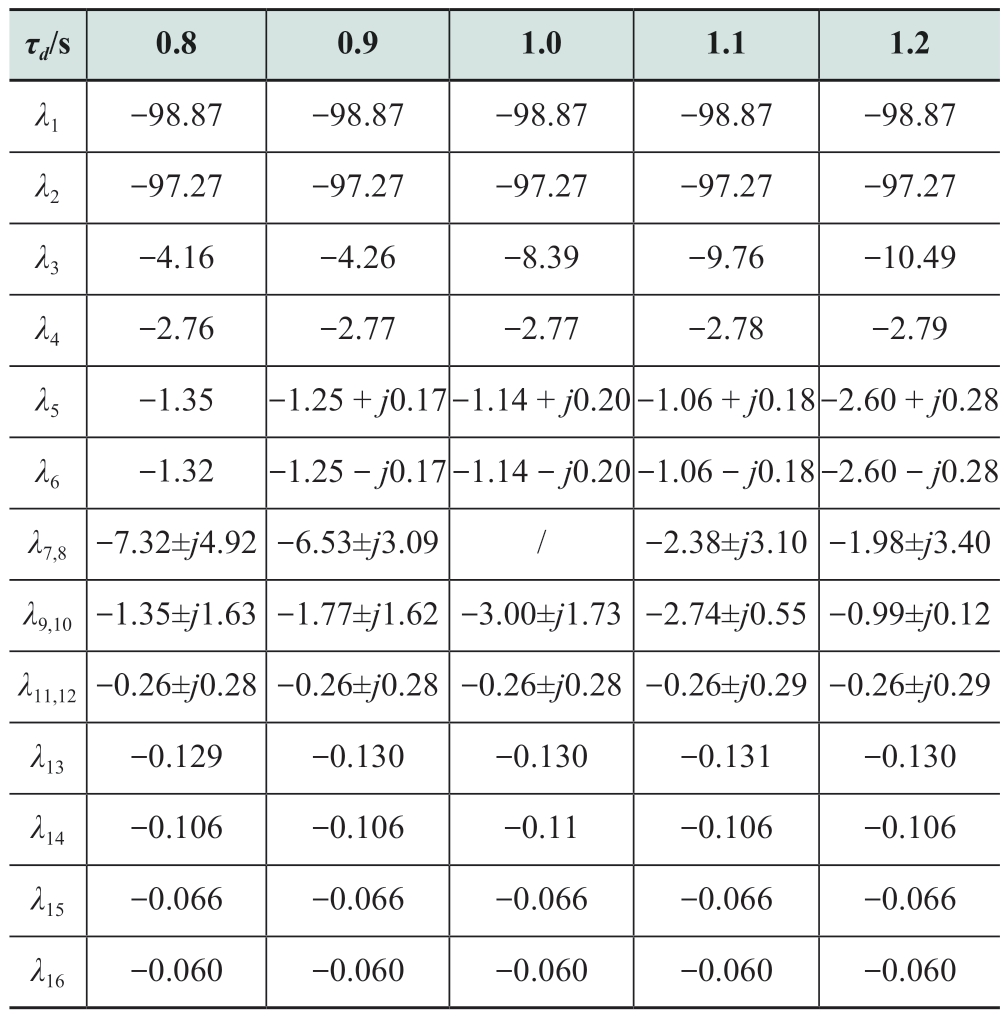
Table 5 and Fig.11 show that different delay prediction errors influence the eigenvalues λ5,6, λ7,8, and λ9,10 differently.The impact of the delay prediction error was within 20%,and the system maintained good stability.This demonstrates that the proposed Smith delay compensation control strategy exhibits strong adaptability and robustness.
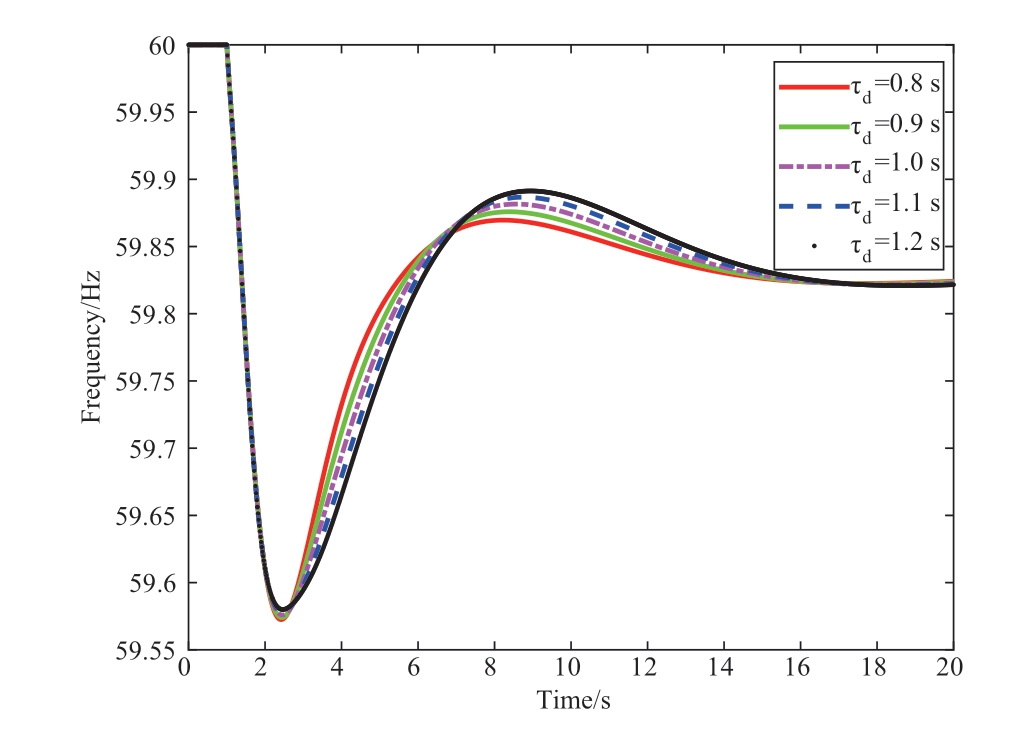
Fig.11 System frequency responses considering the timedelay prediction error
3.4 Influence of system parameter delay compensation control strategy
In Section 3.3, the impact of the installed wind turbine ratio and frequency modulation parameters on the stability of the delay system is discussed.To ensure the frequency regulation capability of the wind turbines and enhance the disturbance resistance of the grid-connected wind power system, this section will continue to study the impact of these parameters on the frequency stability of the system after the delay compensation control strategy.
Let the delay coefficient be fixed as τ = 1.0 s, and assume that the delay compensation can almost predict the signal transmission delay, that is, the delay compensation control coefficient is fixed as τd = 1.01 s.
1) Proportion of installed wind power
By adjusting the installed capacity of wind power(while keeping the rated capacity of synchronous generators constant), the variation law of eigenvalues λ1.2 under different installed ratios of wind power dw was analyzed, as shown in Table 6.
Table 6 Eigenvalues under different ratios of wind power

Table 6 shows part of the system eigenvalues of the grid-connected offshore wind power system under different wind power ratios after time delay compensation, and Fig.12 shows the trajectory diagram of its eigenvalues.The table and diagram show that the system eigenvalues of the system after time delay compensation are all located in the left half of the complex plane for different wind power ratios, which indicates that the system is stable for small disturbances.Comparing it with Table 4, the system after the delay compensation control strategy is more stable for small disturbances than the original system.
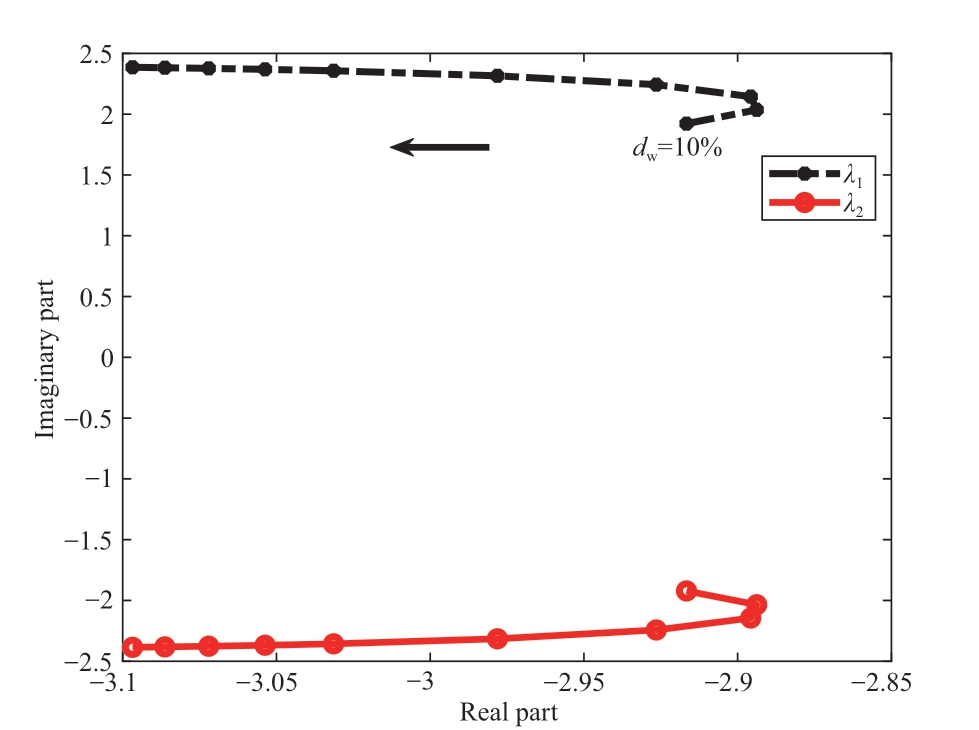
Fig.12 Trajectory diagram of eigenvalues λ1.2 under different ratios of wind power
2) Frequency modulation parameters of wind turbines
To analyze the impact of the droop control coefficient kp and virtual inertia control coefficient kd on the stability of the system with the time delay compensation control strategy, the variation law of eigenvalues λ1.2 under different frequency modulation parameters is obtained by changing the droop control coefficient kp and virtual inertia control coefficient kd constantly.
First, we kept the virtual inertia control coefficient kd =10 and continuously changed the droop control coefficient kp to obtain the data shown in Table 7.
Table 7 Eigenvalues under different droop control coefficient
Table 7 shows part of the system eigenvalues of the gridconnected offshore wind power system with fixed virtual inertia control coefficient under different droop control coefficients after time delay compensation, and Fig.13 shows the trajectory diagram of its eigenvalues.The table and diagram show that the system eigenvalues of the system after time delay compensation under different droop control coefficients are all located in the left half of the complex plane.This indicates that the system is stable for small disturbances.Comparing it with Fig.8(a), the system after the delay compensation control strategy is more stable for small disturbances than the original system, and the droop control frequency modulation strategy of the system returns to normal.
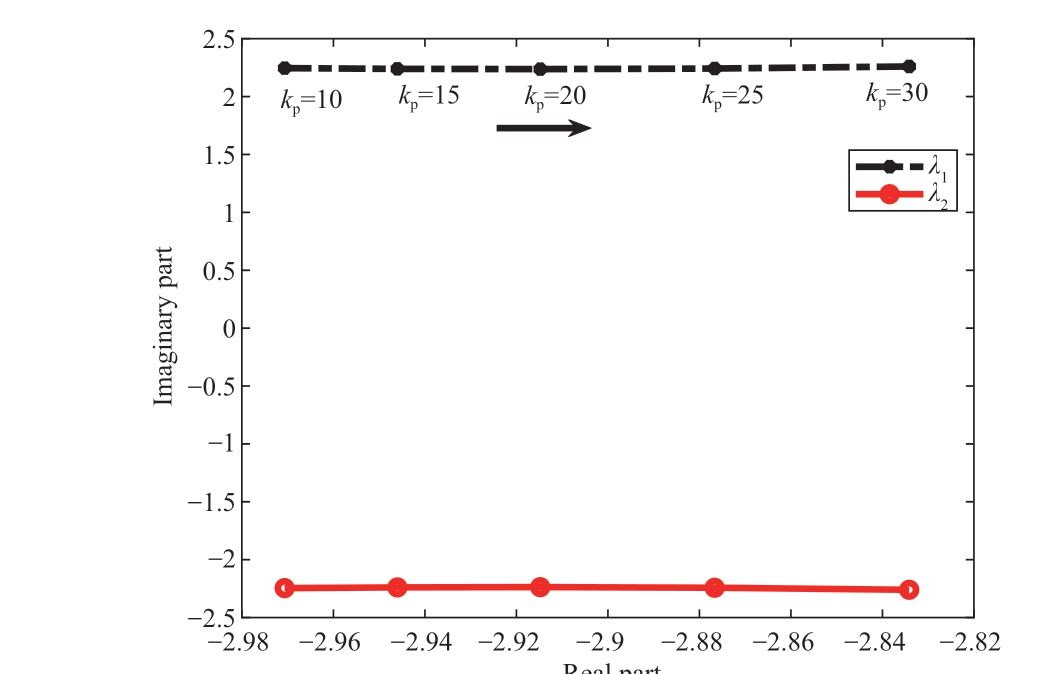
Fig.13 Trajectory diagram of eigenvalues λ1.2 under different droop control coefficient
Second, the data shown in Table 8 are obtained by keeping the droop control coefficient kp = 10, and continuously changing the virtual inertia control coefficient kd.
Table 8 Eigenvalues under different virtual inertia control coefficient
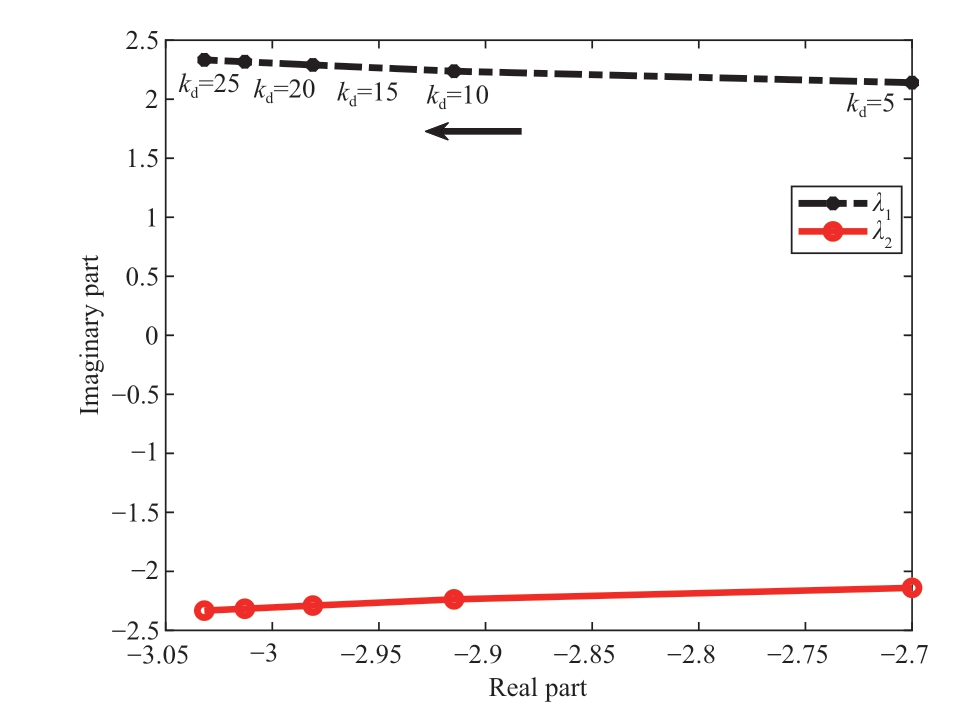
Fig.14 Trajectory diagram of Eigenvalues λ1.2 under different virtual inertia control coefficient
Table 8 shows some of the system eigenvalues of the grid-connected offshore wind power system under different virtual inertia control coefficients with fixed droop control coefficients after time delay compensation, and Fig.14 is the trajectory diagram of its eigenvalues.The table and diagram show that the system eigenvalues of the system after time delay compensation are all located in the left half of the complex plane under different virtual inertia control coefficients.This indicates that the system is stable for small disturbances.Comparing it with Fig.8(b), the system after the delay compensation control strategy is more stable for small disturbances than the original system, and the virtual inertia control strategy of the system returns to normal.
4 Conclusions
To address the issue of time delays in measurement signals arising from the considerable distance between deep-sea wind farms and onshore centralized control centers, this study initially formulated a frequency response model for a power system with delays introduced by the primary frequency regulation in offshore wind turbines.By using the Padé approximation to represent the delay section, we derived a linearized model for a grid-connected offshore wind-power system.The stability of the frequency response model of the system was then analyzed under different time-delay conditions.These findings indicate that as the communication delay increases, it has a more adverse impact on the stability of the system.Furthermore,the influence of the installed wind power capacity and frequency modulation parameters on the frequency stability of the system in the presence of communication delays was analyzed.It was found that a higher proportion of installed wind power capacity and droop control proportional coefficient were more detrimental to the system stability.The stability impact of the virtual inertia time constant on the system not only relies on the time constant but is also intricately linked to the length of the time delay.
This study proposes a Smith delay compensation control strategy to enhance the stability of a grid-connected offshore wind power system.Simulation results indicate that this control strategy significantly improves the stability of the system under a measurement signal delay.In future, more work will be dedicated to improving the control strategy by considering cases in which the mathematical model of the grid-connected offshore wind power system is inaccurate.
Acknowledgments
We gratefully acknowledge the support of the National Natural Science Foundation of China (52077061) and Fundamental Research Funds for the Central Universities(B240201121).
Declaration of Competing Interest
We declare that we have no conflict of interest.
References
[1]Li L M (2022) Offshore wind is expected to ride the wave.In: China Energy News.http://paper.people.com.cn/zgnyb /html/2022-06/13/content _25923292.htm.Accessed 13 Jun 1999.(in Chinese)
[2]Wen W, Zhao Z, Li M, et al.(2023) Design and engineering application of offshore wind power VSC-HVDC System.Journal of Global Energy Interconnection, 6(01): 1-9 (in Chinese)
[3]Zhou D Z, Yi W, Huang G Y (2020) Analysis of the current situation and trends of communication technology in offshore wind farm industry.Digitcw, 11: 112-114 (in Chinese)
[4]Zhang X, Li M, Guo Z, et al.(2021) Review and perspectives on control strategies for renewable energy grid-connected inverters.Global Energy Interconnection, 4(05): 506-515
[5]Du W, Mei G, Ma M, et al.(2023) Reactive power configuration method of offshore wind farm considering over voltage and harmonic resonance.Journal of Global Energy Interconnection,6(06): 599-607 (in Chinese)
[6]National Standardization Administration (2021) Guide for technology and test on primary frequency control of gridconnected power resource: GB/ 40595-2021.Beijing: Standards Press of China
[7]Zhang Z Y, Zhang N, Du E S, et al.(2022) Review and countermeasures on frequency security issues of power systems with high shares of renewables and power electronics.Proceedings of the CSEE, 42(1):1-25 (in Chinese)
[8]Gao B T, Hu Z Y, Wang W S, et al.(2023) Review on fast active power control and frequency support technologies of renewable energy stations.Proceedings of the CSEE (in Chinese)
[9]Liu Z J, Zhou M, Li Z H, et al.(2021) Review of inertia control technology and requirement evaluation in renewable-dominant power system.Electric Power Automation Equipment.41(12):1-11+53 (in Chinese)
[10]Tao J, Gao H S, Xin H H, et al.(2023) Analysis and control design of inertia and damping of VSG considering frequency modal characteristics.Electric Power Automation Equipment,43(9): 18-26 (in Chinese)
[11]Vidyanandan K V, Senroy N (2013) Primary frequency regulation by deloaded wind turbines using variable droop.IEEE Transactions on Power Systems, 28(2): 837-846
[12]Peng H, He S, Yuan Z, et al.(2023) Primary frequency regulation strategy for variable-speed wind turbines based on improved coordinated control of rotor speed and pitch angle.Electric Power Automation Equipment.43(9): 87-94 (in Chinese)
[13]Yao W, Xiong Y, Yao Y, et al.(2021) Review of voltage source converter-based high voltage direct current integrated offshore wind farm on providing frequency support control.High Voltage Technology, 47(10): 3397-3413 (in Chinese)
[14]Lu G, Lin C, Wu Y(2021) Comparison of communication-based and coordination-based frequency control schemes for HVDC connected offshore wind farms.IEEE Transactions on Industry Applications, 57(4): 3352-3365
[15]Zhang F, Tian Y, Ding L (2023) Analytical solution for influential mechanism model of virtual inertia delay of wind power and its substitutability research.Automation of Electric Power Systems (in Chinese)
[16]Zhang C K, Jiang L, Wu Q H, et al.(2013) Delay-dependent robust load frequency control for time delay power systems.IEEE Transactions on Power Systems, 28(3): 2192-2201
[17]Liu S C, Wang X Y, Liu P X (2015) Impact of communication delays on secondary frequency control in an islanded microgrid.IEEE Transactions on Industrial Electronics, 62(4): 2021-2031
[18]Anderson P M, Mirheydar M (1990) A low-order system frequency response model.IEEE Transactions on Power Systems,5(3): 720-729
[19]Zhang Z S, Sun Y Z, Li G J, et al.(2011) Frequency regulation by doubly fed induction generator wind turbines based on coordinated overspeed control and pitch control.Automation of Electric Power Systems, 35 (17): 20-25 (in Chinese)
[20]Wang G, Shi Q M, Cui Z Y, et al.(2015) A coordination method between wind turbine virtual inertia control and traditional generator speed control.Power Grid Technology, 39(10): 2794-2801.(in Chinese)
[21]Krpan M, Kuzle I (2018) Introducing low -order system frequency response modelling of a future power system with high penetration of wind power plants with frequency support capabilities.IET Renewable Power Generation, 12(13): 1453-1461
[22]Morren J, De H S, Kling W L, et al.(2006) Wind turbines emulating inertia and supporting primary frequency control.IEEE Transactions on Power Systems, 21(1): 433-434
[23]Wu H X, Ni H, Heydt G T (2002) The impact of time delay on robust control design in power systems.2002 IEEE Power Engineering Society Winter Meeting.Conference Proceedings(Cat.No.02CH37309).New York, NY, USA.IEEE,: 1511-1516

Scan for more details
Received: 2 February 2024/Revised: 17 April 2024/Accepted: 6 May 2024/Published: 25 June 2024
Jinpeng Guo
jinpeng.guo@hhu.edu.cn
Xueping Pan
xueping_pan@163.com
Qijie Xu
211306080039@hhu.edu.cn
Tao Xu
231606030063@hhu.edu.cn
Xiaorong Sun
xsun@hhu.edu.cn
Yuquan Chen
20200068@hhu.edu.cn
Qiang Li
35830342@qq.com
Wei Liang
wliang1988@163.com
2096-5117/© 2024 Global Energy Interconnection Group Co.Ltd.Production and hosting by Elsevier B.V.on behalf of KeAi Communications Co., Ltd.This is an open access article under the CC BY-NC-ND license (http: //creativecommons.org/licenses/by-nc-nd/4.0/ ).
Biographies

Xueping Pan received the B.E and M.S.degrees in electrical engineering from Hohai University, Nanjing, China, in 1994 and 2000,respectively, and the Ph.D.degree in electrical engineering from Zhejiang University,Hangzhou, China, in 2008.He was a Visiting Scholar with Washington State University,Pullman, WA, USA, from 2009 to 2010.She is currently a Professor with the School of Electrical and Power Engineering, Hohai University, Nanjing, China.Her research interests include modelling and analysis of power systems with a high share of renewable energy.

Qijie Xu received the B.E.degree in Electrical Engineering and Automatization from Hohai University, Nanjing, China, in 2021.He is currently working toward the master degree in the School of Electrical and Power Engineering, Hohai University, Nanjing,China.His research interest is frequency stability analysis of power systems.
Yuquan Chen received the B.E.degree in automation and the Ph.D.degree in control science and engineering from the University of Science and Technology of China, Hefei,China, in 2014 and 2020, respectively.He has been a faculty of the College of Artificial Intelligence and Automation, Hohai University, Nanjing, China, since 2020.His current research interests include fractional-order optimization,power system control, and reinforcement learning algorithms.


Tao Xu received the B.E.degree in Electrical Engineering and Automatization from Hohai University, Nanjing, China, in 2023.He is currently working toward the master degree in the School of Electrical and Power Engineering, Hohai University, Nanjing,China.His research interest is frequency stability analysis of power systems.

Jinpeng Guo received the B.S.degree from Chongqing University, Chongqing, China,in 2014, the M.S.degree from Southeast University, Nanjing, China, in 2017 and the Ph.D.degree from McGill University,Montreal, QC, Canada, in 2022.He is currently working in the Shool of Electrical and Power Engineering, Hohai University, Nanjing,China.His research interests include power system monitoring,analysis and control.

Xiaorong Sun received the B.S.degrees from Hohai University, Nanjing, China, in 2010, and the M.S.and Ph.D.degrees from University of Connecticut, CT, USA, in 2014 and 2019, respectively.She is working in Shool of Electrical and Power Engineering,Hohai University, Nanjing, China.Before joining Hohai University, she was a Power System Engineer responsible for Market Clearing Engines at GE Renewable Energy, Redmond, WA, USA,from 2017 to 2020.Her research interest is on power system lowcarbon planning and operation.

Qiang Li received the B.E., M.E.and Ph.D.degrees in Electrical Engineering from Hohai University, Nanjing, China, in 2003, 2006 and 2010, respectively.He is currently a professor of engineering with State Grid Jiangsu Electric Power Research Institute, Nanjing, China.His main research interests are grid-integration of renewable power, application of energy storage in power system.

Wei Liang received the Master’s degree from Hohai University, Nanjing, China, in 2014.He is currently working toward the Ph.D.degree in the School of Electrical and Power Engineering, Hohai University, Nanjing,China.He is also serving as the deputy director of Digital Technology Department of State Grid Jiangsu Electric Power Electric Power Co., Ltd., Nanjing, China.His research interests include modeling of renewable energy system application of artificial intelligence techniques in power systems.
(Editor Yanbo Wang)
