0 Introduction
Advancement in sensing and communication technologies has catalyzed the transformation of conventional power system networks into intelligent smart grid infrastructures.Vibration,which is prevalent in power equipment,poses challenges to the security of components within the smart grid infrastructure.To ensure the reliability of a power system,real-time monitoring technology must be adopted for the consistent acquisition of the operational status and to aid the analysis of the system’s dynamic attributes [1].Vibration-testing technology,which is a pivotal aspect in detection methodologies,is widely applicable in domains such as fault diagnosis,dynamic response testing,quality inspection,and other equipment-related fields within the power system context [2-4].Vibration-measuring technology can be categorized into contact and non-contact types based on the interaction between the measurement equipment and the target being measured.Specifically,contact vibration measurements require the placement of physical sensors on the equipment surface,whereas noncontact vibration measurements are particularly suitable for scenarios involving inaccessible rotating or high-voltage equipment[5-7].Certain vibration systems exhibit intricate structures and pose challenges in achieving precise localization.By contrast,vibration visualization technology is inherently intuitive and comprehensible,which facilitates the rapid identification of vibration locations and other attributes;thus,it has garnered increasing interest from researchers investigating vibration signals [8].
Currently,the prevalent noncontact vibration measurement techniques primarily leverage the processing of light,electromagnetic signals,sound,and visual signals.Examples include laser Doppler,eddy current,ultrasonic,and machine-vision measurements [9-11].Notably,laser Doppler measurements yield high-precision vibration measurements;however,they present limitations in complex structures,extensive multipoint measurements,and specific environmental conditions [12].Meanwhile,the sensitivity of the eddy current measurement method varies depending on the material used,thus yielding distinct outcomes.Additionally,this method necessitates close proximity to the measured object,thus rendering the measurement of longdistance vibration signals challenging [13].
Machine-vision technology primarily employs optical imaging components to capture image stream data,thus offering the potential for high-precision real-time surface measurements and vibration visualization.This technology has recently garnered considerable attention,and researchers worldwide have achieved significant progress in extracting vibration signals using machine-vision methodologies.Wang et al.[14] established a measurement platform using a high-speed camera.The area of interest was marked on the closing spring of a high-voltage circuit breaker,and grayscale techniques were used to measure the dynamic vibration characteristics of the spring.Similarly,Fka [15]utilized an ultra-high-speed camera (Photron) to scrutinize vibrations resulting from friction in stern shaft rubber bearings;however,the testing equipment used incurred high costs.Aoyama [16] employed a monocular camera to select multiple points of interest in bridge structures manually.This approach involved periodic image capture and the subsequent analysis of sequential interest-point images.Consequently,an effective equilibrium was attained between economic considerations within low-frequency vibration scene measurements and the requirements for multipoint vibration analysis.When processing high-framerate video data generated by Charge Coupled Device (CCD)and Complementary Metal Oxide Semiconductor (CMOS)cameras,the methods above typically involve the use of measurement calibration points and regions to mitigate the computational burden of image processing.However,this practice does not fully capitalize on the surface measurement advantages of the machine-vision approach.Furthermore,disparities in calibration techniques across distinct types of mechanical equipment limit its generalizability across engineering applications [17].
To address the aforementioned limitations of conventional machine-vision approaches,the event-sensing principle was introduced,where the style="font-size: 1em; text-align: justify; text-indent: 2em; line-height: 1.8em; margin: 0.5em 0em;">Hence,the present study analyzes the event-sensor mechanism for translating vibration signals into event flows.Additionally,it introduces a visual algorithm designed to transform vibration events into vibration displacement-time relationships.Subsequently,this algorithm is integrated with a vibration measurement test platform to assess the viability and efficacy of extracting vibration signals from power equipment,such as vibration motors.The research findings presented herein serve as valuable reference for the advancement and practical implementation of vibration-measurement technologies based on the event-sensing principle.
1 Vibration measurement method based on event-sensing principle
1.1 Principles of vibration event generation
The signal unit of the event-sensing principle is termed an “event,” and the generation of an event depends on the light intensity change received by each independent pixel of the event sensor [20].In this process,the surface of the object reflects light that,subsequent to illumination by the light source,traverses the camera lens of the optical imaging system to ultimately reach the event sensor.Unlike CCD or CMOS sensors,an event sensor records the light intensity data for each pixel without the additional capability of discerning light wavelength variations.Each pixel of the event sensor corresponds to a specific area in the physical world.When the pixels of the sensor change the reflected light intensity in the received area,it outputs an independent light intensity change event,ek,which yields [18]
where Ωs is the pixel plane domain;k is the event index,{xk,yk} denotes the horizontal and vertical coordinates of the pixel point where the event occurs;tk denotes the time at which the event occurs;and Pk∈{1,0} denotes the polarity of the event,where Pk=1 indicates that the pixel point receives an increase in light intensity,whereas Pk=0 indicates a decrease in light intensity.To restrict the occurrence of light-intensity events,a constraint is imposed such that an event is triggered only when the light intensity change reaches a certain threshold,which is referred to as the event-output constraint [21].
where I is the light intensity and τ is the light intensity change threshold.Under this principle,the event sensor asynchronously senses light intensity changes in a scene in pixels and continuously generates event data.An example of this principle for capturing the motion behavior is shown in Fig.1.The motion of the rotating object in the picture changes the brightness of the same position in the picture and continues to generate events;however,the brightness of the background environment does not change and no effective event is generated.In this example,event data are generated only when the brightness changes owing to motion,which can capture the motion behavior more specifically than the video stream data.
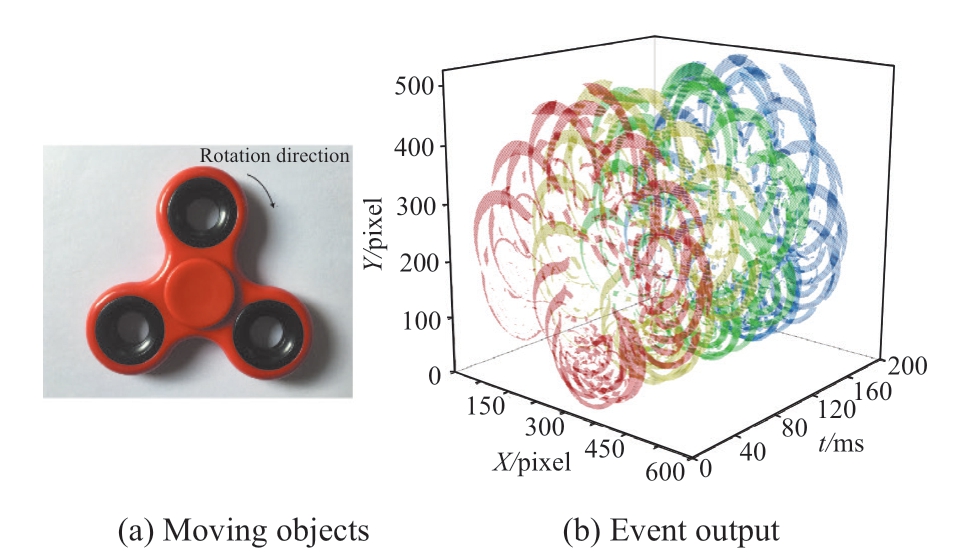
Fig.1 Event camera extracts motion signal based on brightness change
In addition,the event sensor features a high time resolution and low time delay;therefore,it can complete motion analysis tasks for high-speed and high-dynamicrange scenes.If the time resolution and response delay of the event sensor satisfy the conditions for smoothly capturing the object vibration,then the vibration phenomenon mapped to the pixel layer can be represented as continuous pixelreciprocating output polarity events.Because the physical edge of an object is generally different from the background environment in terms of color,it is typically the key location of the event;therefore,this principle provides the theoretical feasibility of visually describing the vibration of an object.
1.2 Method for calculating vibration amplitude and frequency
The vibration discussed herein refers to the twodimensional visual vibration captured by a single-event sensor.Assuming that the vibration of an object generates polarity events in the pixels of the event sensor (represented by gray blocks),as shown in Fig.2,the steps for calculating the vibration amplitude-frequency are as follows:
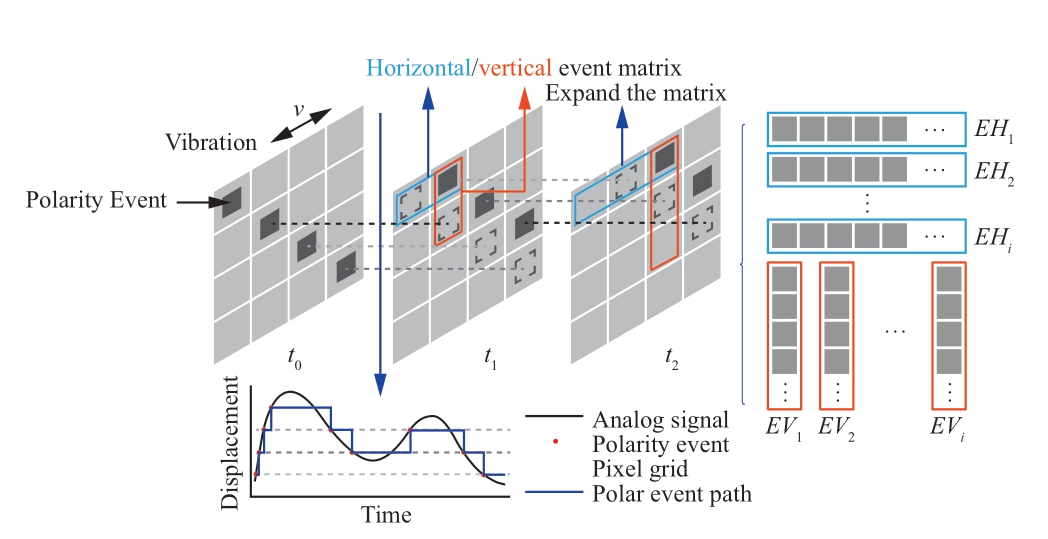
Fig.2 Establishment of relationship between vibration displacement and time
1) Set the starting time t0 and time step tw,and continuously obtain the polarity events perceived by each pixel within the time window (t0,t0+tw).
2) Based on the time and coordinate information of the events,establish a relationship between the vibration displacement and time.Using the event triggered by the horizontal movement component of the vibrating object as an example,assume that event e1 occurs at pixel point P(x1,y1) at time t1.Subsequently,determine whether the two adjacent pixel points to the left and right of coordinates P(x1,y1) emerge during the previous event.Otherwise,create a new horizontal event matrix and insert the polarity event e1 to ensure that
where EHi is the i-th horizontal event matrix generated at time t0.If a new polarity event occurs at pixel point P(x2,y2)at time t2 and P(x2,y2) is a horizontally adjacent pixel point to P(x1,y1),then we assume that a correlation exists between this event and the previous event.In other words,these two events are caused by the continuous movement of an object in the same area.This event is inserted into the matrix where the previous event is located,and the event matrix is expanded in this manner until the perception time window ends such that

where s is the number of polarity events in the matrix.However,in actual data processing,the area occupied by the physical edge of the vibrating object in the pixel is typically almost completely parallel to the X-or Y-axis of the image,which causes the object to vibrate in either direction.Consequently,numerous continuous pixels are created parallel to the axis to generate polar events with extremely short time intervals that are in fact not related,thus resulting in mixed signals in the event vector group.Therefore,the minimum time difference constraint can be set such that the vector group in which the new polarity event is inserted into the previous sequence event satisfies the following constraint condition:
where td is the minimum time difference threshold,which was set to 100 µs in this study.At the end of the time window,each parallel event matrix is processed separately.We disregard the value of the event polarity,connect the events in the matrix in time order,and then derive the relationship between the vibration displacement and time in the time window as follows:
where WHi(t) is the displacement of the i-th horizontal event matrix at a certain time,and u(t) is the standard step function expressed as,
The method for constructing the displacement-time relationship of the vertical event matrix EVi is the same as that detailed above.
Perform vibration sampling and spectral analysis.The displacement-time relationship of each event matrix is sampled at equal intervals,and the frequency-domain signal of the vibration events is analyzed via the Fourier transform.To improve the calculation speed of the Fourier transform,the fast Fourier transform (FFT) method is generally used to obtain the vibration frequency and relative amplitude of the object,which are then recorded in the corresponding horizontal spectrum matrix FHi and vertical spectrum matrix FVj,respectively.

where n is the matrix element,N the number of FFT points,fs the sampling frequency,and PHi(n) and PVj (n) the relative amplitudes corresponding to the frequencies.In addition to calculating the amplitude frequency signal of the matrix,to quantify the vibration spectrum of the entire scene,each spectrum matrix can be weighted to obtain the weighted spectrum matrices MHi and MVj:
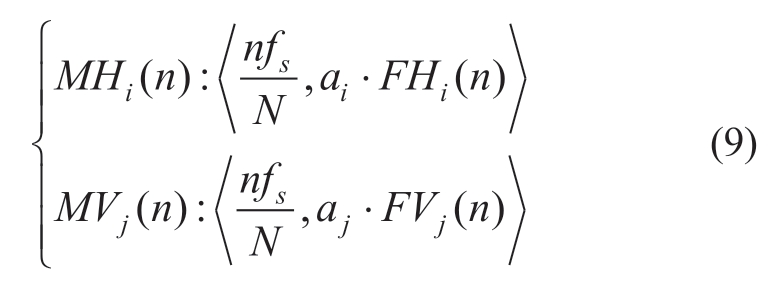
where ai and aj are the number of vibration pixels associated with the horizontal and vertical matrices,respectively,to increase the matrix weight with more effective signals.The weighted average matrix of the vibration spectrum F(n) is obtained as follows:

where SH and SV are the total number of vertical and horizontal spectrum matrices,respectively;and F(n) is a two-dimensional matrix corresponding to the vibration frequency and amplitude of the entire scene.
2 Design of vibration measurement test
2.1 Vibration measurement test platform
To substantiate the effectiveness of the event-based vibration measurement approach,we employed customized hardware to establish a dedicated platform for vibration measurement testing.The schematic diagram illustrated in Fig.3 shows the setup of the vibration measurement test platform based on event-sensing principles.The platform encompasses essential elements,including an event sensor,the target object for measurement,a data processing unit,and an illuminometer.
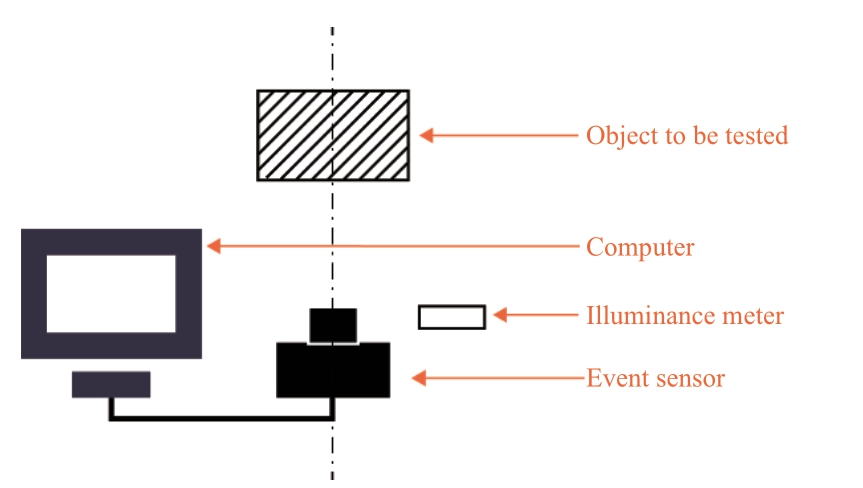
Fig.3 Vibration test platform
The data processing unit establishes a data connection with the event sensor,thus enabling data reception and processing.To ensure an accurate evaluation,an illuminometer (model: VICICR 1010A,range: 0.1 lx to 200 klx) was employed to measure the light intensity captured by the event sensor during testing.This quantification facilitates a methodical examination of the relationship between the effectiveness of event sensing and the ambient light intensity in the testing environment.
To satisfy the vibration measurement criteria specified in the International Organization for Standardization for monitoring mechanical equipment vibration [22] and considering the prevailing capabilities of commercial event sensors,including their resolution and vibration frequency measurement range,we employed the ATIS VGA Gen3 event sensor developed by Prophesee.Using this event sensor enables the attainment of perceptive insights into the vibration behavior.The relevant parameter specifications of the event sensors are listed in Table 1.
Table 1 Equipment performance of ATIS VGA Gen3
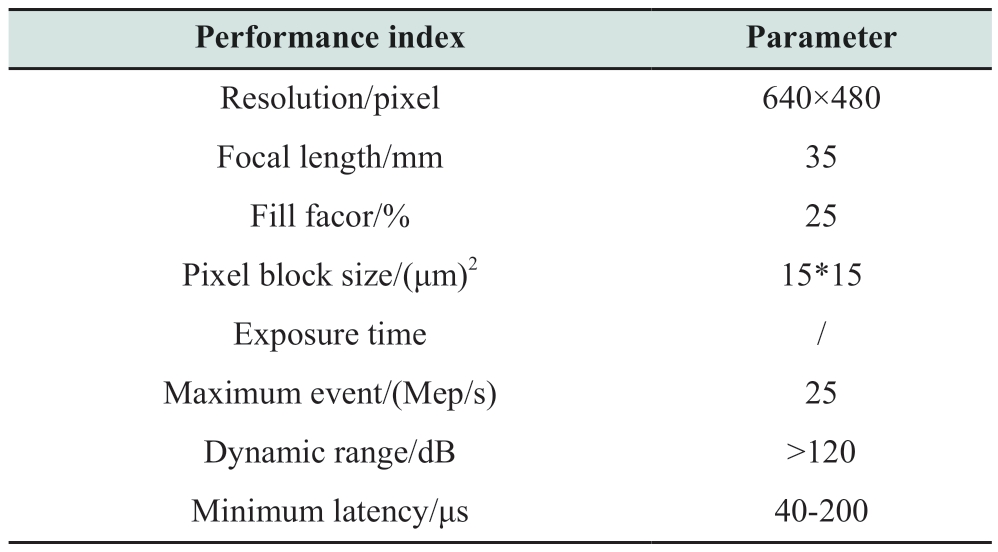
The performance assessment results of the ATIS VGA Gen3 event sensor [17] show that its event latency time is short,i.e.,consistently remaining under 200 μs.This characteristic bestows the sensor with a resolution suitable for vibrations occurring at frequencies of approximately 103 Hz.Furthermore,considering the sensor’s pixel size and dimensions as well as the focal length of its camera lens,we infer that the camera can effectively capture subtle object movements,i.e.,those measuring as low as 50 μm.This capability satisfies the requirements for conducting vibration measurements.
For comparison,in the accuracy assessment of the perception algorithm,a CMOS camera (GoPro9;sampling frame rate,240 fps) was employed to synchronously measure the vibration of the tested object.A preprocessing procedure involving the continuous grayscale differentiation of the image stream was applied to generate similar vibration events.Subsequently,the vibration amplitude-frequency calculation method presented herein was subsequently utilized for analysis.In the feasibility experiment,a surfacemounted accelerometer (TMR-7200) was selected for comparative vibration measurements.
2.2 Test content
The testing was categorized into five distinct segments:assessment of event-sensing algorithm accuracy,feasibility examination,evaluation of influencing factors,efficiency assessment of the algorithm,and a real-world vibration measurement test.Table 2 presents the test layout and methodology.The specific details are outlined as follows:
Table 2 Vibration test contents
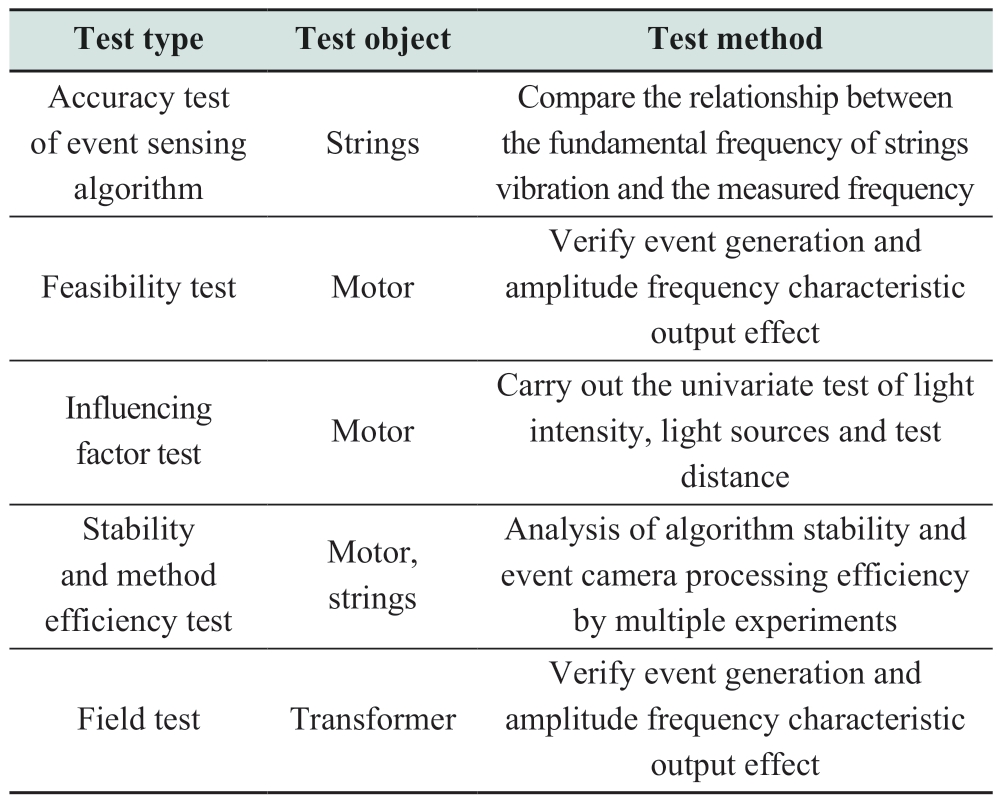
1) Accuracy test of the event-sensing algorithm.The vibration model of the string is straightforward and its vibration state remains stable.In this study,we utilized various frequency vibration signals generated by employing strings of different thicknesses and controlling the string tension.Thus,the precision of the event-sensing algorithm in calculating the object vibration frequency and location was substantiated.
2) Validation of event-sensing method.To validate the feasibility of utilizing the event-sensing method for measuring power equipment vibration,we selected a vibration motor (model: HY-0.4) as the testing subject.The test setup is illustrated in Fig.4.The motor had a rated power of 40 W,measured 145 mm × 11 mm × 75 mm,and comprised two rotor poles.Its rated frequency and speed were 50 Hz and 2940 rpm respectively.The excitation force in the vibration motor was generated by mounting adjustable vibration blades at both ends of the rotor shaft.Meanwhile,the number of blade groups affects the vibration amplitude.A vibration measurement was conducted on the motor to substantiate the aptitude of the event-sensing method for sensing power equipment vibrations.In addition,the spectral results were analyzed to confirm the feasibility of the vibration amplitude-frequency calculation method.

Fig.4 Vibration motor test site
3) Factor influence tests.To comprehensively evaluate the vibration measurement ability of this method in a field environment,we selected a vibration motor as a vibration measurement object and investigated its vibration measurement effect under different conditions.The vibration-response capability of the event sensor was verified by adding light or changing the test distance.
4) Stability and measurement efficiency.To validate the computational stability and processing efficiency of the algorithm,we obtained test samples from both the vibrating strings and vibration motor.These samples were subjected to a quantitative analysis to gauge the data utilization rate,processing time,and other relevant metrics of the algorithm.
5) Field-vibration measurement tests.To further validate the applicability of this method for the vibration measurement of engineering field equipment,we conducted a vibration measurement test on two 220 kV main transformers located in Guangdong Province.
3 Analysis of test results
In this section,we describe the vibration measurement experiments conducted on a designated subject.The experimental setup should be optimally positioned within the field-of-view of the camera,and the camera lens should be manually adjusted for optimal focus.While maintaining controlled noise levels,the sensitivity of the experimental sensor to variations in the light intensity was set to the maximum across all trials.During data processing,the sampling frequency for the FFT must exceed 2.5 times the maximum frequency of interest during the measurement to prevent spectral aliasing and ensure an adequate frequency resolution.The data acquisition time window was specified to range from 2 to 5 s.
3.1 Accuracy analysis of event-sensing algorithm
During the test,six sets of signals characterized by increasing vibration frequencies were generated using vibrating strings of varying thicknesses.These sets are denoted herein as vibration signals 1-6.A pitch meter (model: KORG TM50;frequency accuracy: 0.4 Hz) was employed to capture the audio signal of the six signal groups,which served as a reference value equivalent to the corresponding vibration frequency.The measurement locations are depicted in Fig.5.Owing to the frame rate limitations of the CMOS camera utilized in the test,signals beyond 120 Hz could not be discerned based on the sampling theorem.Consequently,the measurement excluded vibration signals 3-6,which possessed higher theoretical vibration frequencies.Fig.6 illustrates the frequency spectrum and principal vibration frequency reference values of vibration signals 1-6 measured using the two sensors.
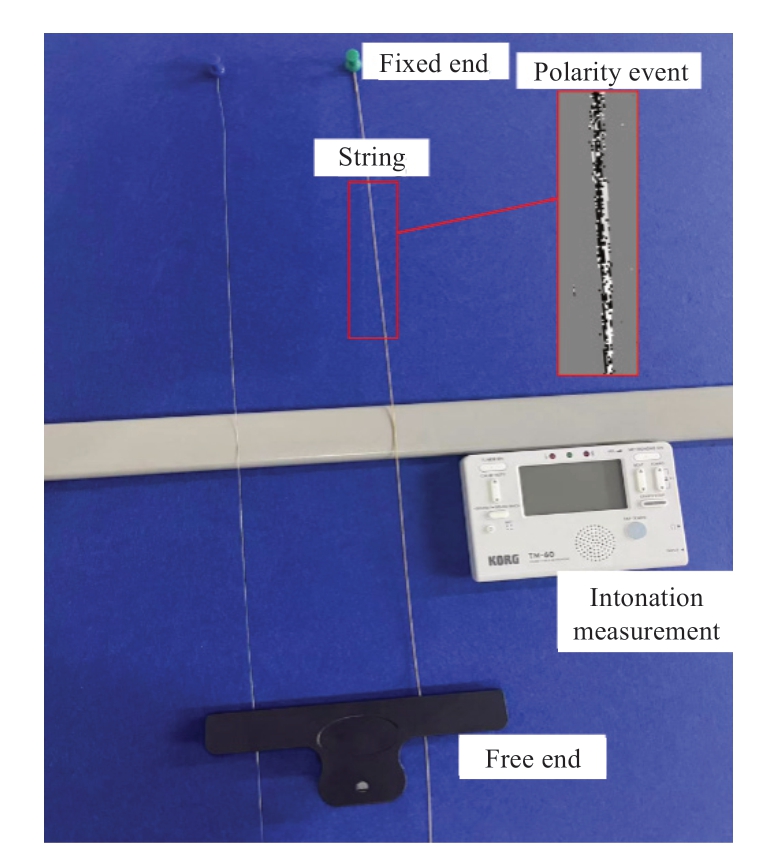
Fig.5 Illustration of vibrating strings
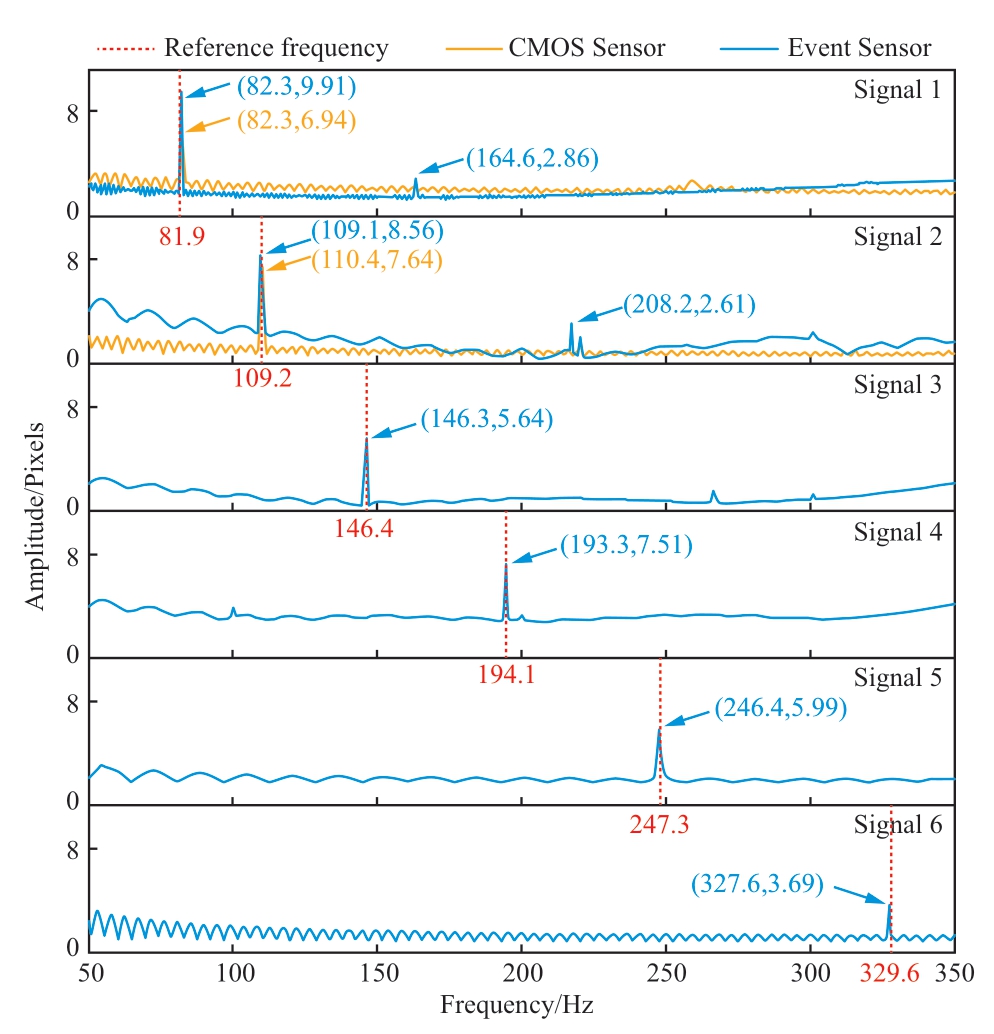
Fig.6 Frequency spectrum of string vibration
As shown in the figure,the discrepancy between the vibration frequency values calculated using the algorithm presented herein and the corresponding reference values was less than 1%.However,for vibration signals 5 and 6,which exhibited higher theoretical vibration frequencies than the other signals,the measured values were slightly lower than the reference values.This is attributed to the fact that the vibration frequency response range is affected not only by factors such as event response delay,but also by the limitation posed by the maximum number of events that can be processed within a specified time frame.
where Es represents the number of events sensed by the sensor per second,and fmax denotes the upper limit of the vibration frequency response.Subsequently,fmax can be calculated as follows:
Consequently,in this investigation,where the MEPS was set to 106,attempts to capture vibrations at 330 Hz will result in data loss if the proportion of the vibrational region exceeds approximately 12% of the total pixel count.Thus,when devising a measurement system,the style="font-size: 1em; text-align: justify; text-indent: 2em; line-height: 1.8em; margin: 0.5em 0em;">To visually illustrate the vibration positions measured by the event sensor,a mapping technique that relies on the pixel position and amplitude-frequency characteristics of the events was utilized.This procedure involves identifying the frequency component corresponding to the highest amplitude within the spectrum of the event matrix localized at the position of the associated pixel.By mapping between the prevailing vibration frequency and each individual pixel,the resulting information can be visualized as a thermal diagram.The thermal diagrams portraying the primary vibration frequency of strings 1-6 are shown in Fig.7(a)-(f).
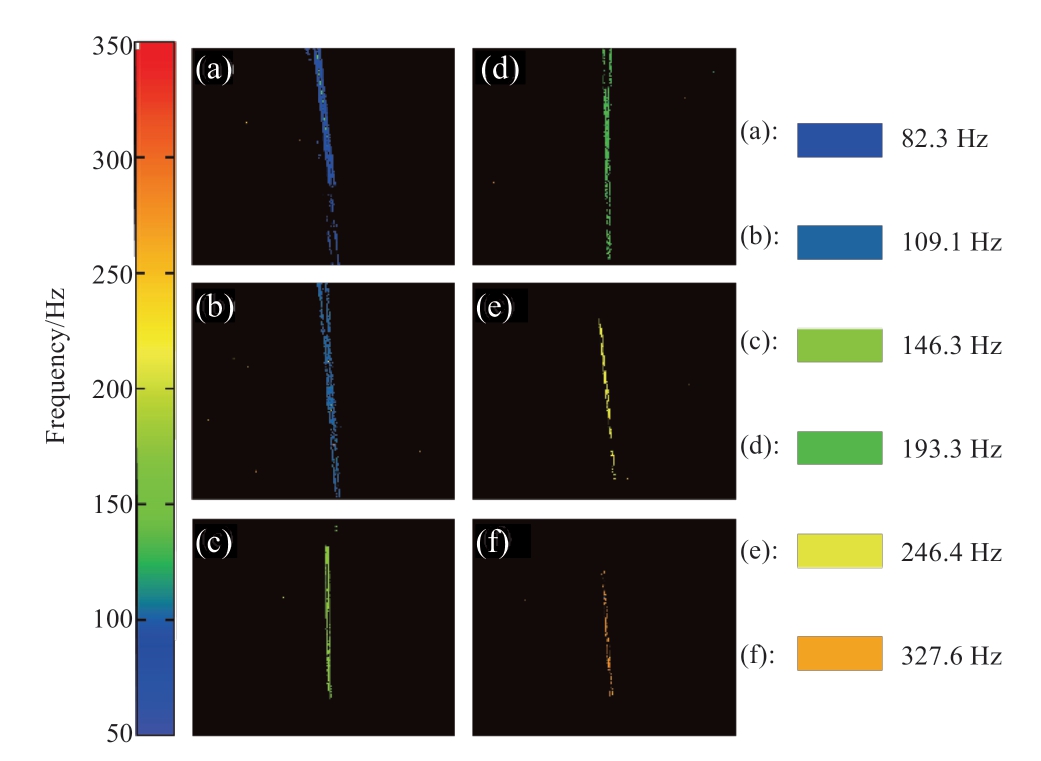
Fig.7 Thermal diagram of main frequency of strings
As shown in Fig.7,the pixel-generated vibrations can depict the chord contours of the vibration source.As thicker chord lines occupy more pixels in the image,they contribute to a more pronounced effective vibration frequency in the thermal diagram.The experimental results indicate that the vibration measurement algorithm,which is based on the event-sensing principle,adeptly computes an object’s vibration frequency with precision and concurrently visualizes the structural attributes of the vibrating entity.
3.2 Feasibility analysis
Fig.8(a)-(d) show the physical representation of the vibration motor,the event flow triggered by vibration,the event matrix at a specific moment,and the thermal diagram of the predominant vibration frequency,respectively.As shown in the figures,the motor’s vibration behavior can be captured more accurately as a continuous and periodic event flow.Based on a comparison between the vibration event matrix and the actual vibration pattern,most of the vibration events occurred in regions with distinctive color contrast between the motor casing and background.This characteristic efficiently delineates the vibration positions and contours.Additionally,the thermal diagram of the principal frequency effectively reveals the distribution of vibrations.
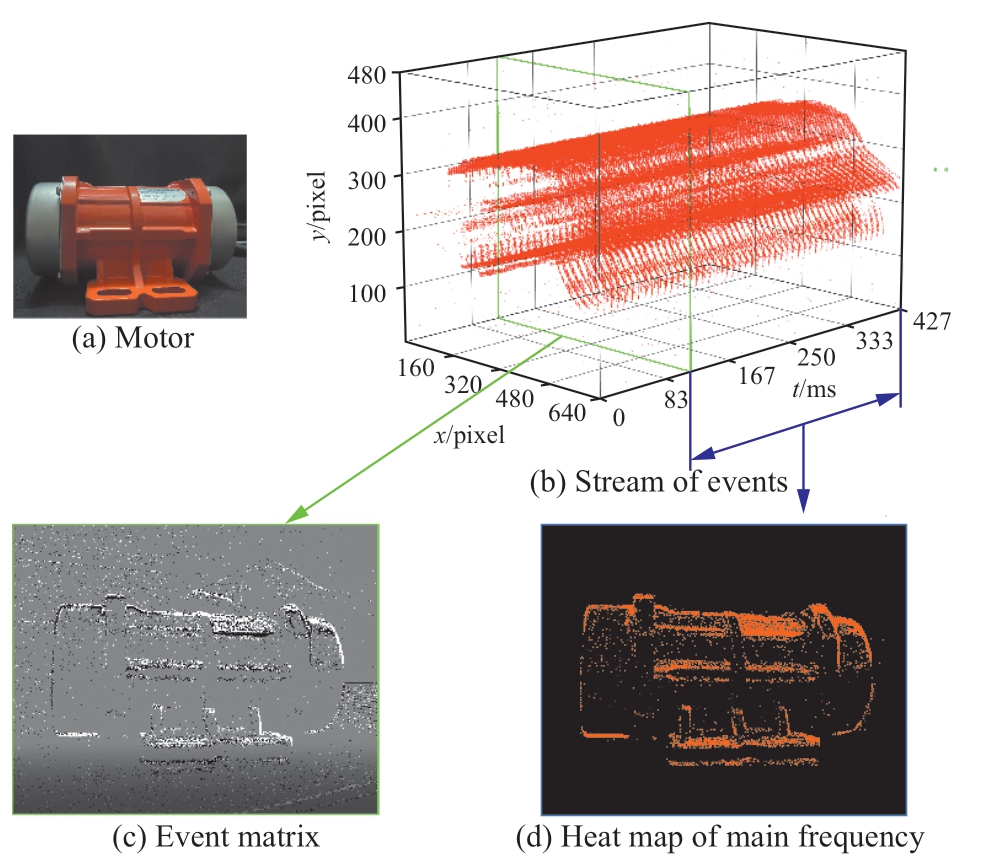
Fig.8 Event sensing of vibration motor
Modifying the pairs of vibrating blades on either side of the vibration motor while maintaining the other measurement conditions constant resulted in different vibration spectra obtained by both the event and acceleration sensors,as depicted in Fig.9.Evidently,the peak frequencies of the vibration spectra derived from both measurement methods were similar,whereas the relative amplitudes demonstrated a positive correlation with the pair values of the vibrating blades.This observation confirmed that the vibration spectra accurately conveyed the relative amplitudes of the vibrations.Thus,the proposed approach for mechanical vibration perception and amplitudefrequency calculation based on event cameras is a viable and effective methodology.
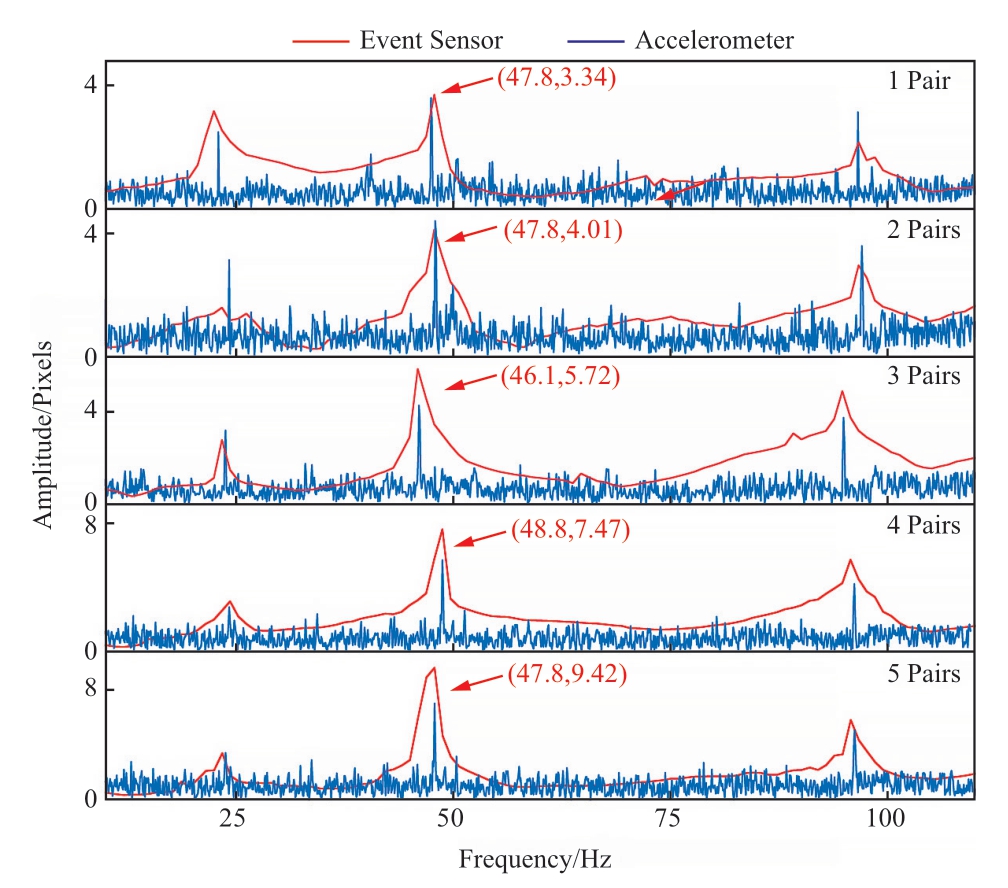
Fig.9 Comparison between number of vibrating plates and vibration spectrum
3.3 Influencing factor analysis
a) Light intensity.Tests were conducted in an enclosed room to eliminate the effects of natural light sources.The surface of the vibration motor was illuminated with uniform and varying levels of light to ensure that the supplementary light source avoided direct alignment with the camera lens.The illuminometer was used to gauge the ambient light intensity at which the event camera was positioned.By gradually adjusting the output of the auxiliary light source,the illuminometer reading was fine-tuned from low to high,specifically at 0,20,50,100,200,and 500 lx.The vibration spectrum curves of both the event and CMOS sensors were recorded separately under varying light intensities,as depicted in Fig.10.To facilitate a clear comparison,the curves in the figure were offset equidistantly based on the light intensity.
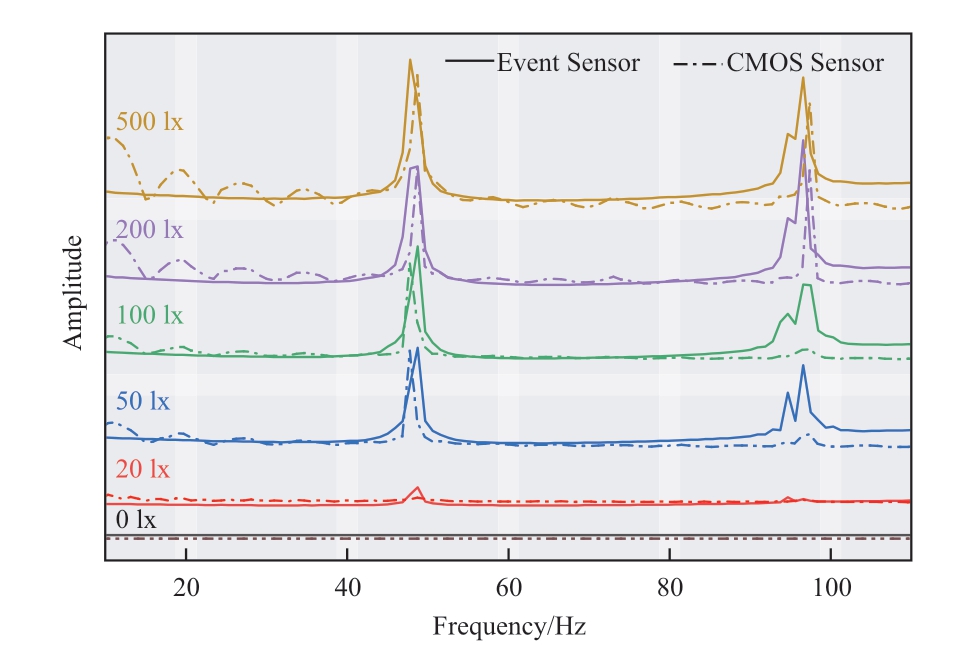
Fig.10 Vibration spectrum under different light intensities
Figure 10 shows that the effective vibration frequency remained undetected in the absence of light.A comparison between the amplitude-frequency behaviors of the two sensors within the 20 lx test group shows that the event sensor was able to sense the peak frequency of vibrating objects,unlike the CMOS sensor.Hence,the event sensor exhibited a higher sensitivity to light than the CMOS sensor.In the test groups featuring 50 lx and beyond,both sensor types demonstrated improved perception of the amplitudefrequency attributes of the vibration motor,with notably similar characteristics.The correlation between the test light intensity and the thermal diagram of the vibration frequency is shown in Fig.11.
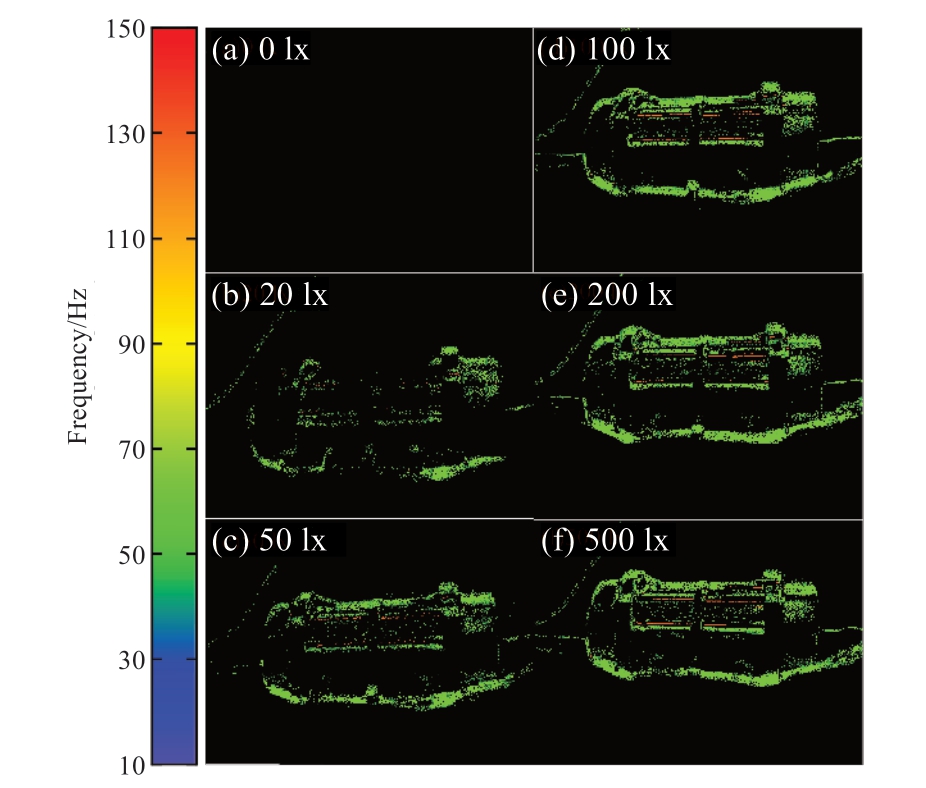
Fig.11 Thermal diagram of main frequency of motor vibration under different lighting intensities
As depicted in Fig.11,the augmentation of the light intensity shown in (a)-(c) corresponds to an expanded scope of pixels than can detect effective vibrations.However,as the light intensity continued to increased,the alterations in the vibration pixel distribution became less pronounced,as exemplified in Figures 11(d)-(f).Notably,this method is sensitive to fluctuations in light intensity.As the light intensity becomes sufficient,the effect of the light intensity variation on the vibration measurement becomes insignificant.Therefore,assessments should be conducted under appropriate lighting conditions during the actual vibration measurements.When sufficient lighting cannot be provided,suitable supplementations should be employed to maximize the ratio of effective vibration events to noise events.
Furthermore,because event perception relies on alterations in the received light intensity,which are associated with an object’s light-reflecting capacity and color,we introduced a black-and-white striped pattern into the vibration motor to establish a pronounced color contrast.The vibration thermogram obtained by applying the stripe pattern is shown in Fig.12.As presented in the figure,as the light intensity gradually diminished to 10 lx,only the area featuring the black-and-white striped pattern retained the capability to detect vibration generation.This is because,during object vibration,the maximum disparity in the reflected light intensity occurred precisely at the demarcation between the black and white segments.
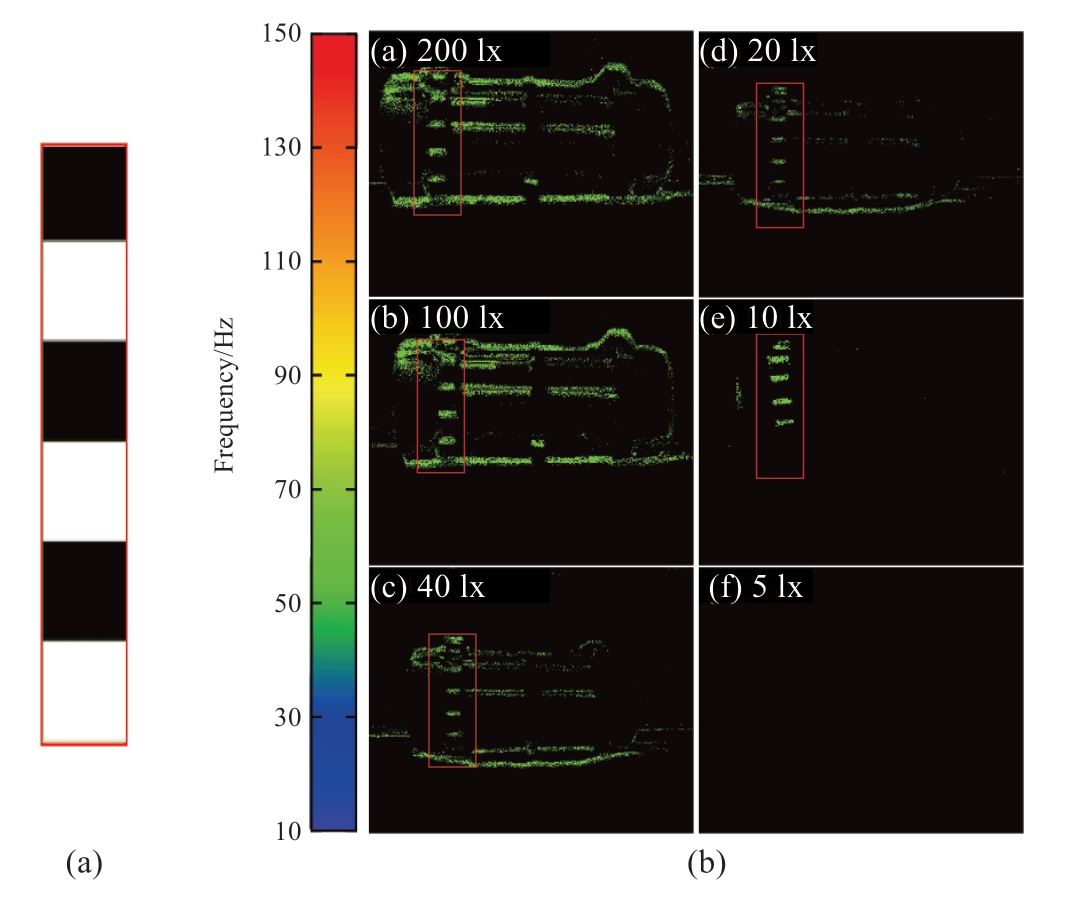
Fig.12 (a) Black and white striped pattern;(b) thermal diagram showing main frequency of motor vibration under different lighting intensities
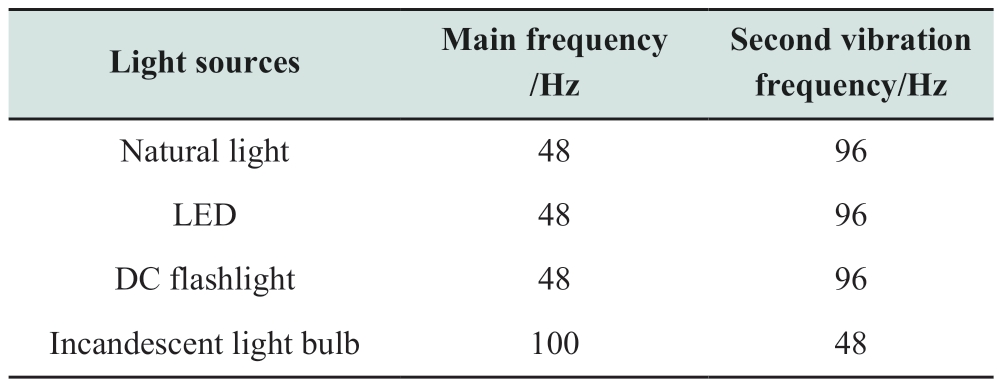
b) Light source. The results of the light intensity measurement test indicate that the optimal vibration measurements were obtained when the DC light intensity surpassed 50 lx.Consequently,for the light-source variation experiment,the camera was exposed to different light sources,each with an intensity equal to or exceeding 50 lx.Fig.13 illustrates the visualization results of vibration measurement across various light sources.The figure shows that the vibration visualization profiles among different measurement techniques appeared analogous;nonetheless,the principal vibration frequency detected from the incandescent lamp deviated from the results obtained using other light sources.
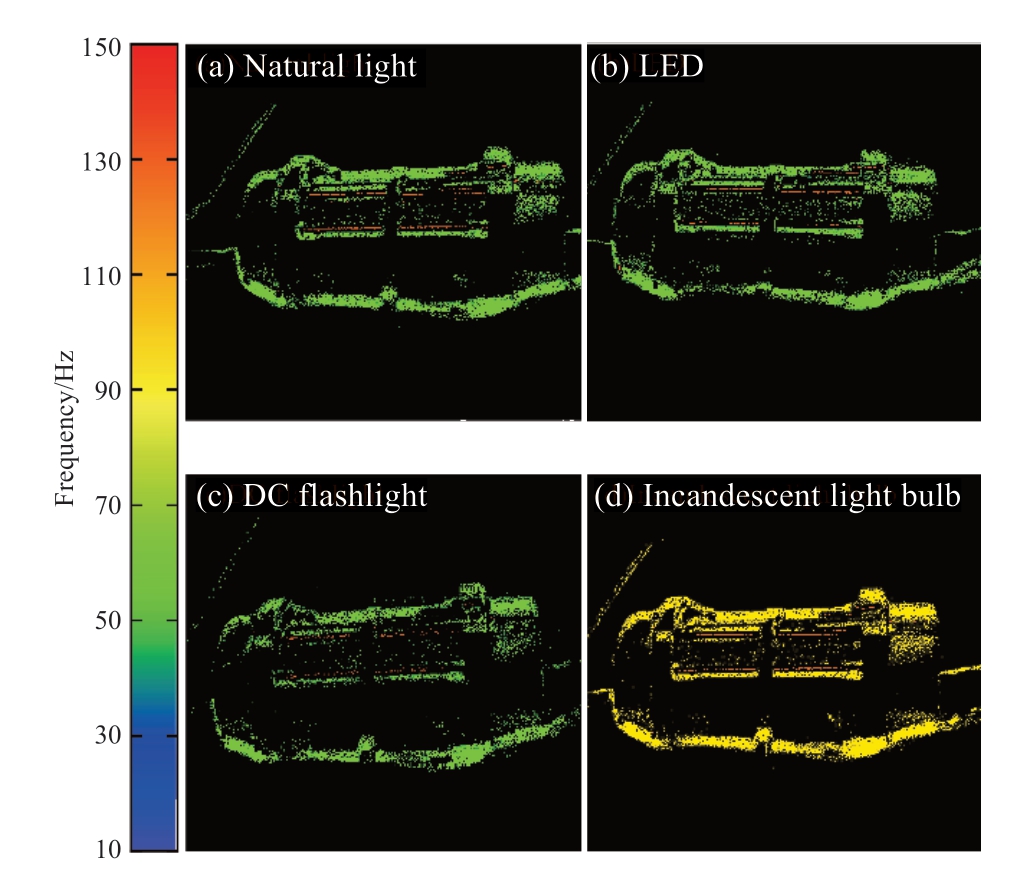
Fig.13 Vibration frequency thermal diagram of different light sources
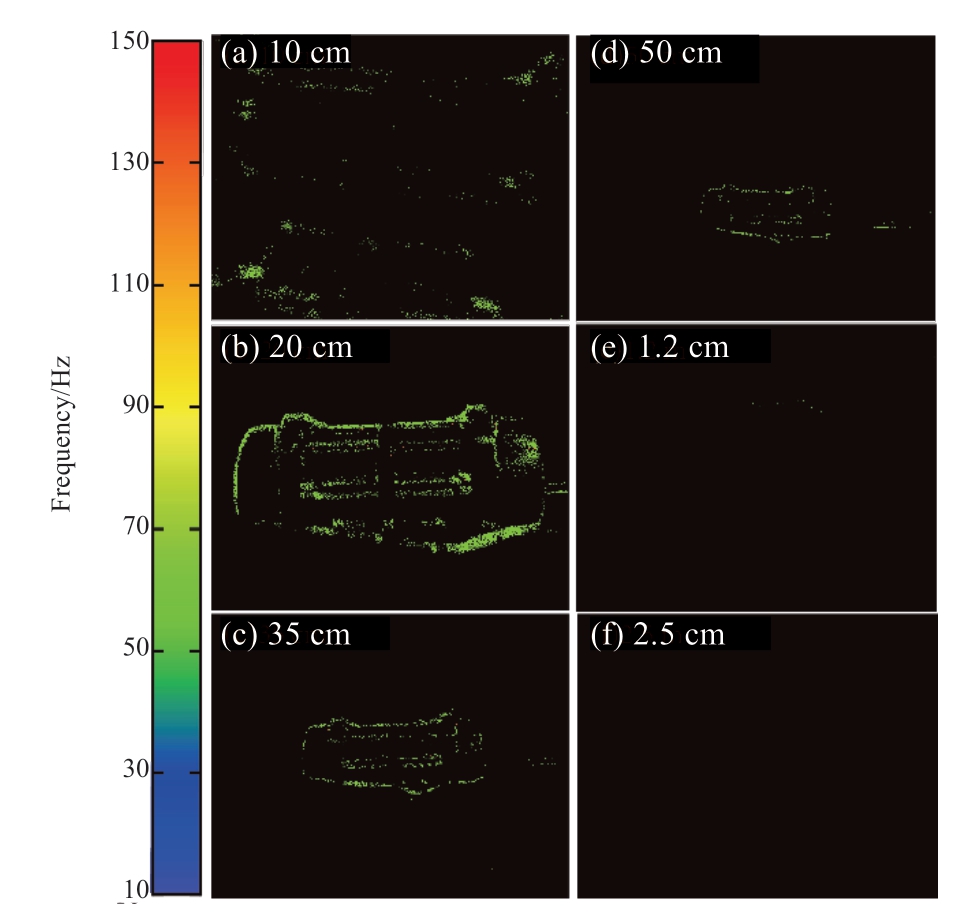
Fig.14 Vibration frequency thermal diagram of different test distance
Amplitude and frequency computations were conducted on the test data;for each experimental group,the frequency value corresponding to the maximum amplitude (primary frequency) and the frequency value corresponding to the second-largest amplitude (secondary vibration frequency)in the amplitude-frequency distribution were extracted,as outlined in Table 3.As shown in the table,the primary vibration frequency for the natural,LED,and DC light experimental groups was 48 Hz,and the secondary vibration frequency was 86 Hz.These findings were consistent across the three groups,thus corroborating the results of the feasibility experiments.Conversely,for the incandescent lamp experimental group,the primary vibration frequency was 100 Hz,whereas the secondary vibration frequency was 48 Hz,which can be attributed to the inherent 100 Hz flicker inherent to incandescent lamps.This flicker causes the camera to capture a prominent frequency component at 100 Hz,which surpasses the main frequency component of the equipment vibration.Consequently,we can infer that when performing vibration spectrum analysis,flicker components must be excluded from flickering light sources.In addition,the use of flickering light sources to measure vibrations at frequencies near the flickering frequency should be avoided.
Table 3 Light sources and vibration frequency
c) Test distance. The amplitude and frequency of the test data for each group of test distances were calculated.The primary and secondary vibration frequencies of the vibration motor for each group of test distances are listed in Table 4.As shown in the table,as the test distance increased,calculating the second vibration frequency from the amplitude frequency results became challenging,and after the test distance exceeded 2.5 m,the effective data could not be measured.The tests were conducted in an environment characterized by consistent and ample indoor DC illumination.The camera lens was oriented toward the vibration motor,and the distance between the vibration motor and the lens was varied to 10 cm,20 cm,35 cm,50 cm,1.2 m,and 2.5 m.Figure 14 shows the vibration measurement results at different test distances.As shown,when the test distance is extremely small,achieving a clear focus on the vibration test was challenging,which resulted in a blurred test outline.A clear and stable contour emerged in the 20-50 cm range.At a distance of 1.2 m,only a section of the contour became unclear,whereas at a distance of 2.5 m,an effective vibration measurement could not be achieved.
Table 4 Vibration motor test distance and vibration frequency
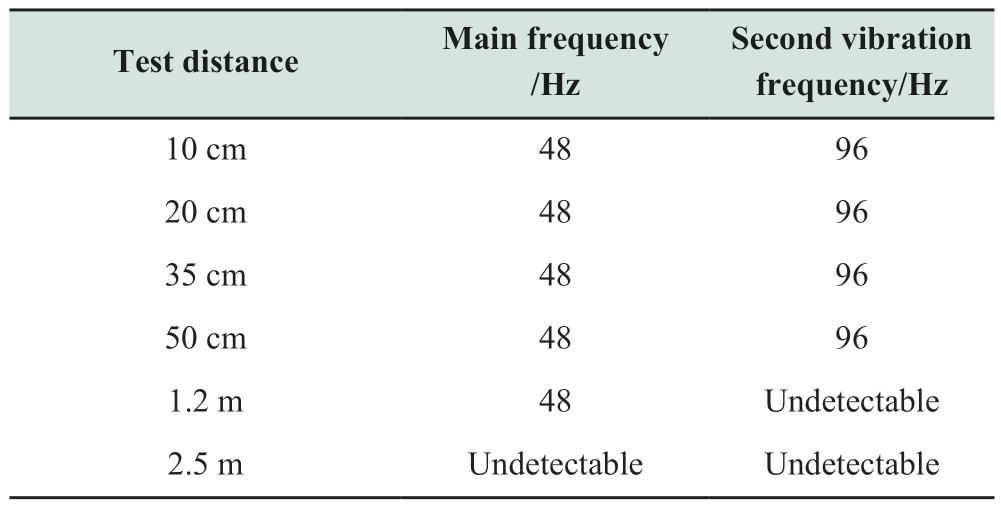
The amplitudes and frequencies of the test data were calculated for each test distance group.The primary and secondary vibration frequencies of the vibration motor were extracted for each group of test distances,as listed in Table 4.Based on the table,calculating the secondary vibration frequency from the amplitude-frequency results became more difficult as the test distance increased.Furthermore,obtaining effective data beyond a test distance of 2.5 m was unfeasible.
3.4 Stability and efficiency analysis of proposed method
To further assess the robustness of the proposed algorithm and compare the measurement efficiency of event cameras and conventional cameras,we selected a series of data samples from two types of test objects for quantitative analysis,as shown in Fig.15.The stability of the algorithm was evaluated based on the standard deviation of the dominant frequency (DFSD) as follows:

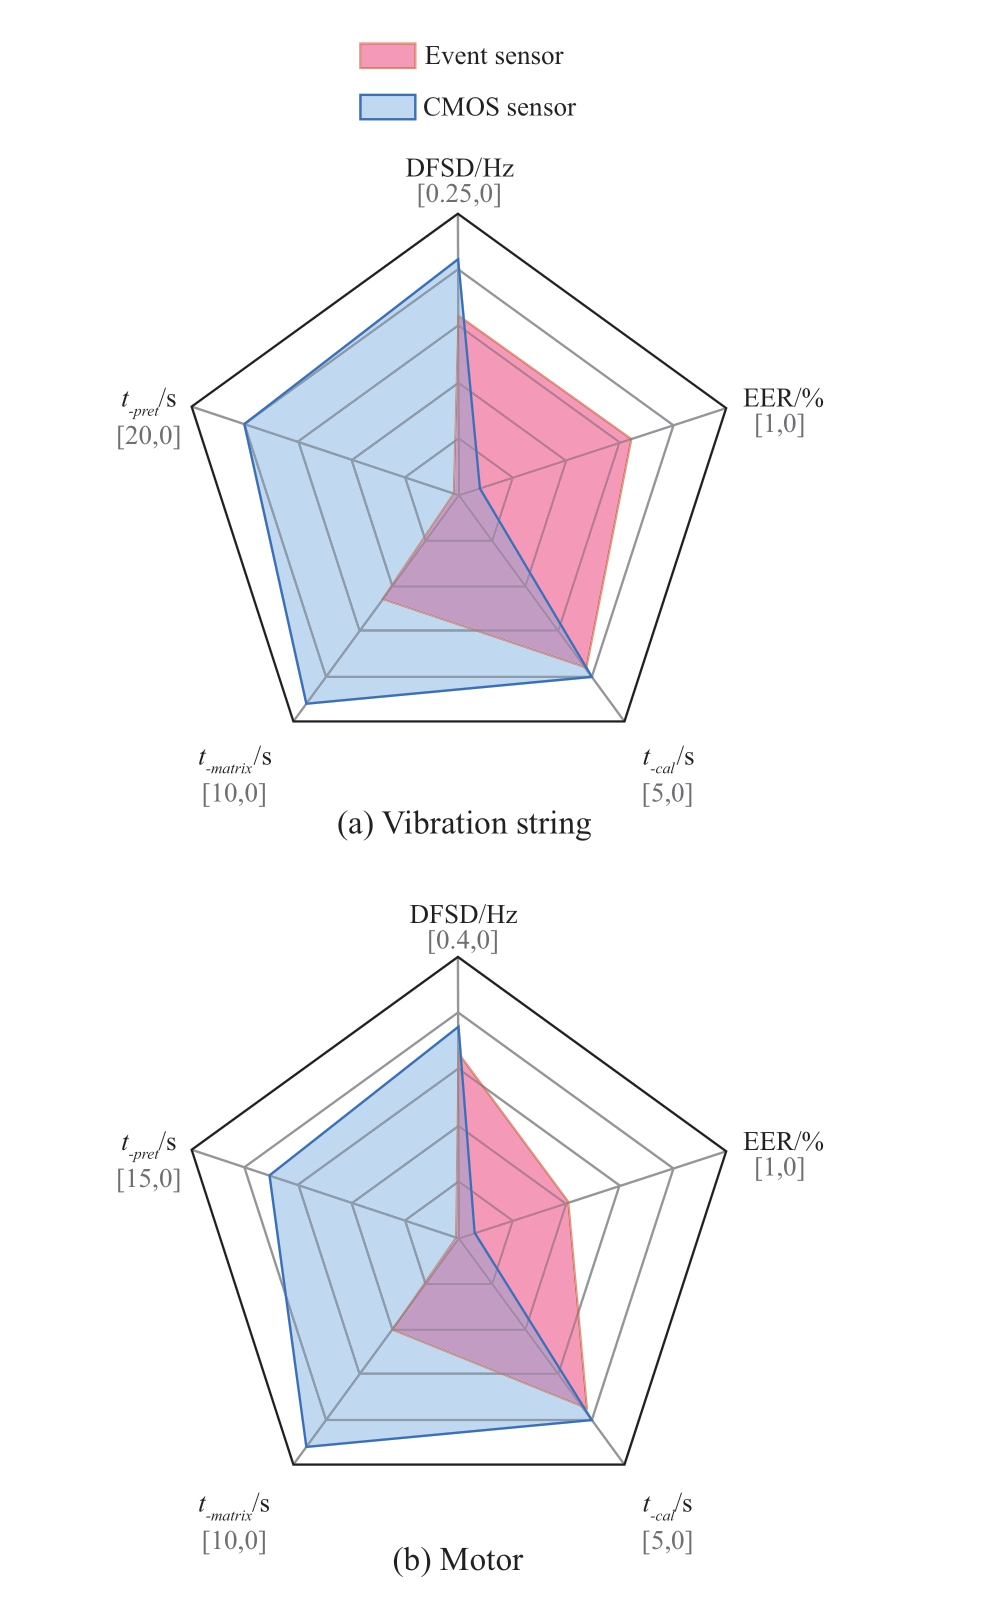
Fig.15 Result of stability and efficiency test
By examining the DFSD index presented in a chart,the standard deviation of the dominant frequency for both cameras using the proposed algorithm was below 0.3 Hz,which demonstrates favorable stability.An evaluation of the EER index revealed that the data utilization rate for the CMOS camera remained under 10%.This is attributed to the effective filtering of extraneous background data by the event camera,which resulted in an average data utilization rate exceeding 40%.An analysis of t-pret showed that the data preprocessing time required by the event camera was significantly shorter than that by the CMOS camera.This is because data from the even camera can be processed directly,whereas those from the CMOS camera necessitate preprocessing,such as grayscale conversion and difference calculation.Moreover,the increased volume of preprocessed data complicates event filtering by the CMOS camera,thus resulting in a higher t-matrix value.Following matrix generation,the t-cal indices of the two measurement methods converged because of their similar quantities of effective data.In summary,the proposed algorithm reliably captured the dominant frequency while benefiting from the greater data utilization of the event camera.Consequently,the analysis times ranged between 5 and 10 s for each sample,which afforded a significant reduction in the operation time by 65%-75% as compared with the time required by the CMOS camera.
3.5 Field measurement analysis
To further validate the efficacy of the approach,we conducted vibration amplitude-frequency measurements on two standard 220 kV main transformers sourced from a substation in Guangdong Province.Previous studies showed that within the context of China’s 50 Hz grid voltage frequency,the winding vibration of transformers predominantly encompassed frequencies of 50,100(fundamental frequency),and 200 Hz.Subsequently,these vibrations induced vibrations in the transformer’s casing [23].
Vibration measurements were conducted on the front shell,side shell,mechanism box,and radiator of the transformer from four different angles.These measurements were performed to ascertain the positions where vibration occurred.ATIS event sensors and TMR-7200 strain acceleration sensors were used for this purpose.A frequency-domain analysis was performed on the acquired event matrix images from various positions.Based on the results of the analysis,we extracted the maximum vibration amplitude and the frequency associated with the second-largest amplitude.These values are referred to as the primary and secondary vibration frequencies.The calculation results are listed in Table 5.By comparing the data presented in Table 5 with the theoretical values,we infer that the vibration measurement results were consistent with the theoretical predictions.Considering the radiator of the transformer as an example,Fig.16 shows the distribution heatmap of the primary vibration frequency.The louvered structure of the radiator resulted in a significant contrast between the radiator body and its external surroundings,which resulted in a broad distribution of effective vibrations.This distribution provides a better visualization of the occurrence of vibrations.
Table 5 Vibration frequency table of transformer
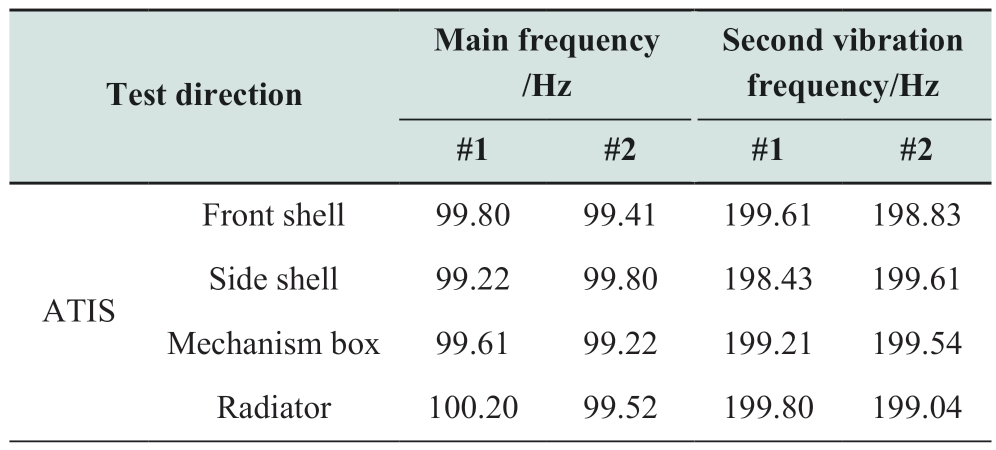
continue
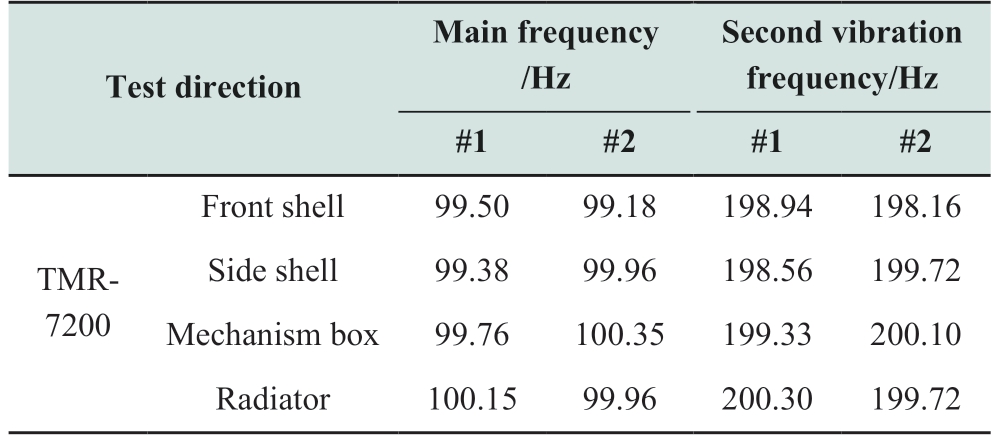
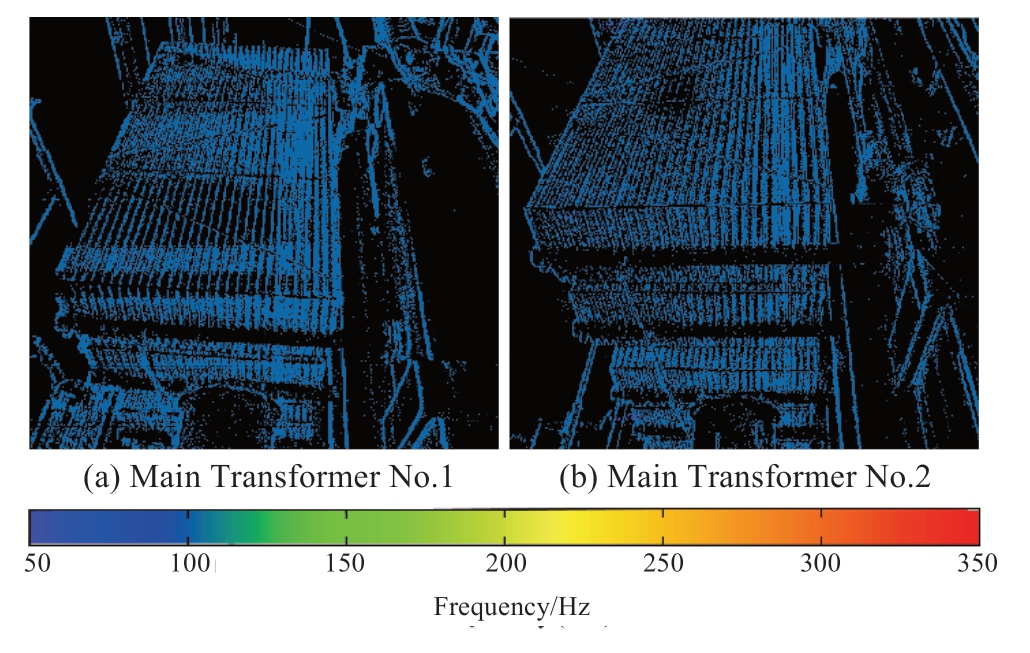
Fig.16 Thermal diagram of primary frequency of transformer radiator
4 Conclusions
1) Based on the event-sensing principle,an algorithm for transforming vibration events into a displacementtime relationship was proposed,It enabled the visual measurement of vibration amplitude frequency signals and provided a new method for measuring mechanical vibration visually.
2) The case test results showed that the vibration measurement system effectively sensed the vibration of power equipment;furthermore,the error between the vibration frequency obtained by the proposed algorithm and the theoretical vibration fundamental frequency of the measured object was less than 1%.Compared with the CMOS sensor,the event sensor was able to sense vibrations under a light intensity of 10 lx,and its response toward light intensity change was stronger.
3) The vibration measurement method based on event sensing offers the advantages of noncontact and full-scene measurements.It can be applied to the vibration location and spectrum analysis of power equipment to further determine the location and nature of faults.Furthermore,it may potentially monitor the operational status of power equipment intelligently.However,the anti-interference technology used in engineering applications and fault diagnosis methods based on vibration signals must be further developed.
Acknowledgements
This work was supported by the National Key Research and Development Program of China (No.2023YFB2604600).
Declaration of Competing Interest
We declare that we have no conflict of interest.
References
[1] Mahin A U,Islam S N,Ahmed F,et al.(2022) Measurement and monitoring of overhead transmission line sag in smart grid: A review.IET Generation,Transmission &Distribution,2022(1): 16
[2] Ali M Z,Shabbir M N S K,Liang X,et al.(2019) Machine learning-based fault diagnosis for single-and multi-faults in induction motors using measured stator currents and vibration signals.IEEE Transactions on Industry Applications,55(3):2378-2391
[3] Peeters M,Kerschen G,Golinval J C (2011) Dynamic testing of nonlinear vibrating structures using nonlinear normal modes.Journal of Sound and Vibration,330(3): 486-509
[4] Malla C,Panigrahi I (2019) Review of condition monitoring of rolling element bearing using vibration analysis and other techniques.Journal of Vibration Engineering &Technologies,7:407-414
[5] Etchepareborda P,Moulet M H,Melon M (2021) Random laser speckle pattern projection for non-contact vibration measurements using a single high-speed camera.Mechanical Systems and Signal Processing,158: 107719
[6] Khadka A,Fick B,Afshar A,et al.(2020) Non-contact vibration monitoring of rotating wind turbines using a semi-autonomous UAV.Mechanical Systems and Signal Processing,138: 106446
[7] Goyal D,Choudhary A,Pabla B S,et al.(2020) Support vector machines based non-contact fault diagnosis system for bearings.Journal of Intelligent Manufacturing,31: 1275-1289
[8] Yao Q,Shabaz M,Lohani T K,et al.(2021) 3D modelling and visualization for vision-based vibration signal processing and measurement.Journal of intelligent systems,30(1): 541-553
[9] Shan X,Tang L,Wen H,et al.(2020) Analysis of vibration and acoustic signals for noncontact measurement of engine rotation speed.Sensors,20(3): 683
[10] Tsunashima H (2019) Condition monitoring of railway tracks from car-body vibration using a machine learning technique.Applied Sciences,9(13): 2734
[11] AbdAlla A N,Faraj M A,Samsuri F,et al.(2019) Challenges in improving the performance of eddy current testing.Measurement and Control,52(1-2): 46-64
[12] Rothberg S J,Allen M S,Castellini P,et al.(2017) An international review of laser Doppler vibrometry: Making light work of vibration measurement.Optics and Lasers in Engineering,99: 11-22
[13] Xing C,Duan F,Ye D,et al.(2021) Vibration measurement of shrouded blade based on variable area eddy current sensor.China Measurement &Test,47(2): 119-124
[14] Wang L,Zhang T,Liu G,et al.(2020) Diagnostics on mechanical characteristics of high voltage circuit breaker based on machine vision technology.High Voltage Engineering,46(6): 2148-2154
[15] Fka B,Xza B,Jian H,et al.(2019) Machine-vision-based assessment of frictional vibration in water-lubricated rubber stern bearings.Wear,426-427: 760-769
[16] Aoyama T,Li L,Jiang M,et al.(2018) Vibration sensing of a bridge model using a multithread active vision system.IEEE/ASME Transactions on Mechatronics,23(1): 179-189
[17] Holeovsk O,Koviera R,Hlava V,et al.(2021) Experimental comparison between event and global shutter cameras.Sensors,21(4): 1137
[18] Lai Z,Alzugaray I,Chli M,et al.(2020) Full-field structural monitoring using event cameras and physics-informed sparse identification.Mechanical Systems and Signal Processing,145:106905
[19] Simon H,Maciej B,Tobias H,et al.(2022) Holographical image based vibrometry with monochromatic and event based cameras.Proc.SPIE 12137,Optics and Photonics for Advanced Dimensional Metrology II,1213702
[20] Ma Y,Ye Z,Liu K,et al.(2021) Event-based visual localization and mapping algorithms: a survey.Acta Automatica Sinica,47(7): 1484-1494
[21] Barranco F,Fermuller C,Aloimonos Y (2014) Contour motion estimation for asynchronous event-driven Cameras.Proceedings of the IEEE,102(10): 1537-1556
[22] ISO/DIS 20816-1:2016 Mechanical vibration—Measurement and evaluation of machine vibration—Part 1: General guidelines,2016
[23] Shi Y,Ji S,Zhang F,et al.(2021) Multi-frequency vibration mechanism and characteristics of transformer windings.High Voltage Engineering,47(7): 2536-2544

Scan for more details
Received:3 July 2023/Revised: 14 November 2023/Accepted:8 January 2024/Published: 25 April 2024
 Xiaojun Shen
xjshen79@163.com
Mingzhe Zhao
450191314@qq.com
Lei Su
maplewind@139.com
Zihang Dong
zihang.dong14@imperial.ac.uk
2096-5117/© 2024 Global Energy Interconnection Development and Cooperation Organization.Production and hosting by Elsevier B.V.on behalf of KeAi Communications Co.,Ltd.This is an open access article under the CC BY-NC-ND license (http://creativecommons.org/licenses/by-nc-nd/4.0/).
Biographies

Mingzhe Zhao is working towards master degree at Tongji University,Shanghai.His research interests includes vibration state perception.

Xiaojun Shen received the Ph.D.degree in electrical engineering from the Electrical Engineering Department,Shanghai Jiaotong University,Shanghai,China,in 2007.He is currently a Professor with the Department of Electrical Engineering,Tongji University,Shanghai.His main research directions are new energy-efficient utilization and energy saving,power equipment state perception and intelligent diagnosis.

Lei Su received the B.S.and M.S.degrees in electrical engineering from Shanghai Jiaotong University,Shanghai,China,in 2004 and 2007,respectively.He works in State Grid Shanghai Electric Power Research Institute.His main research area is online monitoring of the status of power transmission and transformation equipment.

Zihang Dong received B.Eng degree in EEE in 2014 from the University of Liverpool,UK.He received M.Sc.Degree and Ph.D.degree in Control Systems from Imperial College London,UK,in 2015 and 2019,respectively.He was a research associate at the EEE Department of Imperial College London.He is currently an Assistant Professor at the Department of Electrical Engineering of Tongji University.His research interests include predictive control,demand response and optimisation of energy systems operation.
(Editor Yajun Zou)
