0 Introduction
The rapid expansion of the Chinese economy has led to an increasingly urgent need for electricity.Consequently,ensuring the secure and stable operation of power grids has emerged as a critical concern,directly affecting the well-being and safety of the population.Currently,the development of power grids faces complex problems.The acquisition costs of equipment constitute a large proportion of the project investment and fluctuate frequently,exerting a growing influence on project costs.Therefore,accurately predicting the future price of power grid engineering equipment has positive and practical significance in the proper management and control of project costs,optimizing the bidding strategy of the main equipment and reducing the project investment risk.Power grid companies and suppliers often sign framework agreements before signing procurement contracts.If the price of raw materials significantly increases during the validity of a procurement contract,suppliers may have difficulty supplying quality products.If the price of raw materials significantly decreases,power grid companies may suffer from revenue loss owing to the gap between the procurement price and the current market price.Therefore,accurately predicting the price of raw materials of power grid equipment,such as power transformers,according to historical prices has great practical significance,particularly for controlling the cost of power grid projects and reducing the project investment risk.
Time series forecasting (TSF) is the most common and important application of time series tasks and is widely used in several fields,such as transportation planning [1],weather forecasting [2,3],and economic statistical analysis[4,5].By exploring the inner laws of a time series,the accurate forecasting of time variables can provide effective decisions and suggestions for public management and personal planning that have important economic value and significance.Existing time series forecasting methods can be broadly categorized into three types: first,forecasting methods based on traditional parametric models such as the history average models (HAs) [6],autoregressive integrated moving average models (ARIMAs) [7],and vector autoregressive models (VARs) [8];second,prediction methods based on traditional machine learning models such as decision trees (DTs) [9],support vector machines (SVMs)[10],and hidden Markov models (HMMs) [11];third,prediction methods based on deep learning models such as convolutional neural networks (CNNs) [12],recurrent neural networks (RNNs) [13],and Transformers [14].
In recent years,owing to the rapid growth in data volume and increased demand for accuracy in prediction tasks,the first two types of methods have become obsolete owing to the difficulty in realizing high-precision predictions on large amounts of data.Therefore,this study introduces deep learning model-based prediction methods.
The CNN implements time series forecasting by sensing changes in time series data over a certain time through a convolution kernel.The local weight-sharing structure of the CNN can enable the network to learn in parallel,thus improving the training efficiency.Canonical CNNs have problems such as poor ability to deal with large datasets and high memory consumption;therefore,many researchers have combined CNN with other algorithms or structures and proposed variants such as WaveNet CNN [15],K-means-CNN [16],and temporal convolutional network (TCN)[17].RNNs have a stronger learning capability than CNNs when dealing with sequential data by recognizing the sequential features of the data and using previous patterns during predictions.Training with vanilla RNNs is prone to the vanishing or exploding gradient problems.To address the disadvantages of the vanilla RNNs,models such as the Bi-RNNs [18],LSTMs [19],and gated recurrent units(GRUs) [20] have been derived.RNN-based models have been an important approach for solving the task of time series forecasting since their inception and have been the mainstay of time series forecasting until the appearance of the Transformer.Vaswani et al.proposed a Transformer that is structurally completely different from CNNs or RNNs,and this new deep learning framework relies entirely on the attention mechanism to characterize the global dependencies between the inputs and the outputs of the model.Compared with the vanilla RNN,even improved RNN-based models such as LSTM cannot completely avoid the vanishing and exploding gradient problems;however,this can be solved by the Transformer by having the longest path of only one.Although the Transformer has demonstrated high performance in a variety of time series tasks owing to its outstanding ability to capture long-term dependencies and interact with each other,many researchers have continued to improve the vanilla Transformer to develop models such as BERTs [21],informers [22],and conformers [23] to achieve higher performance.
However,achieving high forecasting accuracy using single forecasting models is difficult.Therefore,many researchers have combined different single forecasting models into hybrid forecasting models.Ray [24] introduced a novel hybrid of the ARIMA-LSTM model using a random forest algorithm to select suitable input lags for LSTM into volatile agricultural price prediction.Liu [25]proposed a novel forecasting framework of hourly stepwise forecasting for solar irradiance using integrated hybrid models CNN-LSTM-MLP combined with error correction and variational mode decomposition (VMD),and observed that the proposed model was superior to a large number of traditional alternative approaches in terms of accuracy and robustness.
According to previous literature,the decompositionaccumulation methods are widely used in the area of price forecasting because they enable easier building of predictors and save time than the hybrid methodology with many models.The decomposition-accumulation methods can enlarge a small sample of carbon price data to obtain more features for prediction by decomposing the original data.
Since Zhang [26] started predicting crude oil spot prices using a hybrid forecasting structure based on empirical mode decomposition (EMD) and feed-forward neural networks,the decomposition-accumulation methods have developed into mature forecasting literature.Methods such as wavelet transform [27],empirical wavelet transform (EWT) [28],EMD [29],ensemble empirical mode decomposition (EEMD) [30],complete ensemble empirical mode decomposition (CEEMD) [31],and Hilbert-Huang transform [32] are generally implemented in time series decomposition.The forecasting methods introduced previously are combined with time series decomposition methods into different decomposition-accumulation architectures,such as EMD-LSTM [32] and EEMD-GRU [33].
However,the prediction performance of the decomposition-accumulation method is unsatisfactory when extracting the temporal characteristics of the series.Therefore,this study introduces both CEEMD and EWT,which perform well in the field of signal decomposition,to perform a re-decomposition on the series and proposes a prediction method for the price of power transformer materials based on CEEMD and GRU.The proposed method adopts a decomposition-clustering-decompositionprediction-accumulation approach and can more deeply explore the intrinsic laws of the series.
The price formation mechanism of power transformer materials is complex and subject to the joint influence of various factors,causing the price to behave as a nonsmooth and nonlinear time series.Therefore,achieving high forecasting accuracy using traditional univariate time series forecasting methods is challenging.The proposed method can extract additional temporal characteristics of a series for accurate predictions of this time series.
The main contributions of this study are summarized as follows:
1) We introduced an ensemble forecasting architecture based on CEEMD and GRU for the price prediction of power transformer materials.The forecasting architecture improved the forecasting accuracy compared with existing decomposition methods.
2) To validate the proposed method,we conducted experiments on two of our newly published datasets that have a longer time span and are more representative of realworld power transformer material prices.
Specifically,the CEEMD algorithm was employed to decompose the original price series of power transformer materials,that exhibit significant fluctuations and irregular changes,into multiple smooth subsequences.The subsequences contained the temporal features of the original time series that helped to improve the prediction accuracy.Sample entropy [34] and K-means clustering[35] algorithms were used to cluster the price subsequences obtained from the CEEMD.Subsequences with similar characteristics were aggregated to further improve the prediction accuracy.The aggregation subsequence with a large sample entropy was further decomposed by the EWT.The multiple smooth subsequences obtained from the decomposition were input into the prediction model in a matrix format,whereas the aggregation subsequences with a small sample entropy were input into the prediction model in a vector format.For the prediction model,the GRU was selected to implement forecasting on the subsequences.
1 Price prediction framework for power transformer materials
The price prediction framework for power transformer materials proposed in this study is shown in Fig.1.

Fig.1 Price prediction framework for power transformer materials based on complete ensemble empirical mode decomposition (CEEMD) and gated recurrent unit (GRU)
First,considering that the price of power transformer materials is influenced by various factors,such as production costs and macro policies,the fluctuation amplitude is large,and the pattern of change is irregular,resulting in a nonstationary price sequence,making the prediction accuracy directly based on the original price sequence unsatisfactory.Therefore,CEEMD was introduced to decompose the price sequence of the original power transformer materials and transform the unstable original sequence into multiple stable and regular subsequences to enhance the forecasting results.
After obtaining multiple subsequences by decomposing the original sequence,the subsequences cannot be directly predicted owing to the high complexity of certain subsequences.Therefore,sample entropy and the K-means clustering algorithm were introduced to calculate the sample entropy value of each subsequence.Based on the sample entropy value,the K-means clustering algorithm was used for clustering.Owing to the high complexity of an aggregated sequence with a large sample entropy,direct prediction leads to low prediction accuracy and affects the final prediction result.Therefore,the EWT algorithm was introduced to decompose the nonlinear aggregated sequence into multiple subsequences with a more stable amplitude and frequency and more evident periodicity.Predicting these subsequences is more conducive to better extract the intrinsic characteristics of the original sequence.
In the selection of the prediction model,considering that the material price series is typically long,neural network models with simple structures such as BP,and RNN have poor predicting accuracy for long-term series.Thus,the GRU model was selected as the prediction model.The aggregated sequence with maximal sample entropy was predicted using the vector input,and the remaining aggregated sequences with small entropy were predicted using the matrix input.The final prediction result was obtained by accumulating the predicted results for all the aggregated sequences.
2 Power transformer material price prediction method
2.1 Power transformer material price sequence decomposition
CEEMD [36] is an enhanced data processing technique rooted in EMD and EEMD.It is commonly used in price forecasting to decompose price sequences.The CEEMD algorithm controls the noise level in each decomposition and retrieves the original data by adding IMFs.A flowchart of CEEMD is shown in Fig.2.
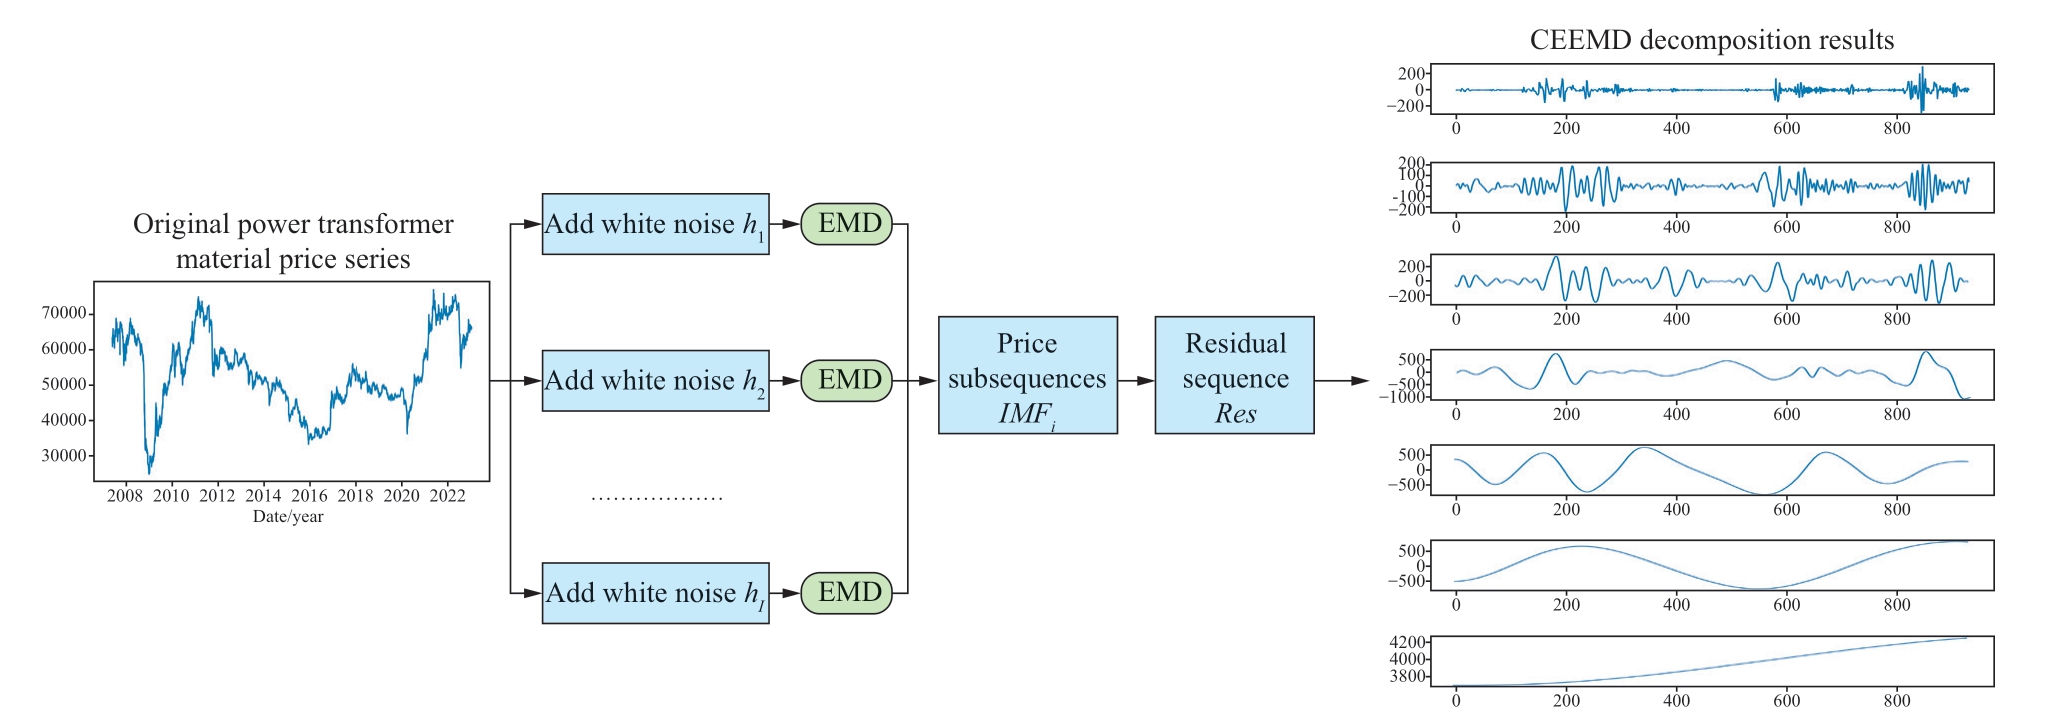
Fig.2 Flowchart of CEEMD
Let S denote the original power transformer material price series,IMFk denote the k-th IMF obtained using the CEEMD method,and ε denote the Gaussian white noise.The detailed steps of the CEEMD are as follows:
1) By adding I pairs of auxiliary Gaussian white noiseε to the original time-frequency series S,the original data with auxiliary noise are respectively denoted byM1,M2:
2) Use EMD to decompose the target signals.
3) Generate the results for each IMF by averaging 2I imfij.
4) Therefore,a total of M IMFs are obtained.The final residue is as follows:
The price series of power transformer materials can then be represented as the sum of residual Res and M price subsequences.
2.2 Price subsequences clustering
Among the price subsequences obtained after decomposing the price series of power transformer materials using the CEEMD,some subsequences have higher complexity that must be further reduced by clustering and decomposition again for easier prediction.In this study,we used sample entropy [37] to evaluate the complexity of each price subsequence and used the K-means clustering algorithm to cluster according to the sample entropy value to explore the temporal characteristics of price subsequences.
Sample entropy is an improvement of approximate entropy.Compared with approximate entropy,sample entropy reduces the reliance on the length of the data and exhibits improved consistency across a broader spectrum of parameter values.Generally,the larger the sample entropy of a sequence,the more complex the sequence is.
The sample entropy calculation process for a price series is as follows:
1) Given the original power transformer material price sequence x(n) with length N,we denote the embedding dimension by m.Then,we have an m-dimensional vector xm(i).
2) Distance dm between two vectors is defined as the maximum absolute difference between the corresponding elements of both vectors.
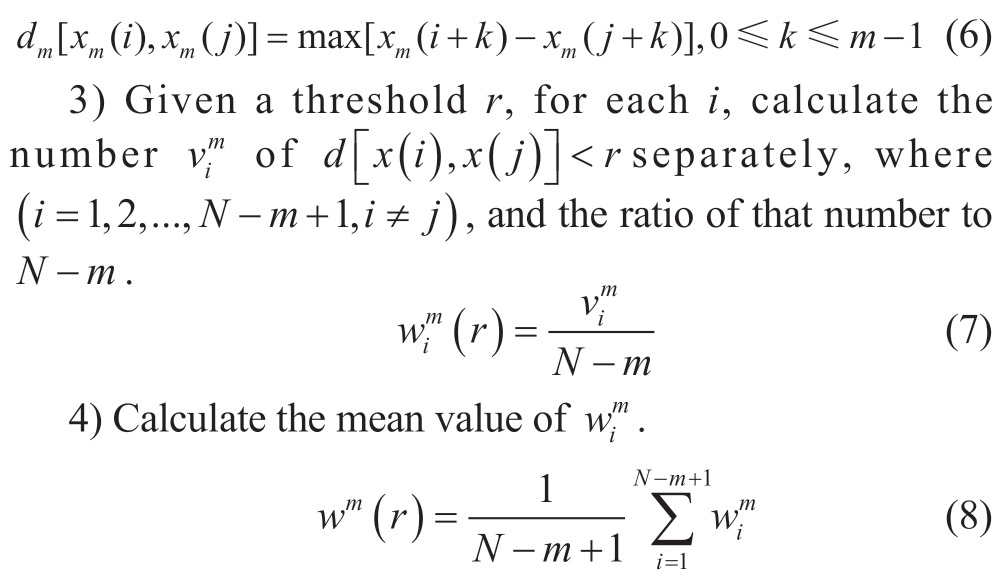
5) Repeat steps 1 to 4 for the wm+1(r) dimensional vector to obtain wm+1(r),and the sample entropy is calculated using formula (9).

When considering finite values,the estimate of the sample entropy of this price subsequence is obtained as follows:
After calculating the sample entropy of each price subsequence,clustering is performed according to the sample entropy value using the K-means [38] clustering algorithm.In the clustering process,the similarity between the sample and the prime is calculated,and the prime is updated iteratively,thus reducing the sum of squared errors(SSE) of the class clusters.
The clustering process of the K-means algorithm typically selects the Euclidean distance to evaluate the distance between sample entropy values,as in (11).xi,xj denote the sample entropy values of the price subsequence and d(xi,xj) denotes the distance between two sequences.
The SSE for measuring the clustering results is calculated as in (12).Zdenotes the number of clusters,and denotes the cluster center of the µth class.
The goal of K-means clustering is to minimize the SSE between similar samples;thus,price subsequence clustering is equivalent to the optimization problem of SSE,as in(13).Clusterr represents all aggregated sequences of price subsequences with the total number of clusters.
After the clustering process,M price subsequences are aggregated into Z aggregated price series.
2.3 EWT of aggregated price series
The EWT [39] is a signal mode decomposition method that organically combines the Fourier spectrum and wavelet decomposition.The theoretical basis of the EWT is wavelet analysis theory,and the method extracts the extreme points in the frequency domain.To distinguish between various modes within the aggregated price series,an adaptive segmentation of the Fourier spectrum is employed to identify the “meaningful” mode components,facilitating the process of mode decomposition.
For the Fourier spectrum,f(ω),of the original aggregated price series f(t),the local maxima of f(ω) are searched in [0,π],and K-1 boundaries ωn(n=1,2,...,K - 1) are determined in descending order,combiningω0=0 andωN=π to divide the interval into K consecutive segments.Kempirical wavelets are constructed based on the segmented spectrum,and empirical scale function (ω) and empirical wavelet
  (ω) are as follows:
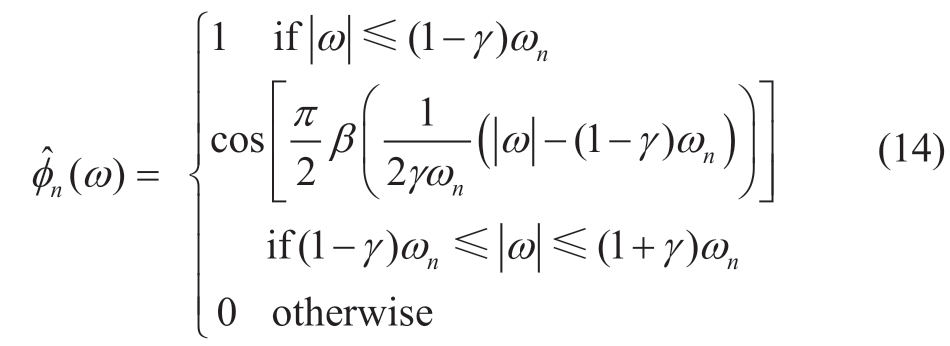
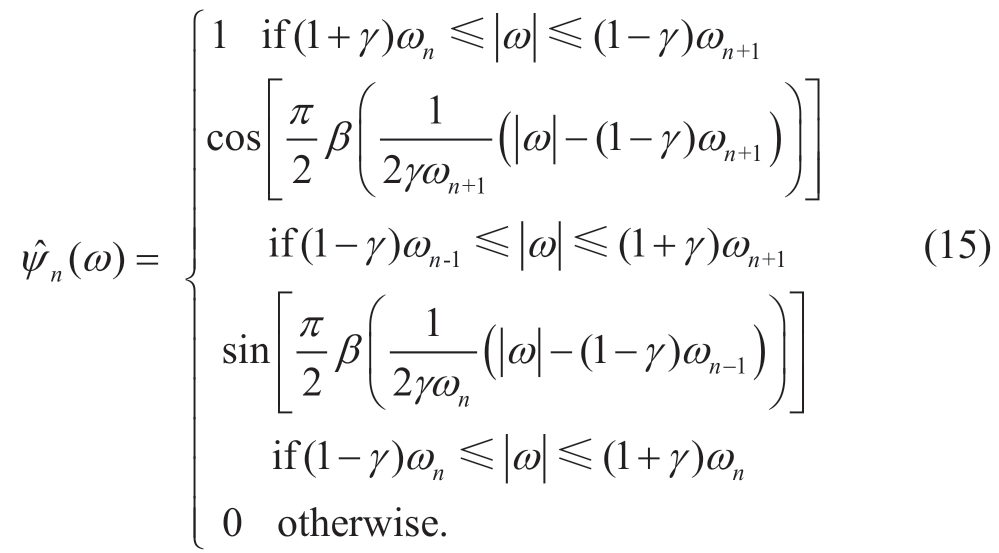
γ denotes the parameter that ensures that no overlap occurs between two consecutive transitions in (14) and (15).
Function β(x) is an arbitrary function defined as follows:

According to the classical form of the wavelet transform,define the detail correlation coefficients as  (n,t) and the approximate correlation coefficients as
  (0,t) of EWT.
 (n,t) is obtained from the inner product of empirical wavelet function
 (ω)and f(ω) as follows:

<,>denotes the inner product operation, denotes the complex copula,
 denotes the Fourier transform,and F-1() denotes the Fourier inverse transform.
Reconstruct the signal and obtain an expression for the reconstructed signal.
Low-frequency componentf0(t)and high-frequency component fk(t) are obtained as follows:

2.4 GRU-based aggregation sequence and subsequence prediction
LSTM [40,41] is a variant of the RNN model.Its most notable accomplishment is overcoming the issue of longterm dependencies that plague traditional RNNs.However,the complexity of the LSTM architecture introduces certain challenges,including extended training and prediction times.A GRU neural network [42] was proposed to solve these problems.Similar to an RNN,LSTM is connected by a series of memory modules;however,the LSTM adds structures such as the ForgetGate,InputGate,and OutputGate to combine long-and short-term memories through gate control to solve the problem of gradient instability [13].GRU improves the design of “gate” by integrating the ForgetGate and InputGate in the LSTM into the UpdateGate,that is,optimizing the original cell structure of the LSTM comprising three “gates” into a cell structure comprising two “gates.” Cell state fusion and other improvements have also been made.
In this study,a GRU was selected as the prediction model for price aggregation sequences and subsequences.The unit structure of the GRU is shown in Fig.3.
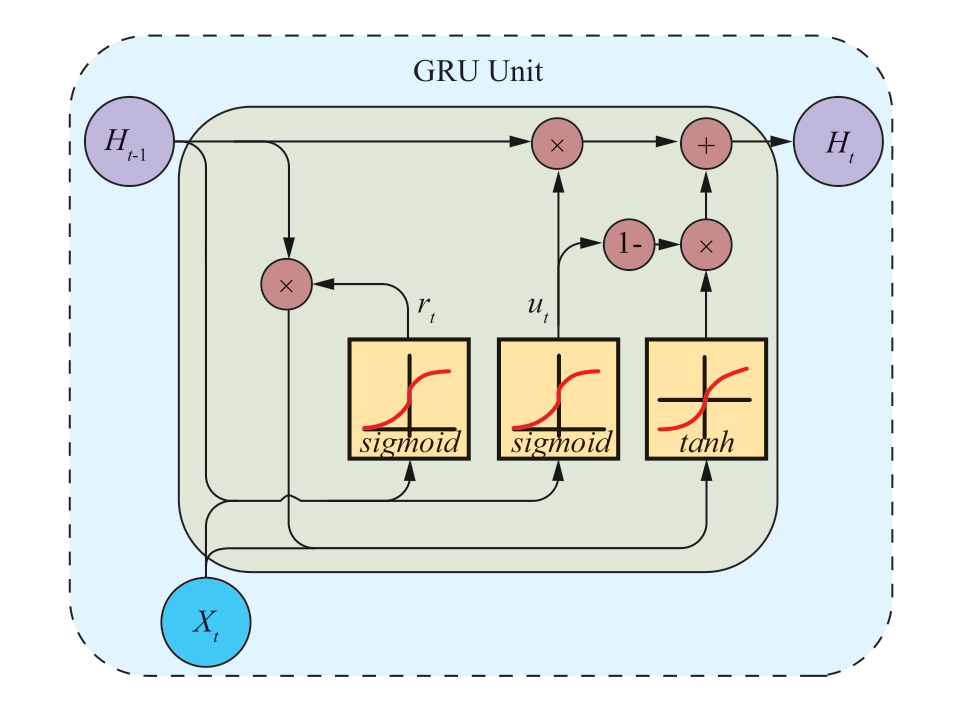
Fig.3 GRU model structure
As shown in Fig.3,the input of the current state,xt,and the output of the previous moment,ht-1,are concurrently input into the ResetGate and UpdateGate.In the case of inputting into the UpdateGate,Whu denotes the weight matrix of input state xt,Whu denotes the weight matrix of the output of the previous moment ht-1,and bu denotes the corresponding bias vector.In the case of inputting into the ResetGate,Wxr denotes the weight matrix of input state xt,Whr denotes the weight matrix of the output of the previous moment ht-1,and br denotes the corresponding bias vector.
The UpdateGate uses a sigmoid function as an activation function. represents a summary of the input and past hidden layer states.
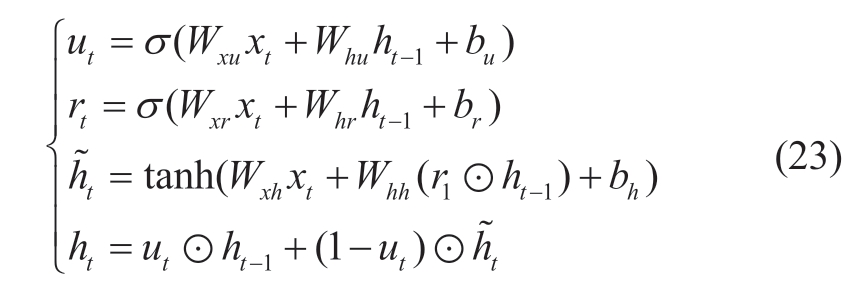
In this study,the GRU was used to predict multiple subsequences obtained by the EWT of the aggregation sequence.

where ![]() represent the values of the i-th subsequence at time T and
represent the values of the i-th subsequence at time T and ![]() represents the prediction value at time T+1.fpred represents a prediction operation based on the GRU model.
represents the prediction value at time T+1.fpred represents a prediction operation based on the GRU model.
When using GRU to predict a single price aggregation sequence,
where x1,x2,...,xTrepresent the values of T historical moments of the aggregation sequence, represents the predicted value at time T+1,and fpred represents the prediction operation based on the GRU model.
3 Case analysis
3.1 Datasets
In power grid projects,long-term fluctuations in raw material prices are the main factors that cause changes in the cost of power grid projects.Electrolytic copper is the main raw material for producing windings,a critical component of power transformers.Therefore,this study used real price data for electrolytic copper in the experiments.The fluctuations in the daily electrolytic copper price data used in this study are shown in Fig.4.

Fig.4 Electrolytic copper price change trend chart
Because weekly and monthly price forecasts are of greater significance than daily price forecasts for the cost control of power grid projects,this study employed two datasets to assess the prediction performance of the proposed method.The original data were the natively aggregated average electrolytic copper prices on all trading days from May 21,2007,to December 31,2022.It included 3895 data points.Dataset 1 included 807 data points related to the weekly average data of the original data.Dataset 2 included 188 data points related to the monthly average data of the original data.
During the experiment,the data spanning from the year 2007 to 2021 were used as both the training and validation sets at a ratio of 9:1.The data from the year 2022 were designated as the test set.
3.2 Evaluation metrics
The experiments used evaluation metrics,including the mean absolute error (MAE),root mean square error (RMSE),and mean absolute percentage error (MAPE) to evaluate the accuracy of the prediction and measure the deviation between the predicted and real values.
3.3 Experimental setup and parameter selection
The GRU network structure used for forecasting used a GRU layer as the input layer.Simultaneously,to mitigate overfitting,a dropout layer was incorporated after each GRU layer.Finally,a dense layer was used as the output of the model.
Table 1 presents the GRU network structure used to forecast the single price series.
Table 1 GRU network structure
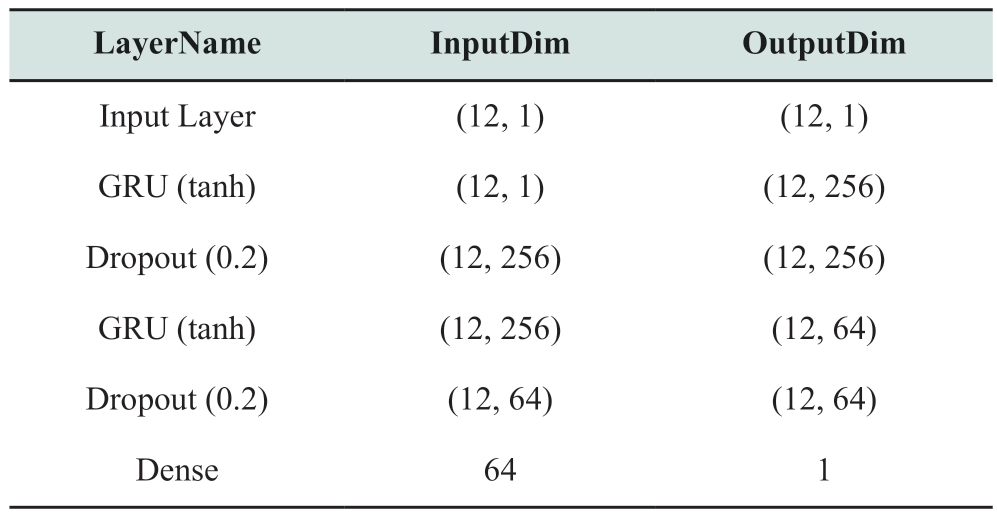
Parameter settings were epochs=1000,initial learning rate=0.1,batch size=10.
3.4 Analysis of prediction results
To assess the predictive performance of the proposed algorithm,this study conducted a comparative analysis with three other time series prediction methods: ARIMA,back propagation neural network (BPNN),and generic GRU.
The method proposed in this study used CEEMD to decompose the original price sequence of power transformer materials.Figure 5 displays the decomposition results of the price sequences of Dataset 1.As shown in Fig.5,the price subsequence obtained by decomposition was more stable than the original sequence,while retaining the time and space features of the original sequence.
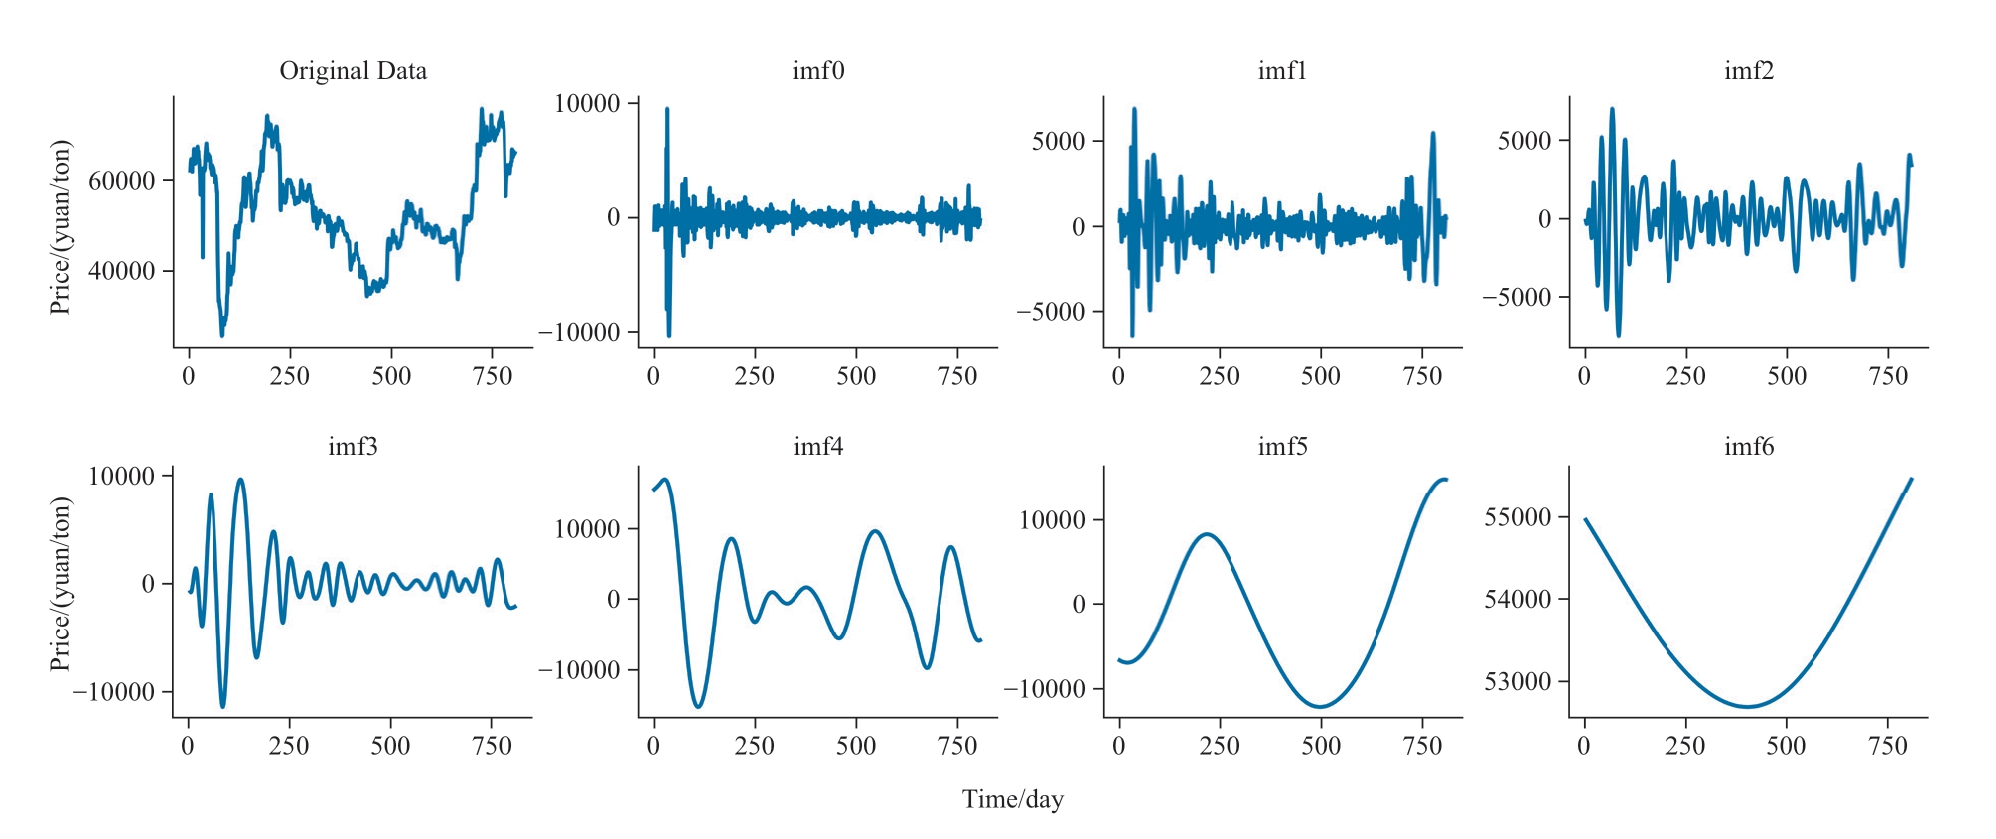
Fig.5 CEEMD decomposition results of price sequence of Dataset 1
Table 2 presents a comparison of the prediction results between the proposed method and other methods on Datasets 1 and 2.
Table 2 Comparison of the prediction results of different methods

The prediction results of the proposed method for the three aggregated sequences of Datasets 1 and 2 are shown in Fig.6.A comparative analysis of the predictions made by all the methods on Datasets 1 and 2 is shown in Figs.7 and 8,respectively.The predicted value curve obtained using our method was almost consistent with the real value curve,whereas the prediction results of the BPNN,ARIMA,and GRU had larger prediction errors.The evaluation metrics for the predicted results are listed in Table 2.For Dataset 1,the RMSE of the proposed method was 679.3 that was 50%,61%,and 60% lower than those of ARIMA,BPNN,and GRU,respectively.For Dataset 2,the MAPE of the proposed method was 2.47% that was 44%,44%,and 54% lower than those of ARIMA,BPNN,and GRU,respectively.
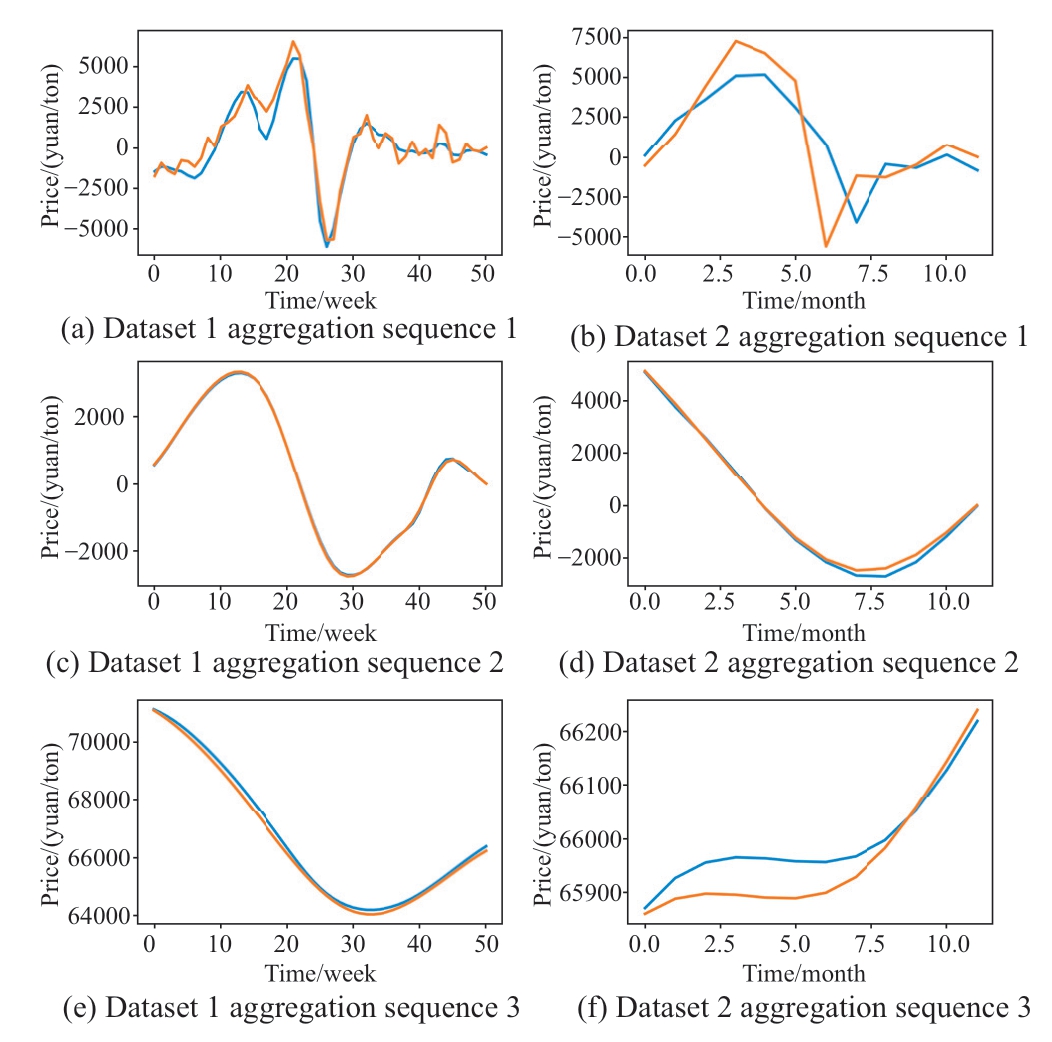
Fig.6 Prediction results of the three aggregation sequences of Datasets 1 and 2
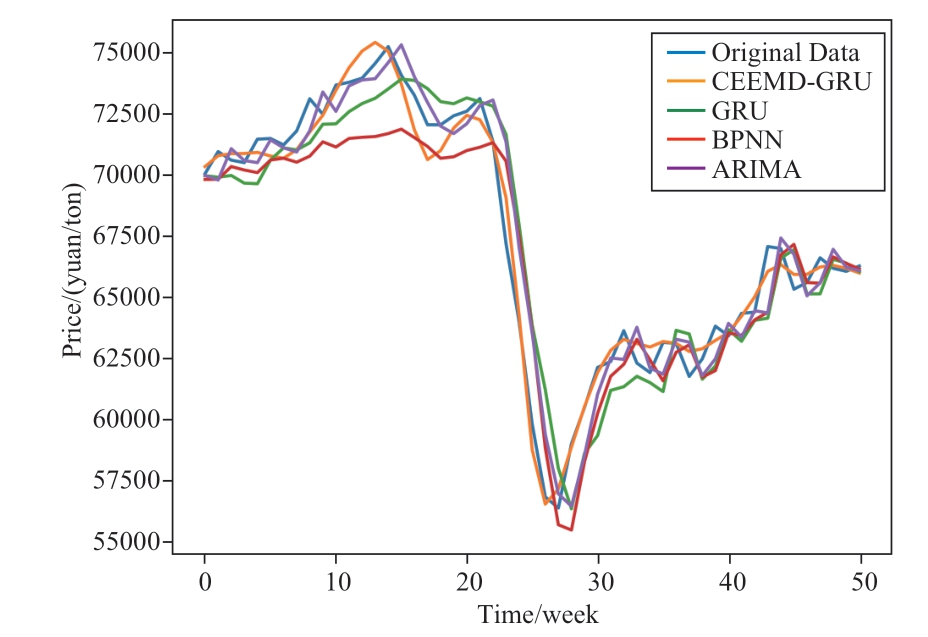
Fig.7 Comparison of the prediction results of each model on Dataset 1
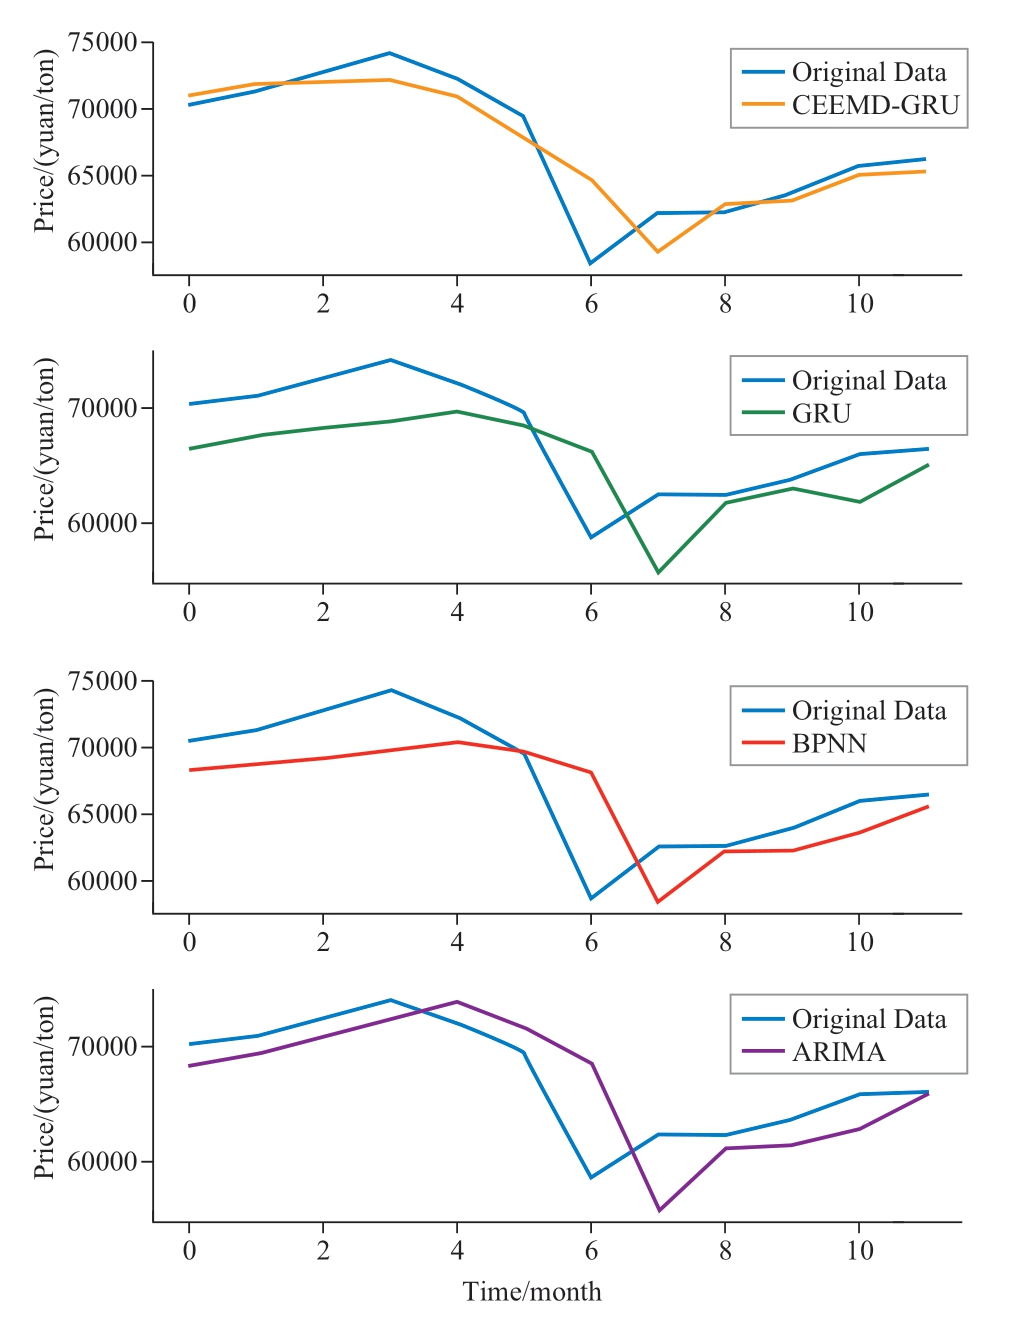
Fig.8 Comparison of the prediction results of each model on Dataset 2
Compared with other methods,the proposed approach exhibited superior performance in terms of MAE,RMSE,and MAPE on both Datasets 1 and 2.This is of great value for research on the price prediction of power transformer materials.
4 Conclusion
To improve the accuracy of price forecasting of power transformer materials,reduce project risks caused by price fluctuations,and further increase revenue through cost control,this study proposed a prediction method based on CEEMD and GRU.The price prediction method used CEEMD,K-means clustering,and EWT decomposition algorithms to extract the temporal characteristics of the price sequences,and then applied the GRU model to the sequences obtained from the decompositions.This method achieved high accuracy in the price prediction of power transformer materials.The key conclusions of this study are as follows.
1) The price sequence of the power transformer materials is non-stationary and nonlinear.The combination of algorithms,including CEEMD,EWT,and K-means clustering,could more effectively capture the inherent characteristics of a sequence and subsequently enhance the prediction accuracy.The proposed decompositionclustering-decomposition-prediction-accumulation method could extract more temporal features of time series than the traditional decomposition-accumulation method.
2) The experiments applied the proposed method to two datasets: weekly average price and monthly average price.For Dataset 1,the MAPE was 58% lower than the average values for the ARIMA,BPNN,and GRU,and the RMSE was 57% lower.For Dataset 2,the MAPE decreased by 48% and the RMSE decreased by 44% on average.The predictive performance of the proposed method surpassed that of the other methods.
In summary,the prediction method introduced in this study exhibited superior accuracy.This holds significant reference value for research related to the price prediction of power transformer materials.
Acknowledgments
This work was supported by China Southern Power Grid Science and Technology Innovation Research Project(000000KK52220052).
Declaration of Competing Interest
We declare that we have no conflict of interest.
References
[1] Qi X,Mei G,Tu J,et al.(2022) A deep learning approach for long-term traffic flow prediction with multifactor fusion using spatiotemporal graph convolutional network.IEEE Transactions on Intelligent Transportation Systems,24(8): 8687-8700
[2] Li L,Zhang Y,Fung J C H,et al.(2022) A coupled computational fluid dynamics and back-propagation neural network-based particle swarm optimizer algorithm for predicting and optimizing indoor air quality.Building and Environment,207: 108533
[3] Kabir S,Islam R U,Hossain M S,et al.(2022) An integrated approach of Belief Rule Base and Convolutional Neural Network to monitor air quality in Shanghai.Expert Systems with Applications,206: 117905
[4] Liu X,Guo J,Wang H,et al.(2022) Prediction of stock market index based on ISSA-BP neural network.Expert Systems with Applications,204: 117604
[5] Liu G,Ma W (2022) A quantum artificial neural network for stock closing price prediction.Information Sciences,598: 75-85
[6] Hobeika A G,Kim C K (1994) Traffic-flow-prediction systems based on upstream traffic.Proceedings of VNIS’94-1994 Vehicle Navigation and Information Systems Conference,Yokohama,Japan,345-350
[7] ArunKumar K E,Kalaga D V,Kumar C M S,et al.(2022)Comparative analysis of Gated Recurrent Units (GRU),long Short-Term memory (LSTM) cells,autoregressive Integrated moving average (ARIMA),seasonal autoregressive Integrated moving average (SARIMA) for forecasting COVID-19 trends.Alexandria Engineering Journal,61(10): 7585-7603
[8] Stock J H,Watson M W (2001) Vector autoregressions.Journal of Economic Perspectives,15(4): 101-115
[9] Quinlan J R (1986) Induction of decision trees.Machine Learning,1(1): 81-106
[10] Zhou J,Zhu S,Qiu Y,et al.(2022) Predicting tunnel squeezing using support vector machine optimized by whale optimization algorithm.Acta Geotechnica,17(4): 1343-1366
[11] Baum L E,Petrie T (1996) Statistical inference for probabilistic functions of finite state Markov chains.The Annals of Mathematical Statistics,37(6): 1554-1563
[12] Li Z,Liu F,Yang W,et al.(2021) A survey of convolutional neural networks: analysis,applications,and prospects.IEEE Transactions on Neural Networks and Learning Systems,33(12):6999-7019
[13] Yu Y,Si X,Hu C,et al.(2019) A review of recurrent neural networks: LSTM cells and network architectures.Neural Computation,31(7): 1235-1270
[14] Vaswani A,Shazeer N,Parmar N,et al.(2017) Attention is all you need.Advances in Neural Information Processing Systems,30: 5998-6008
[15] Borovykh A,Bohte S,Oosterlee C W (2017) Conditional time series forecasting with convolutional neural networks.arXiv preprint arXiv:1703.04691
[16] Dong X,Qian L,Huang L (2017) Short-term load forecasting in smart grid: A combined CNN and K-means clustering approach.2017 IEEE International Conference on Big Data and Smart Computing (BigComp),2017: 119-125
[17] Bai S,Kolter J Z,Koltun V (2018) An empirical evaluation of generic convolutional and recurrent networks for sequence modeling.arXiv preprint arXiv:1803.01271
[18] Schuster M,Paliwal K K (1997) Bidirectional recurrent neural networks.IEEE Transactions on Signal Processing,45(11):2673-2681
[19] Hochreiter S,Schmidhuber J (1997) Long short-term memory.Neural Computation,9(8): 1735-1780
[20] Cho K,Van Merriënboer B,Gulcehre C,et al.(2014) Learning phrase representations using RNN encoder-decoder for statistical machine translation.arXiv preprint arXiv:1406.1078
[21] Devlin J,Chang M W,Lee K,et al.(2018) Bert: Pre-training of deep bidirectional transformers for language understanding.arXiv preprint arXiv:1810.04805
[22] Zhou H,Zhang S,Peng J,et al.(2021) Informer: Beyond efficient transformer for long sequence time-series forecasting.Proceedings of the AAAI Conference on Artificial Intelligence,35(12): 11106-11115
[23] Li Y,Lu X,Xiong H,et al.(2023) Towards long-term time-series forecasting: Feature,pattern,and distribution.arXiv preprint arXiv:2301.02068
[24] Ray S,Lama A,Mishra P,et al.(2023) An ARIMA-LSTM model for predicting volatile agricultural price series with random forest technique.Applied Soft Computing,149: 110939
[25] Liu J,Huang X,Li Q,et al.(2023) Hourly stepwise forecasting for solar irradiance using integrated hybrid models CNNLSTM-MLP combined with error correction and VMD.Energy Conversion and Management,280: 116804
[26] Zhang X,Lai K,Wang S (2008) A new approach for crude oil price analysis based on empirical mode decomposition.Energy Economics,30(3): 905-918
[27] Daubechies I (1992) Ten lectures on wavelets.Society for Industrial and Applied Mathematics
[28] Gilles J (2013) Empirical wavelet transform.IEEE Transactions on Signal Processing,61(16): 3999-4010
[29] Huang N,Shen Z,Long S,et al (1998) The empirical mode decomposition and the Hilbert spectrum for nonlinear and nonstationary time series analysis.Proceedings of the Royal Society of London.Series A: Mathematical,Physical And Engineering Sciences,454: 903-995
[30] Wu Z,Huang N (2009) Ensemble empirical mode decomposition:a noise-assisted data analysis method.Advances in Adaptive Data Analysis,1(1): 1-41
[31] Yeh J R,Shieh J S,Huang N E (2010) Complementary ensemble empirical mode decomposition: A novel noise enhanced data analysis method.Advances in Adaptive Data Analysis,2(02):135-156
[32] Zhang Y,Li C,Jiang Y,et al.(2022) Accurate prediction of water quality in urban drainage network with integrated EMDLSTM model.Journal of Cleaner Production,354: 131724
[33] Liu X,Li N,Guo J,et al.(2022) Multistep-ahead prediction of ocean SSTA based on hybrid empirical mode decomposition and gated recurrent unit model.IEEE Journal of Selected Topics in Applied Earth Observations and Remote Sensing,15: 7525-7538
[34] Richman J S,Moorman J R (2000) Physiological time-series analysis using approximate entropy and sample entropy.American Journal of Physiology-Heart and Circulatory Physiology,278(6): H2039-H2049
[35] Mussabayev R,Mladenovic N,Jarboui B,et al.(2023) How to use K-means for big data clustering.Pattern Recognition,137:109269
[36] Ding Y,Chen Z,Zhang H,et al.(2022) A short-term wind power prediction model based on CEEMD and WOA-KELM.Renewable Energy,189: 188-198
[37] Delgado B A,Marshak A (2019) Approximate entropy and sample entropy: A comprehensive tutorial.Entropy,21(6): 541
[38] Ikotun A M,Ezugwu A E,Abualigah L,et al.(2023) K-means clustering algorithms: A comprehensive review,variants analysis,and advances in the era of big data.Information Sciences,622:178-210
[39] Karijadi I,Chou S Y,Dewabharata A (2023) Wind power forecasting based on hybrid CEEMDAN-EWT deep learning method.Renewable Energy,218: 119357
[40] Jin R,Chen Z,Wu K,et al.(2022) Bi-LSTM-based two-stream network for machine remaining useful life prediction.IEEE Transactions on Instrumentation and Measurement,71: 1-10
[41] Li C,Dong Z,Ding L,et al.(2022) Interpretable memristive LSTM network design for probabilistic residential load forecasting.IEEE Transactions on Circuits and Systems I:Regular Papers,69(6): 2297-231
[42] Fang W,Zhang S,Xu C (2024) Improving prediction efficiency of Chinese stock index futures intraday price by VIX-Lasso-GRU Model.Expert Systems with Applications,238: 121968

Scan for more details
Received:11 August 2023/Revised: 22 January 2024/Accepted:3 March 2024/Published: 25 April 2024
 Yan Huang
huangyan@csg.cn
Yufeng Hu
huyf@csg.cn
Liangzheng Wu
wulz@csg.cn
Shangyong Wen
wensy@csg.cn
Zhengdong Wan
wanzd@csg.cn
2096-5117/© 2024 Global Energy Interconnection Development and Cooperation Organization.Production and hosting by Elsevier B.V.on behalf of KeAi Communications Co.,Ltd.This is an open access article under the CC BY-NC-ND license (http://creativecommons.org/licenses/by-nc-nd/4.0/).
Biographies

Yan Huang received a master’s degree from North China Electric Power University,Beijing,in 2005.She is working at the Energy Development Research Institute,China Southern Power Grid.Her research interests include economic engineering and project management.

Yufeng Hu received a Ph.D.degree in power system automation from Huazhong University of Science and Technology,Wuhan,in 2004.He is working at the China Southern Power Grid.His research interests include power system automation and related scientific innovation.

Liangzheng Wu received a master’s degree from Jilin University,Changchun,in 2007.He is working at the Energy Development Research Institute,China Southern Power Grid.His research interests include preproject evaluation,post-project evaluation,and project management.

Shangyong Wen received a master’s degree from Wuhan University,Wuhan,in 2001.He is working at the Power Construction Quota Station,China Southern Power Grid.His research interests include technological economics and project management.

Zhengdong Wan received his master’s degree from Harbin Institute of Technology.Harbin,in 2009,He is working at the Energy Development Research Institute,China Southern Power Grid.His research interests include economic engineering and cost study of power grid projects.
(Editor Yajun Zou)
