0 Introduction
The rapid evolution of economy and society has led to an ever-increasing demand for diverse energy resources,and extensive utilization of fossil fuels has led to severe environmental problems [1,2].Consequently,discourses surrounding sustainable and eco-conscious energy systems have progressively emerged as a focal point [3,4].Urban energy systems (UESs) with multiple energy complements are gradually becoming a solution to these problems.A UES is envisioned as an entity capable of harnessing a spectrum of clean energy resources,facilitating their conversion,and optimizing their efficient utilization.
Presently,the predominant emphasis in scholarly inquiry revolves around energy system modeling [5],energy management [6],and the pursuit for optimal operational strategies [7].Comprehensive evaluation has become an essential part of the implementation and operation of UESs[8,9].This determines the manner in which the system is built and operated.Evaluation involves the establishment of an evaluation system,data processing,results analysis,and other aspects.However,to date,only a few studies have been conducted on this topic.
Concerning evaluation frameworks,extant research predominantly converges on singular or limited indexes,such as environmental protection,economy,and system reliability.In [10],the authors advocated an economicenvironmental-energy benefit analysis to evaluate integrated energy system operations based on green hydrogen.[11]proposed an evaluation framework based on a systemsystem analysis method.In [12],the environmental,economic,energy efficiency,and social contributions were used to evaluate a wind-light-combined cooling heating and power (CCHP) system.In [13],the authors constructed an evaluation system based on economy,environmental protection,and energy efficiency.In [14],energy,exergy,and economy,namely the 3E evaluation,were used to perform a dynamic thermal evaluation of CCHP systems.Kong et al.[15] built an evaluation system containing economy,technology,and environment to perform a comprehensive energy efficiency evaluation of energy systems.For the overall evaluation of the system,the greater the number of evaluation indexes and dimensions,the more accurate the evaluation results.However,few studies have evaluated the system in terms of multiple dimensions.
Evaluation indexes are selected by individuals,and there may be overlapping information between them.Ref[16-18] selected the maintenance cost and installed unit equipment cost;duration of the unqualified voltage and current imbalance rate;and unit carbon emissions,sulfur emissions,and nitrogen emissions as the evaluation indexes,respectively.Evidently,there is some correlation between the indexes.For the evaluation method,ref [19]achieved a comprehensive energy-efficiency assessment of CCHP systems by combining the gray correlation and entropy weight methods.Ref [20] evaluated several CCHP systems using a fuzzy multi-criteria decision model that combined the gray correlation and combined weight methods.Ref [21] applied combined weights and the cumulative prospect theory-modified PROMETHEEⅡ for a comprehensive evaluation.Ref [22] used a health index system and Mahalanobis distance to perform the evaluation.Nevertheless,overlapping information and indexes not only lead to a large number of calculations but also affect the results by overlapping information,which makes it difficult to ensure the rationality of the decision.
Furthermore,most of the literature only established evaluation models from “network”,“load”,and “storage”individually [23,24],and few established evaluation models from the entire process of source,network,load,and energy storage.Whether this method can be applied to evaluate the effectiveness of multiple energy complementarities in UESs remains debatable.
The construction and operation of UESs are complex.Therefore,this study constructs a multidimensional evaluation system for UESs oriented toward low-carbon environmental protection,economy,and steady operation based on the consideration of the system construction and operation.The contributions of this study are as follows:
1) Considering the system’s energy utilization,environmental protection,economy,operation,and other dimensions,this study constructed a low-carbon UES evaluation framework covering four major categories and 21 indexes.Therefore,a whole-chain evaluation system was established.This comprehensively describes the operation of the UES.
2) The evaluation and analysis algorithm of “data dimensionality reduction-comprehensive weights-gray correlation analysis” is proposed.It can downsize multiple indexes to a few,significantly reducing the impact of information overlap in the case of multiple indexes and reduce calculations.
3) Construction and operation scenarios were designed to address the construction and operation characteristics of UESs,and each scenario was comprehensively evaluated to provide a reference for the construction and operation of UESs.
The remainder of this paper is organized as follows:Section 1 considers the characteristics of the UES and proposes an evaluation system.Section 2 describes the process of energy efficiency evaluation.In Section 3,the applicability of the proposed evaluation system and method is verified through a case study.Finally,Section 4 presents our conclusions.
1 Energy efficiency evaluation system for UES
A UES consists of multiple clusters of micro-energy systems (MES) within a city.An MES is a district energy system supplied with energy from solar,wind,natural gas,etc.and is connected to an external utility grid and a natural gas network.The system also includes gas turbines,boilers,absorption chillers,heat exchangers,and electric chiller equipment.In each MES,the load may consist of residential users,businesses,industries,and schools.People can make full use of the resources within the MES to obtain the electric,thermal,and cooling energy that they need in their daily lives.
As shown in Fig.1,each subsystem (i.e.,MES1,MES2,and MES3) operates according to the micro-energy system model.Each MES is connected to a control center and is based on the interaction of energy and information with different MESs.The operation status of the equipment was controlled in real time,and coordination and optimization of multiple energy resources were achieved.Multiple MESs constitute a UES.The UES covered a wide area and efficiently controlled the operation of each internal MES.
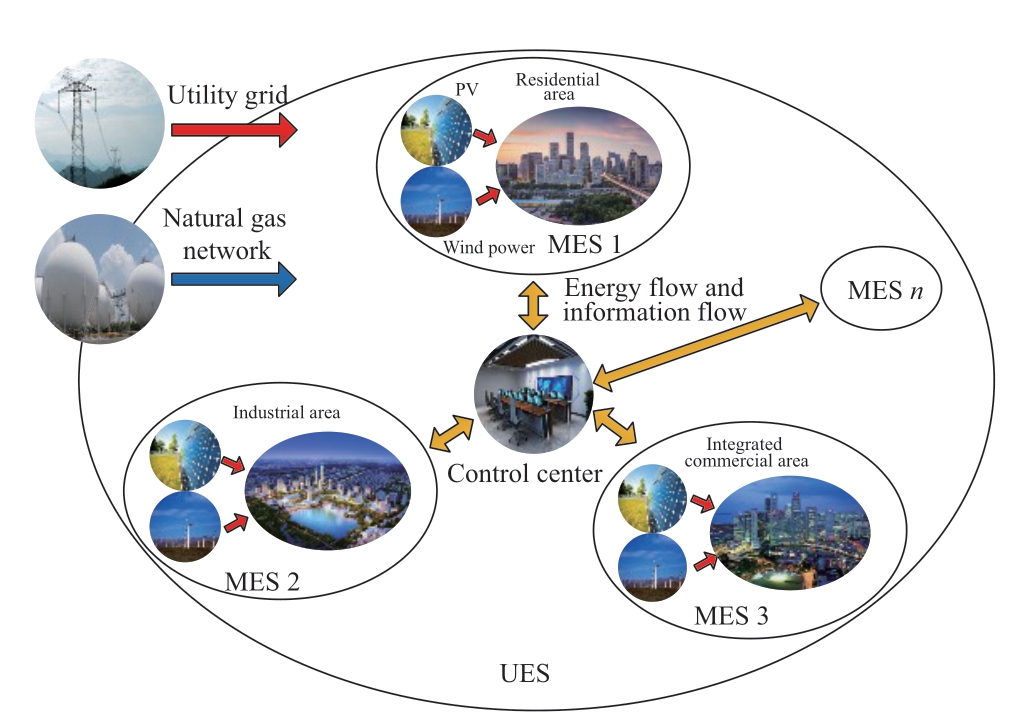
Fig.1 Structure of urban energy system
The characterization of UES features requires a lot of “details” and indexes.In practice,most indexes have overlapping information,resulting in an evaluation system that cannot fully achieve independence and irrelevance.In this study,the four aspects of energy utilization,environmental protection,system operation,and economic benefits were selected as the primary indexes,as shown in Fig.2.
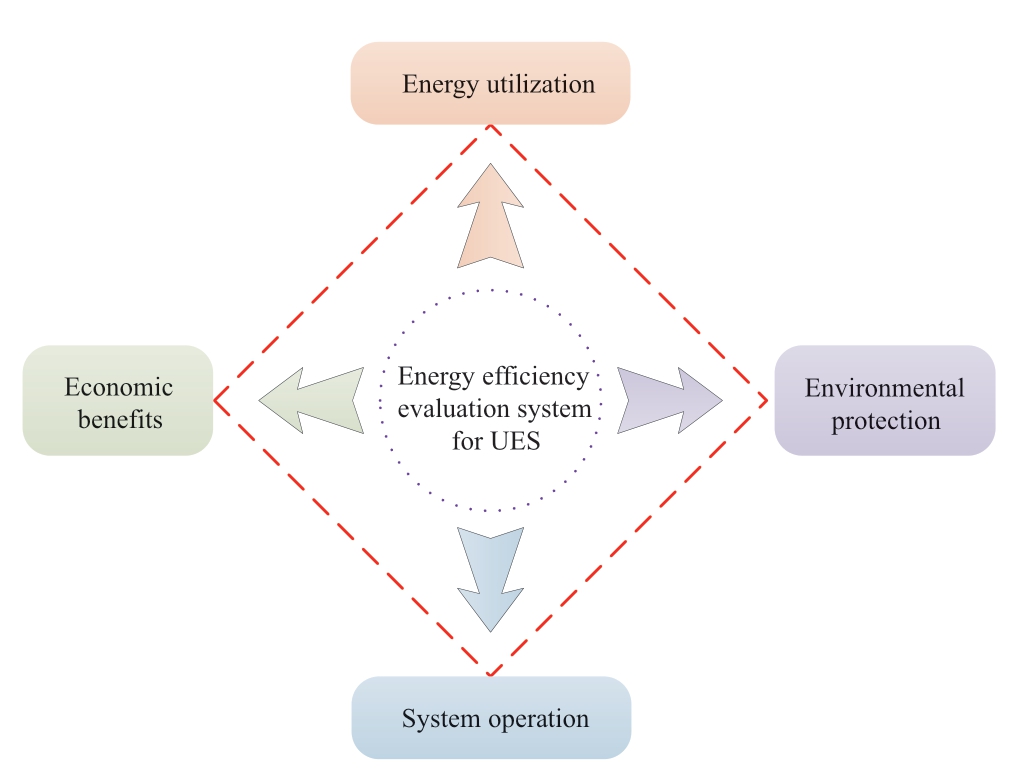
Fig.2 Energy efficiency evaluation system for UES
The four primary indexes fully reflect the system’s environmental protection,low carbon emissions,energy utilization,operation level,economic behavior,and reliability.Each primary index contains several secondary indexes that describe the system.Table 1 presents the effectiveness assessment system with 4 primary indexes and 21 secondary indexes.
Table 1 Evaluation system

continue

It should be noted that the evaluation system outlined in this paper is for reference purposes only.In practice,evaluation systems can have dozens or even hundreds of indexes.
Some of the significant evaluation indexes are calculated as follows.
1) Energy use efficiency
Energy utilization efficiency represents the level of the system’s utilization of input energy,defined as the ratio of the total energy demanded by the system load to the total energy input.In this study,the ratio of the total system energy demand to the total primary energy consumption was used as the comprehensive energy utilization rate,which was calculated as follows:
Where Ee denotes the total electric energy demand,Qh denotes the total thermal energy demand,Qc denotes the total cooling energy demand,and QΣ denotes the total primary energy consumption of the system.
Because the energy inputs to the system are mainly natural gas,wind energy,solar energy,and externally purchased electricity,the total primary energy consumption QΣ can be calculated using the following formula:

where Qgas is the thermal value of the system input natural gas,Qwind is the wind energy,Qsolar is the solar energy,Eout is the total amount of external purchased electricity of the system,and ηe and φe is the conversion efficiency of coal,electricity,and grid line loss.
2) Carbon,sulfur,and nitrogen emissions
System operations require coal combustion,which inevitably emits carbon dioxide,sulfur dioxide,nitrogen oxides,and solid waste.This study uses carbon emissions,sulfur emissions,nitrogen emissions,and solid waste indexes to measure the impact of the system on the environment.The calculations are as follows:
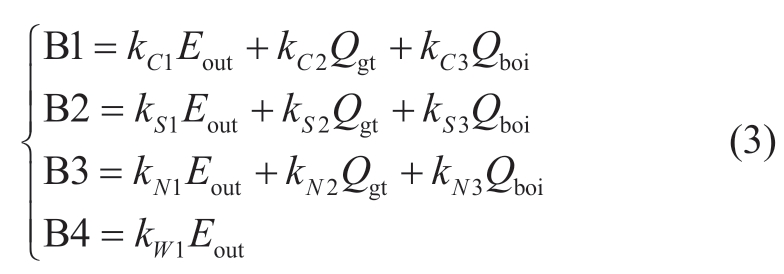
where kC1,kC2,and kC3 denote the carbon dioxide emission coefficients from external power purchases,gas turbines,and boilers,respectively;kS1,kS2,and kS3 denote the sulfide coefficients from external power purchases,gas turbines,and boilers,respectively;kN1,kN2,and kN3 denote the nitrogen oxide emission coefficients from external power purchases,gas turbines,and boilers,respectively;and kW1 is the solid waste emission coefficient from thermal power generation.
3) Peak shaving and valley filling of the electric load
Peak shaving and valley filling of the electric load reflect the utilization rate of the electrical equipment.The smaller the peak-to-valley difference in the external power purchase,the higher the utilization rate,and the better the peak-shaving effect of the system.The index is calculated as follows:
where pgridmax is the maximum value of external power purchase and pgridmin is the minimum value of external power purchase.
4) Grid fluctuations
Grid fluctuations reflect the impact of the system on the utility grid when utility power is used.The smaller the difference between the external power purchases of the system at each moment,the smaller the fluctuation in the utility and the more stable the grid operation.The calculation is as follows:
where T is the dispatch time in a cycle,pgrid(t) is the external power purchased by the system at time t,and (t) is the average value of the external power purchased.
5) Reliability of energy supply
The reliability of the energy supply in the system decreases owing to the inevitable failure of equipment during operation.The reliability of the system equipment is expressed as follows:
where pe is the probability of failure of the system electrical equipment,ph is the probability of failure of the system heating equipment,and pc is the probability of failure of the system cooling equipment.
6) Substation capacity
The substation capacity reflects the capacity of the substation to satisfy the power demand within the system.The smaller the substation capacity,the smaller the peak load of the purchased power outside the system.In this study,the substation capacity was set to 1.2 times the peak load of the power purchased outside the system,as shown in the following equation:
2 Methodology of energy efficiency evaluation
Because UESs encompass the supply and consumption of multiple heterogeneous energy resources,a UES becomes a nonlinear system with highly coupled multi-physical quantities.System operation data will grow geometrically,and the computational volume of energy-efficiency analysis and evaluation will increase sharply.
Considering the large number of indexes in the evaluation system and the correlations between different indexes,this study first processed and downscaled the data to generate a new evaluation system that reduced the calculation volume.Subsequently,a comprehensive weighting method that considers subjective and objective situations was used to assign weights to each new index.Finally,a comprehensive evaluation was conducted using the gray correlation method.
2.1 Original data processing and the generation of a new evaluation system
2.1.1 Original data processing
Different indexes contain different scales,and direct analysis will cause distortion of the results;therefore,the original data must be processed before the energy efficiency evaluation.The original data can be expressed as a matrix S as follows:
where A,B,C,and D represent the partitioned matrices of the values for each evaluation object on the primary indexes A,B,C,and D,respectively.
Taking the partitioned matrix A as an example,this can be expressed by the following equation:
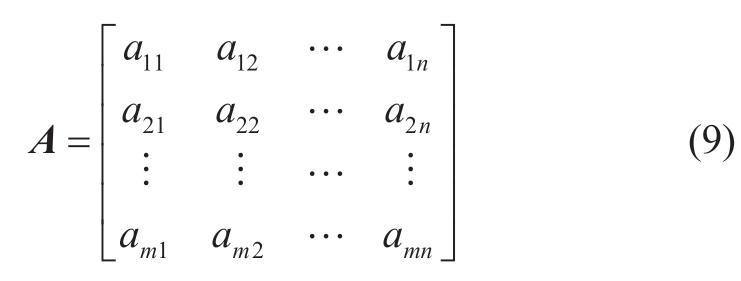
where m is the number of evaluation objects and n is the number of indexes in primary index A;in this paper,n=4.
In matrix A,the data contain the same magnitude as the column vectors of the matrix so that data under the same index can be processed.In this study,the 0-1 transformation method was used to process the data.Considering the nature of each index in the evaluation system,the data can be divided into benefit and cost types.
Benefit-type data have the feature that the larger the value,the better the effect.The processing method is as follows.

where  is the value of the j-th index of the i-th evaluated object after processing.
Cost-type data are data in which the larger the value,the worse the result.The processing method is as follows.

After original data processing,the original matrix A is transformed into the matrix  ,which is
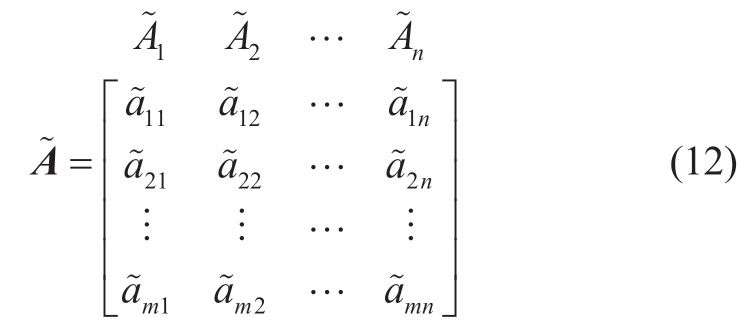
where  is n-th index,and represents the value of the n-th index.
2.1.2 Data downscaling and generation of new index system
The energy efficiency evaluation system contained four primary indexes and 21 secondary indexes.A direct analysis of the 21 indexes would result in a large number of calculations.
Therefore,we used principal component analysis to select the most influential indexes in each primary index to realize decoupling and the dimensionality reduction of the data.The score of each primary index was then calculated using the more influential indexes.
Step 1: Calculation of the correlation coefficients among the indexes.
We still consider the partitioned matrix A as an example.The correlation coefficient matrix R=(rij)n×n of matrix  was calculated to remove overlapping information among the indexes,as follows:

where rij is the correlation coefficient between the i-th and j-th indexes.
Step 2: Calculation of the eigenvalues and eigenvectors of the correlation coefficient matrix R.
We calculate the eigenvalues of the correlation coefficient matrix R according to the characteristic equation![]() =0,sort each eigenvalue from largest to smallest,and calculate the orthogonalized eigenvector of each eigenvalue.After the orthogonalization transformation,the n original indexes can be transformed into n principal components,as shown in the following equation.
=0,sort each eigenvalue from largest to smallest,and calculate the orthogonalized eigenvector of each eigenvalue.After the orthogonalization transformation,the n original indexes can be transformed into n principal components,as shown in the following equation.
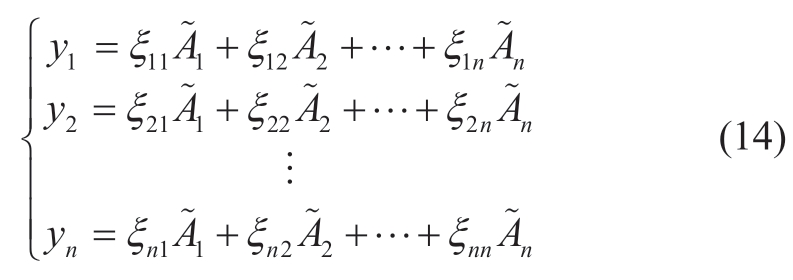
where y1,y2,…,yn are the n principal components after transformation and ξi1,ξi2,…,ξ in represents the eigenvectors of the i-th eigenvalue.
In general,the first two principal components,y1 and y2 reflect more than 85% of the information in the original data.Thus,we chose y1 and y2 for further analyses.
Step 3: Comprehensive score of primary index A.
According to (15) and using the principal components to calculate the comprehensive score,the comprehensive score of the object can be obtained.

where gm is the comprehensive score of the m-th evaluation object,and ymk is the value of the k-th principal component of the m-th evaluation object.
The comprehensive score gm can be used as the value of the primary index A of the m-th evaluation object.
Step 4: New index and evaluation system.
Similarly,we can obtain the values of the rest of the primary indexes by downscaling the secondary indexes of the other primary indexes.The primary indexes with value can then be regarded as the new index.The transformed data of the new index and evaluation system can be expressed as matrix 
In this manner,we formed a new index and evaluation system consisting of four indexes.We only needed to analyze four indexes instead of analyzing 21 secondary indexes.The number of subsequent analyses and calculations was reduced by 80.95%.
Fig.3 illustrates the generation of the new index and evaluation system.
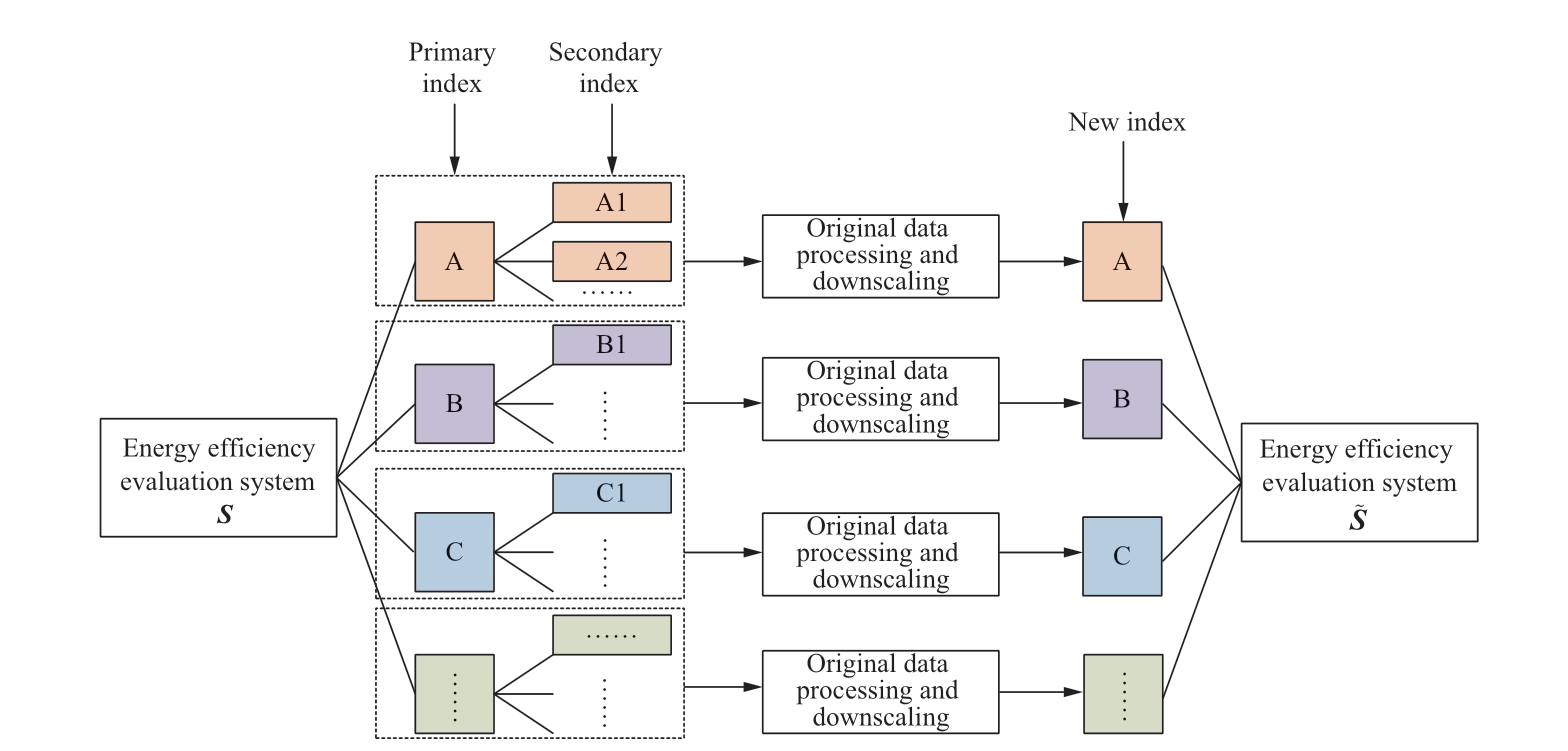
Fig.3 Generation of a new index and evaluation system
2.2 Comprehensive weights of indexes
This study considers the advantages of subjective and objective weights and constructs comprehensive weights.
2.2.1 Subjective weights
Subjective weights were assigned to each new index with full consideration of expert opinions,as shown in the following equation:
where ωj is the weight of the j-th new index.In this paper,j=4.
2.2.2 Objective weights
In this study,the entropy weight method was used to calculate the objective weights.
Step 1: Calculate the characteristic weight of the j-th new index of the i-th evaluation object,as shown in the following equation:

where  is the value of the j-th new index of the i-th evaluation object from
Step 2: Calculate the entropy value of the j-th new index,as shown in the following equation:
Step 3: Calculate the coefficient of variation of the j-th new index,as shown in the following equation:
Step 4: Calculate the weight of the j-th new index.
When ej→1,the entropy weights calculated by (19)lead to large differences in the entropy weights of indexes with small differences in the entropy values,which is obviously unrealistic.To prevent unreasonable situations,we adopted improved weights,as shown in the following equation:
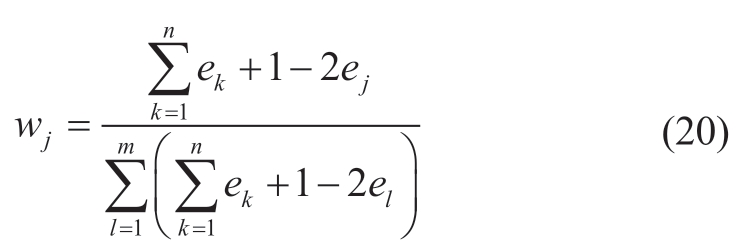
2.2.3 Comprehensive weights
To highlight the characteristics of subjective and objective weights,this paper represents the ratio of subjective and objective weights by setting the threshold coefficient λ,and then generates the comprehensive weights.The comprehensive weight θj considering the threshold coefficient is shown in the following equation.
2.3 Comprehensive evaluation of UES
The gray correlation analysis is a quantitative analysis of the similarities between influencing factors and behavioral outcomes.The steps of the analysis are as follows.
Step 1: Determine the evaluation criteria.
Let x0={ x0 (k )|k =1,2,…,h} be a reference series.Because there are four new indexes in this study,h=4.The evaluation criteria are calculated using the following equations:

Similarly,let xi={ xi (k )|k =1,2,3,4} be the comparison series of the i-th object,which can be calculated as follows:

Step 2: Calculate the gray correlation coefficient.
Calculate the correlation coefficient according to (24).

where ζi(k) is the correlation coefficient of the k-th new index of the i-th object and τ∈[0,1] is the discrimination coefficient.
Step 3: Evaluation analysis.
The gray correlation weight degree is calculated as shown in the following equation.
The evaluation objects are ranked according to the magnitude of the gray weight correlation degree ri,the evaluation objects are ranked,and the larger the correlation degree,the better the evaluation results.
The flow chart of energy efficiency evaluation for the UES is shown in Fig.4.
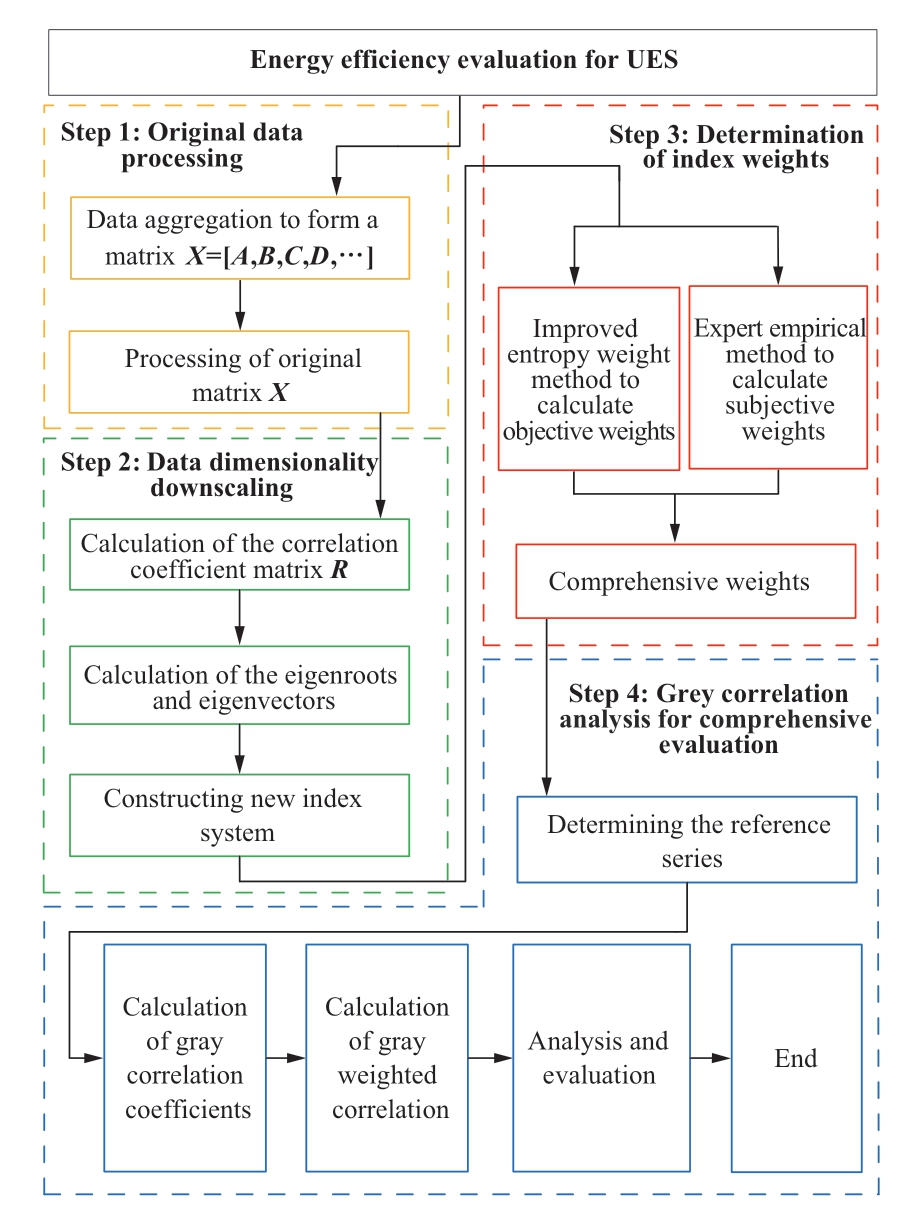
Fig.4 Process of energy efficiency assessment for UES
3 Case Study
3.1 Scenarios
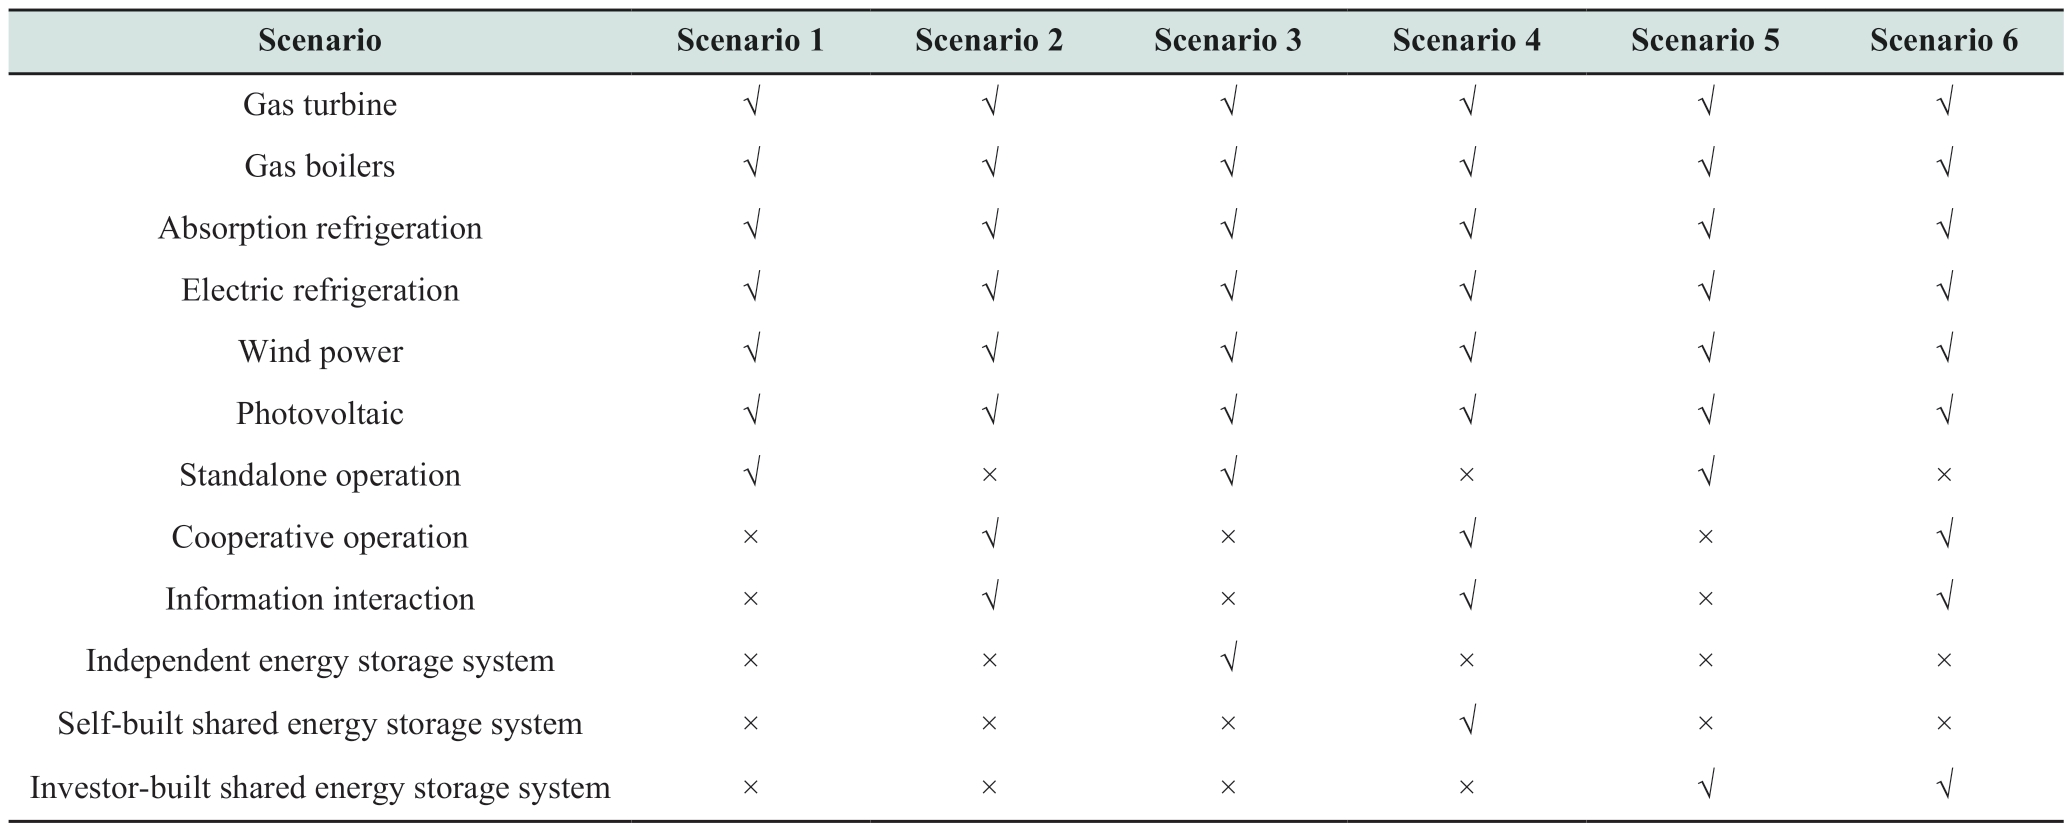
A UES model was constructed to verify the proposed method.Considering the actual construction and operation of the system,six scenarios were proposed in this study.Combined with the system operation data from [25],simulation calculations were performed for each scenario,and the results were used for energy efficiency assessment.The six scenarios are as follows:
Scenario 1: The three parks operate independently,with no energy or information interaction between the parks,and no energy storage equipment.
Scenario 2: The three parks operate together as a whole,and there is an energy interaction between the parks;however,there are no energy storage equipment in the parks.
Scenario 3: Each park operates independently,with no energy or information interaction between the parks;however,each park has its own independent energy storage equipment.
Scenario 4: The three parks operate together as a whole,with energy interactions between the parks and self-built energy storage equipment in each park.
Scenario 5: Each of the three parks operates independently;there is no energy or information interaction between the parks,and local investors build shared energy storage equipment.
Scenario 6: The three parks operate together as a whole,with local investors building shared energy storage equipment.Each park interacts with energy and shares information to achieve collaborative operation.
The six scenarios are configured in Table 2.
Table 2 Configuration of six scenarios
3.2 Energy efficiency evaluation and results
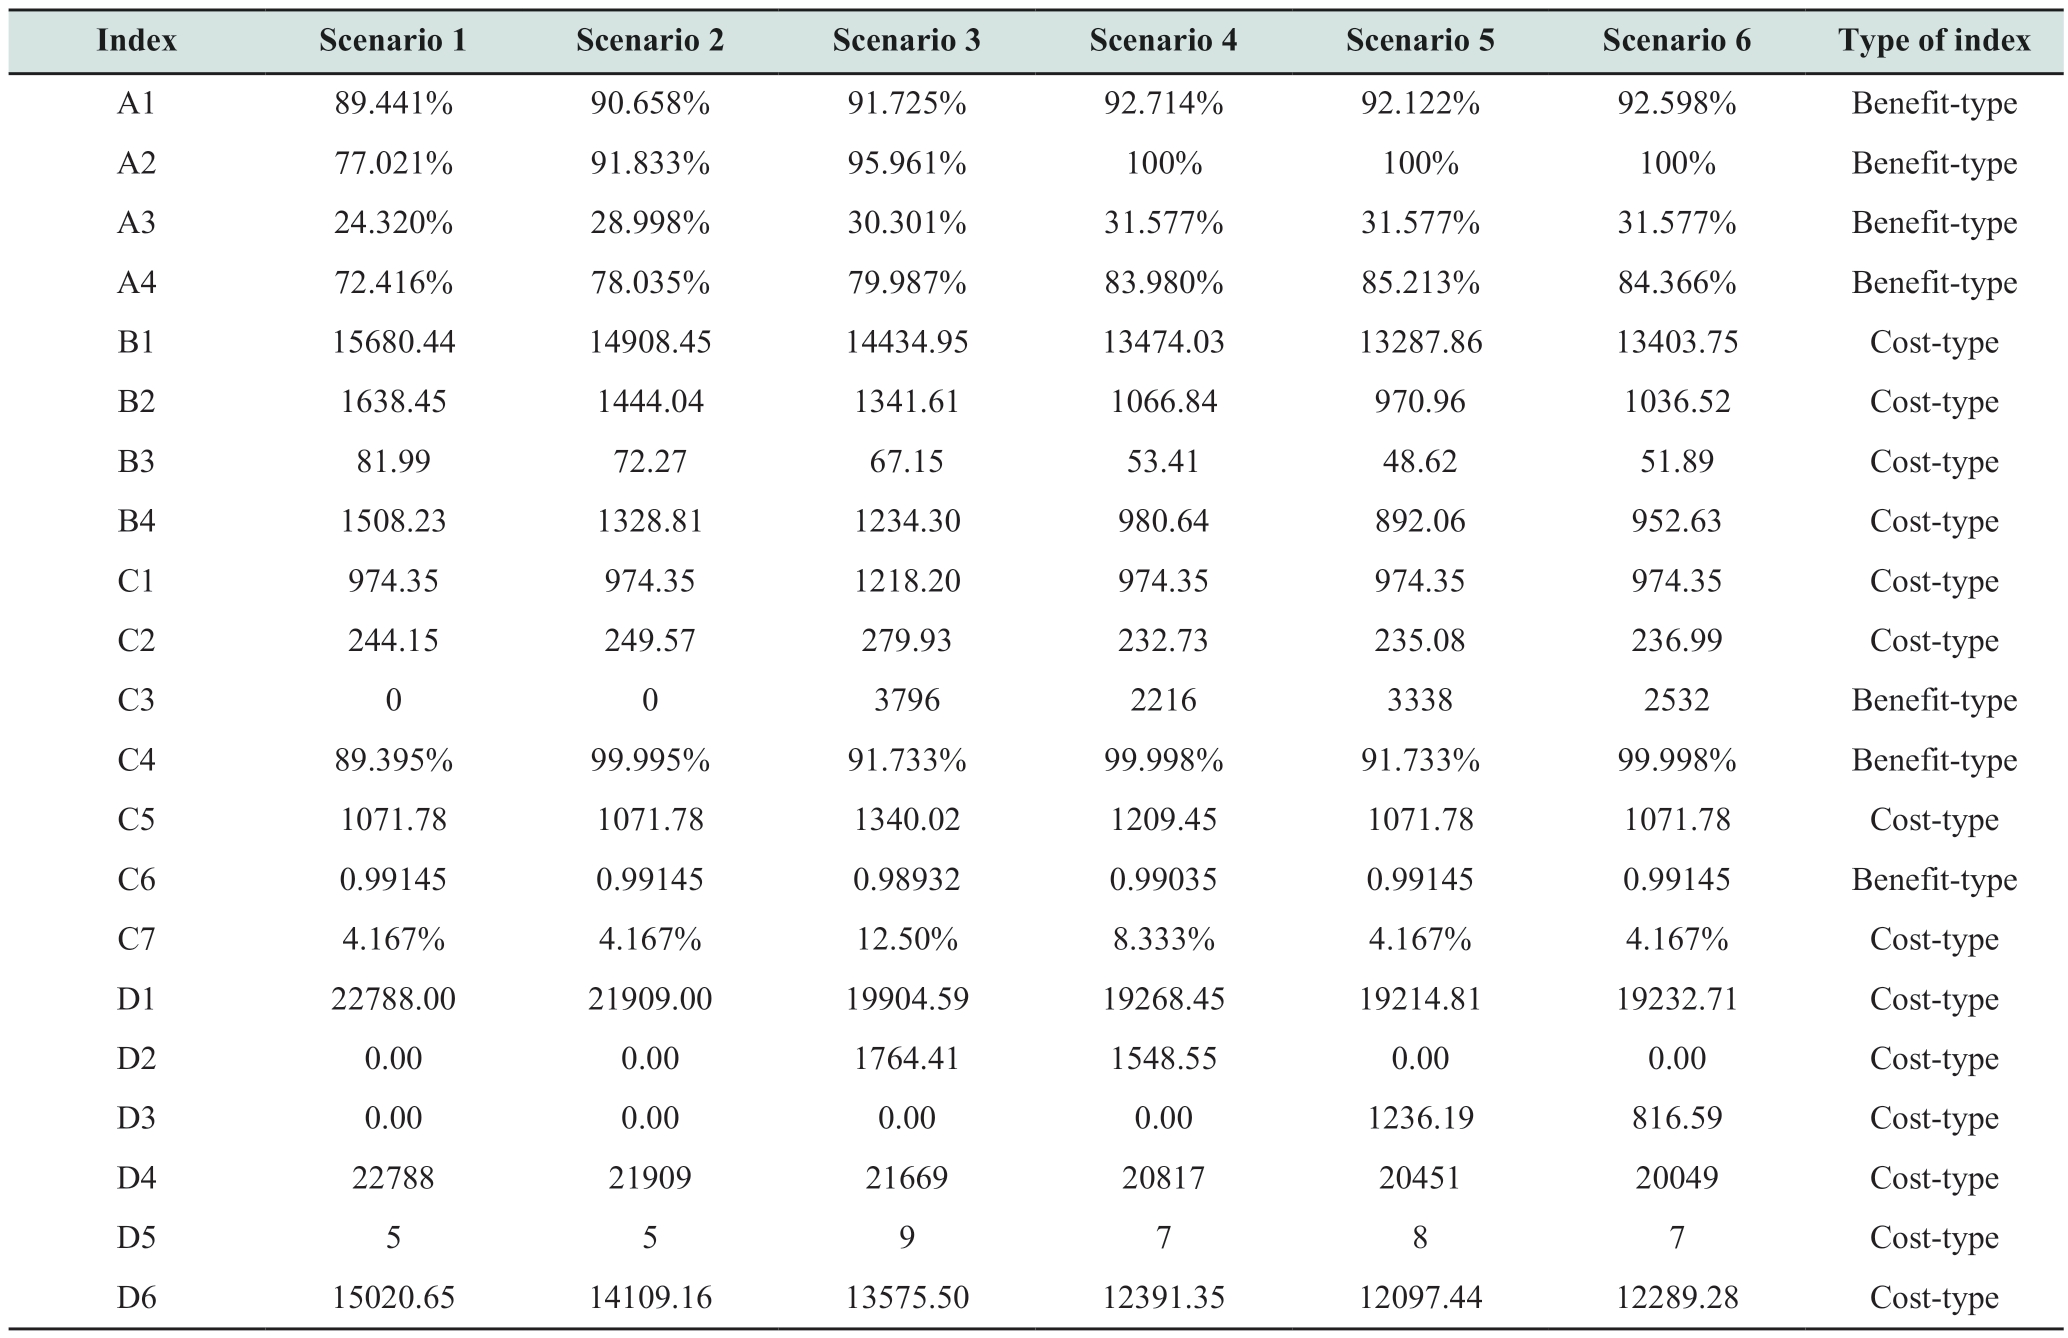
Data from the six scenarios are presented in the Appendix.Each scenario contains 21 indexes.Therefore,the proposed comprehensive evaluation scheme was adopted to evaluate the energy efficiency of each scenario.
First,the original data were processed according to benefit and cost types.The correlation coefficients R and eigenvalues for each index were calculated.The comprehensive scores of the primary indexes A,B,C,and D were calculated separately.In this manner,21 indexes of the original evaluation system were transformed into four new indexes: A (energy utilization),B (environmental protection),C (system operation),and D (economic benefits).
Fig.5 presents the data from the six scenarios under the new index system.
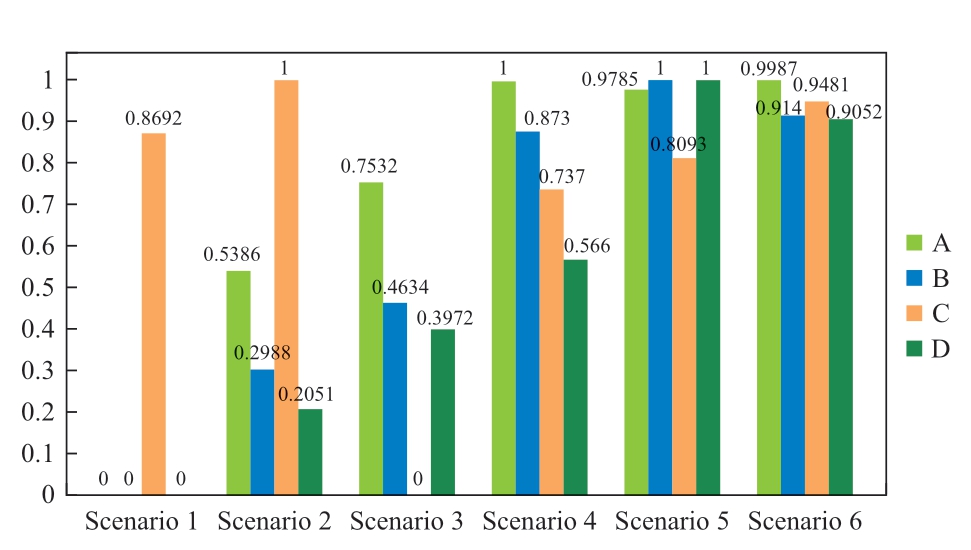
Fig.5 Data from six scenarios of the new index system
Second,the comprehensive weight of each new index was determined.In this study,the threshold coefficientλ=0.5was used to calculate comprehensive weights.The results are presented in Fig.6.
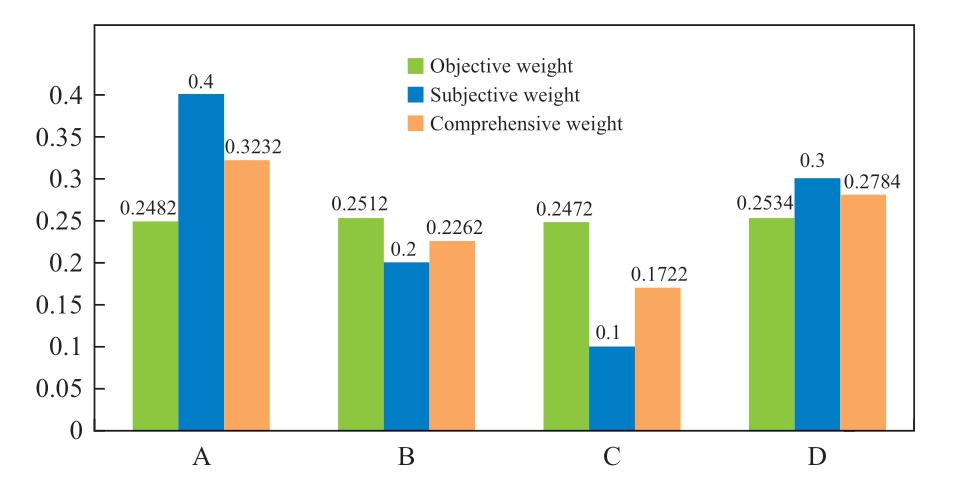
Fig.6 Weights of each new index
From Fig.6,it can be observed that the weight of new index A is the largest,and the sum of the weights of new indexes A and B is greater than 0.54.This reveals that the method pays more attention to low carbon emissions and environmental protection.
In the third step,the six scenarios were comprehensively evaluated.The discrimination coefficient τ=0.5 was used to calculate the results.
Fig.7 shows the gray correlation coefficient and gray correlation degree for each scenario.
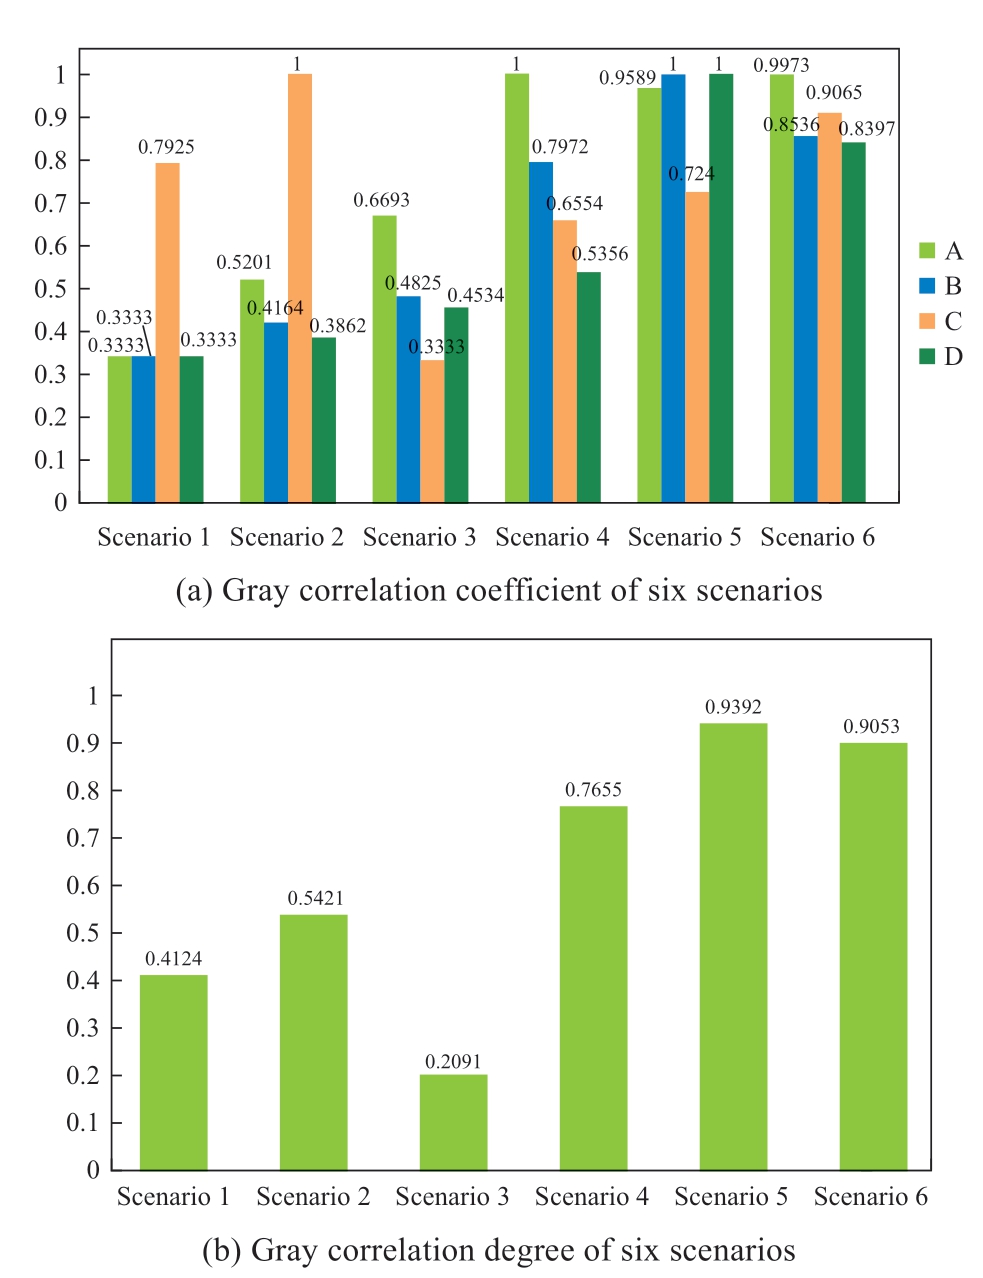
Fig.7 Gray correlation coefficient and gray correlation degrees of six scenarios
The results of the evaluation,displayed in Fig.7(b),show that scenario 5 had the best energy-efficiency assessment results,followed by scenarios 6,4,2,3,and 1.
Fig.8 presents a radar chart for each scenario using the new index system.
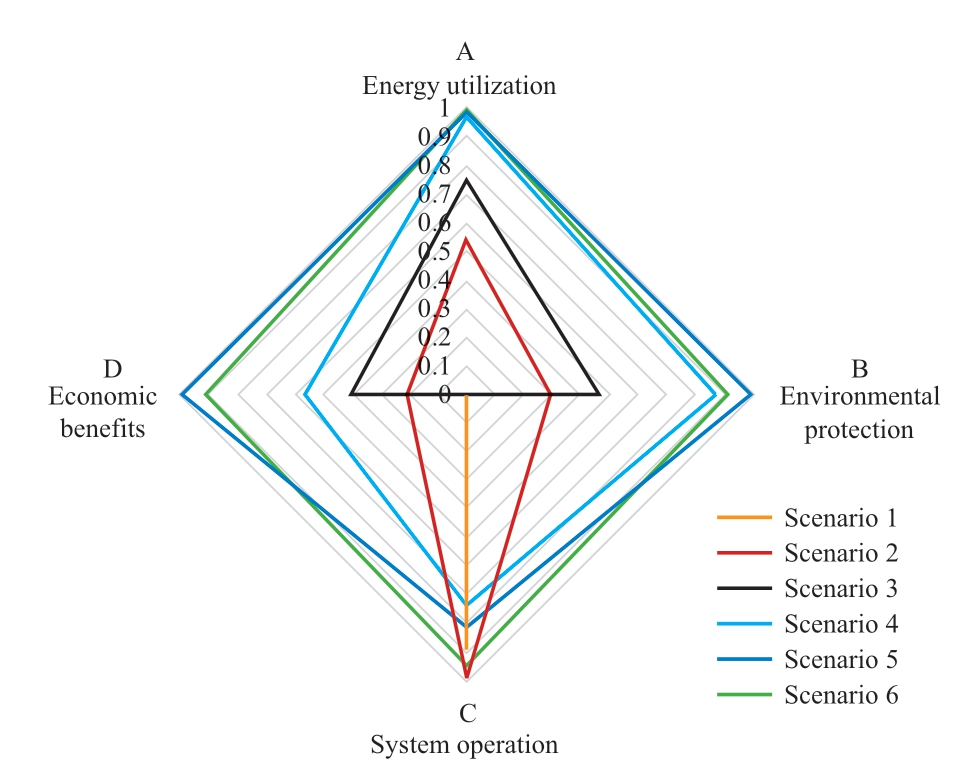
Fig.8 Radar chart of the new index system
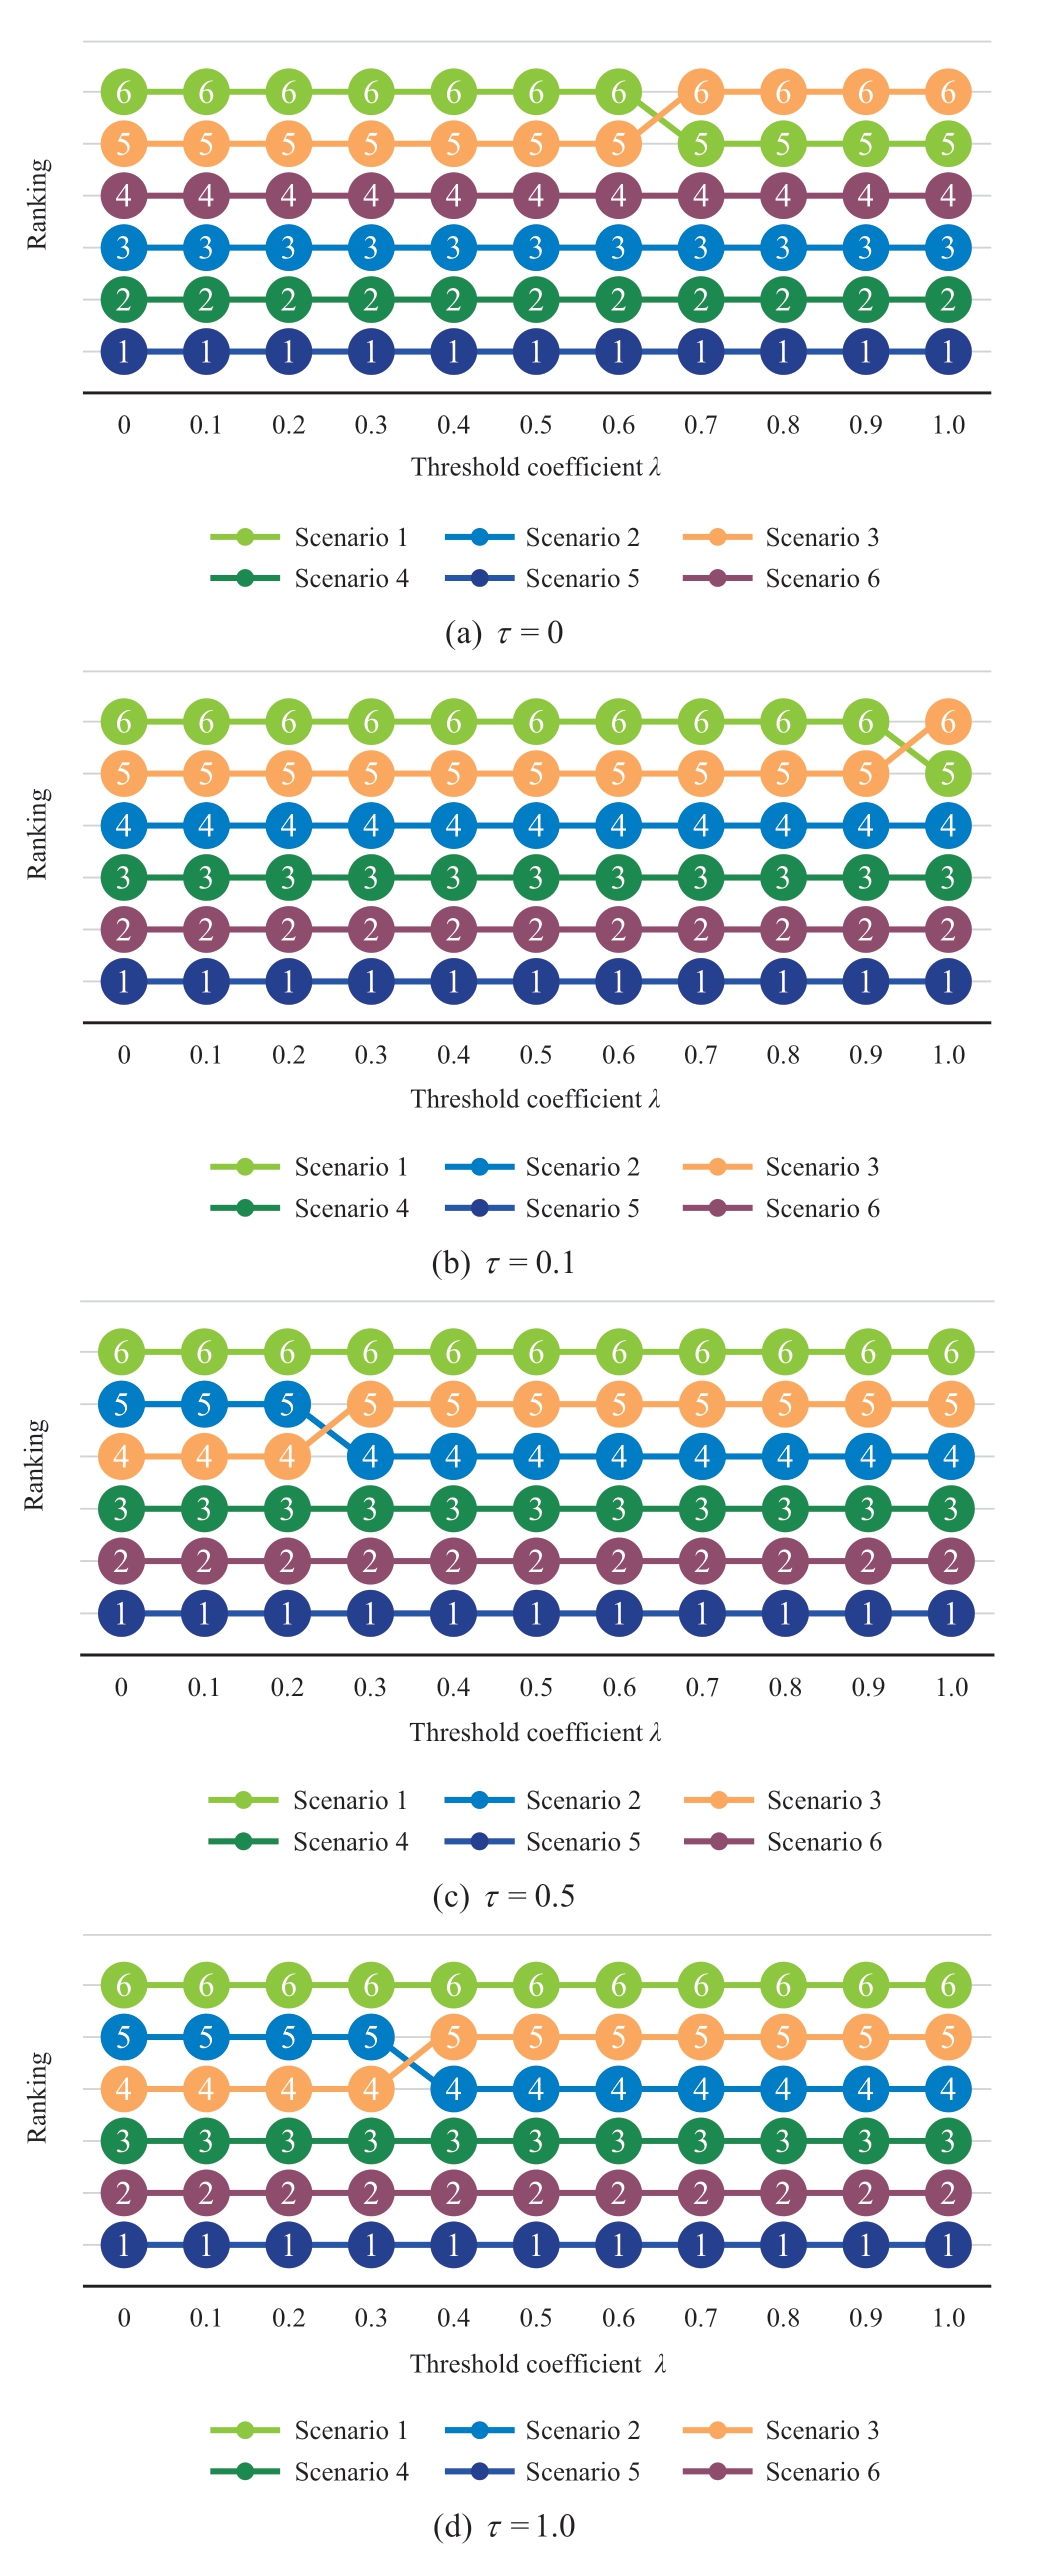
Fig.9 Result of sensitivity analysis
It appears that Scenarios 5 and 6 have very similar overall assessment scores,as well as scores for each new index.Although Scenario 6 may have a slightly better system operation than Scenario 5,the latter received a better evaluation outcome when considering factors such as renewable energy usage and pollutant emissions.This highlights the fact that a comprehensive evaluation is not solely dependent on the system operation but rather on a combination of various factors.
In summary,when constructing and operating a UES,it is recommended to prioritize Scenarios 5 and 6.
3.3 Comparative analysis of different methods
This study conducts a comprehensive assessment of six scenarios by establishing three comparative methods.The assessment methods and results are presented in Table 3.
Table 3 Evaluation results of different assessment methods
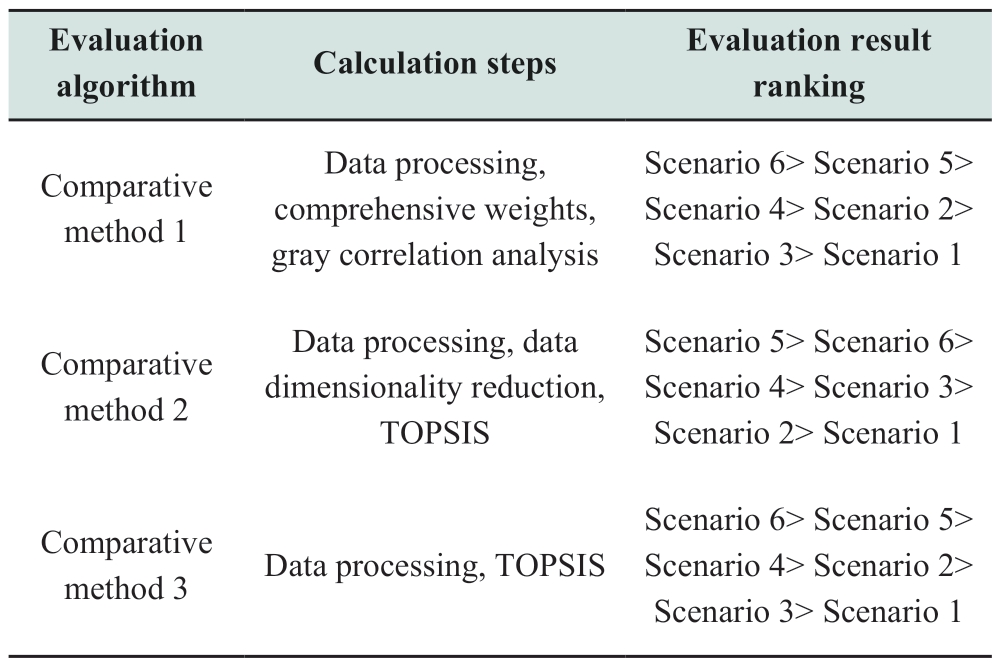
continue
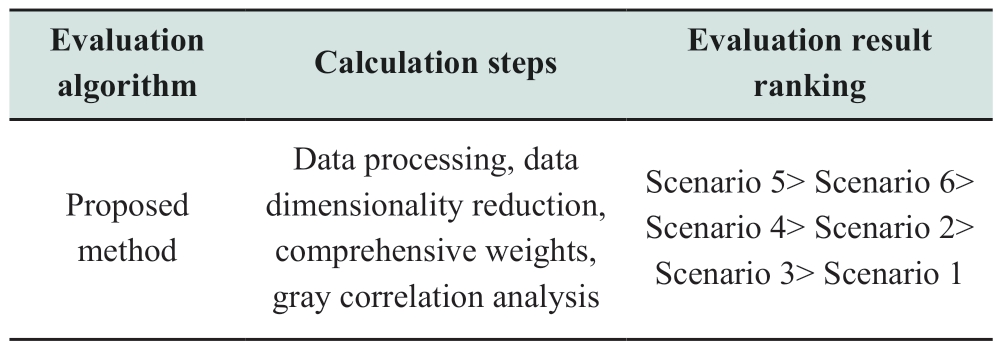
The results of Methods 1 and 3 show that Scenario 6 had the best energy efficiency evaluation results,whereas Method 2 showed that Scenario 5 had the best energy efficiency evaluation results.
Analyzing Table A,it can be observed that Scenario 5 is only slightly inferior to Scenario 6 in terms of the clean energy consumption rate,storage capacity,power supply reliability,operation cost,and cost recovery cycle,whereas the other indexes are equal to or better than those of Scenario 6.Considering the low carbon emissions,economy,and stable operation,the operation strategy of Scenario 5 is more advantageous.
Considering the large number of indexes in the evaluation system,there is a large amount of overlapping information between the indexes (e.g.,payment service cost and total daily operating cost of the system).The effect of the overlapping information is significantly amplified if it is simply assigned and superimposed linearly.Therefore,the calculations of the evaluation results analysis can be reduced through data dimensionality reduction,and the impact of information overlap on the assessment results can be significantly eliminated.The greater the number of evaluation indexes,the more credible the analysis results of the method proposed in this study.
In addition,the importance of each new index cannot be represented effectively without assigning weights.The evaluation results of Method 2 showed that the comprehensive energy efficiency of Scenario 3 was better than that of Scenario 2,whereas the proposed method considered Scenario 2 to be better than Scenario 3.Comparing Scenarios 2 and 3,the operation strategy of Scenario 2 ensures that the system has a more reliable power supply,better power quality,and smaller investment in energy storage,which is a more advantageous situation.Evidently,the accuracy of the energy efficiency assessment of the method used in this study was superior.
3.4 Sensitivity analysis
To analyze the effects of the threshold coefficientλ and discrimination coefficientτ on the energy efficiency evaluation results of each scenario,we evaluated the evaluation results after changing the two coefficients.Fig.9 shows the effects of changing the threshold coefficientλ from 0 to 1.0,when the discrimination coefficients τ are 0,0.1,0.5,and 1.0.
When the discrimination coefficient tends to be close to 0,the order of the energy efficiency assessment is Scenario 5,Scenario 4,Scenario 2,and Scenario 6;when the discrimination coefficient is greater than 0,the top four in the order of the energy efficiency assessment are Scenario 5,Scenario 6,Scenario 4,and Scenario 2.This indicates that Scenario 6 was more sensitive to changes in the discrimination coefficient,whereas changes in the threshold coefficient had less influence on the evaluation results.
Furthermore,regardless of the discrimination coefficient,the assessment results were essentially unchanged,and only when the threshold coefficient was gradually increased were some scenes switched in the ranking of the assessment results.
Therefore,it is more reasonable to choose the threshold and discrimination coefficients within a reasonable interval to analyze the results.
In addition,regardless of the values of the threshold and discrimination coefficients,Scenario 5 was consistently the scenario with the best assessment results.This indicates that Scenario 5 is more robust and is suitable for promotion and application.
4 Conclusions
This paper proposed an energy-efficiency evaluation method for UES and empirically verified its accuracy and effectiveness.The conclusions are as follows.
1) A multi-index comprehensive energy efficiency evaluation system was proposed.The system considered energy utilization,environmental protection,system operation,and economic benefits as the primary indexes.21 indexes were selected to ensure a comprehensive reflection of the system operation.
2) This study proposed an assessment method that included original data processing,dimensionality reduction,comprehensive weights,and gray correlation analysis.A case study showed that the method can reduce multiple indexes to four new indexes.This methodology reduces the impact of overlapping information on the results as much as possible.When using principal component analysis,the main purpose was to eliminate the correlation influence between the secondary-level indexes within each primary index.The correlation influence still exists in the secondarylevel indexes under different primary indexes.However,its impact on the results was marginal.
3) To provide a reference for UES construction and operation strategies,six scenarios for UES were presented in this paper.The results indicated that Scenario 5 has the best energy efficiency and robustness.This strategy is suitable for low-carbon-oriented UES.
4) The outlined evaluation system served as a fundamental reference.In practical applications,there is potential for further expansion of the index system to provide a more precise depiction of the system.Through the application of data dimensionality reduction techniques,a limited set of indexes can effectively embody dozens or even hundreds of individual indexes,resulting in a substantial enhancement in the computational efficiency and accuracy of the evaluation outcomes.
Appendix
The data of each index for six scenarios are presented in Table A.
Table A Data of each index for six scenarios
Acknowledgement
This work was supported by the National Natural Science Foundation of China under Grant 51567002 and Grant 50767001.
Declaration of competing interest
We declare that we have no conflict of interest.
References
[1] Wu L,Wang C,Chen W,et al.(2023) Research on the bilayer low carbon optimization strategy of integrated energy system based on Stackelberg master slave game.Global Energy Interconnection,6(4): 389-402
[2] Yang S,Tan Z,Zhao R,et al.(2020) Operation optimization and income distribution model of park integrated energy system with power-to-gas technology and energy storage.Journal of Cleaner Production,247: 119090
[3] Tang T,Ding H,Sayyad N,et al.(2020) Environmental and economic operation of wind-PV-CCHP-based energy system considering risk analysis via downside risk constraints technique.IEEE Access,8: 124661-124674
[4] Mu C,Ding T,Qu M,et al.(2020) Decentralized optimization operation for the multiple integrated energy systems with energy cascade utilization.Applied Energy,280: 115989
[5] Li C,Yang H,Mohammad S,et al.(2020) Optimal planning of islanded integrated energy system with solar-biogas energy supply.IEEE Transactions on sustainable energy,11(4): 2437-2448
[6] Mao Y,Wu J,Zhang W,et al.(2020) An effective operation strategy for CCHP system integrated with photovoltaic/thermal panels and thermal energy storage.Energies,13: 6418
[7] Milad F,Hadi R,Hadi G (2022) Thermo-mechanical energy level approach integrated with exergoeconomic optimization for realistic cost evaluation of a novel micro-CCHP system.Renewable Energy,190: 630-657
[8] Aikaterini P,Anastasios T,Eugenia G (2021) Techno-economic performance assessment of a trigeneration system operating in a hospital.Energies,14: 5105
[9] Han C,Zhu C,Shen Y,et al.(2022) Energy,environmental and economic performance evaluation of energy pile system under different climate conditions.Energy Conversion and Management,252: 115041
[10] Wu Q,Li C (2022) Economy-environment-energy benefit analysis for green hydrogen based integrated energy system operation under carbon trading with a robust optimization model.Journal of Energy Storage,55: 105560
[11] Berjawi A E H,Walker S L,Patsios C,et al.(2021) An evaluation framework for future integrated energy systems: A whole energy systems approach.Renewable and Sustainable Energy Reviews,145: 111163
[12] Qian J,Wu J,Yao L,et al.(2021) Comprehensive performance evaluation of Wind-Solar-CCHP system based on emergy analysis and multi-objective decision method.Energy,230:120779
[13] Zhao H,Li B,Lu H,et al.(2022) Economy-environment-energy performance evaluation of CCHP microgrid system: A hybrid multi-criteria decision-making method.Energy,240: 122830
[14] Sadegh N,Roohollah R,Seyfolah S,et al.(2022) Dynamic thermal analysis and 3E evaluation of a CCHP system integrated with PVT to provide dynamic loads of a typical building in a hotdry climate.Sustainable Energy Technologies and Assessments,52: 101970
[15] Kong X,Wang H,Li N,et al.(2022) Multi-objective optimal allocation and performance evaluation for energy storage in energy systems.Energy,253: 124061
[16]Aikaterini P,Vassilios V,Kalliopi T,et al.(2022) Economic assessment of cogeneration systems in operation.Energies,13: 2206
[17] Zhao H,Li J (2021) Energy efficiency evaluation and optimization of industrial park customers based on PSR model and improved Grey-TOPSIS Method.IEEE Access,9: 76423-76432
[18] Tang W,Wu B,Zhang L,et al.(2021) Multi-objective optimal dispatch for integrated energy systems based on a device value tag.CSEE Journal of Power And Energy Systems,7(3): 632-643
[19] Jing R,Wang M,Nigel B,et al.(2017) Multi-criteria evaluation of solid oxide fuel cell based combined cooling heating and power (SOFC-CCHP) applications for public buildings in China.Energy,141: 273-289
[20] Jing Y,Bai H,Wang J (2012) A fuzzy multi-criteria decisionmaking model for CCHP systems driven by different energy sources.Energy Policy,42: 286-296
[21] Lu Z,Gao Y,Xu C (2021) Evaluation of energy management system for regional integrated energy system under interval type-2 hesitant fuzzy environment.Energy,222: 119860
[22] Luo Y,Zou X,Xiong W,et al.(2023) Dynamic state evaluation method of power transformer based on Mahalanobis-Taguchi system and health index.Energies,16(6): 2765
[23] Zhang K,Liu M,Zhao Y (2022) Design and performance evaluation of a new thermal energy storage system integrated within a coal-fired power plant.Journal of Energy Storage,50: 104335
[24] Liu H,Zhou X,Yang X,et al.(2020) Influence evaluation of integrated energy system on the unit commitment in power system.IEEE Access,8: 163344-163356
[25] Jiao X,Wu J,Mao Y,et al.(2023) An optimal method of energy management for regional energy system with a shared energy storage.Energies,16: 886

Scan for more details
Received:4 June 2023/Revised: 7 November 2023/Accepted:16 January 2024/Published: 25 April 2024
 Jiekang Wu
wujiekang@gdut.edu.cn
Xianan Jiao
jxn5053@126.com
Yunshou Mao
maoyunshou@163.com
Mengxuan Yan
mengxuanyan@yeah.net
2096-5117/© 2024 Global Energy Interconnection Development and Cooperation Organization.Production and hosting by Elsevier B.V.on behalf of KeAi Communications Co.,Ltd.This is an open access article under the CC BY-NC-ND license (http://creativecommons.org/licenses/by-nc-nd/4.0/).
Biographies

Xianan Jiao received a B.S.and an M.S.degree in electrical engineering from Guangdong University of Technology,Guangzhou,China.He is currently purchasing a Ph.D.degree in electrical power engineering from Guangdong University of Technology.His current research interests include integrated energy system planning and operation,multi-energy network operation and optimization theory in these areas.

Jiekang Wu is a professor and received a Ph.D.degree from South China University of Technology,Guangzhou,China.His employment experience includes as an engineer in a power supply bureau;an engineer in an electrical engineering designing institute;a professor in Zhejiang University,Guangxi University,Guangdong University of Technology;and an engineer in large enterprises.His current research interests include design of power systems with renewable energy,optimization of new power system and fault detection in distribution system.

Yunshou Mao received a B.S.,an M.S.and a Ph.D.degree in electrical engineering from Guangdong University of Technology,Guangzhou,China.His current research interests include integrated energy system optimal operation and lightning protection of distribution system.

Mengxuan Yan received a B.S.and an M.S.degree in electrical engineering from Guangdong University of Technology,Guangzhou,China.Her current research interests include integrated energy system planning,wind power prediction and optimal scheduling of wind farms.
(Editor Yajun Zou)
