0 Introduction
The digital simulation of power systems is a crucial support tool for system planning, operation, and control.The load model accuracy directly influences the precision of results of quantitative models of the dynamic behavior of power systems. It also has a crucial impact on power flow calculations, short-circuit current calculations,and voltage stability analysis. Load characteristics have significantly changed owing to the growing complexity of power system structures and improvements in the living conditions of people. Loads have further increased volatility and complexity as well as improved controllability, and sensitivity, rendering load modeling considerably more challenging [1]. For the digital simulation computation of the power system, accurately describing the load characteristics of the system and developing a load model consistent with the actual situation are crucial. However,in practical engineering, regional power grids typically utilize a unified load model, which is overly simplistic and inconsistent with actual situations. The variance in the comprehensive load characteristics caused by the unpredictability, dispersion, diversity, and complexity of the load is the fundamental reason preventing the development of load models. Variance in load composition is the primary cause of disparity in comprehensive load characteristics[2]. The accuracy of load modeling can be improved by merging and classifying load substations with similar load components and grouping them into classes for modeling purposes. This is particularly important for power system simulations.
Load categorization is a popular research topic.Partition-based k-means clustering [3, 4], fuzzy clustering[5], hierarchical clustering [6], Gaussian clustering combination [7], and self-organizing map neural networks[8] are among the most popular clustering techniques. The fuzzy C-means (FCM) technique is a classic algorithm used for fuzzy clustering. The fundamental idea of FCM is maximizing the objective function to obtain the membership degree of each sample point in all class centers [9]. This clustering technique produces more accurate and logical results. Consequently, the FCM clustering algorithm is frequently used for load categorization and demand forecasting in power systems [10]. The concept of layerby-layer classification based on the kernel FCM (KFCM)clustering algorithm is presented in [2]. This algorithm not only improves the accuracy of clustering and resistance to noise in the traditional FCM technique but also simplifies the complexity and difficulty of load categorization. In [11],the authors developed a cloud model and an FCM-based power load pattern extraction approach for power load categorization and power pattern recognition. MapReduce was used in [12] to parallelize the multi-kernel FCM clustering algorithm, which considerably boosts the load forecasting accuracy and has a high degree of applicability to big data environments.
The FCM algorithm is used for local searches. The algorithm reaches a local minimum if the initial value is incorrectly chosen. When dealing with a significant amount of power data, the FCM must also artificially determine the number of clusters, resulting in different random initialization clustering centers formed after each algorithm operation. This algorithm produces an anomalous convergence condition detrimental to the stability and quality of clustering. Considerable research has been conducted to resolve these problems. An intelligent algorithm was employed in [13] to enhance the FCM technique. Because of its simple structure and facile implementation, the proposed approach effectively overcame the disadvantages of unstable FCM clustering results and the ease of falling into local optima. In [14],clustering the daily load curve using the KFCM technique based on particle swarm optimization (PSO) and calculating the number of clusters using the intracluster sum squared error (SSE) index were recommended. Compared with the clustering effectiveness of the traditional FCM technique, a 31.9% increase was observed. In [15, 16], the advantages of the genetic algorithm (GA) and simulated annealing (SA)were merged to determine the best initial clustering center for the FCM algorithm. The modified FCM algorithm was used to categorize the power load characteristics and daily load curves. It overcomes the difficulty of obtaining the local optimal solution of the classic FCM algorithm. Based on the foregoing studies, a clustering assessment index is incorporated into the SA and GA (SAGA)-FCM algorithm,as reported in [17]. This enables the adaptive determination of the best fuzziness parameters, thereby enhancing the precision and efficiency of load curve clustering. However,the aforementioned SAGA-FCM algorithm still has the drawback of artificially determining the cluster numbers.In [18], the initial clustering center is determined using a subtractive algorithm prior to FCM clustering, which resolves the problem of local convergence. Additionally,this algorithm can generate several clusters according to the influence of each dimension on the clustering center at each data point, overcoming the drawbacks of artificially specifying the number of clusters. In [19], the number of clusters and cluster centers was automatically determined using artificial intelligence methods, such as PSO and index function. Although the algorithm becomes more autonomous, its accuracy improves. In [20], the FCM algorithm and support vector machine were integrated to solve clustering problems, including outliers and noise;consequently, a robust algorithm is developed. To cluster the daily load curves, the authors suggested an FCM clustering algorithm based on the gray wolf optimization(GWO) algorithm [21]. The global search capability of the GWO is used by the FCM to locate the ideal starting clustering center rapidly and improve global optimal clustering performance. Moreover, a clustering algorithm based on the GA, PSO, and FCM was proposed [22]. This algorithm combines the strengths of GA’s robust global search capability with the rapid convergence speed of PSO.Compared with using the GA, the best solution is more rapidly attained by this combination.
To overcome the drawbacks of the traditional KFCM clustering algorithm, a substation clustering algorithm based on an improved KFCM algorithm with adaptive optimal clustering number selection is proposed in this study.This algorithm converges to a global optimal solution and overcomes the subjectivity and blindness associated with artificially determining the number of clusters. Based on the initial range of cluster numbers, the ideal clustering number is adaptively determined using the clustering evaluation index ratio. By combining the SA and GA, the local convergence phenomenon of the KFCM algorithm is overcome. This combination leverages the advantages of the powerful global search capabilities and robustness of the SAGA. The results demonstrate that the improved KFCM algorithm effectively resolves the inadequacies of the conventional KFCM algorithm and enhances the accuracy and availability of load substation classification.
1 KFCM clustering algorithm
1.1 FCM clustering algorithm
The FCM clustering algorithm groups each sample according to its membership degree in each cluster center.Therefore, the most significant similarity exists among the objects of the same group.
Based on the error square criterion function, the objective function of the FCM algorithm is enhanced, and a membership factor is added:
where k is the number of clusters; N is the number of samples; and b is the weighted parameter (the value range of b is 1≤ b≤ ∞). Moreover, vi represents the ith cluster center; xj represents the jth sample; and µij represents the membership degree of sample xj in cluster center vi. The sum of each sample’s membership value in all clusters is 1![]() Distance is represented by
Distance is represented by![]()
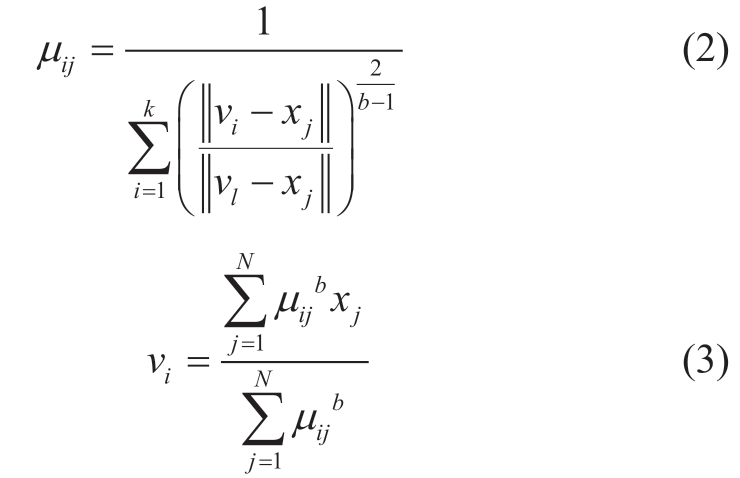
The Lagrange multiplier approach is used to minimize the objective function value, and the membership degree and clustering center are calculated as follows:
1.2 The kernel function
The fundamental concept of the kernel method is the use of a feature function to translate samples that are not linearly separable in their original space into a higherdimensional feature space where they can be linearly separated. The FCM clustering algorithm can be secondarily optimized using the kernel method, significantly improving the clustering accuracy.
The mapping form of sample X in high-dimensional space is
where![]()
The inner product of the nonlinear mapping, Φ,from the initial Q-dimensional space to the highdimensional Q-dimensional feature space is defined as the kernel function. The kernel function is written as K ( x , z)≤Φ( x), Φ ( z )> for all x, z ∈ X ⊂Rq.
The Gaussian kernel function, which is typically used in many fundamental kernels, can precisely reconstruct the original data distribution. A Gaussian kernel is defined as

The width of the Gaussian kernel function, σ, is used in this formula to regulate the flexibility of the kernel.
1.3 KFCM clustering algorithm
Instead of using the actual Euclidean distance, the KFCM algorithm introduces a kernel function, and its goal function is modified to
The objective function can be updated by substituting the Gaussian kernel function into the following formula:
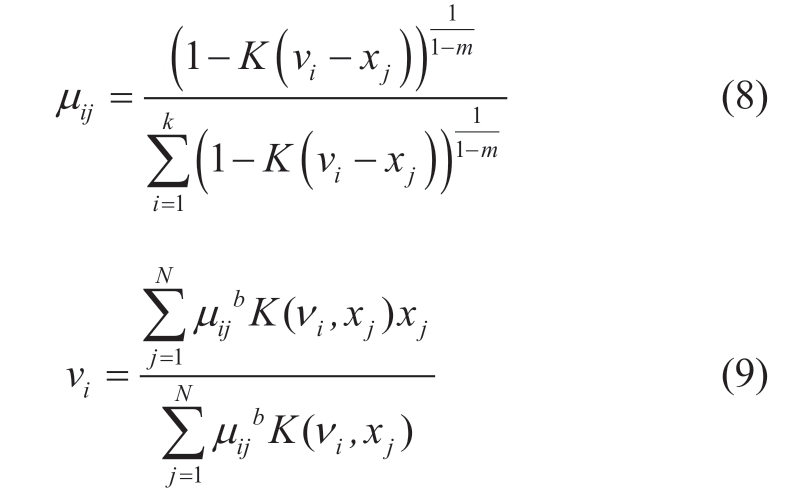
The Lagrange multiplier approach is combined with the restrictions of the KFCM algorithm to minimize the objective function. The membership matrix and clustering center formula are updated as follows:
2 Improved KFCM algorithm with adaptive optimal clustering number selection
2.1 Optimal clustering number selection
2.1.1 Clustering evaluation index
Davies-Bouldin index
The Davies-Bouldin (DB) index calculates the sum of the dispersion degrees of any two categories divided by the center distances of the categories. Then, it calculates the mean of the maximum value. The DB index is as follows:
where Si represents the dispersion degree of data measurement points in the ith type of data, and Mij represents the distance between the ith and jth cluster centers.
A smaller DB index indicates a better categorization effect based on its definition.
Calinski-Harabasz index
The Calinski-Harabasz (CH) index is the ratio of distances among clusters to those within clusters. It is infrequently referred to as the “variance ratio criterion” because its calculation process is similar to variance computation. This index is given by
where SSB is the intercluster variance, and SSW is the intracluster variance.
As the CH index increases, the within-cluster distance decreases, the distance among clusters becomes more significant, and the clustering performance improves.
Silhouette coefficient
The silhouette coefficient (SC) is used to assess the similarity of a point in a cluster to other similar points in the cluster. The SC of the ith point (i.e., SCi) is defined as
where bi is the minimum average distance from the ith point to the points in other clusters, and ai is the average distance from the ith point to the other points in the same cluster as i.
The range is [-1, 1]. The stronger the degree of correspondence between the point and category, the closer the SC is to 1, and vice versa. The clustering scheme fails when SC = -1.
2.1.2 Clustering evaluation index
Clustering algorithms and cluster validity indices are typically combined to calculate the ideal number of clusters.First, the range of clusters is tentatively determined as[k min,k max]; kmin and kmax are typically 2 and  , respectively.The clustering algorithm is implemented using all clustering numbers in the range kmin- kmax. Finally, the clustering results are evaluated using a cluster validity index. The ideal clustering number corresponds to an outstanding clustering evaluation index value.
Any cluster evaluation index can be used to determine the ideal number of clusters. In this study, DB and CH are combined and used for the assessment considering the objectivity of evaluation outcomes.
Data are normalized because a significant discrepancy between the DB and CH values exists:

where i is the ith index, and j is the jth data.
According to the definitions of the DB and CH indices,the smaller the DB value and the greater the CH value, the better the clustering performance. Thus, the CH-DB cluster evaluation index ratio is calculated. The ideal number of clusters, k, corresponds to the maximum ratio.
2.2 SAGA
The fundamental concept of GA, an evolutionary algorithm, is based on the biological notion of “natural selection and survival of the fittest”. The GA first encodes the problem parameters as chromosomes, generates the initial population, and calculates the fitness of each individual. Group fitness is calculated based on the fitness of each individual:
where pop represents the number of individuals, and fi represents the fitness of individuals.
Then, using iterative methods, the GA performs selection, crossover, and mutation operations to exchange chromosome information. Finally, the GA produces chromosomes that satisfy the optimization goals. The GA is robust, has few restrictions on the objective function,and has a solid global search ability. However, the GA is susceptible to the convergence phenomenon of “early precocity and late evolution stagnation” in the later stage,indicating that settling on the local optimal solution is simple.
The SA algorithm is a powerful technique for handling complex combinatorial optimization issues. The fundamental concept is to simulate the annealing process of high-temperature objects to identify the global optimal (or approximate global optimal) solution to the optimization problem. The cooling operation of the SA algorithm is as follows:
where kT is the temperature cooling coefficient.
To escape the local optimal solution and determine the global optimal solution, the SA algorithm first generates an initial solution that serves as the current solution. Then,it chooses a nonlocal optimal solution whose probability is P(T) in the vicinity of the current solution and repeats the solution. The basis for determining whether a current solution is acceptable is the Metropolis criterion, which is formulated as follows:

The SA algorithm has a strong local search capability and short computational time. However, its global search effectiveness is low because it cannot fully cover the entire search area [16].
The SAGA aims to utilize and optimize the population while avoiding premature convergence. It uses the SA algorithm as its primary process and incorporates the concept of GA. The fundamental principle of the algorithm is the use of the initial population fitness value of GA as the initial solution of the SA algorithm. The fitness value of the subsequent generation population obtained by the GA through selection, crossover, and mutation is used as the new solution of the SA algorithm. Individuals matching the Metropolis criterion solutions of the SA algorithm are identified as the subsequent generation population of the GA. Combining the SA algorithm and GA can more effectively overcome the drawbacks of a single algorithm while enhancing overall performance [15].
2.3 Improved KFCM algorithm with adaptive optimal clustering number selection
An improved KFCM algorithm with adaptive optimal clustering number selection is proposed in this paper. Determining the maximum ratio of the clustering assessment indices, CH and DB, yields the ideal clustering number. Cluster analysis combines the SA and GA to enhance the KFCM algorithm such that it can overcome local convergence and its drawback in determining the ideal number of clusters.
The flowchart of the algorithm is shown in Fig. 1.
The algorithmic process is described as follows.
(1) The original data are inputted, and the control parameters are set.
(2) The GA randomly generates the initial chromosome population. After decimal conversion, the initial population is reorganized to obtain k initial cluster centers for each member. Then, the membership degree of each sample and fitness (fi) of each member are calculated.
(3) The loop count variable is set to gen = 0.
(4) Genetic operations, such as selection, crossover,and mutation, are performed to create new populations.Subsequently, the k cluster centers, membership degree,and fitness (fi′) of the new member are calculated. If fi′> fi,the old member is replaced by a new one; otherwise, the new member with probability P (T ) =exp((f i−f i′)/ T ) is accepted, and the old individual is discarded.
(5) If gen < MAXGEN, gen = gen + 1 is set, then the algorithm proceeds to step (4); otherwise, the algorithm proceeds to step (6).
(6) If Ti <Tend, the algorithm outputs the clustering evaluation index and proceeds to step (7); otherwise, cooling operation, Ti+1 =kT Ti, is performed, and steps (3) – (6)are repeated.
(7) If k <k max, k = k + 1 is set, then the algorithm proceeds to step (2); otherwise, it proceeds to step (8).
(8) The CH/DB value is calculated by normalizing the clustering evaluation index. The optical clustering number,kopt, corresponds to the highest CH/DB value.
(9) The substation clustering outcomes under the ideal number of clusters are outputted, and the algorithm ends.
A large O representation can be used to assess the time complexity of the algorithm. The algorithm has four loop layers. The innermost loop calculates the membership and fitness of each member (not shown in Fig. 2). The GA iterative genetic procedure constitutes the second loop. The SA algorithm, which implements the annealing process, is used in the third loop. The fourth loop traverses a number of clusters and determines the ideal number. Consequently, the time complexity of the algorithm is O (n 4) .

Fig. 1 Flowchart of improved KFCM algorithm with adaptive optimal clustering number selection
3 Example analysis
3.1 Clustering results of load substation
For verification, the statistical survey findings of the summer maximum load of 467 load substations in a province in southern China were used. Table 1 lists the details on the composition of industrial, commercial,residential, agricultural, and other loads.
Table 1 Load composition data

The raw data scatter plot is shown in Fig. 2; the three coordinate axes represent the proportions of commercial,residential, and agricultural loads. The size of the scatter represents the proportion of the commercial load, and the color of the scatter in the interior represents the proportion of other loads.

Fig. 2 Scatter plot of load composition data
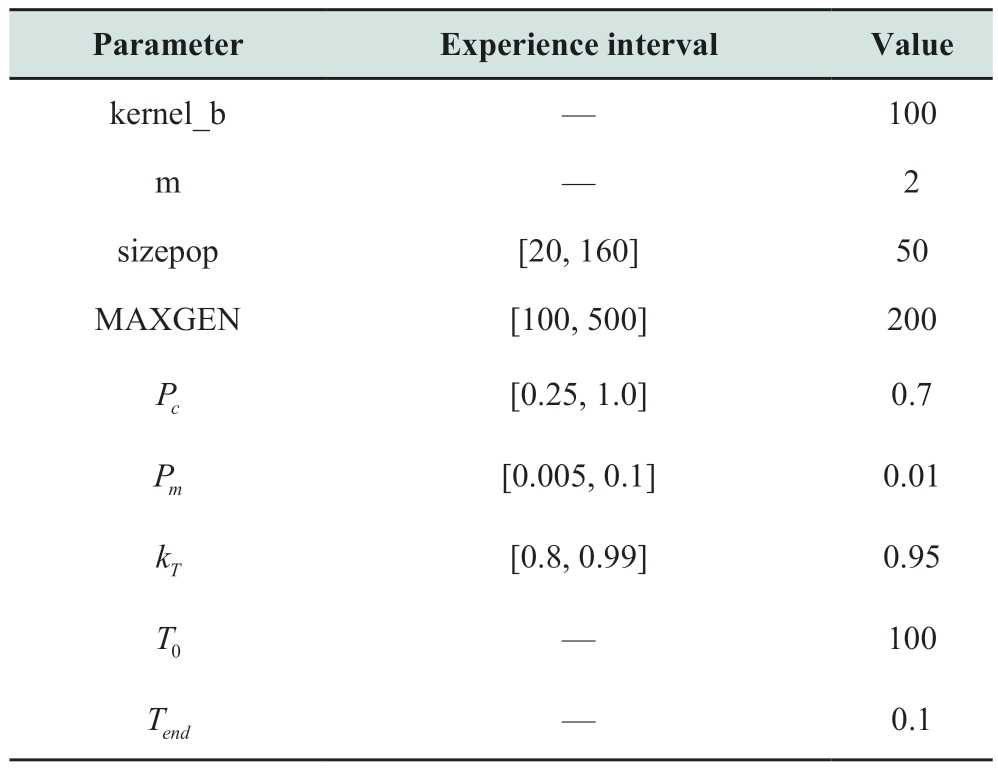
Table 2 lists the algorithm parameters. The Gaussian kernel function parameter, b, limits the field of influence of the kernel. The local influence of the Gaussian kernel function increases with b. However, overfitting occurs when the value is exceedingly high. When b = 100, the algorithm exhibits the best performance based on comprehensive tests.The fuzzy index, m, which measures the degree of fuzziness,has an ideal value range of [1, 2.5]. Typically, this index is assumed to be 2. The GA has four parameters: sizepop,MAXGEN, Pc (crossover probability), and Pm (mutation probability). Table 2 summarizes the suggested empirical value ranges for the GA monographs [23]. The algorithm may have a problem in reaching the best solution if sizepop or MAXGEN is overly large; a long computation may lengthen the execution time of the algorithm. Additionally,each annealing phase in this algorithm undergoes a genetic operation. Therefore, MAXGEN and sizepop must be set to relatively small values. The crossover probability,Pc, affects the survival and recombination probabilities of operators. If it is overly high, it can facilely confuse the initial pattern; if it is extremely small, the algorithm may become unproductive. The mutation probability, Pm,governs population variation. The GA degenerates early if the mutation rate is extremely low and becomes a random search if it is overly high [24]. After testing the algorithm,Pc = 0.7 and Pm = 0.01 are determined to be the optimal values for the algorithm. The optimal parameters of the SA algorithm, kT =0.95 and Tend =0.1, are suggested in[25]. The termination temperature of the SA algorithm must be set to a relatively small value to enable algorithm convergence. The initial temperature must be sufficiently high to ensure that all transition states are acceptable. The method has no sufficient time to converge if the temperature cooling coefficient, kT, is extremely low.
Table 2 Algorithm parameters
The preliminary range of the clustering number is 2–22. The SAGA-KFCM algorithm generates clustering evaluation indices DB, CH, and SC. The ratio of CH to DB after the indices are normalized is shown in Fig. 3. The CH/DB value reaches its maximum when k = 4; hence, this is the ideal clustering number.
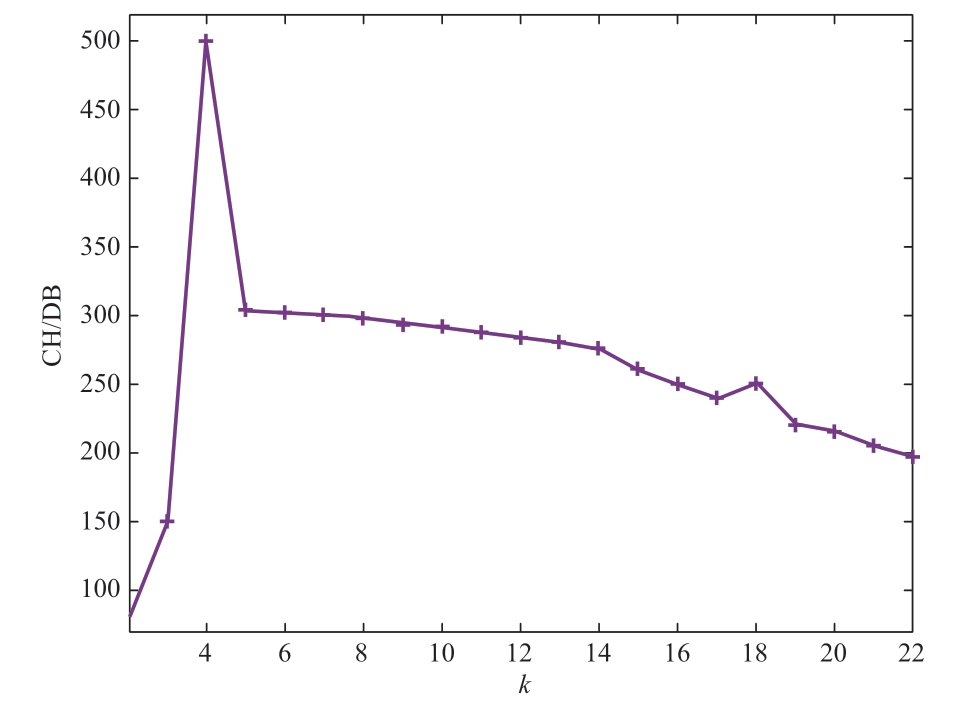
Fig. 3 Relationship between CH/DB and k
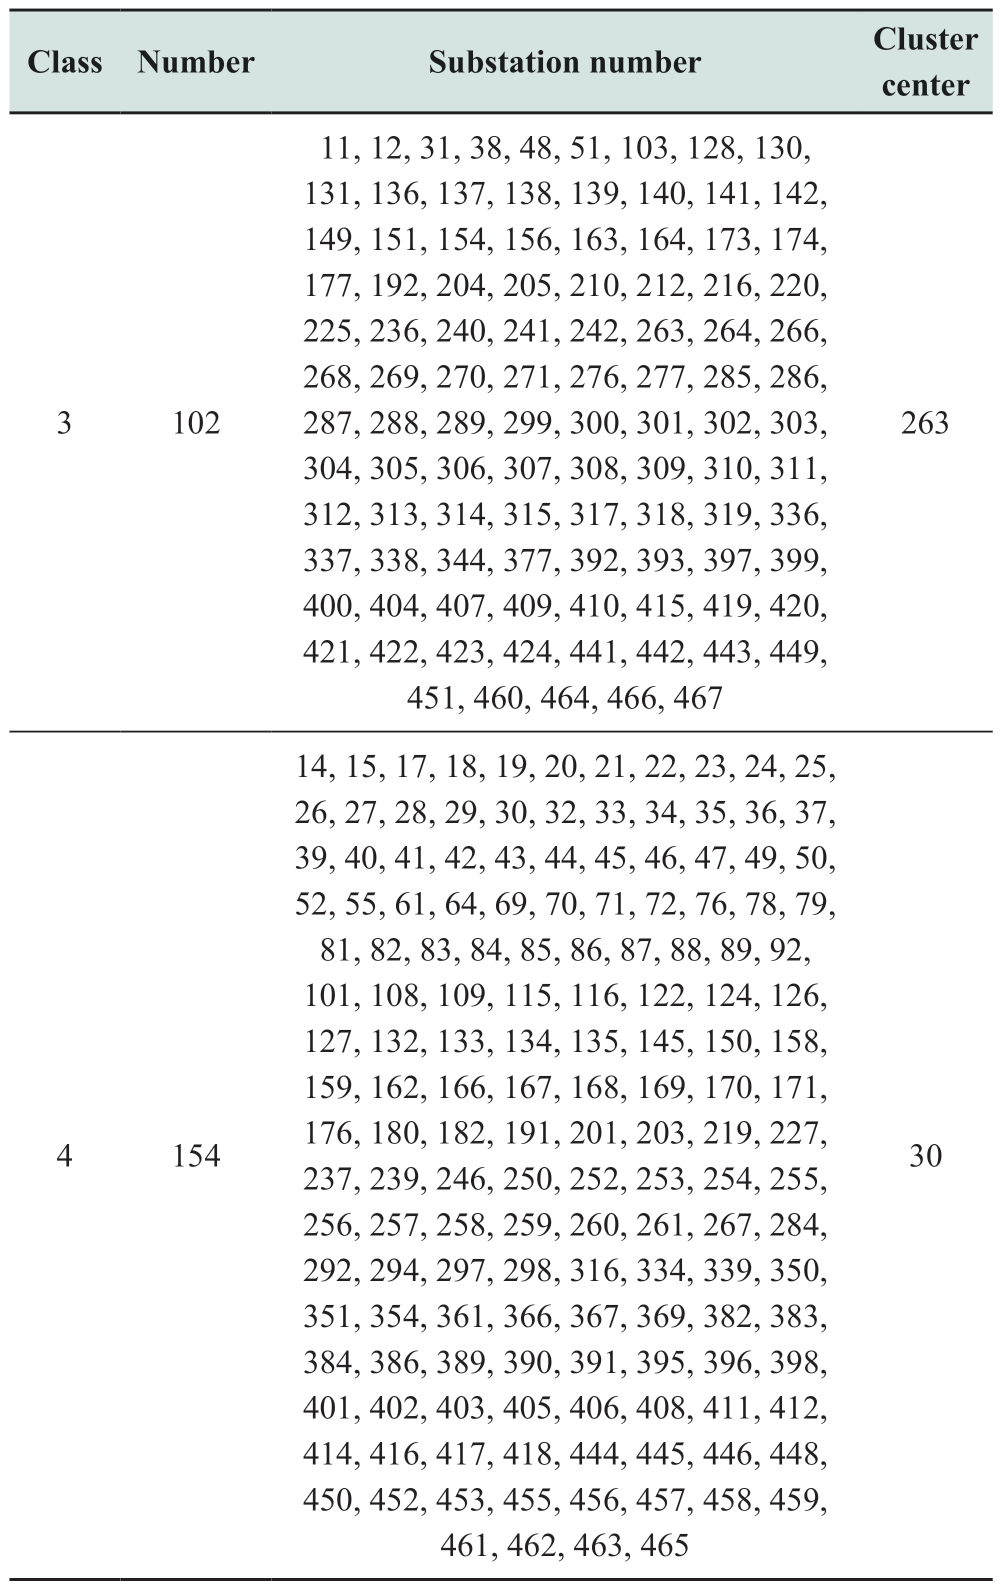
The SAGA-KFCM algorithm produced evaluation indices of DB = 0.804, CH = 545.168, and SC = 0.598 when k = 4. The clustering results are listed in Table 3.
Table 3 Clustering results of SAGA-KFCM algorithm

continue
The ratios of the different loads to the overall load are calculated for each category. Table 4 summarizes the calculation results.
Table 4 Results of load composition ratio
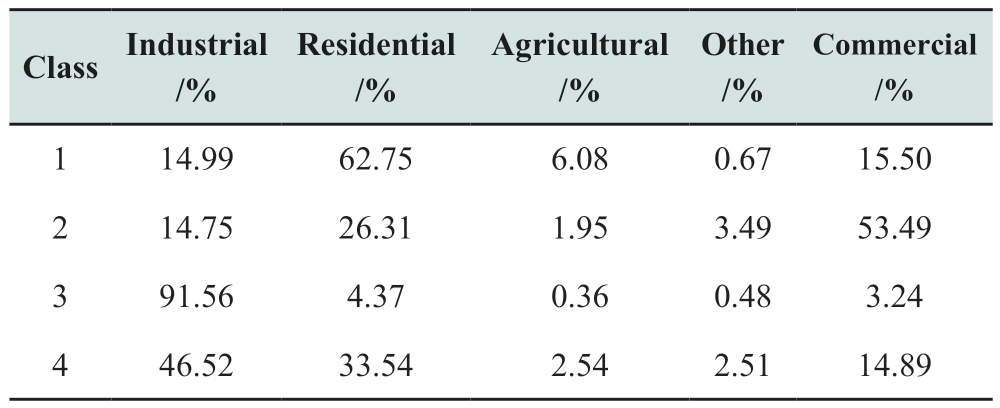
The cluster analysis results indicate that the first substation type is dominated by residential loads (accounting for approximately 63%) and supplemented by industrial and commercial loads (accounting for 15% and 16%,respectively). The second type of substation is dominated by commercial loads (accounting for approximately 53%)and supplemented by industrial and residential loads(accounting for 15% and 26%, respectively). The third type of substation is dominated by industrial loads (accounting for approximately 92%). The fourth substation type is dominated by industrial and residential loads (accounting for 47% and 34%, respectively) and supplemented by commercial loads (accounting for approximately 15%).
3.2 Algorithm clustering performance
The objective function values of the KFCM algorithm over 25 iterations are shown in Fig. 4. The variation of the objective function values during 25 iterations of the SAGAKFCM algorithm is illustrated in Fig. 5.
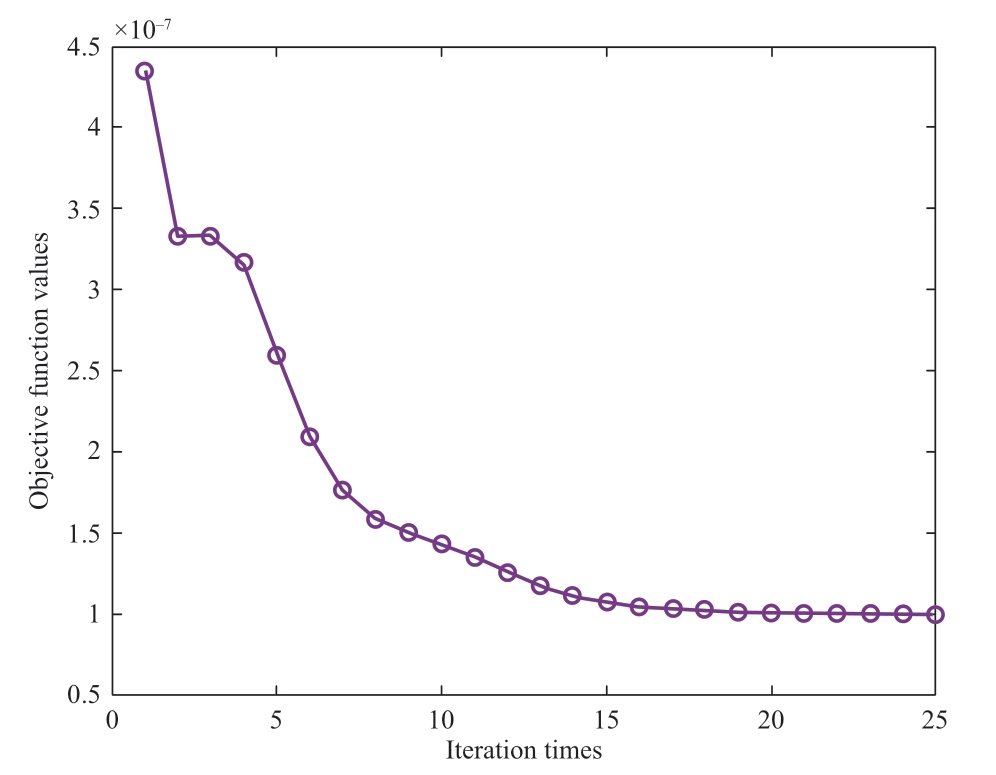
Fig. 4 Evolution curve of objective function values of KFCM algorithm

Fig. 5 Evolution curve of objective function values of SAGA-KFCM algorithm
By contrasting Figs. 4 and 5, the objective function value curve of the KFCM algorithm is observed to exhibit a more gradual change with each iteration, suggesting that reaching the local optimal solution is possible. However, for the SAGA-KFCM algorithm, the objective function values significantly differ from the global optimal solution only after a few iterations. To control the fluctuations in fitness value, the SAGA-KFCM algorithm compares the objective function values of two iterations. Therefore, the algorithm iterates constantly around the global optimal solution.Consequently, the SAGA-KFCM algorithm outperforms the KFCM algorithm in terms of global search performance.
Moreover, the final objective function value of the SAGA-KFCM algorithm is 8.8873e-8; however, the objective function value of the KFCM algorithm eventually converges to 9.9953e-8. The SAGA-KFCM algorithm is preferred over the KFCM algorithm because its final objective function value is lower than that of the latter.
The results of the standard deviation analyses conducted before and after optimization are listed in Table 5.
Table 5 Standard deviation analysis results
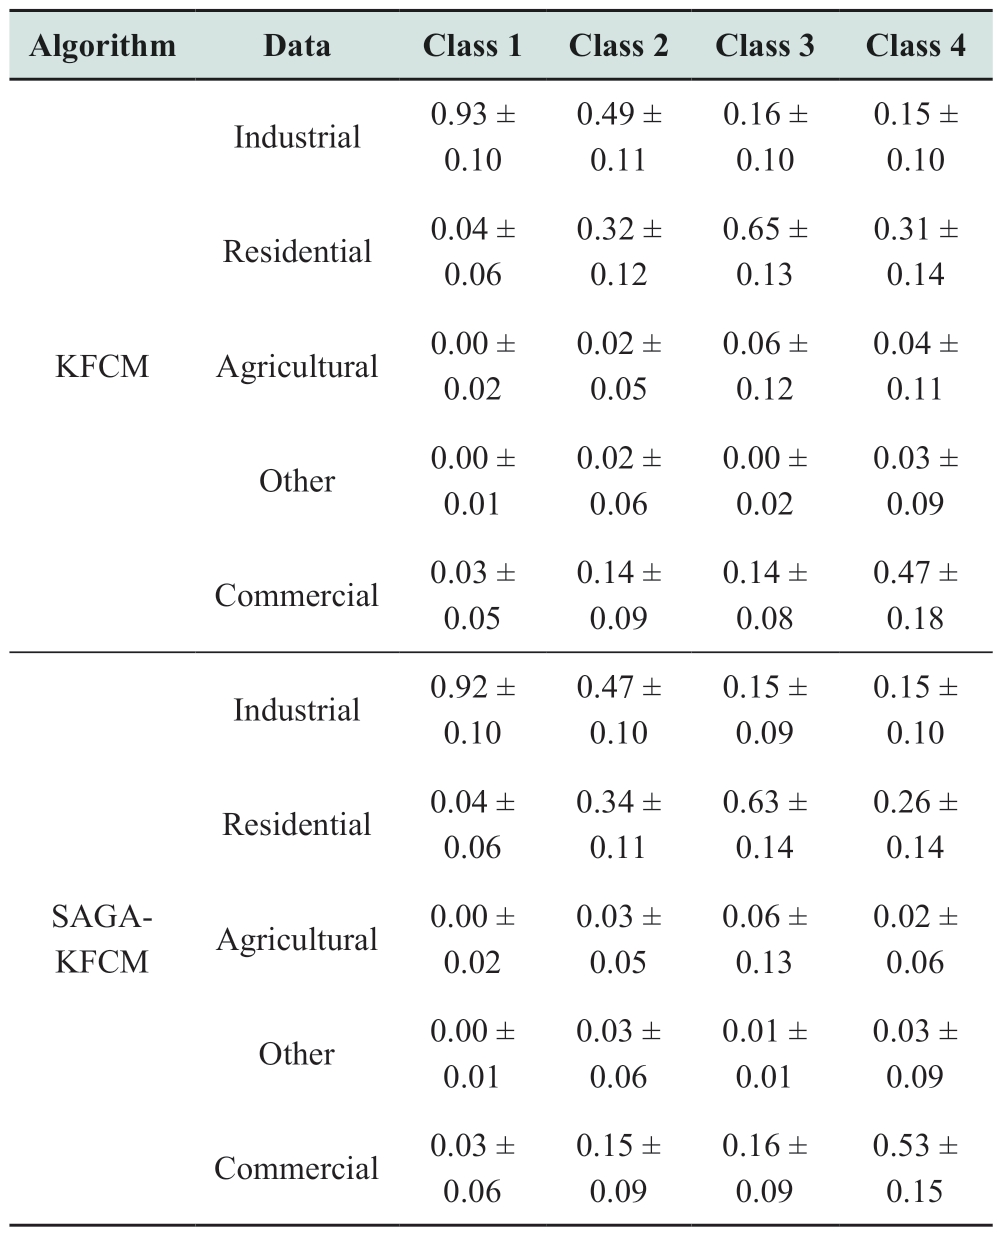
In Table 5, the data denote “mean ± standard deviation.” Standard deviation indicates the degree of data dispersion in each group. The lower the standard deviation, the closer the group’s data are to the average value, and the more stable the clustering outcome. Table 5 lists the standard deviations of the clustering outcomes obtained using the two algorithms. The clustering results of the SAGA-KFCM algorithm exhibit minor standard deviations. Consequently,the intraclass data produced by the SAGA-KFCM algorithm are more compact, and the clustering outcome is more stable than those of the KFCM algorithm.
The clustering center values of KFCM and SAGAKFCM are listed in Tables 6 and 7.
Table 6 Clustering center coordinates of KFCM and SAGA-KFCM
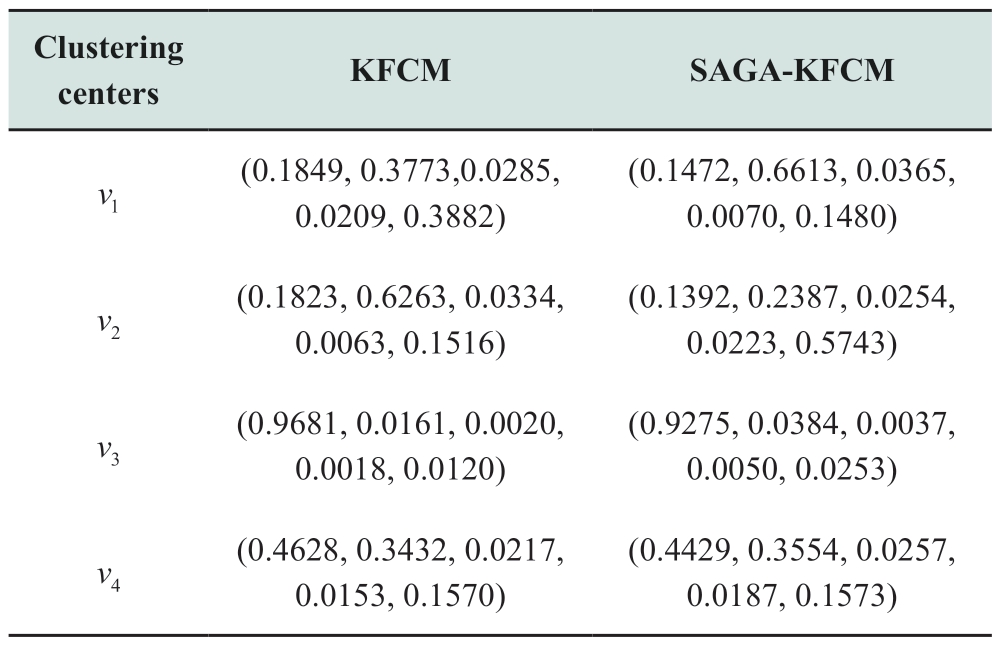
Table 7 Distance between clustering centers of KFCM and SAGA-KFCM
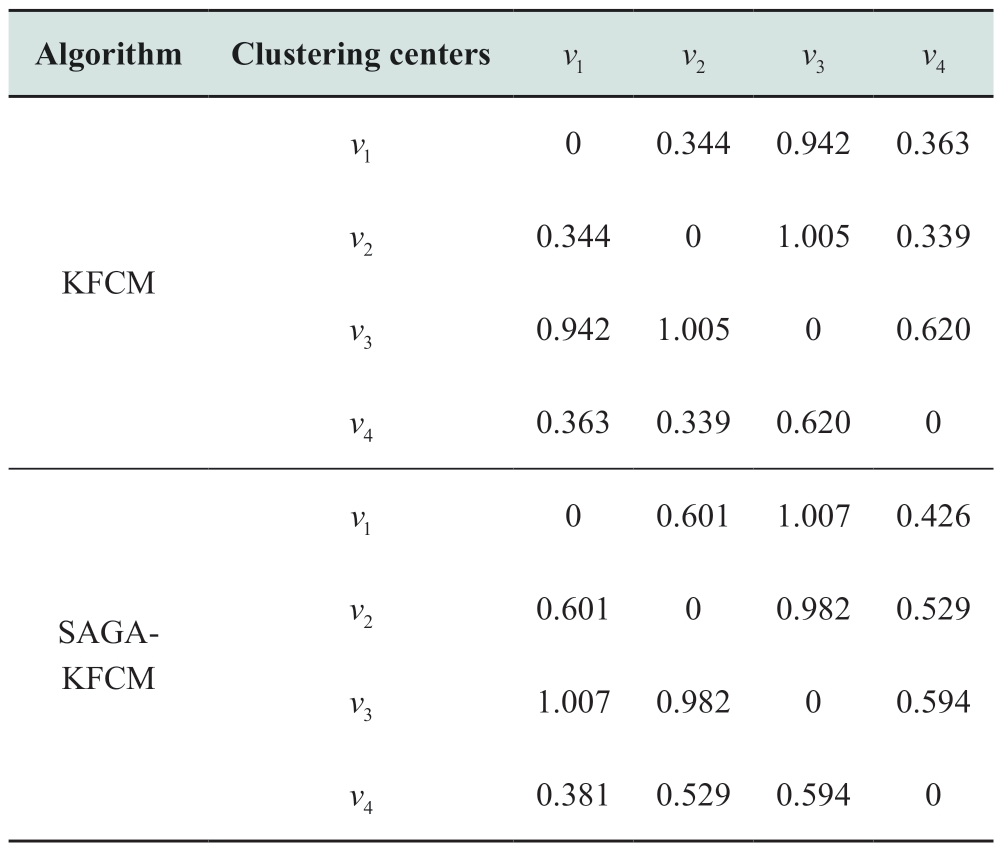
Table 7 indicates that the distances of most cluster centers increase after optimization; the distances between cluster centers v1 and v2 and between v1 and v4 increase significantly. This indicates that the SAGA-KFCM algorithm distinctly discriminates between two cluster centers. Consequently, falling into aliasing is avoided, and more accurate clustering results are generated.
The evaluation indices of various algorithms under the same parameters are summarized in Table 8 for comparison.The scatter plots produced by the results of the various algorithms are shown in Figs. 6–10. The scattered outer circles of various colors denote various categories.
Table 8 Clustering evaluation indices of algorithms

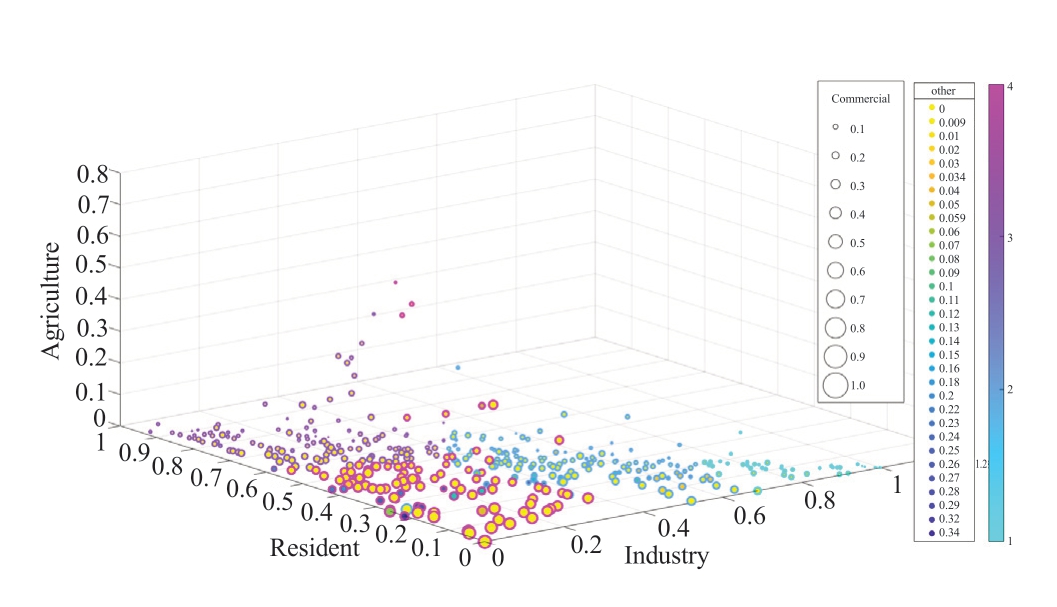
Fig. 6 Scatter plot of FCM algorithm

Fig. 7 Scatter plot of KFCM algorithm
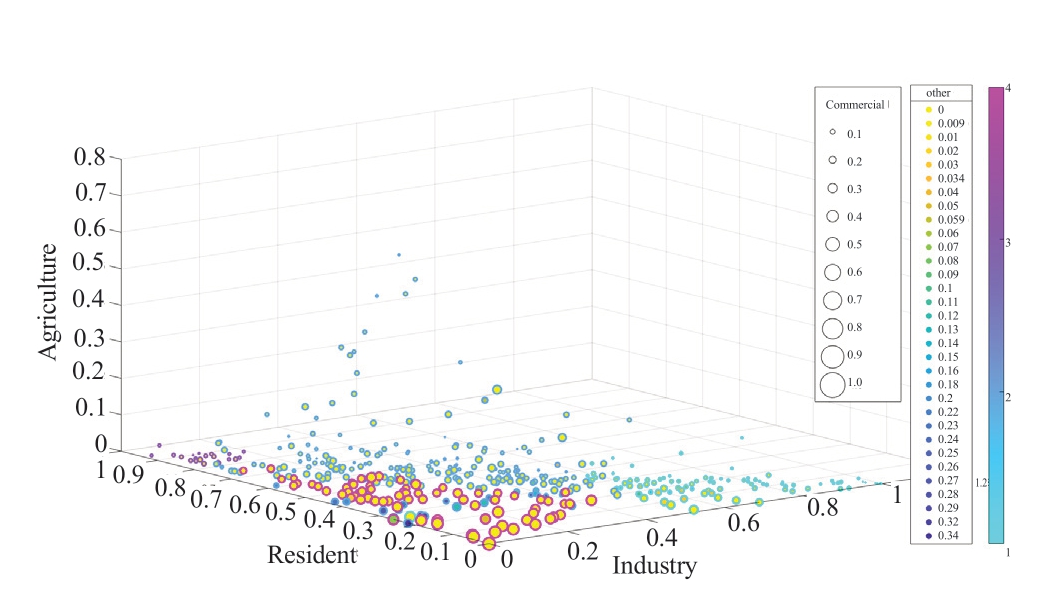
Fig. 8 Scatter plot of PSO-FCM algorithm

Fig. 9 Scatter plot of GA-KFCM algorithm

Fig. 10 Scatter plot of SAGA-KFCM algorithm
Although the FCM and KFCM algorithms require shorter computational times than the other algorithms,their outputs differ. Table 8 lists the optimal clustering results. However, the clustering performance is probably insufficient. For example, Fig. 11 shows that the KFCM algorithm converges to a local optimum solution. The main reason is that the algorithm’s initial clustering center has not been appropriately selected. The scatter plot also demonstrates the weakness of the PSO-FCM algorithm in clustering; an aliasing phenomenon occurs among the categories. In contrast, the GA-FCM and SAGA-KFCM algorithms exhibit superior clustering performance although their computational times are longer than those of the other algorithms. The two algorithms reduce the risk of local convergence and offer acceptable global search capabilities.The SAGA-KFCM algorithm categorizes scatter points with comparable positions, sizes, and inner circle colors into one category. It produces the highest CH and SC values;however, the DB is low. This suggests that the clustering results of the SAGA-KFCM algorithm have the tightest grouping, the smallest distance between two samples inside the same cluster, the most significant gap between two samples among different clusters, the most pronounced boundaries among clusters, and the best clustering performance.
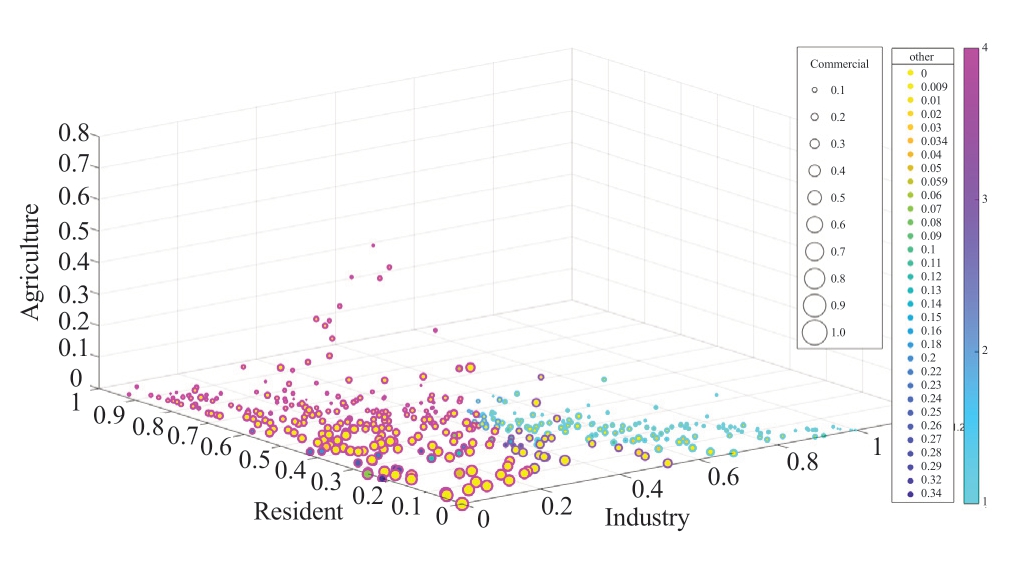
Fig. 11 Scatter plots with low clustering performance using KFCM algorithm
4 Conclusions
A substation clustering algorithm based on an improved KFCM algorithm with adaptive optimal clustering number selection is proposed in this paper. The ratio of the clustering evaluation index CH to DB is calculated to determine the ideal number of clusters. The combination of the SA and GA is used to overcome the local convergence phenomenon. The following are observed from an example.
(1) Clustering performance is assessed using the clustering validity indices (DB, CH, and SC), to determine the ideal number of clusters. An evaluation method using two indices is developed in this study by calculating the value of CH/DB. This method is more objective and overcomes the subjectivity and blindness of the conventional KFCM algorithm in artificially determining the number of clusters.
(2) The clustering performance of the SAGA-KFCM algorithm is superior to that of the other clustering methods.The algorithm is capable of comprehensively clustering large-scale load substation data. Moreover, the proposed algorithm resolves the local convergence problem of the KFCM algorithm by converging to the global optimal solution more efficiently.
Acknowledgements
This work was supported by the Planning Special Project of Guangdong Power Grid Co., Ltd.: “Study on load modeling based on total measurement and discrimination method suitable for system characteristic analysis and calculation during the implementation of target grid in Guangdong power grid” (0319002022030203JF00023).
Declaration of Competing Interest
We declare that we have no conflict of interest.
References
[1] Zhao J, Ju P, Shi J, et al. (2020) Review and prospects for load modeling of power system. Journal of Hohai University (Natural Sciences), 48(1): 87-94
[2] Xu Y, Zhang L, Song G (2015) Application of clustering hierarchy algorithm based on Kernel Fuzzy C-Means in power load classification. Electric Power Construction, 36(4): 46-51
[3] Tsekouras G J, Hatziargyriou N D, Dialynas E N (2007) Twostage pattern recognition of load curves for classification of electricity customers. IEEE Transactions on Power Systems,22(3): 1120-1128
[4] Xu T-S, Chiang H-D, Liu G-Y, et al. (2017) Hierarchical K-means method for clustering large-scale advanced metering infrastructure data. IEEE Transactions on Power Delivery, 32(2):609-616
[5] Wu Z, Dong X, Liu Z, et al. (2017) Power system bad load data detection based on an improved fuzzy C-means clustering algorithm. 2017 IEEE Power & Energy Society General Meeting(PESGM)
[6] Alonso A M, Nogales F J, Ruiz C (2020) Hierarchical clustering for smart meter electricity loads based on quantile autocovariances. IEEE Transactions on Smart Grid, 11(5): 4522-4530
[7] Zhang M, Li L, Yang X, et al. (2020) A load classification method based on Gaussian mixture model clustering and multidimensional scaling analysis. Power System Technology, 44(11):4283-4296
[8] Li Z, Wu J, Wu W, et al. (2008) Power customers load profile clustering using the SOM neural network. Automation of Electric Power Systems, 2008(15): 66-70+78
[9] Yu J, Yang M (2005) Optimality test for generalized FCM and its application to parameter selection. IEEE Transactions on Fuzzy Systems, 13(1): 164-176
[10] Shi L, Zhou R, Zhang W, et al. (2019) Load classification method using deep learning and multi-dimensional Fuzzy C-means clustering. Proceedings of the CSU-EPSA, 31(7): 43-50
[11] Song Y, Li C, Qi Z (2014) Extraction of power load patterns based on Cloud Model and Fuzzy clustering. Power System Technology, 38(12): 3378-3383
[12] Xie W, Zhao Q, Guo N, et al. (2019) Application of the improved parallel fuzzy kernel C-means clustering algorithm in power load forecasting. Electrical Measurement & Instrumentation, 56(11):49-54+60
[13] Meng A, Lu H, Li H, et al. (2015) Electricity customer classification based on optimized FCM clustering by hybrid CSO.Power System Protection and Control, 43(20): 150-154
[14] Shang C, Gao J, Liu H, et al. (2021) Short-term load forecasting based on PSO-KFCM daily load curve clustering and CNNLSTM model. IEEE Access, 9: 50344-50357
[15] Zhou K, Yang S (2012) An improved fuzzy C-means algorithm for power load characteristics classification. Power System Protection and Control, 40(22): 58-63
[16] He M, Qin R, He X, et al. (2022) Cluster analysis of user daily load curve based on fusion evolutionary algorithm. Journal of Kunming University of Science and Technology (Natural Science), 47(3): 96-105
[17] Zhou K, Yang S, Wang X, et al. (2014) Load classification based on improved FCM algorithm with adaptive fuzziness parameter selection. Systems Enginering-Theory & Practice, 34(5): 1283-1289
[18] Dong R, Huang M (2014) An improved FCM algorithm based on subtractive clustering for power load classification. East China Electric Power, 42(5): 917-921
[19] Hao X, Zhang C, Pei T, et al. (2020) Power load data preprocessing based on adaptive PFCM clustering. Electrical Measurement & Instrumentation, 57(21): 40-46
[20] Yang X, Zhang G, Lu J, et al. (2011) A kernel fuzzy c-means clustering-based fuzzy support vector machine algorithm for classification problems with outliers or noises. IEEE Transactions on Fuzzy Systems, 19(1): 105-115
[21] Wu Y, Gao C, Cao H, et al. (2020) Clustering analysis of daily load curves based on GWO algorithm. Power System Protection and Control, 48(6): 68-76
[22] Lei H, Liu N, Cui D, et al. (2011) Transformer fault diagnosis based on optimized FCM clustering by hybrid GA and PSO.Power System Protection and Control, 39(22): 52-56
[23] Li M Q (2002) The basic theory and application of genetic algorithm. Science Press
[24] Jin Q, Li X (2006) GA parameter setting and its application in load modeling. Electric Power Automation Equipment, 2006(5):23-27
[25] Liu H, Hou X (2008) Research on the key parameters in the simulated annealing algorithm. Computer Engineering & Science,166(10): 55-57
Received: 6 February 2023/ Accepted: 6 June 2023/ Published: 25 August 2023
 Yihao Gao
13141316868@163.com
Yanhui Xu
xuyanhui23@sohu.com
Yundan Cheng
yundan@ncepu.edu.cn
Yuhang Sun
sunyuhang63@126.com
Xuesong Li
18660681360@163.com
Xianxian Pan
panxianxianpxx@163.com
Hao Yu
yuhao@gd.csg.cn
2096-5117/© 2023 Global Energy Interconnection Development and Cooperation Organization. Production and hosting by Elsevier B.V. on behalf of KeAi Communications Co., Ltd. This is an open access article under the CC BY-NC-ND license (http: //creativecommons.org/licenses/by-nc-nd/4.0/ ).
Biographies

Yanhui Xu received his Ph.D. from North China Electric Power University. His research interests include dynamic power system analysis and load modeling.

Yihao Gao is working toward her master’s degree at North China Electric Power University. Her research interests include power system load modeling.

Yundan Cheng is working toward her master’s degree at North China Electric Power University. Her research interests include power system stability analysis.

Yuhang Sun is working toward his master’s degree at North China Electric Power University. His research interests include power system load modeling.

Xuesong Li is working toward his master’s degree at North China Electric Power University. His research interests include power system load modeling.

Xianxian Pan received her master’s degree at North China Electric Power University in 2015. She is currently working in Guangdong Power Grid Co., Ltd. Her research interests include power grid planning and power system analysis and control.

Hao Yu received his master’s degree at North China Electric Power University in 2012. He is currently working at Guangdong Power Grid Co., Ltd. His research interests include power grid planning, new energy power system modeling, and simulation.
(Editor Yajun Zou)
