0 Introduction
In recent years, with the extensive installation of smart meters and development of information technology,distribution networks have accumulated large amounts of daily operation data. Based on data mining technology, the potential value of these data can be extracted and applied to distribution system planning, power market transactions,and equipment asset management, which significantly improves the accuracy and efficiency of power distribution enterprises’ decision-making [1, 2].
The application of style="font-size: 1em; text-align: justify; text-indent: 2em; line-height: 1.8em; margin: 0.5em 0em;">These studies focused on the theoretical innovation of this method. However, because of the insufficient prescreening of characteristic indices, an invalid input occupies the memory capacity and increases the computing time. Additionally, the correlation analysis lacked a rationality test.
Therefore, in this study, an improved Apriori algorithm was proposed to extract correlation knowledge from distribution network operation data. A correlation analysis model for the characteristic indices and feeder load rate was established. The confidence degrees of the correlation rules of the influencing factors were calculated, and strong correlation rules were verified.The proposed method can effectively mine the potential value of distribution network data, automatically form correlation rules, and identify the influential factors of existing problems, such as feeder load rate, system supply capacity, voltage deviation, and power supply reliability.This method can provide a reference for planners when formulating planning schemes, thus improving the efficiency of distribution network planning.
1 Characteristic index system for distribution network
From the perspective of the accuracy of the analysis model, the more complete the operation data collected from the distribution network, the more accurately the association rules obtained from the analysis model reflect the actual situation, and the higher is the confidence of the model. However, in terms of workload, with accuracy and confidence being guaranteed, the fewer the characteristic indices in the dataset are, the lower the cost of data collection. Therefore, when constructing a characteristic index system for distribution network evaluation and planning, it is necessary to consider the relationship between accuracy and feasibility, select reasonable and easily accessible indices, and conduct a correlation analysis.
1.1 Characteristic index for correlation analysis
This study focuses on the problem of heavy-load or overload feeders and a correlation analysis model of the problem.
After studying the factors affecting the feeder load rate,the following characteristic indices were selected:
1) Power supply radius
When the power supply radius of the feeder is too large,the voltage drop along the feeder increases, leading to a low voltage at the end of the feeder.
2) Cross section of feeder
If the diameters of the trunk, branch, and subscribe lines are relatively small and the load increases far more than expected, the cross section of the feeder cannot meet the requirements of the load current, which leads to low voltage,heavy load, overload, and other problems.
3) Urban power network and rural power networks
Urban and rural power-load characteristics have significant differences. Therefore, it is necessary to include local attributes in the characteristic index system.
4) Service life of equipment
Prolonged service leads to equipment ageing and reduced insulation levels. Simultaneously, network losses and voltage drops increase. Therefore, the correlation between the service life of equipment and heavy loads,overloads, and low-voltage problems must be considered.
5) Load Density
Load density is the ratio of the maximum load to the power supply area in a region. The higher the load density,the greater is the load in a certain area.
6) Reactive compensation
Insufficient reactive compensation for the line leads to low voltage at the end of the feeder.
7) Other common indexes
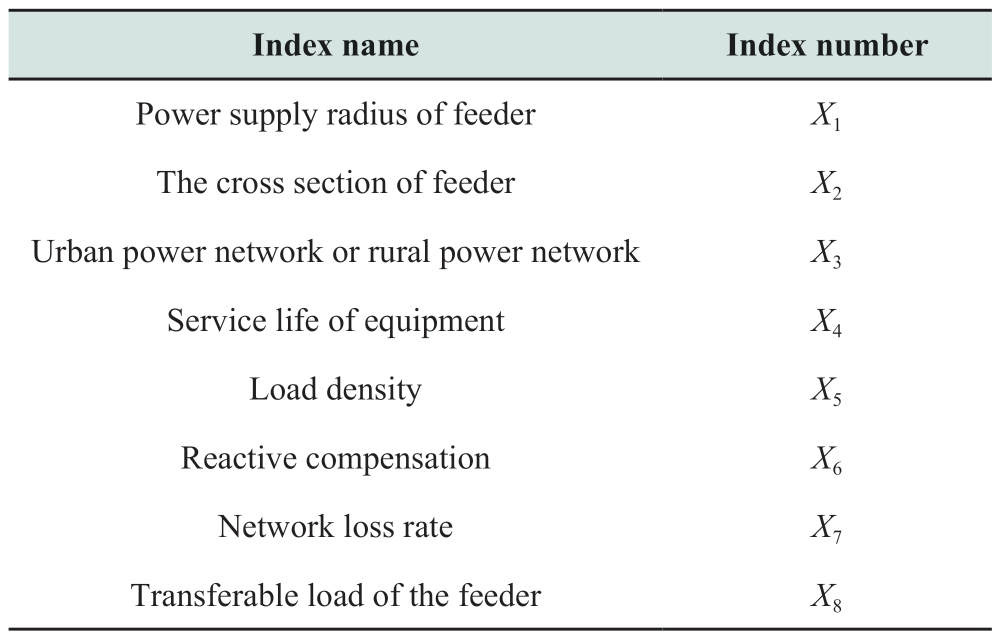
Indices such as the network loss rate, feeder connection mode, distribution grid structure, and transferable load of the feeder are incorporated into the characteristic index system.
The corresponding index numbers are listed in Table 1.
Table 1 Characteristic indexes affecting the feeder’s load rate

1.2 Gray correlation analysis model
Generally, it is difficult to express the relationship between characteristic indices and the problem of concern using an explicit function. Gray correlation analysis can capture the degree of correlation between data sequences according to the geometric similarity of the curves without establishing a specific mathematical function [15]. Gray correlation analysis is suitable for studying the influence of small-scale atypical factors. Based on the gray correlation analysis, a correlation degree model was established in this study to represent the relationship between the feeder load rate and characteristic indices. The procedure is as follows:
1) Set data sequences
The feeder load rate is taken as sample data and expressed as sequence X0,
where x0(n) represents the load rate of the nth feeder.
The characteristic indices are considered as the influencing factors of the analysis problem. The sample data are recorded in sequence Xj,
where Xj represents the sample data sequence of the jth characteristic index and xj(n) represents the value of the jth characteristic index of the nth feeder.
2) Normalize the data sequences
Data transformation, in which data are normalized for data mining, is a key step in data preprocessing. Three data normalization methods are available: min-max normalization, z-score normalization, and normalization using decimal scaling [16]. The min-max normalization method was applied in this study.
where  (k) represents the kth index value of xj after normalization and max xj and min xj denote the maximum and minimum values of xj, respectively.
3) The correlation coefficient γ(x*0(k), x*j(k)) between X0 and Xj at the kth item is calculated as follows:

where ξ refers to the resolution coefficient with a value within the range of [0,1].
4) The degree of gray incidence γ(X0, Xj) between sequence X0 and sequence Xj in Table 1 is obtained as follows:
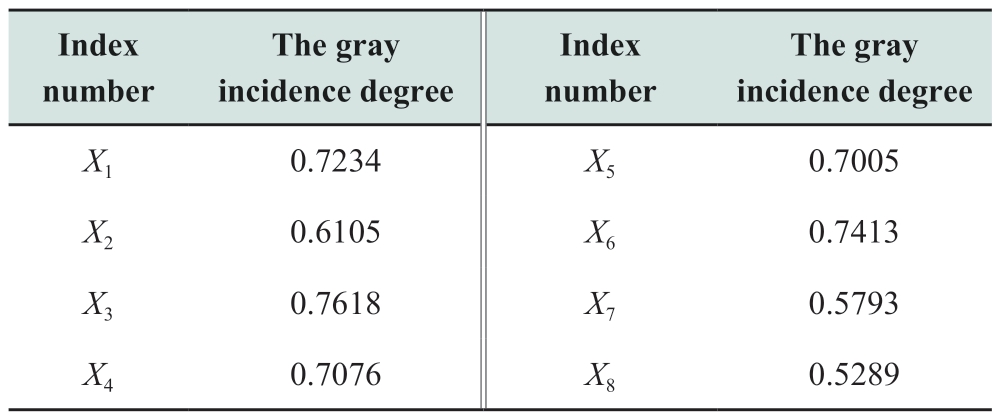
The larger the gray incidence degree is, the higher the degree of correlation between the characteristic index and feeder load rate. An index with a lower gray incidence degree has little influence on the related problem and can be removed. The remaining characteristic indices were used as the inputs of the Apriori algorithm.
2 Rule mining model for distribution network based on Apriori algorithm
The Apriori algorithm is a method for finding frequent item sets in a transactional database [17, 18]. The algorithm compresses the search space using priority analysis.Frequent item sets and association rules are obtained. The problems in distribution networks are complicated and diverse. Some problems already exist, while others may arise in the future; some are individual problems with certain equipment, while others are systematic problems in certain regions. Some closely related problems have obvious effects on each other, whereas other seemingly unrelated problems may have implicit connections. Based on the Apriori algorithm, correlation rule mining can effectively identify the main factors that cause target problems. This helps planners answer the following questions: (1) What are the main causes of the current problem? (2) What other problems arise from the current problem?
2.1 The Apriori algorithm
An association rule represents a specific causal relationship. The rule is defined in the form of X⇒Y and should satisfy the conditions X, Y ⊆ I and X∩Y=∅. Here,I = {i1, i2,…, in} is the item set, and in denotes the nth item of set I. X and Y are the true subsets of I, and they are mutually exclusive. The association rule X⇒Y reveals that when X appears, Y follows.
In association rule mining, a sample represents a transaction, and a transaction is a subset of I. The ratio of the number of X transactions to the total number of transactions is called the support of X and is labeled support(X). The ratio of the transaction number of X and Y to the total transaction number is called the support of association rule X⇒Y, and is labeled support (X ⇒Y), that is,

where support_count (X) and support_count (X ∪ Y) denote the number of transactions containing X and the number of transactions containing both X and Y respectively, and total_count denotes the total number of transactions.
Apart from the support, the confidence of the association rule is applied to determine whether the association rule X⇒Y is valid. Confidence refers to the ratio of the transaction number containing both X and Y to the transaction number X, expressed as confidence (X⇒Y) as follows:
When support (X⇒Y) ≥ min_sup, and confidence(X⇒Y) ≥ min_conf, the association rule X⇒Y is a strong association rule. An association rule can only be used for subsequent association-rule mining when its support is greater than the minimum support (min_sup), that is, the minimum frequency of occurrence, and the corresponding item set {X, Y} is a frequent item set. The association rule must also achieve the minimum confidence (min_conf). The generation process for a frequent item set consists of two steps: extension and pruning [19].1) Extension. Let Lk={l1, l2, …, ln} be the set of frequent item sets containing k items and ln be the nth frequent item set containing k items. If l1 and l2 have k − 1 same items and one different item, then, as a result of the extension, l1 and l2 become a new item set containing k + 1 items. Similar combinations are searched until finally set Tk+1 is generated,which contains k + 1 items.2) Pruning. The item sets in Tk+1 that do not match the minimum support are removed, and the set Lk+1 of frequent item sets containing k+1 items is obtained.Finally, strong association rules are generated from frequent item sets according to the minimum confidence.
2.2 Association rule mining model for distribution network problems
An improved Apriori correlation algorithm is proposed for a 10 kV distribution network to mine the association rules between the influencing factors of distribution network planning and the heavy-load or overload problem of feeders and distribution transformers. The degree of correlation between the heavy load or overload and the influencing factors was studied using the following steps:
1) Discretize the data features to form an item set Because the Apriori algorithm cannot directly mine continuous variables for association rules, the data on continuous-type electrical indices must be discretized. The threshold values must be set to determine the value range and realize data discretization. After being numbered, the discrete electrical indices form item set I.
2) Form the transaction set T. For the distribution network, each feeder or distribution substation corresponds to a transaction, and each transaction contains an item set determined by the electrical indices of that device.
3) Generate a frequent item set and output association rules. According to the predefined minimum values of support min_sup and confidence min_conf, the frequent item set l and strong association rules are generated.
The flow is shown in Fig. 1.

Fig. 1 Rule mining flow chart based on Apriori algorithm
2.3 Relevance of association rules based on lift and chi-square test
The data quality of the distribution network affects the reliability of the association rules based on the Apriori algorithm. Therefore, it is necessary to improve the classic Apriori algorithm by checking the relevance of the association rules from the perspective of data independence.This study introduced the concept of lift and the statistical chi-square test [20-22] to measure the relevance and validity of mined association rules. The lift can be expressed as
If a rule is valid, the lift of that rule deviates from 1.
The chi-square test χ2 can be expressed as
where Ai is the actual frequency (i.e., number of occurrences), Ei is the expected frequency, and n is the total frequency. Suppose that there is no association between the variables. When the chi-square test value is greater than the marginal value defined in the distribution table of the chisquare marginal values, the original hypothesis is not valid.
3 Test example analysis
Considering the distribution network data of a certain region as an example, the Apriori algorithm-based data mining method and a correlation analysis model were used to determine the association rules for distribution network problems and provide guidance for distribution network planning.
3.1 Association rule mining for heavy-load or overload feeders
A total of 220 feeders were randomly selected from the 10 kV distribution network data. The gray incidence degree of the characteristic index was obtained based on the gray correlation analysis, as presented in Table 2.
Table 2 Gray incidence degree of the characteristic index

The indexes above 0.7 were applied to the Apriori algorithm, which included the power supply radius, feeder cross-section, power supply district type, service life of equipment, load density, and reactive power compensation.Using these indices, association rules were mined for the overloaded feeder.
Based on the distribution network planning guidelines,the data on the indices were divided according to the threshold values to realize data discretization. For example, the supply radii of urban and suburban mediumvoltage lines should be within 3 and 6 km, respectively.Before mining the association rules, data that exceeds the corresponding power supply radius were labeled as “larger power supply radius,” and the rest were labeled as “normal power supply radius.” Districts A–E-Level represent district types with different load densities. The discrete index data are presented in Table 3.
Table 3 Discrete index data number

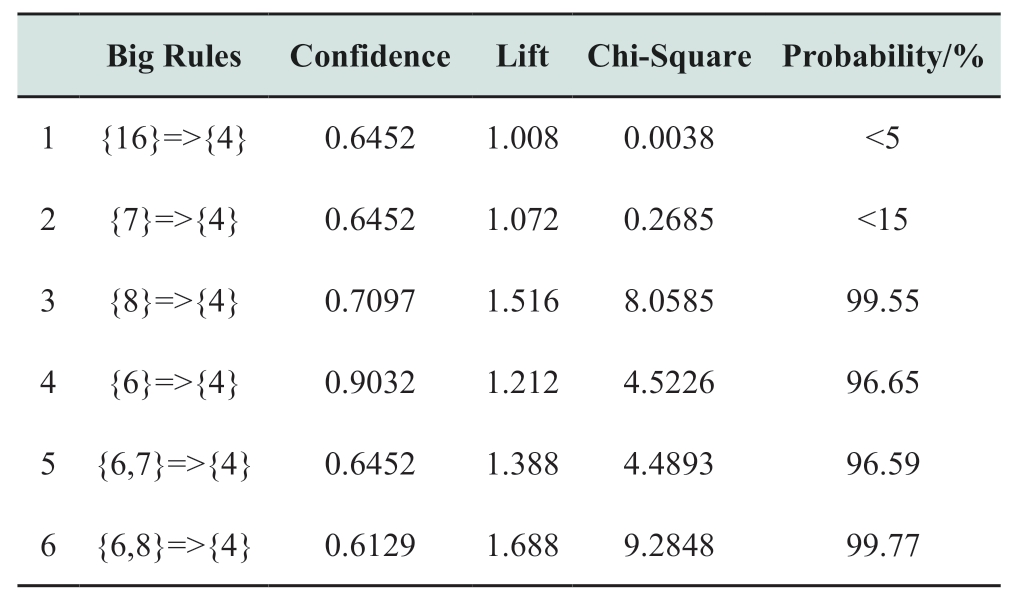
Based on Table 3, the feeder index data were converted into the corresponding array forms, that is, transaction arrays. The data of the set of transaction arrays were then imported into the Apriori algorithm for association rule mining to obtain frequent item sets and their support, strong association rules (big rules), and confidence. The strong association rules and their confidence obtained are presented in Table 4, where “Chi-Square” refers to the chi-square value and “Probability” refers to the distribution probability corresponding to the chi-square value.
Table 4 Results of strong association rules

From the table, the following can be observed:
1) The probabilities of association between the elements of Rules 1 and 2 are less than 5% and 15%, respectively,and the lifts of Rules 1–2 are very close to 1, indicating that the elements contained in these two rules are likely to be independent of each other. Therefore, these two rules were eliminated as being invalid.
2) Rule 3 shows that there is a 99.55% probability that a heavy load or feeder overload is strongly associated with a long operating life.
3) Rule 4 reveals that the probability of heavy feeder loads or overload problems in rural power networks is 96.65%. Therefore, local economic situations and additional margins should be considered in rural power network planning.
It is generally believed that urban power networks have a greater load density and are therefore more likely to lead to heavy load or overload problems; however, Rule 4 proves that the opposite is true. This means that the urban distribution network is well planned, and the possibility of feeder heavy load or overload problems is low.
4) The probability of Rule 5 is 96.59%, indicating that a heavy load or overload problem is more likely to occur in rural feeders with large supply radii.
5) The probability of Rule 6 is 99.77%, indicating that a heavy load or overload problem is more likely to occur in rural feeders with long operating lives.
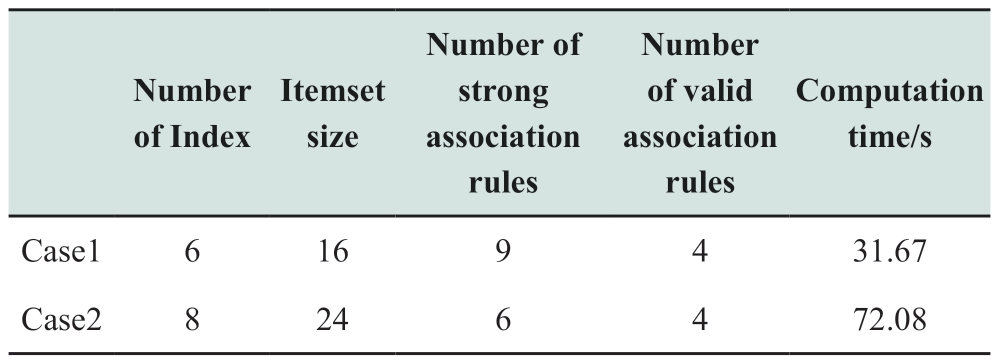
To verify the effectiveness of the proposed method, two cases were determined and compared. Case 1 was based on the improved Apriori algorithm with a prescreening operation of the index through gray correlation. Case 2 was based on the normal Apriori algorithm without any index preprocessing. A comparison of the results is presented in Table 5. It can be observed that the method proposed in this study (Case 1) significantly reduces the solution dimensions and computation time while ensuring solution accuracy.
Table 5 Comparison of results in different situations

3.2 Association rule mining for feeder reliability
The causes of unexpected power outage of the 330 feeders were randomly selected from the 10 kV distribution network data. The mean interruption duration of customers(AIHC) was used to characterize the reliability of the feeder.The AIHC and various outage causes are listed in Table 6.The association rules between AIHC and unexpected power outage causes were mined based on the improved Apriori algorithm, and the results are presented in Table 7.
According to Table 7, Rules 2 and 3 have a probability of association greater than 95%, and their lift is greater than 1, indicating that the elements in the association rule are positively correlated. Rule 2 shows that for feeder outages owing to customer influence, the probability of AIHC exceeding 10 h is 98.94%. According to Rule 3,under the condition of frequent lightning damage and a short distance between the tree and wire, the probability of the feeder AIHC exceeding 10 h was 97.76%. To reduce AIHC and improve reliability, in feeders with frequent customer impact problems, it is necessary to install switches on the user side to isolate faults. For feeders with frequent lightning damage and short electric distances, it is necessary to strengthen lightning protection facilities, regularly cut trees along the line, and implement measures to promote safety management.
Table 6 Text data numbering table

Table 7 Results of strong association rules

4 Conclusion
To mine the explicit and implicit association rules of a distribution network, this study proposes an Apriorialgorithm-based relevance-knowledge extraction model for distribution network planning. The gray correlation analysis method was used to achieve a preliminary screening of the electrical indices, which effectively reduced the dimensionality of the feature vectors and the computation time of the algorithm. Invalid association rules were removed after strong association rules were verified using the lift and chi-square tests. The results show that the proposed algorithm can realize correlation knowledge extraction for distribution network planning,obtain the main associated factors of network problems,and therefore provide a reference for distribution network planning.
Acknowledgements
This work was supported by the Science and Technology Project of China Southern Power Grid(GZHKJXM20210043-080041KK52210002).
Declaration of Competing Interest
We declare that we have no conflict of interest.
References
[1] Bhattarai P B, Paudyal S, Luo Y, et al. (2019) Big data analytics in smart grids: state-of-the-art, challenges, opportunities, and future directions. IET Smart Grid, 2: 141-154
[2] Guo Y, Yang Z, Feng S, et al. (2018) Complex power system status monitoring and evaluation using big data platform and machine learning algorithms: a review and a case study.Complexity, 2018: 1-21
[3] A. V E,S. P G (2022) Probabilistic spatial load forecasting for assessing the impact of electric load growth in power distribution networks. Electric Power Systems Research, 207: 190-199
[4] Xiao B, Liu Q, Fang L, et al. (2017) Spatial load forecasting based on Fuzzy Rough Set Theory with spatial and temporal information. Electric Power Construction, 38(1): 58-67
[5] Alessandro B, Matteo M, Stefano S, et al. (2022) Probabilistic electric load forecasting through Bayesian mixture density networks. Applied Energy, 309: 640-670
[6] Liu S, Fu X, Ye C, et al. (2017) Spatial load clustering and integrated forecasting method of distribution network considering regional difference. Automation of Electric Power Systems Press,41(3): 70-75
[7] Yao P, Lin D (2016) Optimal distribution automation planning method based on data mining on structure features of distribution feeders. Southern Energy Construction, 3(2): 36-41
[8] Hu K, Zhu Z, Xu Y, et al. (2023) ADGWN: adaptive dualchannel graph wavelet neural network for topology identification of low-voltage distribution grid. Journal of Intelligent and Fuzzy Systems, 44(2): 3369-3380
[9] Tang J, Cai Y, Zhou L, et al. (2020) name="ref10" style="font-size: 1em; text-align: justify; text-indent: 2em; line-height: 1.8em; margin: 0.5em 0em;">[10] Xie C, Li C, Zhang D, et al. (2020) Reverse identification of the relationship of feeder-transformer connectivity in distribution grid applying smart meter measurement data. Electric Power Construction, 41(11): 94-100
[11] Peng Y, Liu K (2011) A distribution network theoretical line loss calculation method based on improved core vector machine.Chinese Society for Electrical Engineering, 31(34): 120-126
[12] Zhang Y, Wang Z, Liu L, et al. (2019) A 10kV distribution network line loss prediction method based on Grey Correlation Analysis and improved artificial neural network. Power System Technology Press, 43(4): 1404-1410
[13] Yang J, Xiang Y, Liu J (2022) Adaptive transfer learning of small sample correlation rules for distribution network investment decision. Chinese Society for Electrical Engineering, 42(16):5823-5834
[14] Tan C, Geng S, Tan Z, et al. (2021) Optimization model for grid companies participating in incremental distribution network investment model. Power System Technology Press, 45(11):4375-4386
[15] Liu S (2017) Grey systems theory and its applications, 8rd ed.Beijing: Science Press, pp. 53-57
[16] Wang Z (2018) Principles and implementations of data mining algorithms, 2rd ed. Beijing: Tsinghua University Press, pp. 21-22
[17] Tian M, Zhang L, Guo P, et al. (2020) Data dependence analysis for defects data of relay protection devices based on Apriori Algorithm. IEEE Access, 8: 120647-120653
[18] Verma N, Singh J (2017) An intelligent approach to big data analytics for sustainable retail environment using apriorimapreduce framework. Industrial Management and Data Systems, 117(7): 1503-1520
[19] D’Angelo G, Tipaldi M, Palmieri F, et al. (2019) A datadriven approximate dynamic programming approach based on association rule learning: spacecraft autonomy as a case study.Information Sciences, 504: 501-519
[20] Zhe F (2020) Research on travel characteristics of rail transit in Beijing based on correlation rules. Kunming, China: Kunming University of Science and Technology
[21] Althuwaynee O F, Aydda A, Hwang I-T, et al. (2021)Uncertainty reduction of unlabeled features in landslide inventory using machine learning T-sne clustering and data mining apriori association rule algorithms. Applied Sciences, 11(2)
[22] Chen B, Ding J, Chen S (2018) Selection of key incentives for power production safety accidents based on association rule mining. Electric Power Automation Equipment, 38(4): 68-74
Received: 20 March 2023/ Accepted: 12 July 2023/ Published: 25 August 2023
 Xinyi Liang
982434641@qq.com
Zhifang Zhu
zhuzhifang@163.com
Zihan Lin
lzh7860@163.com
Liping Chen
chenliping@gzps.csg.cn
Hong Dong
donghong@gzps.corp.csg
Yanna Gao
13512778095@163.com
Jiahao Deng
1054099089@qq.com
2096-5117/© 2023 Global Energy Interconnection Development and Cooperation Organization. Production and hosting by Elsevier B.V. on behalf of KeAi Communications Co., Ltd. This is an open access article under the CC BY-NC-ND license (http: //creativecommons.org/licenses/by-nc-nd/4.0/ ).
Biographies

Zhifang Zhu received his master’s degree at Huazhong University of Science and Technology, Wuhan, in 2005. He is working in Guangzhou Power Supply Bureau of Guangdong Power Grid Co., Ltd. His research interests is power system planning.

Zihan Lin received her master’s degree at Zhejiang University, Hangzhou, in 2020. She is working in Guangzhou Power Supply Bureau of Guangdong Power Grid Co., Ltd. Her research interests is power system planning.

Liping Chen received her master’s degree at Huazhong University of Science and Technology, Wuhan, in 2008. She is working in Guangzhou Power Supply Bureau of Guangdong Power Grid Co., Ltd. Her research interests is power system planning.

Hong Dong received her master’s degree at Xi’an Jiaotong University, Xi’an, in 2008.She is working in Guangzhou Power Supply Bureau of Guangdong Power Grid Co.,Ltd. Her research interests is power system planning.

Yanna Gao received her master’s degree at Tianjin University, Tianjin, in 2009. She is working in Guangzhou Power Supply Bureau of Guangdong Power Grid Co., Ltd. Her research interests is power system planning.

Xinyi Liang received her bachelor’s degree at North China Electric Power University,Beijing, in 2022, and she is pursuing her master’s degree at South China University of Technology, Guangzhou. Her research interests is power system planning.

Jiahao Deng received his master’s degree at South China University of Technology,Guangzhou, in 2023. He is working in Shantou Power Supply Bureau of Guangdong Power Grid Co., Ltd. His research interests is power system planning.
(Editor Tongming Liu)
