0 Introduction
With the increasingly severe climate problem,many countries and regions have proposed the goal of “carbon peaking and carbon neutrality” and formulated corresponding policies [1]. In September 2020, China proposed a targeted carbon peak by 2030 and carbon neutrality by 2060 [2]. Building a carbon emissions trading market based on the cap-and-trade system and transforming the original unconstrained carbon emission rights into scarce resources are effective market-based means of promoting carbon emissions reduction. In 2021, China launched the Chinese national carbon emissions trading market [3]. Carbon market entities are enterprises with annual greenhouse gas emissions exceeding 26,000 tons[4]. Because the carbon emissions of the thermal power industry account for more than 40% of China’s total carbon emissions, 2,225 power generation enterprises were included in the carbon emissions trading market (carbon market) as the first batch of key emissions enterprises. The scope will gradually expand, eventually covering industries including power generation, petrochemicals, chemicals, building materials, steel, nonferrous metals, papermaking, and civil aviation [5]. Participation of thermal power enterprises in the carbon market will inevitably add the CEC, and CEC size will be influenced by the carbon emissions rights trading conditions of thermal power enterprises.
The electricity market is a complex market that involves interaction between the objective physical properties of power system operation and the subjective decision-making of market entities [6]. Its construction is also a key factor in promoting energy reform and energy transformation in China. The CEC affected by the carbon market, after consideration in the operating cost of power generation entities, affects the clearing electric quantity and income of power generation entities in the electricity market, and is transmitted into the electricity price through the market[7-10]. However, clearing the electric quantity of power generation entities in the electricity market also affects carbon emissions, which in turn impacts the trading results in the carbon market. Although the carbon and electricity markets are independent of each other in terms of trading products and operating systems, there is still a close coupling between the two markets owing to their greatly overlapping participants [11-14]. Long-term coupling of the two markets will ultimately promote transformation of the energy structure [15-17]. The “Action Plan for Achieving Carbon Peaking before 2030” issued by the State Council of China on October 26, 2021, proposed promoting market construction of carbon emission rights, energy use rights,and electricity trading as a whole, and strengthening the connectivity and coordination between these market mechanisms [18].
Most studies on electricity market equilibrium and trading behaviors of power generation entities have not considered the impact of carbon market operation nor the impact of the interaction between the electricity and carbon markets, simply setting the carbon emissions rights price or CEC as definite parameters and introducing them into the generation cost model of power generation entities [19-26].The few studies that have considered the interaction between electricity and carbon markets have the following problems.First, the models of physical quantities such as carbon price,carbon emissions, and carbon emissions rights of power generation entities do not adequately reflect the effects of market mechanisms and trading behaviors [27-28]. Second,the analysis of market equilibrium and entity behavior does not consider the difference in time dimensions between carbon trading cycles in the carbon market and clearing cycles in the electricity market [29-32]. Third, replacing the flexible CEC with rigid constraints on carbon emissions within a set hourly period [33-34] weakens the original intention to establish a market mechanism for emissions reduction guidance and lacks practical significance.
In view of these problems, this study fully considers the interaction between the carbon and electric power markets to develop a CEC estimation method for coal-fired units when quoting in the electric power market. The problems in operation of the electric power market after launch of the carbon market and the coupling relationship between the carbon and electric power markets were analyzed,and the cost transmission mode between the carbon and electric power markets is clarified. A long-cycle interactive operation simulation mechanism for the carbon–electricity market was established, and a daily rolling estimation method for the CEC was proposed. A calculation method for the CEC per unit electric quantity of coal-fired units was developed. A simulation example was constructed to estimate the CEC and other parameters of coal-fired units,further analyze the composition and factors influencing the CEC, and investigate the quotation method of carbon emission rights.
1 Long-cycle interactive operation simulation of carbon–electricity market
1.1 Issues raised by carbon trading and compliance
The basic products of the carbon market include Chinese emission allowances (CEA) and certified emission reductions (CCER). CEA typically refers to the carbon emission rights certificates allocated by the government under total emissions control. CCER are the emission reductions registered in the national voluntary emission reduction trading register by state authorities in accordance with “Interim Measures for the Administration of Voluntary Emission Reduction Trading of Greenhouse Gases”.According to the “Administrative Measures for Carbon Emissions Trading (Trial Implementation)” issued by the Ministry of Ecology and Environment, key emissionintensive units can use CCERs to offset their annual CEA settlements, with a maximum offset ratio of 5% [4]. Thus,this study focuses on CEA trading, which has a large scale and influence, to reflect the impact of the carbon market.
In this study, the stage from CEA acquisition by a market entity to completion of the CEA settlement is defined as the compliance period; the stage in which carbon emissions occur is the corresponding emission period. The CEA life cycle consists of three processes: allocation, trading, and settlement. (1) At the beginning of the compliance period,the Ecological Environment Department assigns CEA to thermal power enterprises and other emitting enterprises in the primary carbon market, in the form of free allocation or auction. Currently, the initial CEA is usually allocated freely. (2) Thermal power enterprises can conduct CEA trading in the secondary carbon market by bidding during emission and compliance periods. (3) Before the end of the compliance period, thermal power enterprises are required to pay CEA no less than their actual carbon emissions during the emission period to the Ecological Environment Department. According to the current settlement rules in China, if a thermal power enterprise fails to settle the CEA,it must pay a fine according to the amount of shortfall, and deduct the free CEA of the amount of shortfall in the next compliance period. If the thermal power enterprise pays the full payment, the remaining CEA can be transferred to the next compliance period. The compliance period is typically one year after the corresponding emission period. In the Chinese national carbon emissions market, the compliance period begins after conclusion of the emission period, and CEA allocation is performed [35].
The amount of carbon emissions, initial CEA, and the CEA trading demand of a thermal power enterprise depend on the power output and electric quantity after participation in the electric power market, and are affected by the trading results of the electric power market. Similarly, the competitiveness of coal-fired units in the electric power market is subject to the impacts of CEA trading and settlements on the CEC of coal-fired units. Considering the dominant position of the coal-fired unit capacity in the electric power market, the trading results of the carbon market have a great impact on the operation of the entire electric power market.
1.2 Cost transmission between carbon and electricity markets
In the electricity market, the forward contract market mainly considers recovery of the fixed cost of units,whereas the spot market focuses more on recovery of the variable cost of units. CEC, as a variable cost component of coal-fired units, significantly affects the spot electric power market. Coal-fired units typically participate in competitive quoting in the spot electric power market based on their marginal costs [36]. Once carbon emission compliance is considered, the CEC of coal-fired units is incorporated into the cost of electricity generation and is ultimately reflected in their products. Thus, in the electric power market, the marginal cost of coal-fired units adds the CEC based on the original fuel cost. In contrast to pre-purchased fuel at fixed prices, the carbon emission process of thermal power enterprises occurs simultaneously with their production processes. Thus, the CEC arises from CEA trading and settlements. The CEA trading price generated by a thermal power enterprise in the current emission period and corresponding compliance period and the CEA settlement fee upon conclusion of the compliance period influence the CEC per unit electric quantity for the thermal power enterprise in the current emission period. The CEC per unit electric quantity of coal-fired units is defined as
where Cc is the CEC per unit electric quantity; Cct is the carbon trading cost (CTC) per unit electric quantity,representing the expenses incurred by thermal power enterprises when purchasing CEA in the current emission period and future compliance period. A negative value indicates the income generated by selling CEA. And Ccp is the carbon penalty cost (CPC) per unit electric quantity introduced when thermal power enterprises fail to complete the settlement during the compliance period.
CEA payment must be made before the end of the compliance period; thus, CEA held by thermal power enterprises do not have to cover carbon emissions in real time. The frequency and quantity of carbon market trading are relatively random. Thermal power enterprises can avoid trading when the CEA price is excessively low or high due to abundance or scarcity of CEA in the carbon market and rationally choose the appropriate time for trading. Thus, Cct is not closely related to real-time CEA prices in the market.Thermal power companies should not refer to the real-time trading results of other companies in the carbon market to determine the opportunity cost using Cct when quoting electrical energy. The trading price of CEA in the past or future may affect Cct in the current emission period; thus,it is not appropriate to rely solely on the price in a certain trade to determine Cct.
The exemption mechanism only applies to gas units and certain emission units with excessive CEA insufficiency;the flexible mechanism allows some emission units with operational difficulties to advance future CEA [37]. In the Chinese carbon market, both are transitional care schemes for key emission units responsible for major livelihood protection tasks. In addition, carryover of surplus CEA across compliance periods and deduction of free CEA in the next compliance period due to insufficient CEA settlement in the current period have minimal impact. These aspects involve long-term planning of emission units for their own production and operation. Thus, this study does not consider CEC transmission between compliance periods, but only considers the CEC of conventional carbon market players in an independent and complete compliance period.
Even in an independent and complete performance period, thermal power enterprises cannot accurately predict their future electric quantity cleared in the electric power market, trading quantity in the carbon market, and actual carbon emissions in advance. Consequently, they cannot determine the quantity of CEA that cannot be paid to complete the settlement, and may incur fines at the end of the compliance period. As a result, when quoting the electric power market, thermal power enterprises cannot determine the future CPC and Ccp, which are determined by allocating the CPC to the total electric quantity.
In summary, thermal power enterprises must estimate Cc to guide their quotations in the electric power market. The Cc estimation method established in this study is described as follows.
(1) During the power generation process, the CEC of thermal power enterprises dynamically changes based on the CEA trading and settlement that occur in the current emission period and future compliance period, negatively impacting power generation. Thus, it is necessary to comprehensively consider the fluctuation in CEA price,CEA demand, and completion of CEA trading throughout the emission and compliance periods to determine the CEC.The CEC guides the quotation of coal-fired units in the spot electric power market while accumulating long-term electric power market clearing results to provide a reference for the carbon trading strategies of thermal power enterprises.
(2) Accurate calculation of CEC for the emission period is only possible at the end of the compliance period after completing all CEA trading and settlements related to carbon emissions. However, relying solely on the CEC calculation at the end of the compliance period cannot guide production and operation of power generation enterprises during the emission period. To determine the CEC earlier, this study proposes a daily rolling estimation method based on continuously updated carbon and electric power market information. Combining actual data from historical operating days and simulation results for future operating days, the CEC per unit electric quantity for power generation enterprises is updated daily to provide a reference for the spot electric power market. For example, on day d of month m, based on historical operation data from January 1 to day d-1 of month m and simulation results for interactive operation of the carbon–electricity market from day d of month m to December 31, the CEC per unit electric quantity was obtained and applied to the period from day d of month m to December 31. Using this method, daily estimations can maximize the recovery ratio of CTC and CPC in the electric power market.
(3) The spot electric power market transactions of thermal power enterprises are a short-cycle clearing process.However, CEA allocation, trading, and settlement operate on a long cycle. To consider mutual coupling of the carbon and electric power markets and estimate future CEA trading and settlement, the electricity and carbon markets at their respective steps and cost transmission through information interaction must be simulated.
(4) This study uses the mechanism set up by the Chinese national carbon market as a reference to analyze the impact of power generation and carbon trading behaviors of market players on their respective CEC.
1.3 Long-cycle interactive operation simulation mechanism
To maintain generality, this study assumes that the emission and compliance periods span one year and completely coincide. A long-cycle interactive operation simulation mechanism for the carbon–electricity market was established, as depicted in Fig. 1. This mechanism includes a simulation of trading in the spot electric power market using daily rolling clearing, a simulation of trading in the carbon market using monthly rolling transactions, and the monthly interaction of trading information between these two markets.
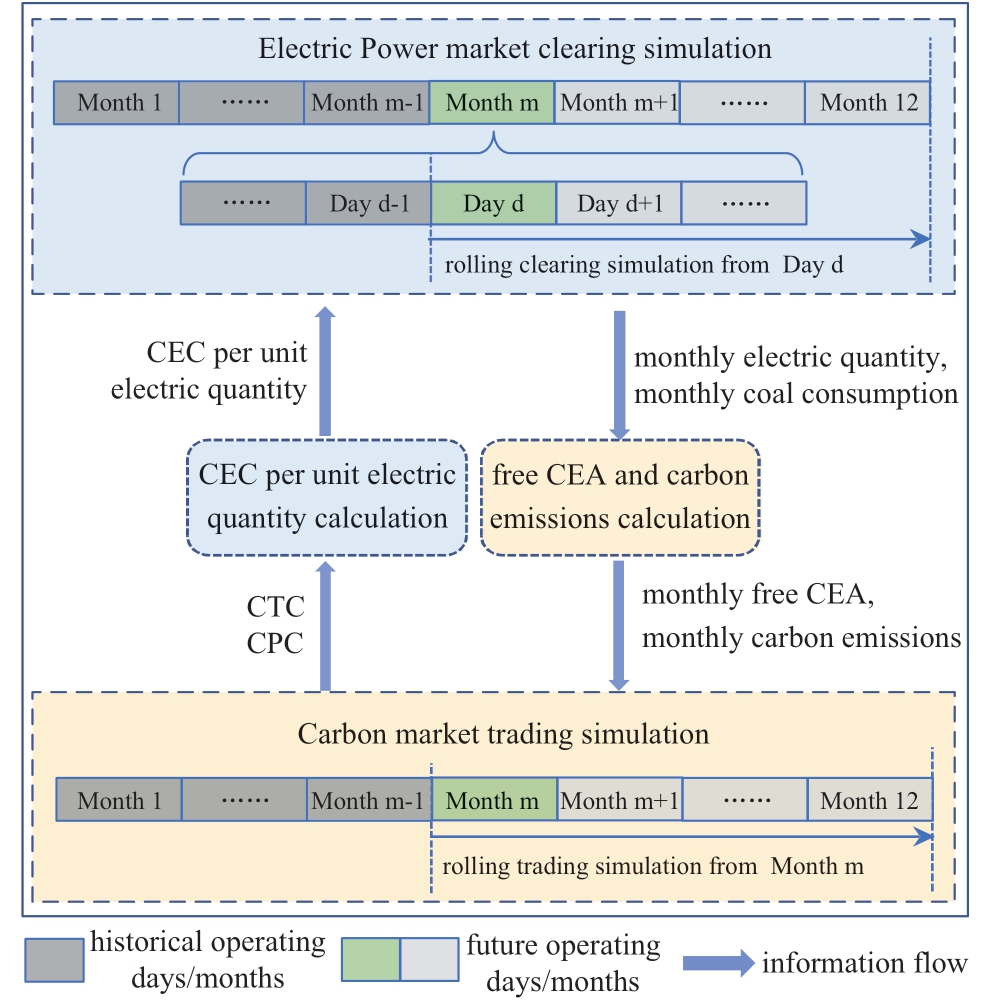
Fig. 1 Interaction between market simulations
Simulation of the electric power and carbon markets was conducted in a continuous and sequential manner by incorporating actual information from historical operating days including electric quantity, coal consumption, and CEA trading quantity, as well as forecast information for future operating days including renewable power generation plant output and load. The simulation obtained data on the electric quantity, coal consumption, CEA trading quantity,and price of coal-fired units in future operating days of the emission period. Moreover, it estimated the average CEC per unit of electric quantity for the remaining compliance periods.
The reasons for using monthly rolling simulation in carbon market trading are presented as follows. First, if the CEA held in a certain period is less than (or more than)the carbon emissions, thermal power enterprises are not required to reduce (or increase) their bidding willingness in the electric power market during that period. Instead, they can choose to buy insufficient CEA or sell excess CEA at any time until the compliance period ends. This implies that CEA trading willingness and quantity can be adjusted within each time interval during the compliance period,making short-term CEA trading highly flexible, random,and difficult to accurately estimate. Second, thermal power enterprises with insufficient CEA are motivated to purchase CEA promptly to avoid the risk of high penalties resulting from incomplete settlements. Similarly, thermal power enterprises with surplus CEA have no economic value for unsold CEA. Thus, they are willing to sell excess CEA as quickly as possible to obtain working capital. Consequently,in the long term, the trading willingness of purchasers and sellers in the carbon market increases over time under the influence of market mechanisms and is eventually released.
Considering the flexibility of short-term market conditions and the certainty of long-term willingness to trade, this study uses a monthly rolling simulation to simulate transactions, as indicated in Fig. 2. This method completes one-month trading simulations using accurate information from the historical period and forecast information for the future. Once simulation for the current month is completed, subsequent months are simulated.
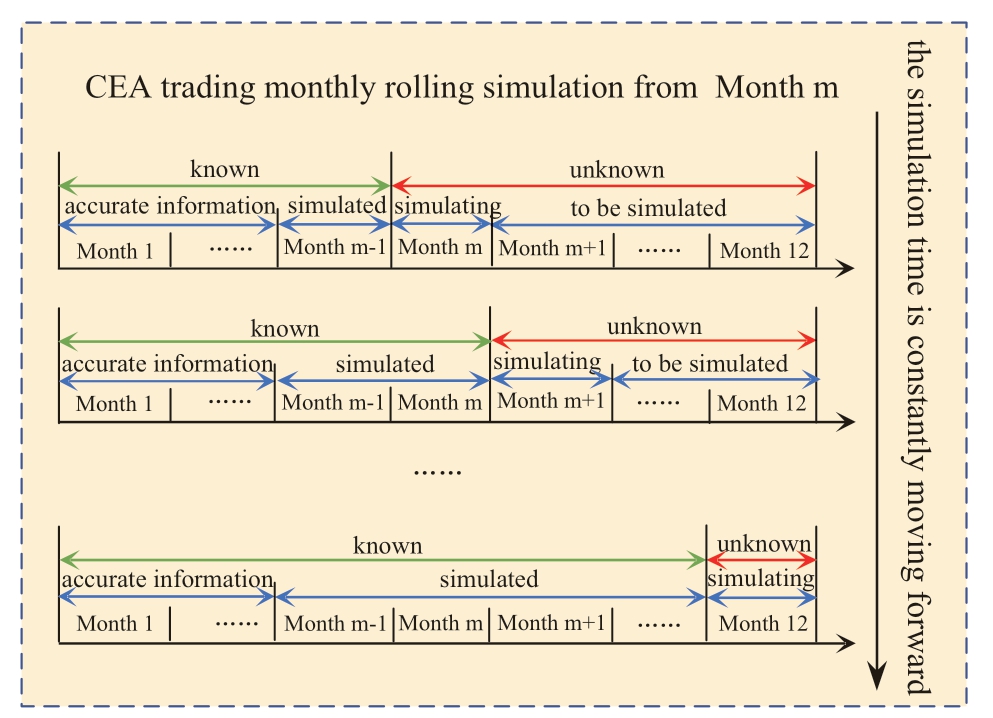
Fig. 2 Rolling simulation for carbon market
We consider day d of month m as an example to illustrate the long-cycle interactive operation simulation process of the carbon–electricity market, as shown in Fig.2. It uses actual operating information such as electric quantity, coal consumption, and CEA trading quantity from historical operating days (January 1 to day d-1 of month m)and forecast information for the output of renewable power plants and load on future operating days (day d of month m to December 31). The simulation of the carbon–electricity market was conducted as follows.
Step 1: Initialize the simulation using the CEC per unit electric quantity of the unit in adjacent years as the initial value.
Step 2: Perform a rolling simulation of the electric power market based on the CEC per unit electric quantity,accurate information from January 1 to day d-1 of month m,and the predicted output of renewable power plants and load from day d of month m to December 31. The simulation yielded the estimated electric quantity and coal consumption from day d of month m to December 31.
Step 3: Use known information from January 1 to day d-1 of month m and the estimated electric quantity and coal consumption from day d of month m to December 31 to conduct a rolling simulation of the carbon market. This simulation estimates the CEA trading conditions for the remaining compliance period and the settlement conditions at the end of the compliance period.
Step 4: Calculate the average CEC per unit electric quantity of each thermal power enterprise for the remaining compliance period based on the daily simulation of the electric power market and monthly simulation of the carbon market.
Step 5: Check whether the change in the CEC per unit electric quantity for all thermal power enterprises obtained from the last two simulations is below a preset threshold.If the convergence condition is satisfied, the process is terminated. Otherwise, update the CEC per unit electric quantity to the result of the last iteration, and return to Step 2.
The simulation process of the long-term interactive operation of the carbon–electricity market is shown in Fig. 3
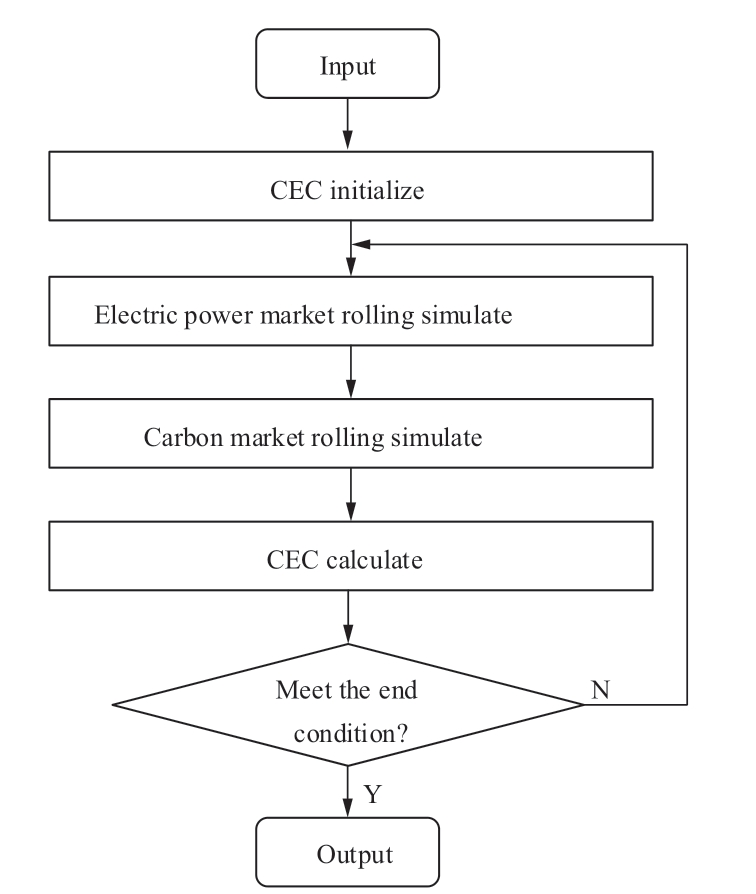
Fig. 3 Detailed process for market-simulation
2 Electric power market and carbon market model
2.1 Electric power market daily clearing model
To minimize the daily total power purchase cost, an optimization model for electric power market clearing is established, as shown in Equation (2).

where NTH is the number of coal-fired units; NN is the number of renewable power plants; NT is the number of hours each day; ND is the number of days each year; Ui,t,d is the start-up and shut-down state of the coal-fired unit i at hour t on day d, which is 0 or 1 (1 means start, 0 means stop);  is the electric quantity of the coal-fired unit i at hour t on day;
  is the actual electric quantity of the renewable power plant j at hour t on day d;
 is the estimated maximum electric quantity of the renewable power plant j at hour t on day d;
  is the generation cost per unit electric quantity of the coal-fired unit i at hour t on day d; CNj is the abandonment cost per unit abandoned electric quantity for the renewable power plant j; µiU is the start-up and shut-down state of the coal-fired unit i.
The coal-fired unit i generation cost per unit electric quantity at hour t on day d is determined according to the fuel cost and CEC:
where ωi is the quotation coefficient of the coal-fired unit i;µF is the coal price;  is the coal consumption of the coal-fired unit i at hour t on day d; CiC is the CEC per unit electric quantity of the coal-fired unit i, derived from the carbon-market rolling simulation results.
According to the coal-consumption characteristics of the coal-fired units, the following can be observed:
where aiTH, biTH, ciTH are consumption characteristic coefficients of the coal-fired unit i, related to the unit type,boiler type, and coal quality;  is the power output of the coal-fired unit i at hour t on day d;
![]() because the electric power market clearing step size was set as 1 h.
because the electric power market clearing step size was set as 1 h.
The constraints for coal-fired units include limits for output, ramp-up, ramp-down, start-up, and shut-down, along with minimum continuous start-up and shut-down times.

where  is the installed capacity of the coal-fired unit i;
 is the minimum technical power output of the coal-fired unit i; ∆PiUP is the ramp-up limit of the coal-fired unit i;∆PiDN is the ramp-down limit of the coal-fired unit i; ∆PiST is the start-up time of the coal-fired unit i; ∆PiSH is the shutdown time of the coal-fired unit i; n is the continuous timing sequence number after the start of start-up or shut-down;TiON is the minimum continuous start-up time of the coalfired unit i; TiOFF is the minimum continuous shut-down time of the coal-fired unit i.
Additionally, the constraints in the electric power market encompass power balance, renewable electric quantity, and branch transmission power constraints.

where  is the total load power at hour t on day d;
  is the power output of the renewable power plant j at hour t on day d;
![]() because the electric power market clearing step size was set as 1 h; Pab , t ,d is the branch power flow at hour t on day d from bus a to bus b; θa ,t ,d and θb ,t ,d are the voltage phase angles of bus a and bus b at hour t on day d, respectively; xab is the reactance of branch ab;
because the electric power market clearing step size was set as 1 h; Pab , t ,d is the branch power flow at hour t on day d from bus a to bus b; θa ,t ,d and θb ,t ,d are the voltage phase angles of bus a and bus b at hour t on day d, respectively; xab is the reactance of branch ab;  is the transmission power limit of branch ab.
2.2 Carbon-market monthly trading model
The CEA demands of thermal power enterprises are influenced by the operational status of all coal-fired units.Coal-fired units with low coal consumption exhibit lower costs per unit of electricity and lower carbon emissions.Consequently, they achieve a higher electric quantity per unit of carbon emissions and generate more net income per unit of electric quantity. Thus, these units tend to purchase CEA at higher prices in the carbon market.
Additionally, owing to their lower cost per unit of electric quantity, such units have the advantage of being clearer in the electric power market. Furthermore, these units must quote higher prices to purchase more CEA in the carbon market due to their higher electric quantity. To better simulate an actual carbon trading scenario, the monthly trading simulation of the carbon market prioritizes CEA purchasing of coal-fired units with low generation costs,aiming to minimize the number of CEA to be fined.
Accordingly, this study establishes a monthly CEA trading model, presented in Equation (7), with the optimization objective of minimizing the weighted sum of CEA to be fined for all coal-fired units each month:

where ϕi is the weight coefficient to be fined by the coalfired unit i (the lower CEA lack per unit electric quantity of coal-fired unit i, the greater is the coefficient ϕi);  is the quantity of CEA lack of coal-fired unit i in month m (positive value indicates lack of CEA, negative value indicates excess of CEA);
  is the quantity of CEA trading of the coalfired unit i in month m (positive value indicates purchasing CEA, negative value indicates selling CEA); NM is the number of months each year.
In China, free CEA are currently allocated to coalfired units based on a benchmark method. The quantity of free CEA that coal-fired units can receive is determined by multiplying their electric quantity by their allocated benchmark for free CEA. The monthly quantities of carbon emissions, free CEA, and CEA lack of the coal-fired unit i are calculated using Equations (8) – (10), respectively.
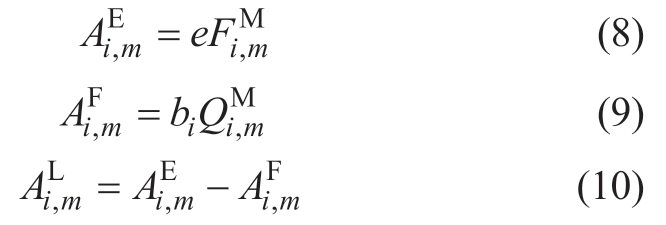
where e is the carbon emission per unit coal consumption;bi is the free CAE allocation benchmark of the unit type of coal-fired unit i;  is the coal consumption of coal-fired unit i in month m, derived from the rolling simulation results of the electric power market;
  is the electric quantity of the coal-fired unit i in month m, also derived from the rolling simulation results of the electric power market.
The constraints for carbon trading of coal-fired units are presented as follows.
(1) CEA trading quantity constraints in carbon market
In the carbon market, CEA are traded among coal-fired units monthly. The quantity of CEA purchased is equal to the quantity of CEA sold within the month m:

The quantity of CEA held by any coal-fired unit is not less than 0. From January to month m', if the quantity of cumulative CEA purchased is negative (indicating cumulative CEA sold), the absolute value of the quantity of cumulative CEA purchased should not exceed the quantity of cumulative free CEA:

(2) CEA trading willingness constraints for market entities
To prevent waste, coal-fired unit i' with excess CEA has no intention of purchasing CEA in month m. To avoid the risk of penalty, the quantity of cumulative CEA sold is less than or equal to the quantity of excess CEA from January to month m':

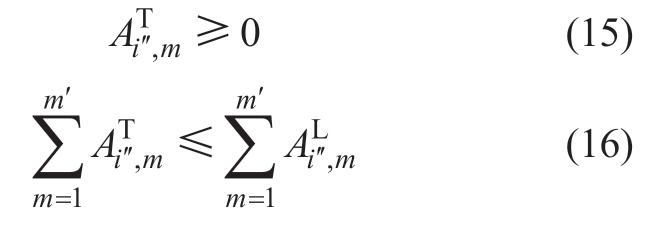
To mitigate future penalty, coal-fired unit i'' lacking CEA has no intention of selling CEA in month m. To avoid wasting funds, the cumulative quantity of CEA purchased is less than or equal to the quantity of the lack of CEA from January to month m':
Coal-fired unit i''' with balanced CEA has no intention to trade CEA in month m:
2.3 CEC per unit electric quantity model
In the carbon market, the flow of CEA adheres to the principles of supply–demand theory [38-39]. Thus, supply–demand theory is considered here. The “supply–demand relationship determines the price in a competitive market” to determine the prices of CEA trading [40-41]. The total quantity of CEA in the carbon market is determined by the free CEA allocated to all coal-fired units. The total CEA demand in the carbon market depends on the quantity of CEA to be paid to offset the carbon emissions of all coalfired units.
The gap between the total quantity of free CEA and the total quantity of carbon emissions determines whether the total CEA in the market is scarce or abundant. Trading behavior between units cannot change the scarcity or abundance of the total CEA in the market. Thus, the carbonmarket trading simulation can use the total quantity change in CEA lack for all units to represent the changing CEA supply and demand. The CEA price increases with an increase in total CEA and decreases with a decrease in total CEA.
In this study, the monthly price of CEA in the carbon market is determined by the ratio of the total quantity of CEA lack to the total quantity of carbon emissions of all units from January to month m'. The expected price of CEA in month m' is expressed as a linear function, as shown in Equation (18).

where α and β are CEA price coefficients.
Based on the results obtained from the carbon–electricity market simulation, the average CEC per unit electric quantity of coal-fired unit i for the remaining compliance period can be calculated using Equation (19).
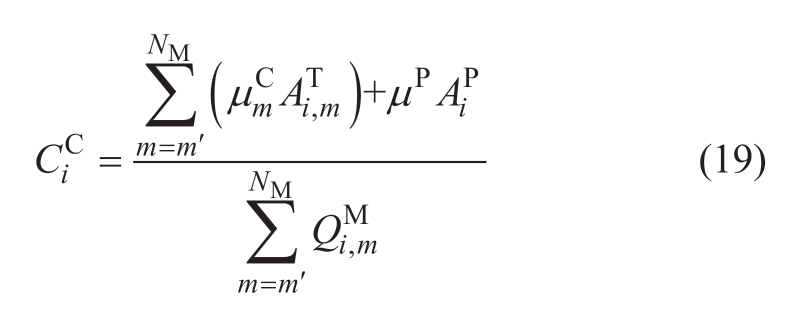
where µP is the penalty coefficient of the CEA to be fined,and AiP is the quantity of CEA to be fined by coal-fired unit i at the end of the compliance period, derived from the rolling simulation results of the carbon market.
3 Case studies
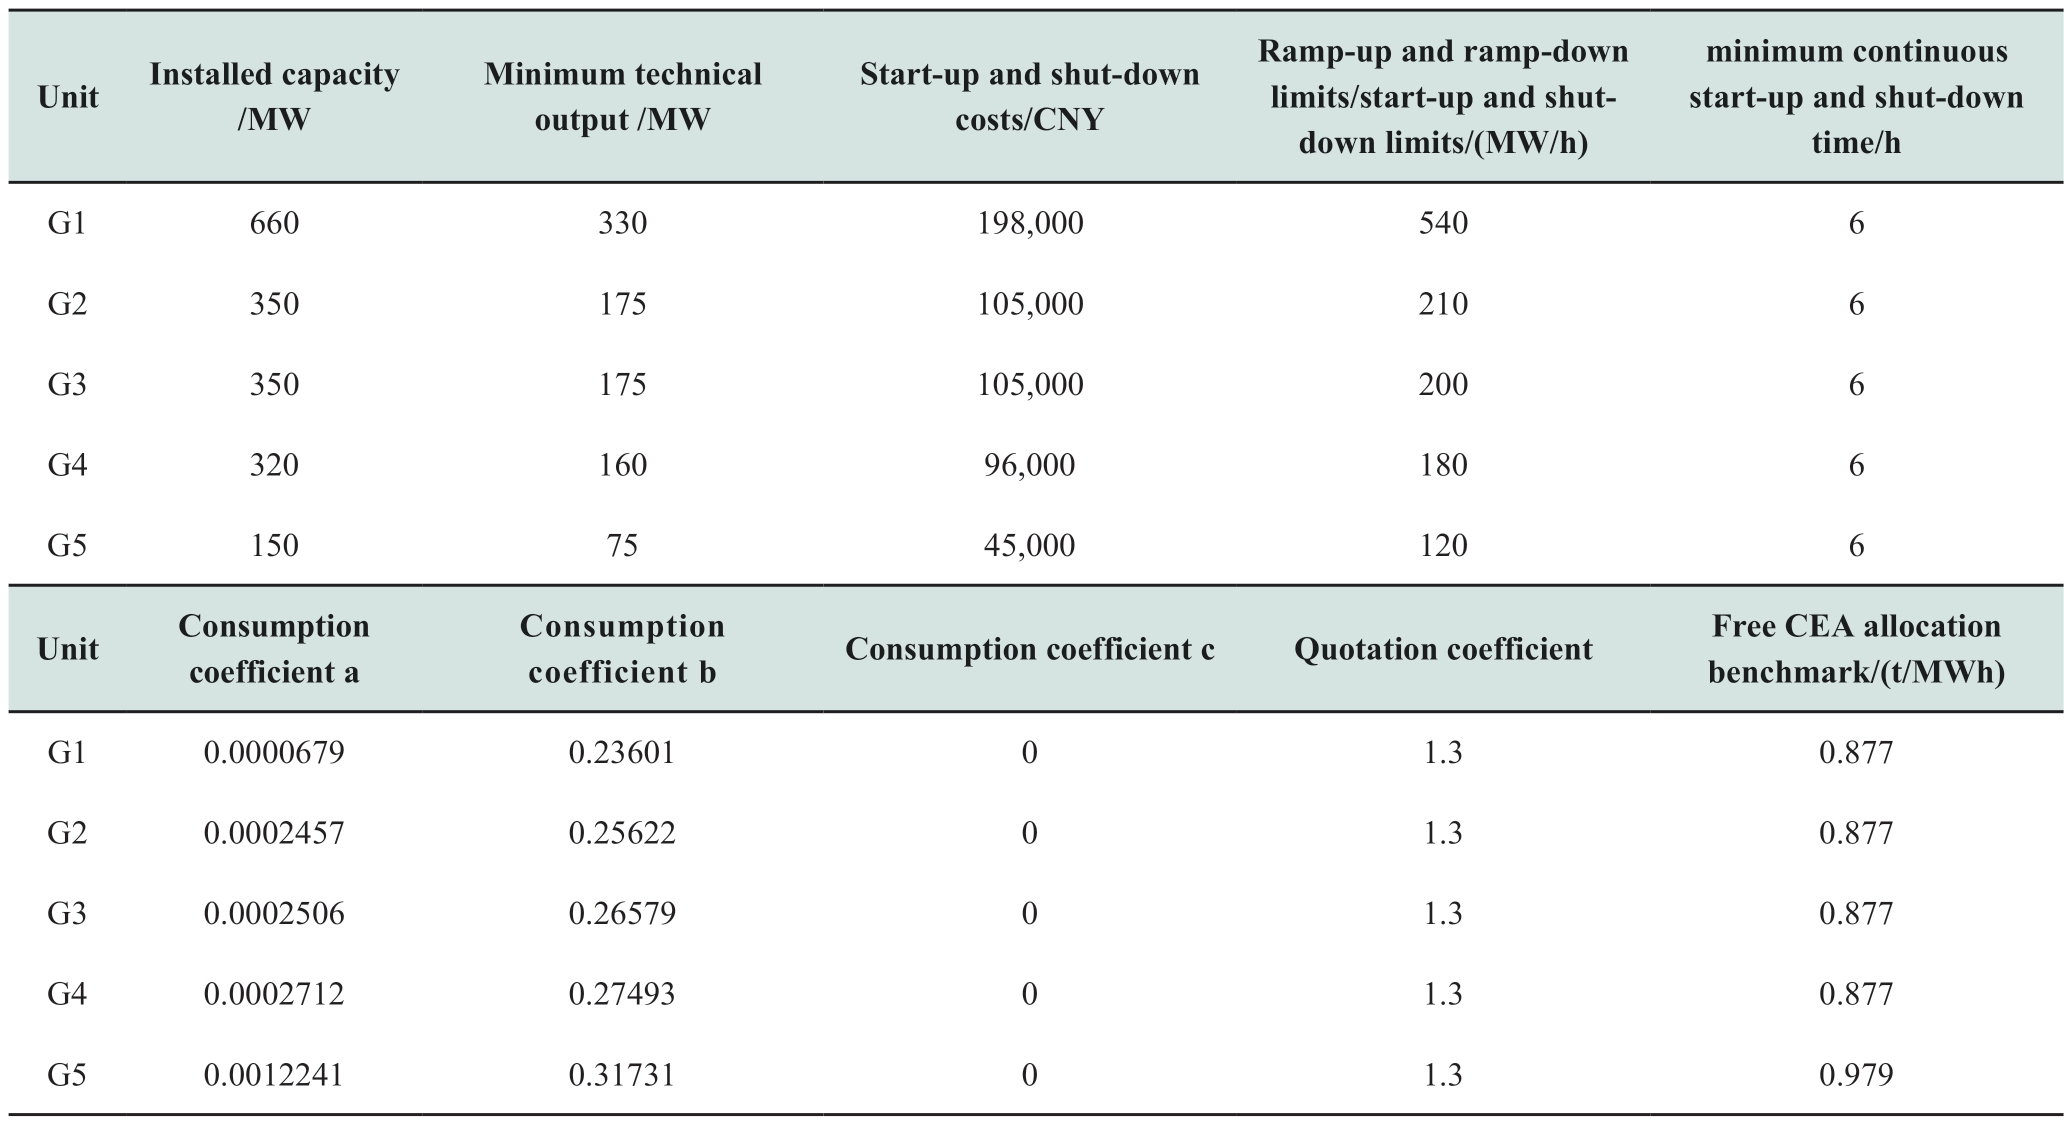
An interactive simulation test system for the carbon–electricity market was established to verify the effectiveness of the proposed method. The system comprised five coalfired units, one wind power plant, and one photovoltaic power station participating in the spot electric power market. The coal-fired units participated simultaneously in the carbon market. Table A1 in the Appendix presents the parameters for the five coal-fired units. The coal price was set at 1000 CNY/t; the penalty coefficient of the CEA to be fined was 100 CNY/tCO2; the carbon emissions per unit coal consumption were 3 tCO2/t; the abandonment cost per unit abandoned electric quantity of wind power and photovoltaic power was 55 CNY/MWh and 50 CNY/MWh, respectively; α and β were set as 55 CNY/tCO2 and 1500 CNY/tCO2, respectively. Based on historical data from a certain region’s power grid, we obtained the wind and photovoltaic power and the total load for typical days in each month, presented in Appendix Fig. B1–B3. In this simulation, the electricity price was considered as the unified clearing price, disregarding the grid structure and congestion. Both carbon emissions and compliance periods aligned with the natural calendar year. The programming platform was MATLAB R2021a, and the model resolution software was CPLEX.
3.1 CEC based on interactive operation simulation of carbon–electricity market
January 1 was selected as the start day; market simulation was conducted until December 31. To compare the advantages and impacts of different CEC determination methods, the following scenarios were considered in this study:Scenario 1: Market simulation based on the simulation method described herein and the example data described in the preceding section.Scenario 2: Based on Scenario 1 and ignoring the transaction process of the coal-fired units, their carbon emissions cost per ton was simplified to a fixed 50 CNY/tCO2 [20-21], which was added to the quotation in the electric power market simulation.
Scenario 3: Based on Scenario 1 and ignoring the role of the compliance period, the coal-fired unit carbon emissions cost per ton per hour was set to be equivalent to the CEA price in the carbon market in the same hour. The hourly CEA price was determined by the scarcity of CEA, reflected in the ratio of CEA deficiency to carbon emissions in the same hour.
The CEA trading quantity and price obtained in Scenario 1 are shown in Fig. 4.

Fig. 4 Simulation results for CEA trading quantities and CEA price in Scenario 1
(1) Change in monthly CEA trading quantities over time. The quantities in January, August, and December were large; August had the largest quantity. The quantities in the remaining months were small. The highest load in August and the substantial decrease in photovoltaic electric quantity in January and December led to a significant increase in the electric quantity of the coal-fired units during these months.These results indicate that the electric quantity of G2–G5 with high carbon emission levels increased sharply, leading to a large lack of CEA, which greatly increased CEA purchasing demand and CEA trading quantities. The low load in February and March led to a small electric quantity in G2–G5 with high carbon emission levels. Although G1 wanted to sell a large quantity of CEA in the carbon market, the CEA trading quantity was small due to the low CEA purchase demand for other units. The load from April–July and from September–November was higher than that from February–March. G1’s electric quantity with a low carbon emission level and low generation cost was preferentially cleared; thus, G1’s electric quantity increased significantly compared with that from February–March; the electric quantity of the other units increased slightly. The CEA selling demand of G1 in the carbon market increased significantly, but the CEA purchasing demand of the other units only increased slightly; thus, the CEA trading quantities were still small.
(2) The changing trend of CEA prices over time was similar to that of CEA trading quantities. The CEA price was positively related to the scarcity of CEA, and the scarcity or abundance of CEA in the carbon market was affected by the total electric quantity and its distribution in different units.For example, the CEA lack per unit electric quantity of G4 was larger than that of G1; if the proportion of G4's electric quantity to the total electric quantity increased, the CEA in the carbon market was scarcer. In contrast, if the proportion of G1’s electric quantity increased, the CEA in the carbon market was more abundant. In the electric power market,G1 had the lowest generation cost and was the easiest to clear. G2–G5 were increasingly difficult to clear. When the load decreased, the electric quantity of G2–G5 decreased significantly; the electric quantity of G1 decreased slightly.Thus, the proportion of G1’s electric quantity increased;CEA became more abundant, and the CEA price decreased.In contrast, when the load increased, the electric quantity of G2–G5 increased significantly, but the electric quantity of G1 only increased slightly because it was close to the maximum. Thus, the proportion of G1’s electric quantity decreased; the CEA became scarcer, and the CEA price decreased.
In Scenario 1, the annual average CEC per unit electric quantity estimated on January 1 is shown in Table 1. The annual average CEC per unit electric quantity for the remaining compliance period was continuously updated by daily rolling estimation. If the actual operation conditions of the market were close to the historical data, the annual average CEC per unit electric quantity estimated each day did not fluctuate significantly. The CEC in Scenarios 2 and 3 were not based on market simulation of the full compliance period, and the CEC per unit electric quantity was unrelated to the carbon market mechanism; thus, the monthly CEC of any month had no correlation with any other month. The average CEC per unit electric quantity per month is shown in Fig. 5.
Table 1 CEC per unit electric quantity in Scenario 1

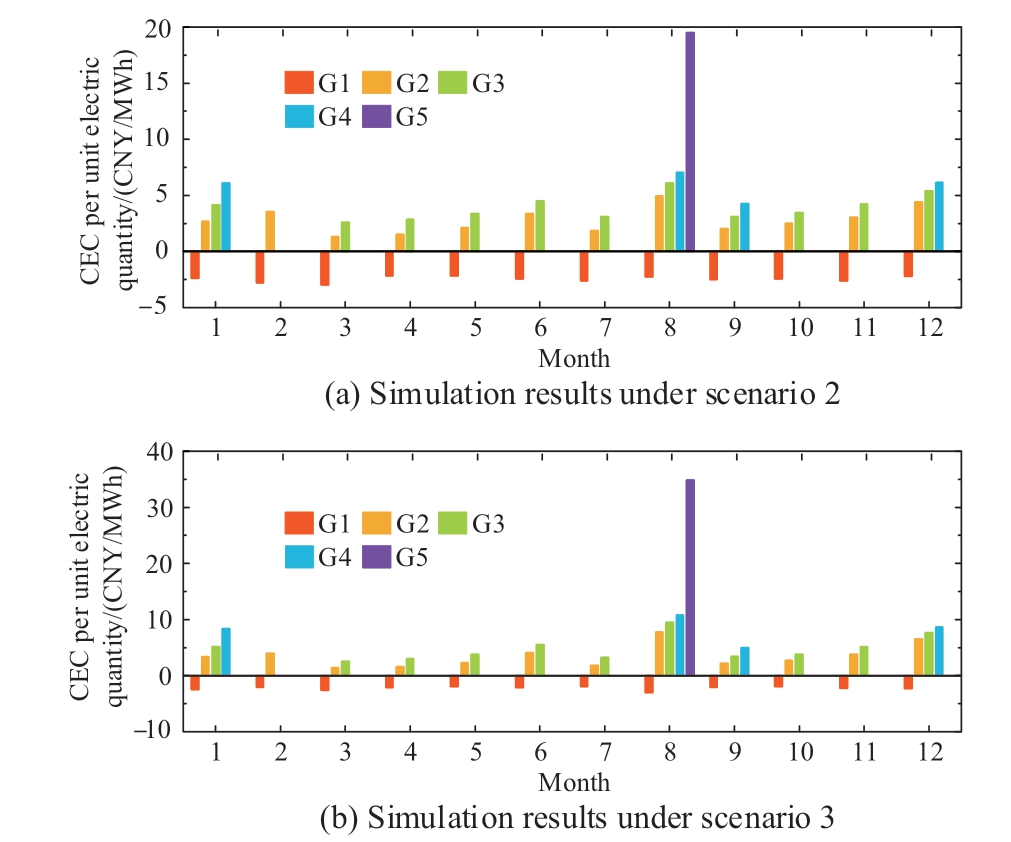
Fig. 5 CEC per unit electric quantity under scenarios 2 and 3
(1) CEC per unit electric quantity for G2–G5 is positive, and CEC for G1 is negative because G1 sold CEA in the carbon market and increased its income through CEA trading; thus, its CEC per unit of electric quantity was negative. In contrast, G2–G5 purchased CEA in the carbon market; thus, the CEC per unit electric quantity was positive when CTC and CPC were allocated to the electric quantity.
(2) From G2–G5, the lack of CEA per unit electric quantity gradually increased, and the quantity of CEA to be purchased per unit electric quantity gradually increased;thus, the CEC per unit electric quantity also gradually increased.
(3) The cost of one ton of carbon emissions in Scenario 2 was fixed, whereas the cost of one ton of carbon emissions in Scenario 3 was subject to random fluctuations in the CEA price each hour in the carbon market. The real-time electric power market clearing results determined the real-time carbon-market supply and demand; the real-time carbonmarket supply and demand determined the real-time CEA price, and the real-time CEA price determined the realtime CEC. Thus, the CEC in the two scenarios depended only on the daily clearing conditions of the electric power market, and there was no close correlation between the monthly CEC for any two months; the average monthly CEC per unit electric quantity fluctuated significantly.Thus, these two methods of determining CEC cannot reflect the role of establishing a carbon market and compliance period, and greatly affect the stability of the electric power market. They cannot provide guidance for carbon market quotations; guidance for electric power market quotations is also unreasonable.
3.2 Analysis of difference between daily rolling CEC estimate and static CEC estimate
To compare and analyze the utility of the daily rolling CEC estimate proposed in this study and the static CEC estimate for the entire year on a certain day (such as January 1), Scenario 4 was constructed. Based on Scenario 1, the actual output of wind power and photovoltaic power from February to July decreased by 20% and 30%, respectively,compared with the predicted value; the load demand increased by 20% from February to July. Both daily rolling and static estimation methods estimated the CEC on January 1. However, with changes in the actual operating conditions from February to July, the daily rolling estimation could dynamically update the average CEC per unit electric quantity in the remainder of the compliance period with the daily production and carbon emissions per day of the power-generation enterprises, whereas the static estimation could only follow the annual average CEC per unit electric quantity estimated on January 1. The CEC recovery ratios in the electric power market for G2–G5 in Scenario 4 are shown in Fig. 6.
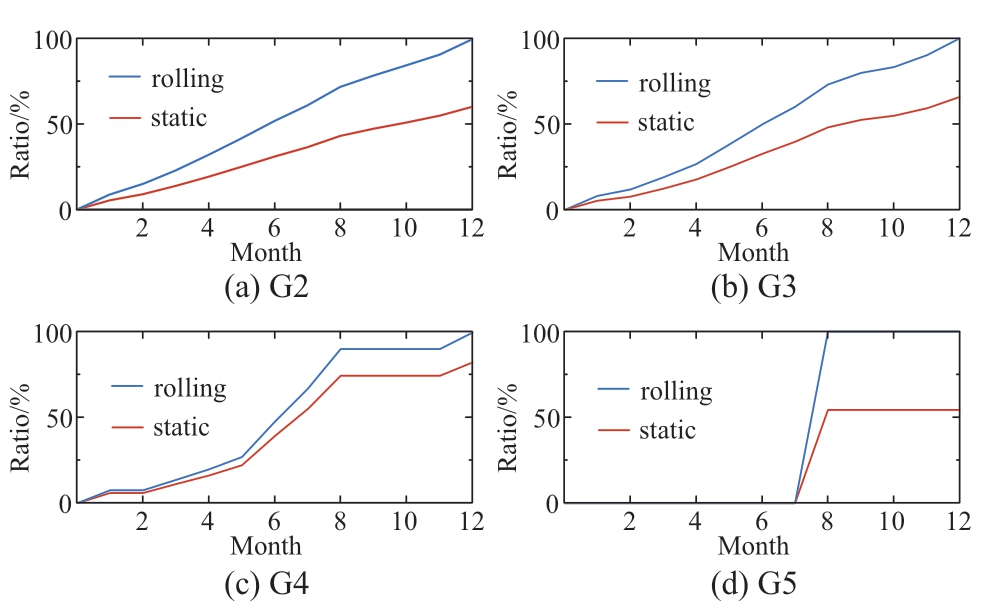
Fig. 6 CEC recovery ratio from daily rolling estimation and static estimation methods
As shown in Fig. 6, the proposed daily rolling CEC estimation method can be used to continuously update the average CEC per unit electric quantity in the remainder of the compliance period for coal-fired units in response to changes in actual operating co nditions to constantly adjust quotation in the electric power market such that units can almost fully recover the CEC in the current year. The static estimation method cannot manage changes in the actual operating conditions; thus, units use the initial estimated annual average CEC per unit electric quantity to quote in the electric power market, causing a large deviation and failing to recover the CEC.
3.3 Impact of future development trends on operating results in carbon–electricity market
As the deadline for “carbon peak, carbon neutral” approaches, future free CEA allocation will gradually tighten; the penalty for uncompleted settlement will gradually increase, and the grid-connected scale of wind and photovoltaic power will continue to expand. In view of these development trends, Scenarios 5–7 were considered in this section. An annual simulation was conducted on January 1 for each scenario to observe the impact of different trends on operation of the carbon and electric- power markets.
Scenario 5: Based on Scenario 1, with benchmarks of free CEA allocation for coal-fired units reduced by 10%.
Scenario 6: Based on Scenario 1, with the penalty coefficient of the CEA to be fined changed to five times the CEA price at the end of the compliance period.
Scenario 7: Based on Scenario 1, with the installed capacity of wind and photovoltaic electric quantities increased by 50%.
In Scenario 5, because the free CEA values obtained for the coal-fired units were all lower than the actual carbon emissions, no units sold CEA. The simulation results for CEA trading quantity and CEA price in Scenarios 6 and 7 are shown in Fig. 7. The simulation results for annual average CEC per unit electric quantity in Scenarios 5–7 are shown in Table 2.
Comparing Fig. 7 and Fig. 4, we observe that

Fig. 7 Simulation results of CEA trading quantities and CEA price under scenarios 6 and 7
(1) CEA trading quantity and price in Scenario 6 were similar to those in Scenario 1. This is because the increase in CPC in CEC further increased the advantages of coal-fired units with low carbon emission levels and low generation costs and did not affect the unit clearing sequence. Thus, the CEA lack for coal-fired units and the resulting CEA selling or purchase demand showed little change; the CEA trading quantity and price were not sensitive to changes in the penalty coefficient.
(2) Compared with Scenario 1, the CEA trading quantity and CEA price for each month in Scenario 7 were both reduced. After the installed capacity of wind and photovoltaic power was increased by 50%, the total electric quantity of wind and photovoltaic power increased, and the total electric quantity of coal-fired units decreased. G1,with the lowest generation cost, was less affected due to its clearing priority in the electric power market. The CEA lack of G2–G5, with a large electric quantity decrease, greatly decreased. The CEA purchasing demand in the carbon market decreased accordingly, leading to a decrease in CEA trading quantity. In addition, the increase in the proportion of G1’s electric quantity to the total electric quantity made the CEA in the carbon market more abundant; thus, the CEA price decreased.
Table 2 CEC per unit electric quantity under scenarios 5, 6 and 7
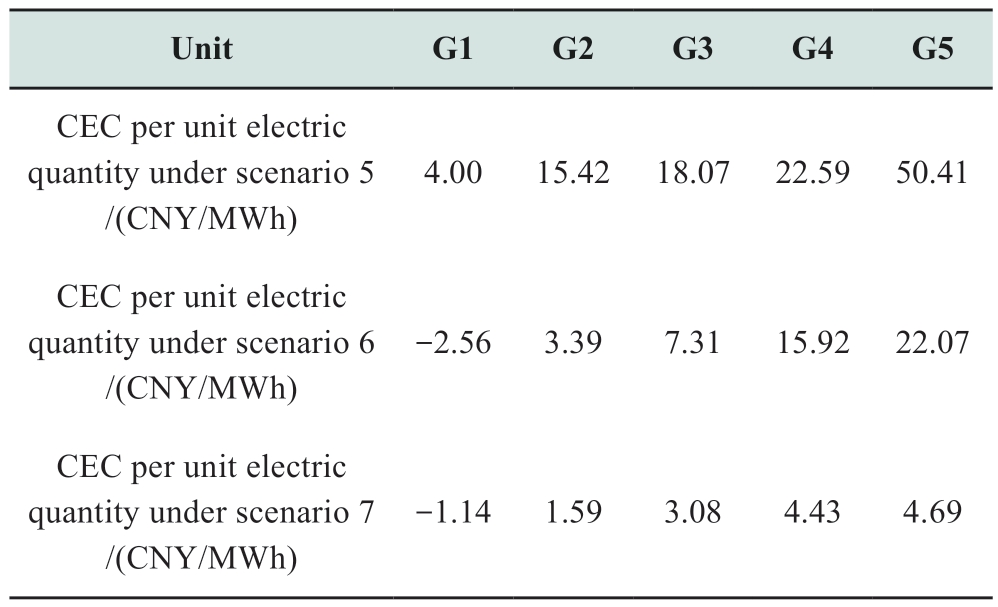
Comparing Table 2 and Table 1, we observe that
(1) Because none of the units in Scenario 5 could complete the CEA settlement and no unit sold its CEA, the CEC was equal to the CPC; thus, the CEC in Scenario 5 was much higher than that in Scenario 1.
(2) Because G3 and G4 were fined for not purchasing enough CEA, the increase in the penalty coefficient caused the CEC per unit electric quantity for G3 and G4 in Scenario 6 to be higher than those in Scenario 1.
(3) Compared with Scenario 1, the CEC per unit electric quantity for G2–G5 in Scenario 7 decreased, and the carbon emission income per unit electric quantity of G1 decreased. The increase in the installed capacity of wind and photovoltaic electric quantity caused the CEA price to fall, The CTC for G2–G5 decreased, and their CEC per unit electric quantity decreased. As the price of CEA sold by G1 decreased, its carbon emission income per unit electric quantity also decreased.
Comparisons of the annual total CTC, total CPC, annual average CTC, and CPC per unit electric quantity for G2–G5 in Scenario 1 and Scenarios 5–7 are shown in Fig. 8.

Fig. 8 Comparison of annual CEC and CEC per unit electric quantity
(1) In Scenario 1, G2 and G5 had no CPC because they purchased sufficient CEA to fill the CEA deficiency.However, G3 and G4 could not complete the settlement due to insufficient CEA purchases, resulting in CPC.
(2) Compared with Scenario 1, because the load and clearing sequence of coal-fired units in Scenario 5 did not change, the electric quantity of units did not change significantly; however, because all units could not complete the CEA settlement, the main component of CEC changed from CTC to CPC. G2–G4 could not purchase CEA,resulting in a significant increase in CPC in Scenario 5 compared with Scenario 1. Because G5 had the highest generation cost per electric quantity, its electric quantity and carbon emissions were concentrated in the month with the highest load, and its electric quantity cleared remained low.Thus, in Scenario 1, G5 purchased sufficient CEA within a few months after the load decreased. However, in Scenario 5, G5 could not purchase any CEA due to its high carbon emissions per unit electric quantity; its increase in CPC per unit electric quantity was the most obvious.
(3) The change in the penalty coefficient in Scenario 6 increased the CEC of G3 and G4. Because G2 and G5 could purchase sufficient CEA through the carbon market to fill all CEA gaps, the CEC did not change significantly compared with Scenario 1.
(4) Compared with Scenario 1, with extremely abundant CEA in the carbon market in Scenario 7, all coal-fired units could purchase sufficient CEA, and the CEA price was low; thus, the CEC greatly decreased. The low CEA price in Scenario 7 reduced the CTC of each unit; abundant CEA reduced the CPC for G3 and G4 to 0.
3.4 Analysis of generation income and CEA quotation
The annual generation income, fuel cost, net income,and CEA loss simulated on January 1 in Scenario 1 and Scenarios 5–7 are shown in Fig. 9. The net income in Fig. 9 is the difference between the generation income and the fuel cost obtained in the electric power market, not involving the CEC defined in this study.
(1) Compared with Scenario 1, Scenario 5 had a higher net income, but a larger lack of CEA. After the benchmarks of the free CEA allocation for coal-fired units decreased,the CEC per unit electric quantity increased, which led to an increase in quotation of coal-fired units and clearing price in the electric power market. Thus, the generation income of coal-fired units increased to a certain extent with the condition that power generation remained unchanged.Because only fixed fuel costs were considered, the net income of each coal-fired unit in the electric power market increased. Owing to the decrease in the benchmarks of free CEA allocation, the lack of CEA per unit electric quantity increased significantly.
(2) In the conditions set by the example in this study, the net income and CEA lack of coal-fired units in Scenario 6 showed little change compared with Scenario 1. In Scenario 6, only the CEC for G3 and G4 contained the CPC, which was affected by the penalty coefficient. However, the number of hours for which G3 or G4 became marginal units in the electric power market was very low, and the CPC accounted for a small proportion of the generation cost; thus, the penalty coefficient had little impact on the annual clearing result of the electric power market. The net income and CEA deficiency in Scenarios 1 and 6 were similar; however, something unique was observed. If the benchmarks of free CEA allocation decreased significantly,the quantity of CEA to be fined increased significantly,and the high CPC of all units had a greater impact on the clearance conditions of the electric power market through the cost-transmission mechanism.
(3) Compared with Scenario 1, Scenario 7 had a lower net income and a smaller lack of CEA. In Scenario 7,the wind and photovoltaic electric quantities increased significantly, and the total electricity demand remained unchanged; thus, the electric quantity of each coal-fired unit decreased, and the net income and CEA loss in Scenario 7 were smaller than those in Scenario 1.
To complete CEA settlement and avoid high fines,thermal power generation enterprises must purchase as many CEA as possible; thus, a portion of the net income from the electric power market must be used to purchase CEA or pay fines. As a result, power generation enterprises must estimate net income by increasing their generation at the expense of purchasing CEA or paying fines so they can better quote in the carbon market to reduce their operating costs.
The net income of generation corresponding to the quantity of coal-fired units was calculated according to the ratio of the annual net income to the quantity of CEA lack.The product of the net income per unit CEA lack and the quotation coefficient were taken as the purchasing quotation for each unit CEA; the quotation coefficient was a positive number less than 1. The purchasing quotation calculation results of CEA for G2–G5 in several scenarios are compared in Fig. 10.

Fig. 9 Comparison of income, cost and CEA lack

Fig. 10 CEA quotation
(1) The net income per unit electric quantity gradually decreased from G2 to G5, and the CEA deficiency per unit electric quantity gradually increased from G2 to G5; thus,the net income per unit CEA deficiency gradually decreased from G2 to G5. In other words, the competitive advantage in the carbon market gradually weakened, and quotations showed a decreasing trend from G2 to G5.
(2) In Scenario 5, the quotations of G2–G4 were lower than those in Scenario 1, and the quotations of G5 were higher than those in Scenario 1. After the benchmarks decreased, the quantity of CEA that G2–G4 needed to purchase increased significantly, but net income only increased slightly, and their CEA quotations decreased. In addition, the net income of G5 increased by 22%, but its CEA level increased by 24%. Thus, the quotation decreased slightly.
(3) The CEA quotations of the coal-fired units in Scenarios 6 and 1 were similar because in the conditions set by the example in this study, the penalty coefficient had little influence on the net income and CEA lack, as shown in Fig. 9.
(4) Compared to Scenario 1, all CEA quotations increased in Scenario 7. An increase in the installed capacity of wind and photovoltaic power reduced the total electric quantity and net income of coal-fired units. In this example, owing to the increase in wind and photovoltaic power installed capacity, the unit commitment each day also changed; the number of start-up units decreased; the load ratio of start-up units increased; the annual average CEC per unit electric quantity decreased, and the net income per unit CEA lack increased.
(5) CEA quotations are always lower than the penalty coefficient; thus, quotations above the red line in Fig. 9 do not actually occur. If CEA become scarcer and the penalty coefficient remains the same, CEA trading ceases.To stimulate the vitality of the carbon market, the penalty coefficient must increase. The coal-fired units in Scenario 6 were willing to quote higher prices for CEA purchasing.
4 Conclusion
With continuous development of the carbon and electricpower markets, the electric-power industry is deeply concerned with the interaction mechanism, cooperative operation mode, and decision-making behavior of players in both markets. This study describes the impact of CEA trading and settlement on electric power market operations and analyzes the cost-transmission mode between the carbon and electric power markets. Building on this foundation,a long-cycle interactive operation simulation mechanism for the interaction between the carbon and electric power markets was established. In addition, a daily clearing model for the electric power market and a monthly trading model for the carbon market were developed. A CEC model per unit electric quantity of the coal-fired units was established.An example was constructed for the simulation. The results demonstrate that the proposed method effectively simulates operation of the carbon and electric power markets in different conditions. It accurately estimates the outcomes of electric quantity clearing, CEA trading, and settlement, and determines the CEC per unit electric quantity of coal-fired units.
Appendix A
Table A1 Parameters of coal-fired units
Appendix B

Fig. B1 Wind power on typical days in each month
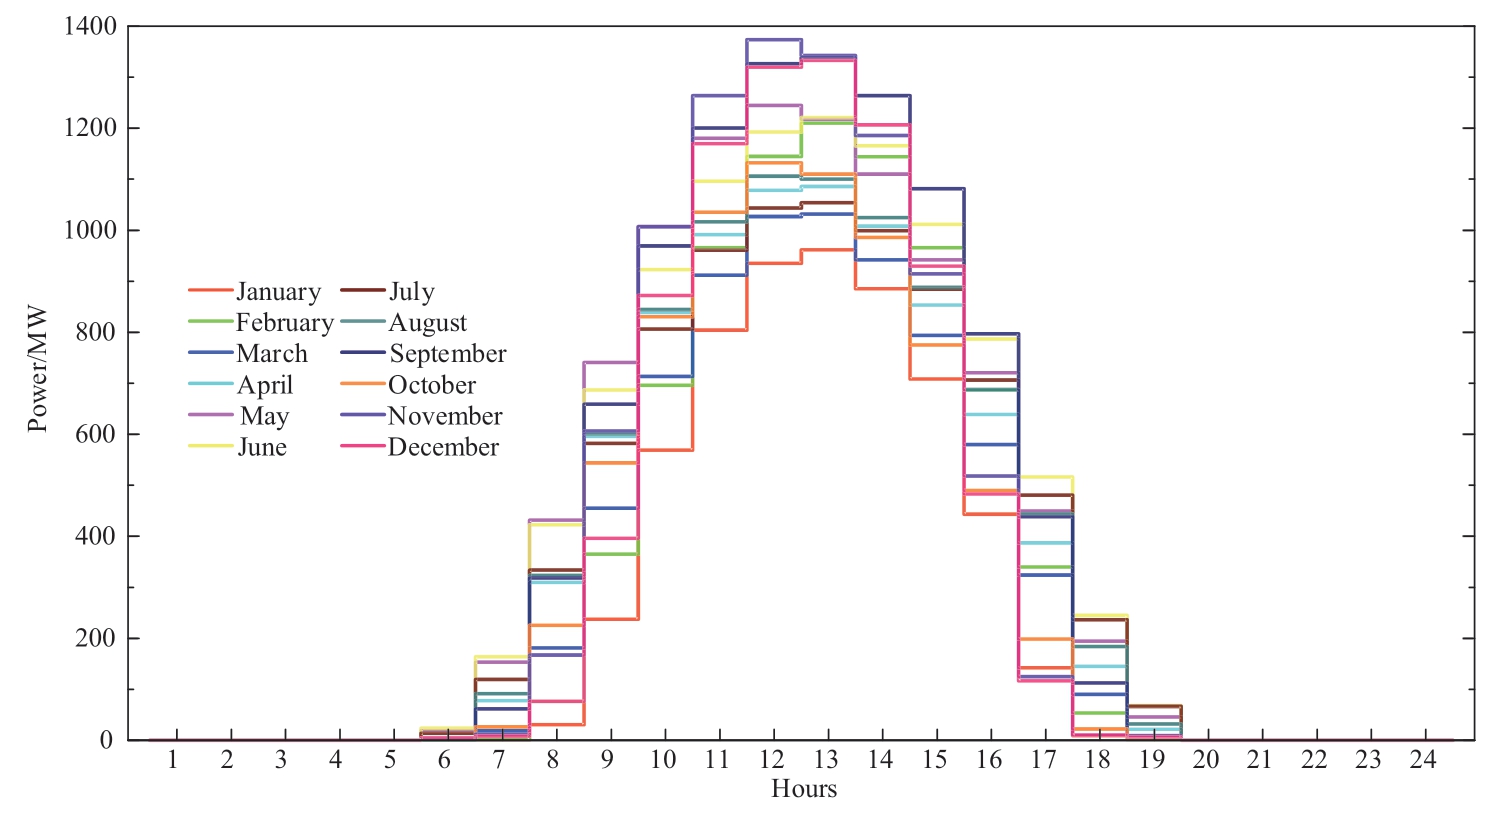
Fig. B2 Photovoltaic power on typical days in each month
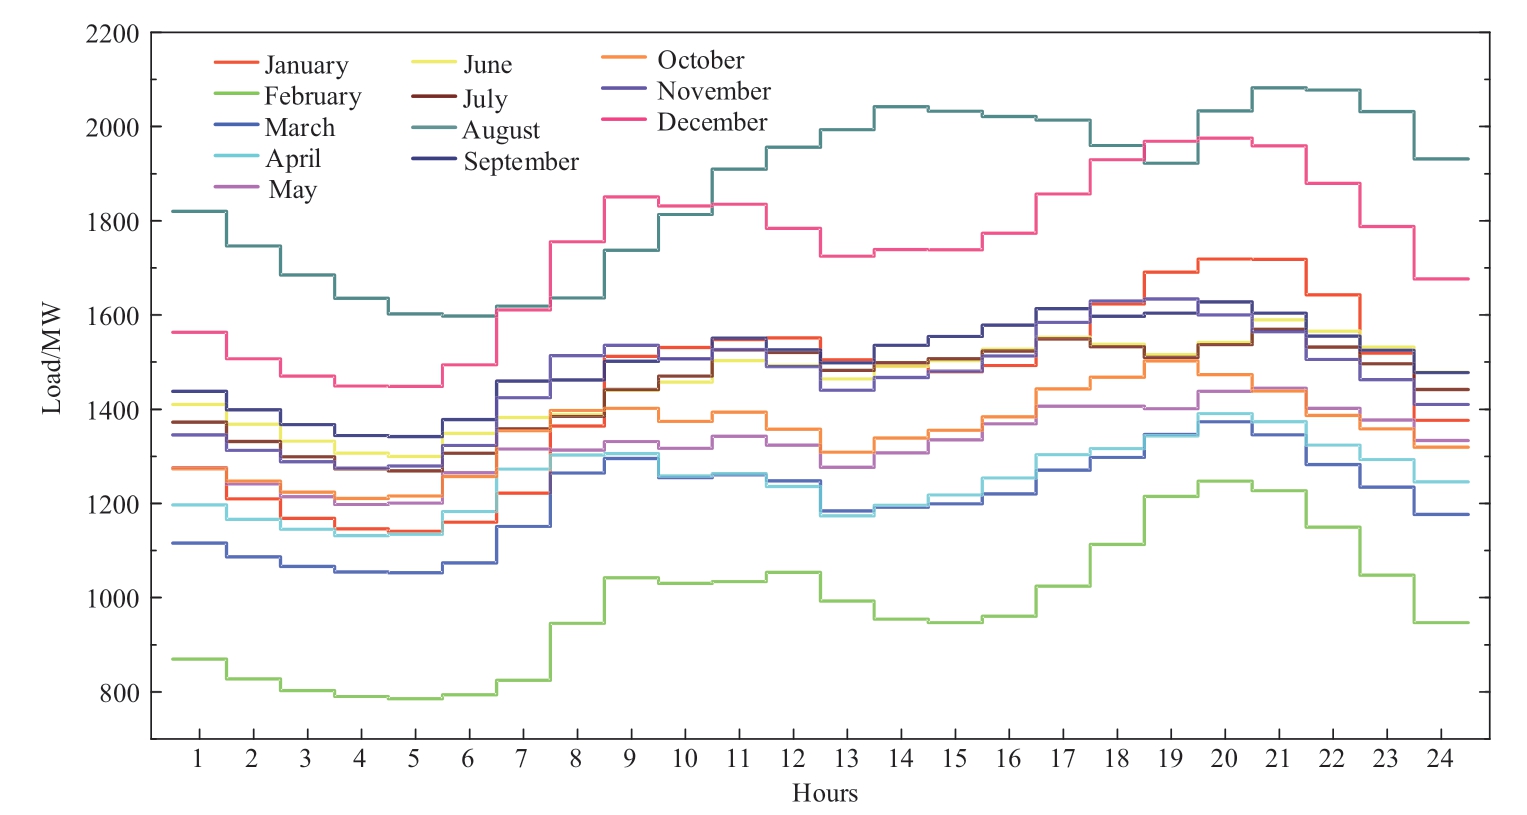
Fig. B3 Load on typical days in each month
Acknowledgements
This work was supported by Anhui Provincial Natural Science Foundation (No. 2208085UD02) and National Natural Science Foundation of China (No. 52077061).
Declaration of Competing Interest
We declare that we have no conflict of interest.
References
[1] Wei Y M, Chen K Y, Kang J N, et al. (2022) Policy and management of carbon peaking and carbon neutrality: A literature review. Engineering, 14: 52-63
[2] Xinhua News Agency (2020) Xi Jinping was speaking at the general debate of the 75th session of the United Nations General Assembly. http://www.gov.cn/xinwen/2020-09/22/content_5546168.htm. Accessed 22 Sept 2020 (in Chinese)
[3] Xinhua News Agency (2021) The national carbon emission trading market is officially launched. http://www.gov.cn/xinwen/2021-07/17/content_5625625.htm#1. Accessed 7 Jul 2021 (in Chinese)
[4] Ministry of Ecology and Environment, PRC (2020) Carbon Emission Rights Trading Measures (Trial). https://www.mee.gov.cn/gzk/gz/202112/t20211213_963865.shtml. Accessed 31 Dec 2020 (in Chinese)
[5] China News Service (2021) Steady progress has been made in the national carbon emission trading market and the coverage of the market will gradually expand. https://www.chinanews.com.cn/cj/2021/08-18/9546203.shtml. Accessed 18 Aug 2021 (in Chinese)
[6] Qu Y, Xiao Y P, Wang X L, et al. (2023) The equilibrium analysis and potential modifications on the China pilot electricity spot market. Energy Economics, 122: 106693
[7] He J, Ye Z (2019) Basic principles and equilibrium model of carbon cost pass-through in power industry. Ecological Economy,35(9): 45-49 (in Chinese)
[8] Zhao Y H, Zhou Z X, Zhang K W, et al. (2023) Research on spillover effect between carbon market and electricity market:Evidence from Northern Europe. Energy, 263: 126107
[9] Sijm J, Chen Y, Hobbs F B (2012) The impact of power market structure on CO2 cost pass-through to electricity prices under quantity competition-A theoretical approach. Energy Economics,34: 1143-1152
[10] Ganapati S, Shapiro J S, Walker R (2020) Energy cost passthrough in US manufacturing: Estimates and implications for carbon taxes. American Economic Journal: Applied Economics,12(2): 303-342
[11] Acworth W, Oca M M D, Boute A, et al. (2020) Emissions trading in regulated electricity markets. Climate Policy, 20(1):60-70
[12] Feng T T, Yang Y S, Yang Y H (2018) What will happen to the power supply structure and CO2 emissions reduction when TGC meets CET in the electricity market in China? Renewable &Sustainable Energy Reviews, 92: 121-132
[13] Meng S, Siriwardana M, McNeill J, et al. (2018) The impact of an ETS on the Australian energy sector: An integrated CGE and electricity modelling approach. Energy Economics, 69: 213-224
[14] Wang C, Wang Z H, Ke R Y, et al. (2018) Integrated impact of the carbon quota constraints on enterprises within supply chain:Direct cost and indirect cost. Renewable and Sustainable Energy Reviews, 92: 774-783
[15] Feng R, Lin P N, Hou C X et al. (2022) Study of the effect of China’s emissions trading scheme on promoting regional industrial carbon emission reduction. Frontiers in Environmental Science, 10: 947925
[16] Lin B Q, Jia Z J (2019) What will China’s carbon emission trading market affect with only electricity sector involvement? A CGE based study. Energy Economics, 78: 301-311
[17] Tang L, Wu J Q, Yu L, et al. (2015) Carbon emissions trading scheme exploration in China: A multi-agent-based model. Energy Policy, 81:152-169
[18] The State Council, PRC (2021) Announcement on the release of “Action Plan for Carbon Dioxide Peaking Before 2030”. http://www.gov.cn/zhengce/zhengceku/2021-10/26/content_5644984.htm. Accessed 26 Oct 2021 (in Chinese)
[19] Song X H, Wang P (2023) Effectiveness of carbon emissions trading and renewable energy portfolio standards in the Chinese provincial and coupled electricity markets. Utilities Policy, 84:101622
[20] Li J L, Chen Y G, Liu S J, et al. (2016) Electricity market equilibrium analysis considering carbon emission cost. Power System Technology, 40(5): 1558-1563 (in Chinese)
[21] Zhang X L, Du S H, Su J, et al. (2015) Cournot equilibrium analysis of electricity markets considering carbon emission price.Smart Grid, 3(9): 818-822 (in Chinese)
[22] Višković V, Chen Y, Siddiqui A S (2017) Implications of the EU emissions trading system for the south-east Europe regional electricity market. Energy Economics, 65: 251-261
[23] Duan S Z, Chen H Y, Zheng X D, et al. (2022) Bidding strategy of electricity generation and electricity market equilibrium analysis under the background of carbon market. Electrical Measurement & Instrumentation, 59(5): 33-41 (in Chinese)
[24] Liu Y, Cui X, Xie X, et al. (2020) Research on the trading of clean energy power generation right with the best social benefit under the electric-carbon linkage environment. Electrical Measurement & Instrumentation, 57(13): 112-117+148 (in Chinese)
[25] Zhao L, Li Y P, Jin X Y, et al. (2022) Coordinated bidding model of hydropower-thermal power in carbon-electricity coupling market considering CCER Mechanism. Automation of Electric Power Systems: 1-16. http://kns.cnki.net/kcms/detail/32.1180.TP.20221027.1803.010.html (in Chinese)
[26] Lu Z L, Liu M B, Shang N, et al. (2022) Two-stage clearing model for day-ahead electricity market considering impact of carbon emissions trading market. Automation of Electric Power Systems, 46(10): 159-170 (in Chinese)
[27] Feng T T, Li R, Zhang H M, et al. (2021) Induction mechanism and optimization of tradable green certificates and carbon emission trading acting on electricity market in China. Resources,Conservation & Recycling, 169: 105487
[28] Wang P, Tang J J, Zhang Z, et al. (2022) Bidding strategy optimization for power generation company in carbon emission rights and electricity market. Energy Reports, 8: 325-331
[29] Wang Z Y, Zhang H J, Yin W H, et al. (2023) Equilibrium analysis for prosumer’s participation in joint electricity and carbon markets. Energy Reports, 9: 1424-1431
[30] Zhou D Q, Zhou X Y, Ding H (2023) Research on renewable electricity bidding strategy under multi-market coordination.Chinese Journal of Management Science, 31(1): 248-255 (in Chinese)
[31] Deng S S, Chen H Y, Xiao D L, et al. (2023) Equilibrium analysis of oligopoly electricity market considering carbon market trading.Southern Power System Technology: 1-10. http://kns.cnki.net/kcms/detail/44.1643.TK.20230201.0954.003.html (in Chinese)
[32] Ye Z, He J, Zhou X, et al. (2018) Bi-level programming model for initial quota allocation of carbon emission rights in power generation industry. System Engineering, 36(11): 140-146 (in Chinese)
[33] Sun X C, Ding Y, Bao M L, et al. (2022) Carbon-electricity market equilibrium analysis considering multi-time coupling decisions of power producers. Automation of Electric Power Systems: 1-16. https://kns.cnki.net/kcms/detail/32.1180.TP.20221020.1618.005.html (in Chinese)
[34] Khatib S E, Galiana F D (2019) Investigating emission regulation policy in the electricity sector: Modeling an oligopolistic electricity market under hourly cap-and-trade. Energy Economics,78: 428-443
[35] Ministry of Ecology and Environment, PRC (2020) National Carbon Emission Trading allowance Total Setting and Allocation Implementation Plan (Power Generation Industry). https://www.mee.gov.cn/xxgk2018/xxgk/xxgk03/202012/t20201230_815546.html. Accessed 30 Dec 2020 (in Chinese)
[36] Muñoz F D, Suazo-martínez C, Pereira E, et al. (2021) Electricity market design for low-carbon and flexible systems: Room for improvement in Chile. Energy Policy, 148: 111997
[37] Ministry of Ecology and Environment, PRC (2023)Announcement on the Carbon Emission Trading Allowance Allocation in 2021 and 2022. https://www.mee.gov.cn/xxgk2018/xxgk/xxgk03/202303/t20230315_1019707.html.Accessed 15 Mar 2023 (in Chinese)
[38] Uhrig-Homburg M, Wagner M (2008) Derivative instruments in the EU emissions trading scheme-An early market perspective.Energy & Environment, 19: 635-655
[39] Song Y Z, Liu T S, Li Y, et al. (2022) Paths and policy adjustments for improving carbon-market liquidity in China.Energy Economics, 115: 106379
[40] Tang L, Wu J Q, Yu L, et al. (2017) Carbon allowance auction design of China’s emissions trading scheme: A multi-agent-based approach. Energy Policy, 102: 30-40
[41] Chappin E J L, Dijkema G P J (2009) On the impact of CO2 emission-trading on power generation emissions. Technological Forecasting & Social Change, 76: 358-370
Received: 6 February 2023/ Accepted: 21 June 2023/ Published: 25 August 2023
 Lili Hao
haolili@njtech.edu.cn
Mingjie Ma
997675459@qq.com
Zhengfeng Wang
wangzf0016@ah.sgcc.com.cn
Zi Yang
hit_yangzi@163.com
Chen Xu
1797036869@qq.com
Guangzong Wang
wangguangzong@bohai-power.com
Xueping Pan
xueping_pan@163.com
Jun Li
economics-lijun@hfut.edu.cn
2096-5117/© 2023 Global Energy Interconnection Development and Cooperation Organization. Production and hosting by Elsevier B.V. on behalf of KeAi Communications Co., Ltd. This is an open access article under the CC BY-NC-ND license (http: //creativecommons.org/licenses/by-nc-nd/4.0/ ).
Biographies

Lili Hao received the B.S. and M.S. degrees from Hohai University, Nanjing, China, in 2001 and 2004, respectively, and the Ph. D.degree from Southeast University, Nanjing,China, in 2010. She was a Visiting Scholar in the School of Electrical Engineering and Computer Science, Washington State University, Pullman, USA, from 2015 to 2016.She is working in College of Electrical Engineering and Control Science, Nanjing Tech University, Nanjing, China. Her research interest is power system security and stability analysis and control.

Mingjie Ma received the B.S. degree at Nanjing Institute of Technology, Nanjing,China, in 2019. He is working towards the M.S.degree at Nanjing Tech University, Nanjing,China. His research interest is the operation and optimization of electricity market and carbon market.

Zhengfeng Wang a senior engineer, received the Ph.D. degree in electrical engineering from Southeast University, Nanjing, China, in 2006. He is currently engaged in power system dispatching and operation.

Zi Yang a senior engineer, received the B.S.and M.S. degrees from Harbin Institute of Technology, Harbin, China, in 2018. His research focuses on the power grid regulation and operation, electricity markets.

Chen Xu received the B.S. degree at Yancheng Institute of Technology, Yancheng, China, in 2022. He is studying for the M.S. degree at Nanjing Tech University. His research focuses on the coordinated operation of green power and electricity markets.

Guangzong Wang received the Master’s degree at the School of Electrical and Information Engineering, Tianjin University, in 2013. His research interests include Integrated Intelligent Energy, Virtual Power Plant, energy internet, etc.

Xueping Pan received the B.S. Eng. and M. S. degrees in electrical engineering from Hohai University, China, in 1994 and 2000,respectively, and the Ph.D. degree from Zhejiang University, China, in 2008. She is working in College of Energy and Electrical Engineering, Hohai University, Nanjing,China. Her research interest is modeling and analysis of power systems with renewable power generation.

Jun Li received the Ph. D. degree from University of Science and Technology of China, Hefei, China, in 2017. He is working in School of Economics, Hefei University of Technology, Hefei, China. His research focuses on the carbon market, electricity market and energy economy.
(Editor Dawei Wang)
