0 Introduction
Recently, many regions have encouraged the development of photovoltaic (PV) electricity systems to meet local energy consumption [1]. However, the uncertainty of PV electricity has led to its low utilization[2]. Electric-to-hydrogen (EH) using PV can be called “green hydrogen,” which converts excess PV electricity into hydrogen energy for storage and transfer, enabling self-absorption of PV electricity [3]. However, random PV electricity makes it difficult to operate an EH fully and requires a preplanned EH capacity [4, 5]. A more economical approach is to invest in an EH with larger capacity for local PV sharing. Therefore, promoting energy cooperation between PV and EH is at the core of improving the energy economy.
For the optimization of energy systems containing PV-hydrogen, current research usually treats an energy system consisting of PV and EH as an individual entities and focuses on its overall benefits. A single- or multiobjective optimization model was established to accomplish centralized optimization decision-making for the entire energy system. For example, the authors in [6] constructed a joint model considering PV and EH based on the hydrogen balance equation to maximize the efficiency of hydrogen energy and reduce the economic and environmental costs of the system. The authors in [7] investigated the capacity optimization of PV-hydrogen energy systems and showed that PV-to-hydrogen can minimize system abandonment and load interruption and can effectively improve the overall system revenue. The authors in [8] proposed a scheduling model for the collaborative optimization of an EH, distribution network, and heating network. The advantage of centralized optimization is that it facilitates energy management while solving problems faster.
As the EH increases, the centralized optimization no longer has the advantage of solution speed. The concept is to split a large system into multiple subsystems for distributed optimization. In reality, PV and EH belong to different agents and energy fields, each of which only possesses local information in their field and rationally pursues maximizing their benefits. However, this is due to information asymmetry and other reasons leading to disorderly competition, greatly reducing market efficiency.Noncooperative and cooperative games are used to deal with the benefits of multiple agents [9]. Noncooperative games emphasize individual rationality and the self-interested decision-making process, and the Nash equilibrium may not exist, which is locally optimal [9, 10]. In contrast,cooperative games consider the unity of individual and overall benefits and can achieve global optimality [9].For example, an operation model based on a cooperative game was proposed for wind farms and power grids to invest in to address the problems of high investment cost and low utilization rate of large hydrogen plants [11]. The authors in [12] proposed an allocation strategy for a multienergy system including PV-thermal-hydrogen based on the cooperative game. As an important part of cooperative games, Nash negotiations are used for the benefit allocation of multiple agents [13]. The idea is to transform the allocation of cooperative benefits into a process of finding a Nash negotiation solution that is economically meaningful for maximizing the total benefits of the alliance.The authors in [14-16] find Nash equilibrium solutions to achieve fair benefit distribution of multi-microgrid cooperative alliances. The authors in [17] achieved wind-EH cooperation based on Nash negotiation. The authors in[18] comprehensively considered multiple types of sourcenet-load subjects and constructed a bargaining model under day-ahead cooperation. These studies actively explored the beneficial relationship between multiple agents. However,most of them focused on the cooperation problem among multiple micro-networks, and their models were different from the PV-EH cooperation model, which could not solve the cooperative operation and benefit distribution problems of the PV-EH. Additionally, some models violate privacy by solving the benefit distribution among agents using analytical methods. How to take into account the individual and overall benefits of multiple agents and how to protect the privacy of each agent are issues that need to be addressed.
The solution of cooperative models mostly adopts the alternating direction method of multipliers (ADMM),which can decompose complex problems into subproblems,achieve distributed solutions of the models, and protect subject information simultaneously. The authors in[19] studied the coordination of electric and natural gas systems by ADMM, and reference [20] proposed dayahead scheduling of electricity and natural gas systems to minimize operating costs using an improved ADMM.
However, the actual engineering of large-scale hydrogen production consumes a great amount of energy and may face the assessment of renewable energy consumption tasks (RECT). In 2018, the China Energy Administration required provinces to set quotas for renewable energy power consumption according to standards and established rules for quota trading and offsetting [21]. Each power producer and consumer was required to purchase a certain amount of renewable energy to cover their assigned RECT.PV involves the generation and distribution of green certificates (GC). As a derivative of green electricity,GC is used to replace government subsidies for PV and improve the market competitiveness of PV [22]. GC is a kind of certification for green electricity issued by the government or a third-party organization. GC can be traded through voluntary subscription, can only be traded once,and cannot be sold twice. The main projects currently in use include centralized photovoltaic power and land-based wind turbines [23]. Each GC represents a certain amount of renewable energy generation (1 MWh) and can be traded in the green certificate market (GCM). For generators, the purchase of one GC represents the notional generation of 1 MWh of non-water renewable electricity. For consumers,the purchase of one GC represents the notional use of 1 MWh of non-water renewable electricity.
Therefore, when the EH, which is involved in RECT,and the PV, which is involved in GC, cooperate, this provides a basis for direct trading of GC between the PV and the EH. The EH can directly purchase the GC from the PV to claim its use of green energy, and the EH can offset RECT according to the ratio of the power corresponding to the purchase of the GC to its actual power consumption,thus indirectly fulfilling its mission. Furthermore, a PV system can generate additional revenue. Therefore, the cooperation model of PV and EH involves both electricity and GC trading, which is not considered in the existing cooperation model.
In most cases, the stochastic properties of energy are ignored when dealing with the above-mentioned energy cooperation, leading to limitations in the robustness of the cooperation, which may lead to its failure. Stochastic programming (SP) [24] is considered one of the most promising methods for dealing with uncertainty. Some studies have proposed the use of style="font-size: 1em; text-align: justify; text-indent: 2em; line-height: 1.8em; margin: 0.5em 0em;">Conditional value at risk (CVaR) can quantify the expected losses that may result from uncertainty [28, 29].Several studies have applied CVaR to the electricity sector.For example, the authors in [30] proposed a new datadriven worst-case CVaR (DWCVaR) energy management model for assessing the operational risk due to uncertainty in PV electricity. The authors in [31] introduced CVaR into the pricing model of distribution service providers and established a cooperative Stackelberg game-based energy management considering risk assessment. They only needed to add CVaR to the objective function. Compared with style="font-size: 1em; text-align: justify; text-indent: 2em; line-height: 1.8em; margin: 0.5em 0em;">To solve these problems, this study presents a PVEH cooperative model that includes GC trading under risk management by conducting research from three perspectives: GC, risk control, and cooperative operations.The contributions of this study are summarized as follows:
1) The PV-EH cooperation mechanism involving electricity and GC trading was analyzed.
2) A PV model considering GC and an EH model with RECT were established, while a risk control model based on CVaR was introduced to control the uncertain operational risk of PV and EH.
3) A PV-EH cooperative model was established and equivalently translated into two subproblems of cooperative benefit maximization and transaction payment negotiation.
4) The ADMM was used to solve two subproblems to protect the privacy of each agent, and the proposed approach was verified through simulation.
The remainder of this paper is organized as follows:Section 1 introduces the cooperation framework and analyzes the cooperation mechanism. Section 2 establishes an operational model for each entity. Section 3 establishes the PV-EH cooperative model and solution process.Section 4 presents a case study. Finally, the conclusions are presented in Section 5.
1 System framework
The energy cooperative framework consisting of PV and EH is shown in Fig. 1, and it involves the trading of electricity and GC. In the noncooperative model, electricity is traded as follows: PV electricity is sold to the electricity market (EM) at feed-in prices (FP), the EH purchases electricity from the EM at industrial prices (IP) to cover the electricity demand, and the EH purchases green electricity from the EM at the price of the EM’s green electricity to cover part of the renewable energy absorption task. The GC is traded as follows. The GC generated by the PV is bundled with its feed-in electricity sold to the EM, and the EH buys the GC from the EM to cover its own RECT.

Fig. 1 Energy cooperation framework
Under the cooperative mode, the trading variety and volume between entities and between entities and markets are more flexible. According to [32], the PV agrees with the EH to determine the direct trading of electricity and price between entities based on the reference price (FP, IP)and energy demand. According to reference [33], the GC generated by PV can be traded directly with EH and sold in the GCM. In addition, the EH can choose to seek GC trading from the GCM and PV to cover its renewable energy absorption mandate.
Therefore, in the cooperative model, the PV-EH in Fig. 1 can be split into the following two sub-transaction processes.
PV and EH seek direct trading first: PV and EH first determine the total power and load; then, PV quotes EH with a selling price no lower than FP, EH quotes PV with a purchase price no higher than IP, and PV and EH adjust the price according to each other’s quotes and adjust the expected volume of direct trading based on the principle of maximizing their benefits. Both PV and EH determine the direct trading volume and reach an electricity trading agreement when the PV’s selling price and the EH’s purchasing price agree. When direct trading between PV and EH is completed, the PV sells surplus electricity to the EM, and the EH buys electricity from the EM to meet the surplus load demand.
When electricity trading ends, GC trading is as follows.The GC of the PV’s GC is equal to its total electricity;therefore, when the electricity trading ends, the GC of the PV’s GC is also determined. The PV electricity purchased by the EH is green energy, and therefore covers a portion of the RECT of the EH. Therefore, whether the PV cell and EH trade directly on the GC depends on whether the EH has completed its RECT. When not completed, the PV and EH first seek to directly trade and determine the remaining RECT to obtain the direct GC trading range. Then, within a price range that is no lower than the GC’s FP (GCFP) and no higher than the GC’s market prices (GCMPs), the PV and EH negotiate the price. PV and EH reach direct GC trading when EH’s GC purchase price of the EH and PV’s GC sale price of the PV are equal. Then, PV can sell the remaining GC to the GCM, and EH determines whether to purchase the GC from the GCM based on the completion of RECT.
2 Main model
This section introduces the optimization models of the PV and EH. A Monte Carlo approach was used to simulate the uncertainty, owing to the non-determinism of the PV electricity and EH loads. The basic idea is to first simulate scenarios of PV electricity and EH loads using the Monte Carlo random sampling technique [34], reduce them to typical scenarios employing the k-means clustering method to simulate the uncertainty of PV electricity and EH loads,and finally control the risk of the model based on CVaR.
2.1 PV model
If the PV system does not operate in cooperation with the EH, the optimization objective of the PV system is to minimize its own operating cost Cnpv, including the electric revenue to be sold to the EM  , the GC revenue to be sold to the GCM
  , and the operation an d maintenance costs
  . Let
. Let![]() be the vector of the decision variables for the nth PV under scenario w, including the electricity to be sold to the EM
be the vector of the decision variables for the nth PV under scenario w, including the electricity to be sold to the EM![]() , and the GC to be sold to the GCM
, and the GC to be sold to the GCM  . The PV model is shown in Equations (1) – (6).

where T is the dispatch cycle, N is the number of PVs, W is the set of scenarios of PVs, Z is a positive integer,  is the probability of the nth PV under scenario w,
  is the unit generation maintenance factor of the nth PV,
  is the FP of the nth PV at moment t,
  is the GCFP of the nth PV in the T trading cycle,
  is the electricity to be sold to the EM by the nth PV under scenario w at moment t,
  is the GC of the nth PV to be sold to the EM under scenario w, and
  is the electricity generation of the nth PV at moment t under scenario w. Equation (5) shows the PV electric constraint, and Equation (6) presents the GC constraint of PV.
The uncertainty of PV affects its operating cost and the introduction of CVaR to manage the risk of the impact of PV uncertainty on cost.

where  is the cost of the CVaR risk management of the nth PV, ε is the confidence level, ξn is the VaR of the cost of the nth PV corresponding to the quantile 1−ε, and
  is a non-negative auxiliary variable, specifically characterized as the amount by which the operating cost of the nth PV under scenario w exceeds ξn. Using Equations (7) and (8),PV scenarios with operating costs exceeding the VaR value are optimized to reduce their operating costs of these PV scenarios.
Then, the PV optimization model, including CVaR, is

where δnpv is the risk-aversion factor for the nth PV.
The model above can be obtained directly using an optimization tool. Therefore, when the PV system does not operate in cooperation with the EH, the optimal solution to the above optimization problem is denoted as m∗, and the optimal cost is denoted as Cnpv,0.
2.2 EH model
The EH determines the amount of electricity purchased from the EM and PV to cover the EH load and minimize the operating costs by optimizing the production schedule.
1) Electrolyzers (EL)

where ηH2 is the EL energy conversion rate, PtH2 is the EL hydrogen production at time t, Ptel is the EL electricity consumption at time t,  is the EL electricity limit, and
 is the climbing limit.
2) Compressor

where is the compressor power consumption at time t,RH2 is the specific heat capacity constant of hydrogen,
  is the hydrogen flow rate of the compressor at time t, Tin is the temperature of the hydrogen input to the compressor,ηcom is the compressor efficiency, K is the hydrogen isentropic index, and P out/Pin is the compression ratio.
3) Hydrogen storage tank

where PtH2 is the internal air pressure of HST at time t; TH2 is the internal temperature of HST; molH2 is the molar mass of hydrogen; mtcom is the compressed hydrogen volume of the compressor at time t;  is the hydrogen load demand at time t; PH 2 ,min, PH 2 ,max denote the minimum and maximum atmospheric pressure of HST, respectively.
4) Electricity Storage

where Etbat is the stored energy at moment t; Ebat,min and Ebat,max are the minimum and maximum stored energy of ES,respectively; Ptbat,c and Ptbat,d are the charging and discharging rates at moment t, respectively; ebat,c and ebat,d are the charging and discharging efficiencies, respectively; Pbat,c,max,Pbat,d,max are the maximum charging and discharging rates,respectively; utbat is a binary variable to avoid charging and discharging processes at the same time.
If the EH does not cooperate with any PV system,the decision variables of the EH can be expressed as![]() where
where  is the electricity purchased by the EH from the EM at moment t under scenario w, Gwgcm2h is the GC purchased by the EH from the GCM during period T under scenario w, and
  is the green electricity purchased by the EH from the EM at moment t under scenario w. The operating cost of the EH includes the cost of electricity purchased from the EM
 , the cost of the GC
  , the cost of green electricity
 , the maintenance cost
  , including ES, and the maintenance cost of EL, as shown in (17) – (24).
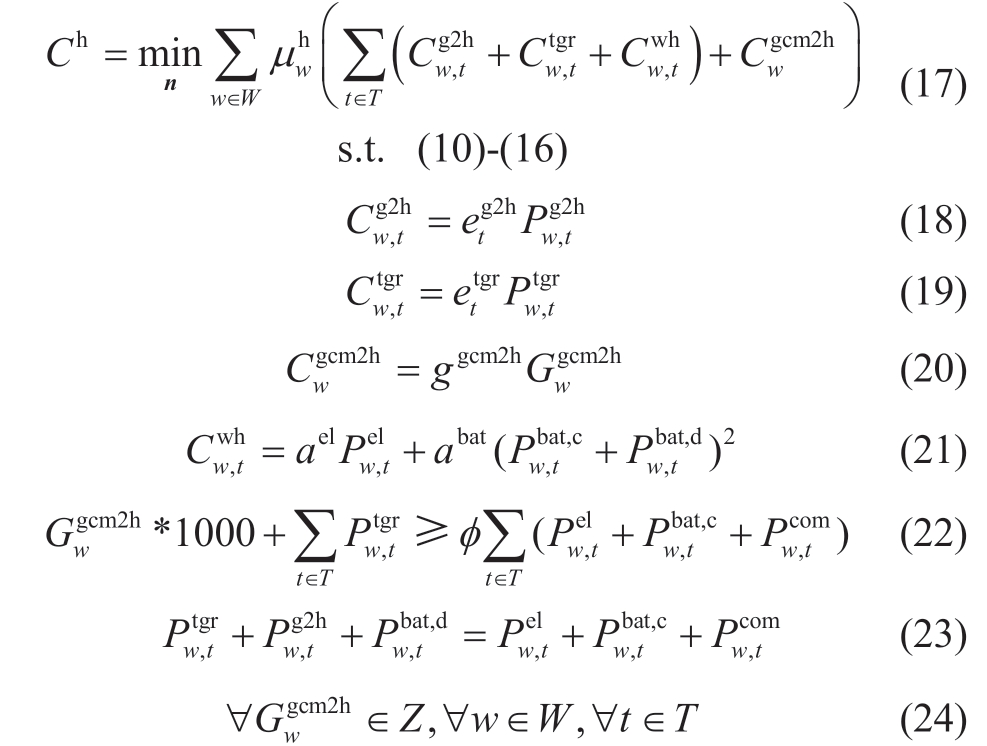
where  is the probability of EH under scenario w;
  is the IP at moment t;
  is the price of purchasing green power from EM at moment t; ggcm2h is the price of GC in period T; ael, abat are the maintenance factors of EL and ES, respectively; φ is the non-water renewable energy absorption ratio of EH. Equation (22) is the constraint of the renewable energy absorption task that EH has; Equation (23)is the constraint on the EH electricity balance.
Similarly, uncertainty in the hydrogen load leads to an operational risk for the EH, which is denoted by Ch,var.

where ξh is the VaR value of the EH cost corresponding to the quantile 1−ε and χwh is the portion of the EH operating cost over ξh under scenario w.
Then, the EL optimization model considering CVaR is

The aforementioned well-defined problem is also a convex optimization problem, for which there exists an optimal solution denoted by Ch,0. The energy-optimal scheduling is denoted as n0.
3 Energy cooperation
PV and EH engage in energy cooperation to minimize the cost of energy to society. Two forms of energy cooperation exist between the PV system and EH.
The cooperation of electricity. Ppv2eh =[P1pv2eh,P2pv2eh,...,PNpv2eh] represents the electricity sold by all PVs to EH. where![]()
![]() i s the electric energy sold to EH by the nth PV at time t under scenario w. Peh2pv=[P1eh2pv,P2eh2pv,...,PNeh2pv] is the electric energy purchased by EH from all PVs, where
i s the electric energy sold to EH by the nth PV at time t under scenario w. Peh2pv=[P1eh2pv,P2eh2pv,...,PNeh2pv] is the electric energy purchased by EH from all PVs, where![]()
![]() is the electric energy purchased by EH from the nth PV at time t under scenario w.
is the electric energy purchased by EH from the nth PV at time t under scenario w.
GC cooperation. Let Gpv2eh=[G1pv2eh,G2pv2eh,...,GNpv2eh]represents the GC sold by all PVs to EH. here,![]() is the GC sold to EH by the nth PV under scenario w during scheduling period T.Let Geh2pv=[G1eh2pv,G2eh2pv,...,GNeh2pv] represents the GC purchased by EH from all PVs, here,
is the GC sold to EH by the nth PV under scenario w during scheduling period T.Let Geh2pv=[G1eh2pv,G2eh2pv,...,GNeh2pv] represents the GC purchased by EH from all PVs, here,![]() is the green GC purchased by EH from the nth PV under scenario w during the scheduling period T.
is the green GC purchased by EH from the nth PV under scenario w during the scheduling period T.
Similarly,letτ=[τ 1,τ 2,...,τN] ,τ≥0 represents the revenue chargedby the PVto the EH and let π=[π 1,π 2,...,π N] ,π≥0 represents the cost paid by the EH to the PV.
The transaction species, transaction energy, and transaction price must be the same for the PV and EH.

The existence of Equation (30) indicates that τ and π do not affect the cooperation costs. This indicates that individual and social benefits are not contradictory in the proposed cooperative model. τ and π are discussed in the next section as benefit-distribution problems in the cooperation model.
3.1 P1
The cooperation of the PV system and EH requires minimizing the cost of cooperation, including all the energy costs of the PV system and EH. Let![]() be the vector of decision variables for the nth PV. Then, x =[ x1 , x2,..., xN]is the set of decision variables for all PVs. Let
be the vector of decision variables for the nth PV. Then, x =[ x1 , x2,..., xN]is the set of decision variables for all PVs. Let![]() be the vector of the decision variables for the EH. The P1 model is shown in (31)–(39).
be the vector of the decision variables for the EH. The P1 model is shown in (31)–(39).
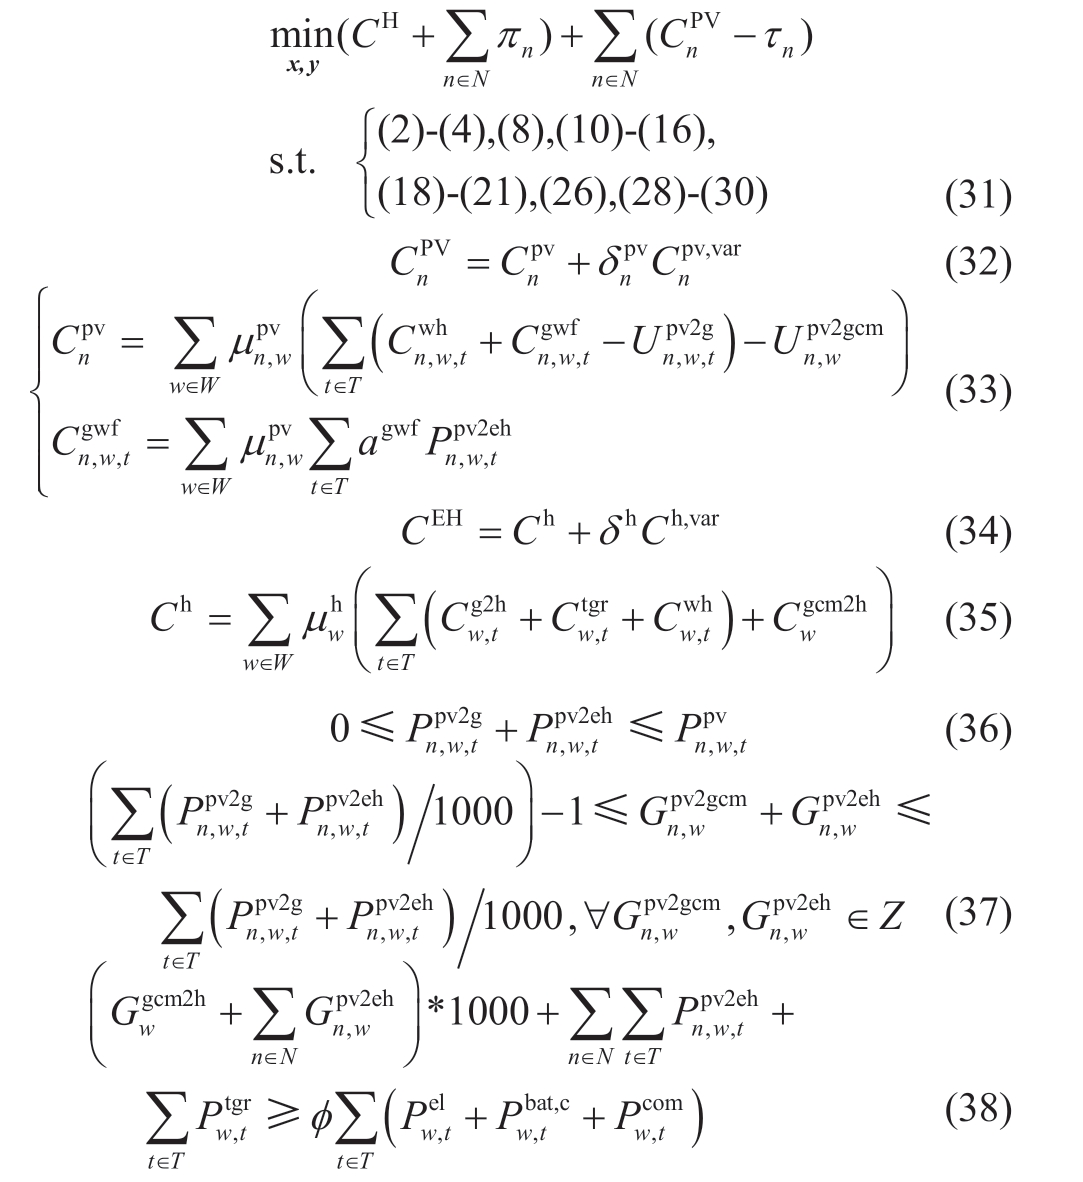
where CnPV is the cost of the nth PV under cooperation and risk,  is the service fee of the nth PV at moment t under scenario w, agwf is the service fee for commercial and industrial electricity, and CEH is the cost of the EH under cooperation and risk. Equations (36) and (37) are the electricity and GC constraints of PV under cooperative mode, respectively. Equations (38) and (39) are the GC constraints and electricity balance constraints of EH under cooperative mode, respectively.
Equation (30) causes πn and τn in Equation (31) to cancel and transform Equation (31) into an augmented Lagrangian function to be solved using the ADMM, as shown in (40).

where αeand αgc are the penalty parameters and δne=[δ 1e, δ2e,..., δTe] and δngc=[δ 1gc, δ2gc,..., δTgc] are the dyadic multiplier vectors of Equations (28) and (29), respectively.The iterations were as follows:
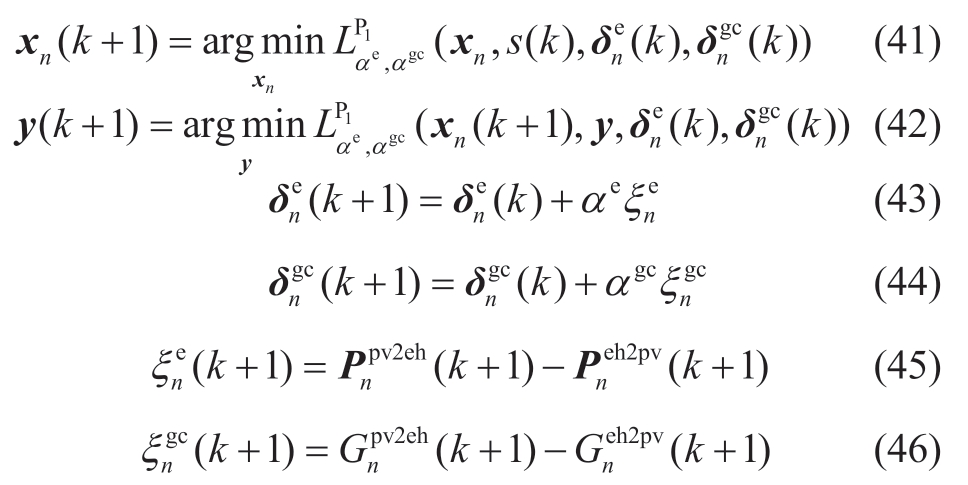
where  and ξngc are the residuals of P1 problem. Equation(41) is the iterative equation of the PV optimization model,where n subproblems are solved in parallel by the PV, and each PV requires the current information y( k),
![]() from the EH. Equation (42) is the iterative equation of the EH optimization model, where the EH requires the current information xn( k+1) from the PV.
from the EH. Equation (42) is the iterative equation of the EH optimization model, where the EH requires the current information xn( k+1) from the PV.
The pseudo-code for the trading process is as follows:

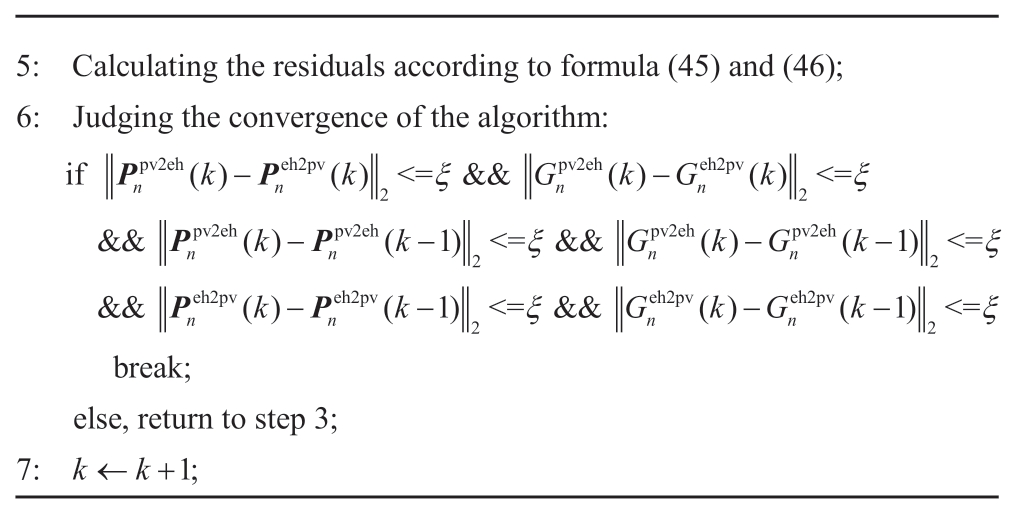
Let xn**, ∀n,y** be the optimal solution of P1 and Cnpv,1=CnPV( x *n*) and Ch,1=CH( y **) be the energy costs of PV and EH in energy cooperation, respectively.
3.2 P2
In the previous section, the direct transaction xn**, ∀n,y**under the PV and EH cooperation was obtained by solving P1. However, the direct transaction prices under PV and EH cooperation cannot be directly obtained. The Nash bargaining theory is used to solve the optimal solutions τn* and πn* for direct transaction prices, and the models are shown in Equation (47) and (49).

There are two forms of energy cooperation between the PV system and EH and therefore two bargaining processes.
The bargaining process of electricity. Let![]()
![]() be the price curve of electricity sold by the nth PV to EH, where
be the price curve of electricity sold by the nth PV to EH, where  is the price of electricity sold by the nth PV to EH at time t. Therefore,let
![]() be the price at which EH buys electricity from the nth PV, where
be the price at which EH buys electricity from the nth PV, where  is the price at which EH buys electricity from the nth PV at time t. When
![]() , the bargaining process of electricity is finished and PV and EH agree on the direct transaction price of electricity.
, the bargaining process of electricity is finished and PV and EH agree on the direct transaction price of electricity.
The bargaining process of the GC. Let gpv2eh =[g1pv2eh,g2pv2eh,...,gNpv 2eh] represent the price at which all PVs sell GCs to the EH. Here, gnpv2eh is the price at which the nth PV sells GCs to the EH in cycle T. Let geh2pv=[g1eh2pv,g2eh2pv,...,gNeh2pv] represent the price at which EH buys GC from all PVs, here gneh2pv is th e price at which EH buys GC from all PV in cycle T. When gpv2eh=geh2pv ,the bargaining process of the GC is finished, and the PV and EH agree on the transaction price of the GC.
The solution of the direct transaction![]() is denotedas
is denotedas![]() , where
, where![]()
![]() and
and![]() Thus, the exchange of benefits between PV and EH can be expressed as
Thus, the exchange of benefits between PV and EH can be expressed as![]() Here,
Here,![]() is the selling price of the nth PV to EH and
is the selling price of the nth PV to EH and![]() is the buying price of EH to the nth PV.
is the buying price of EH to the nth PV.
Then P2 can be expressed as
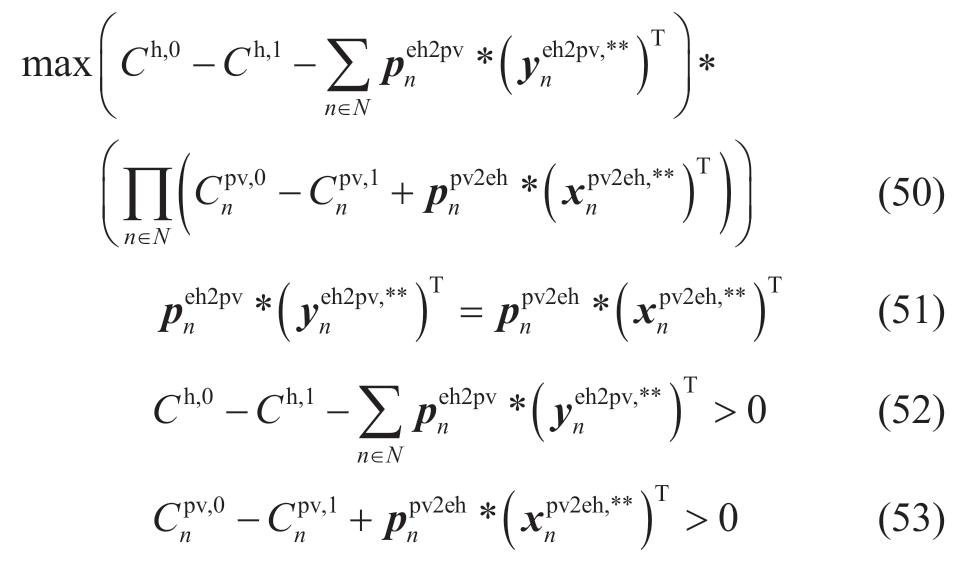
To prevent bargaining failure, we assume that the interentity transaction price is greater than the market acquisition price and less than the market sale price.

Taking the maximum value of the logarithm of the objective function in Equation (47), P2 can be equivalently transformed into the following problem using a separable objective function.

subject to: (51)-(53)
The augmented Lagrangian formula is given by
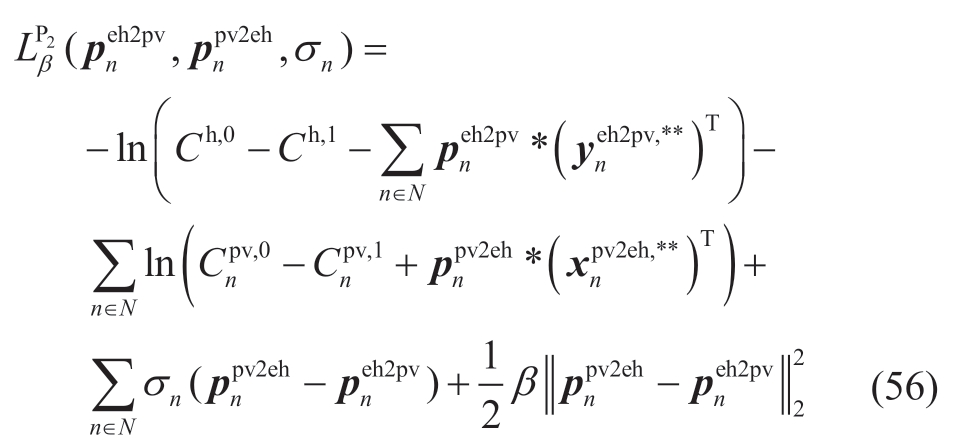
where β is the penalty parameter and σn =[σ 1,σ 2,...,σ T,σgc ],n ∈ N is the vector of pairwise multipliers of the coupling constraint in Equation (30).
4 Case analysis
The simulation case is based on an integrated energy service demonstration project in Jiangsu, which has been connected to two PVs, three energy storage units, two flexible loads, one electric hydrogen production unit, and two microgrids formed by any combination of the above elements, as well as the management capability of the cooling, heating, and electricity triple-supply units. In this study, the project was simplified into two PV entities of different sizes, whereas three energy storage units and one electric hydrogen production unit were considered as one EH. The parameters of the EH model are listed in Table 1,the FP and IP data of the PV are obtained from references[35, 36], and the predicted data of the PV electricity and hydrogen load are shown in Fig. 2. The model was solved on a personal computer with a 6-core CPU and a 3.7 GHz using Matlab2017 to invoke the Cplex and Fmincon solvers to solve P1 and P2, respectively. The residuals of both P1 and P2 were 0.1, the maximum numbers of iterations were 50 and 100, respectively, and the penalty factor was 0.01. The initial risk-aversion factor was set to 0.005. The scheduling interval was 1 h and the maximum scheduling period was 12 h.
Table 1 Parameters of equipment
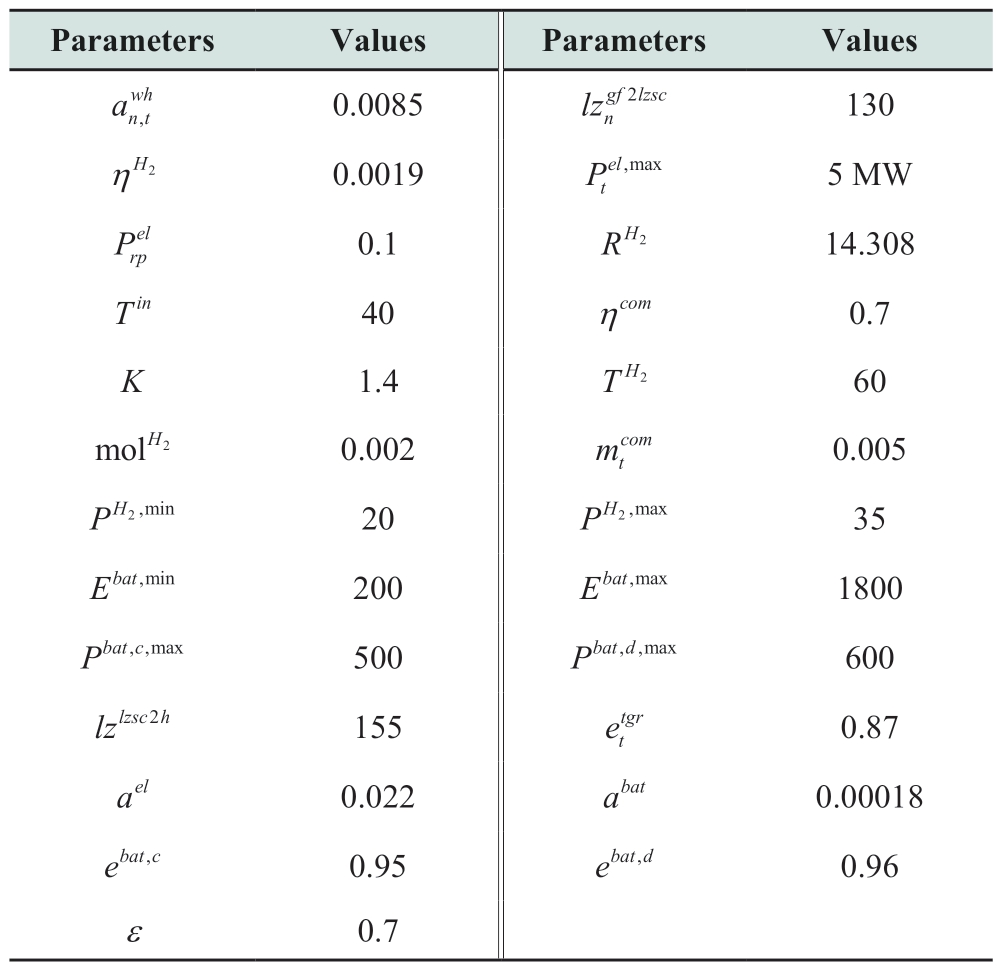

Fig. 2 Power of PV and EH load
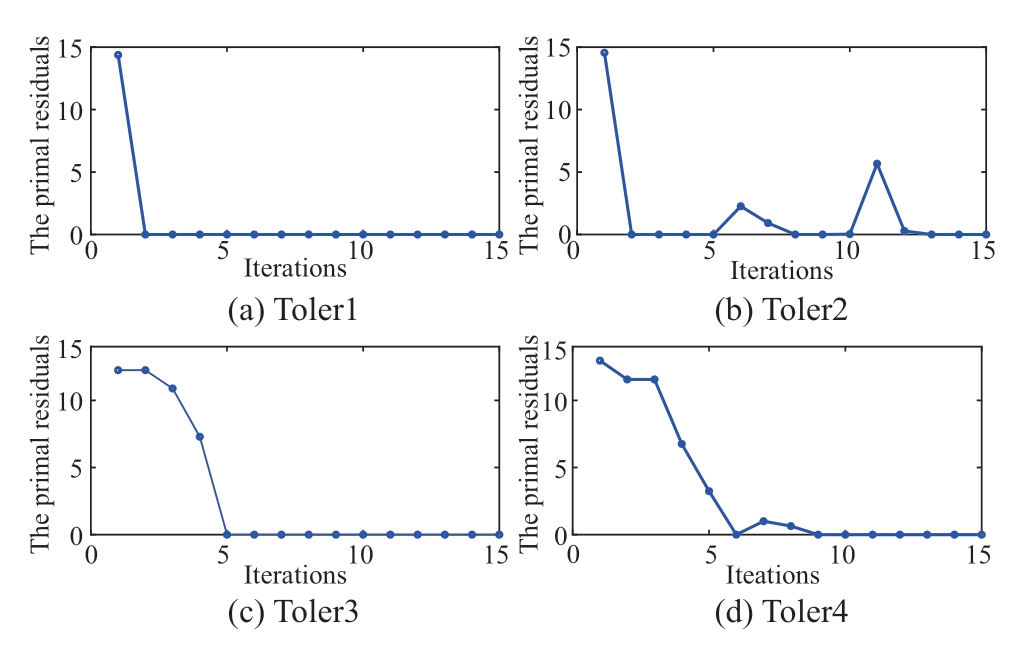
Fig. 3 The iterative process of P1
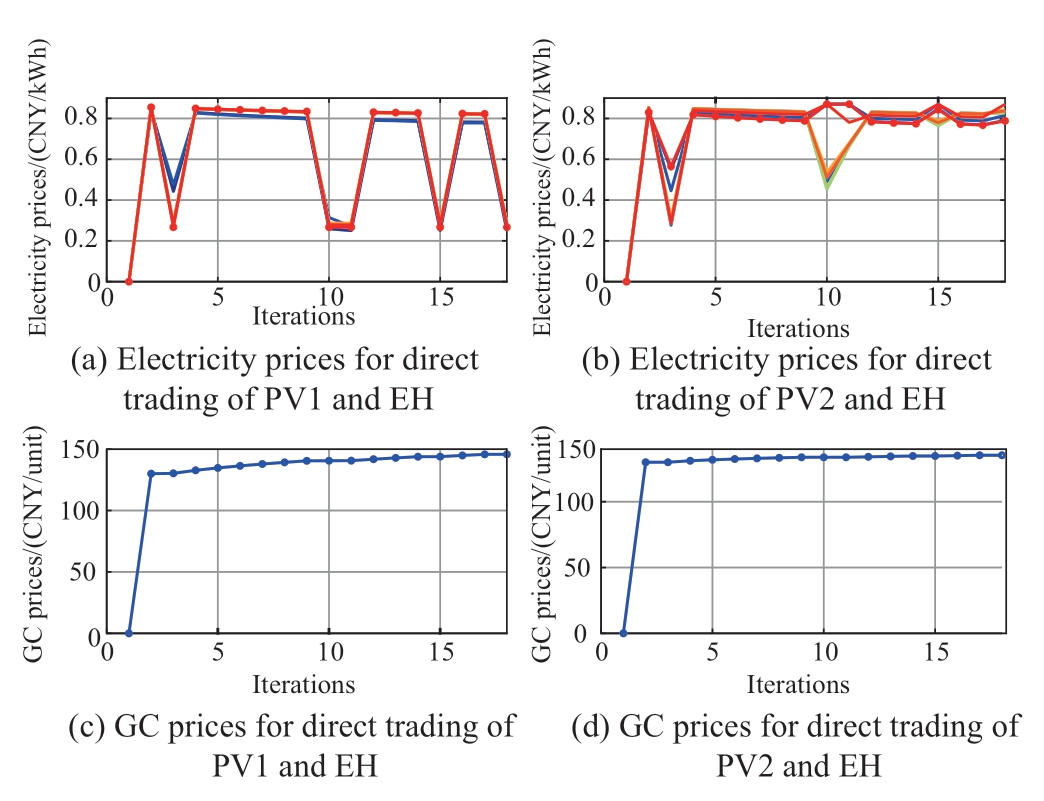
Fig. 4 The iterative process of P2
4.1 Algorithm convergence analysis
In this study, the ADMM was used to solve P1 and P2. According to the ADMM principle, when the objective function is a convex function, the constraints are affine constraints and the step size is appropriate, the computational results are guaranteed to converge to the global optimal solution. In this study, both the PV and EH are convex optimization models; therefore, both P1 and P2 are convex optimization problems, and the distributed computation using ADMM is bound to converge.
Fig. 3 shows the iterative process of P1 that achieved convergence after 15 iterations. Fig. 4 illustrates the iterative process of the direct transaction price of P2 that achieved convergence in the 16th iteration. This shows that the ADMM-based solutions of both P1 and P2 have good convergence properties, and a distributed and efficient solution of the two subproblems can be achieved while protecting the private information of each entity.
4.2 Transaction analysis
A. Transaction energy analysis
Figs. 5(a) – 5(b) present the results of electricity trading between EH and PV and EM under PV-EH cooperation.When the IP is low, EH will purchase more power from EM. As the IP rises, during the 06:00–10:00 period, EH will reduce the electricity purchase from EM and choose to purchase electricity from PV1 and PV2. During the 11:00–12:00 period, EH purchases electricity from PV1 and PV2 when IP is higher. The electricity cost of EH can be minimized by arranging the electric plan in this manner.Figs. 5(c) – 5(d) show the electricity trading schemes of PV1 and PV2. We found that the electricity of PV1 is traded to EM, while the electricity of PV2 is traded to EH,which shows that for different entities, choosing the suitable trading scheme for themselves can maximize revenue.
Fig. 6 shows the results of GC trading between EH and PV1, PV2, and GCM. The x-axis indicates the number of iterations; thus, the last iteration indicates the result of the GC trading. As shown in Fig. 6(a), after 16 iterations, the GCs were fixed at 48 between EH and PV1 and 7 between EH and PV2, and the EH did not purchase GCs from the GCM. According to Figs. 6(b) – 6(c), PV1 sold most of the GCs to EH and a small number of GCs to GCM, whereas PV2 sold seven GCs to EH and EM. This indicates that the EH prefers to directly purchase GCs from PV1 and PV2 compared to the GCM. Meanwhile, in the PV’s view, the PV will receive a greater return by selling GCs to the EH.The underlying reason for this is that the price of direct transactions has a greater advantage, and the PV and EH are more likely to choose to cooperate.

Fig. 5 Electricity trading
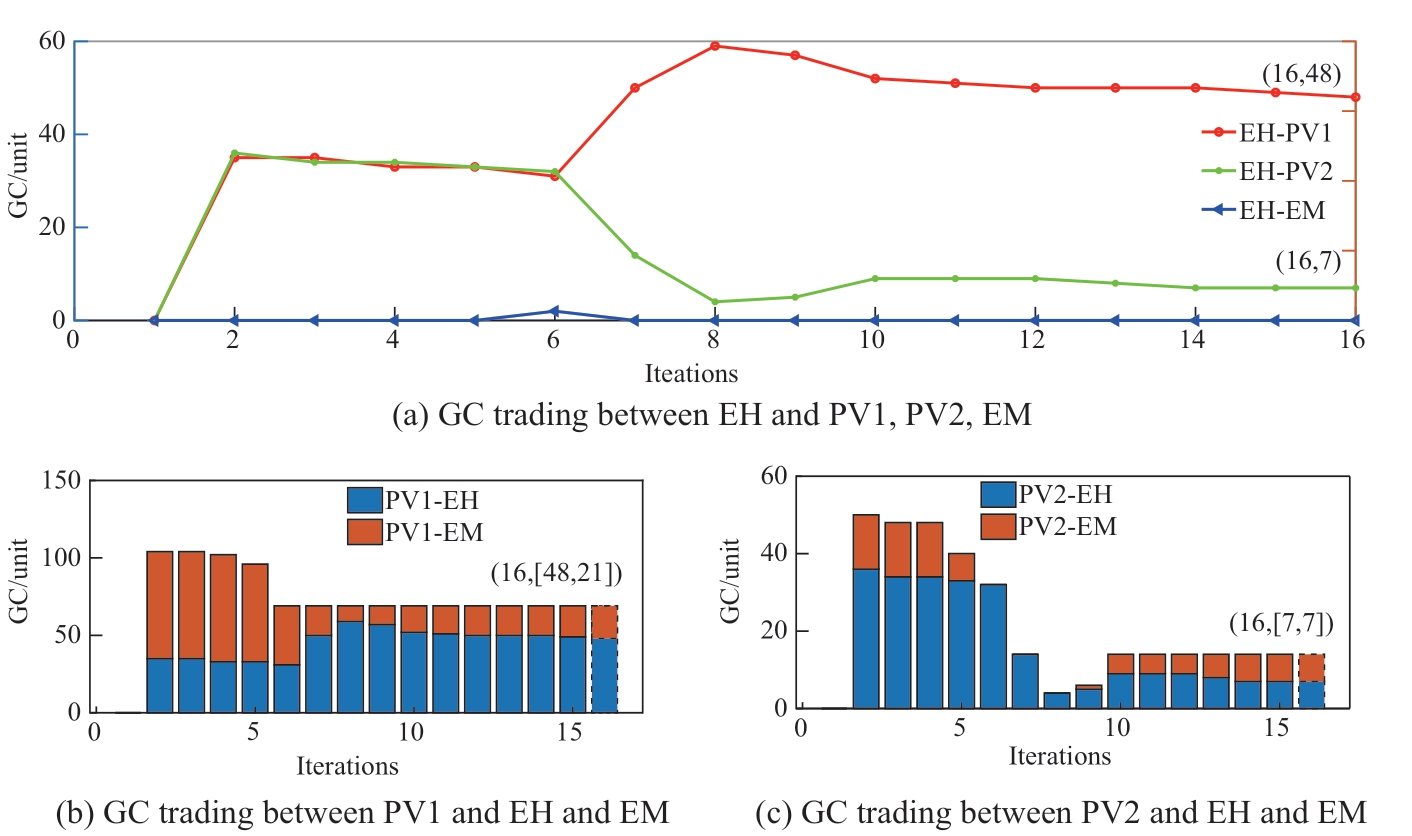
Fig. 6 GC trading
In combination with the analysis in Figs. 5–6, the EH’s electricity source is still mainly EM, although the EH has a renewable energy absorption task. The EH chooses to buy a large amount of GC from the PV system instead of electricity to satisfy the absorption task. GC trading affects green electricity trading. To address this phenomenon, we analyzed it from an economic perspective.
B. Transaction price analysis
Figs. 7–8 show the electricity and GC prices for direct trading among PV, EH, and EM. Under the constraint of(54), PV and EH seek the appropriate price for direct trading between the reference prices to maximize their respective trading benefits. For example, in Fig. 7, the electricity price of direct trading between the PV system and EH will find the optimal distribution between the FP and IP to optimize the PV-EH trading amount. In Fig. 8, the GC price for direct PV-EH trading reaches stability with continuous iterations.

Fig. 7 Electricity prices for direct trading
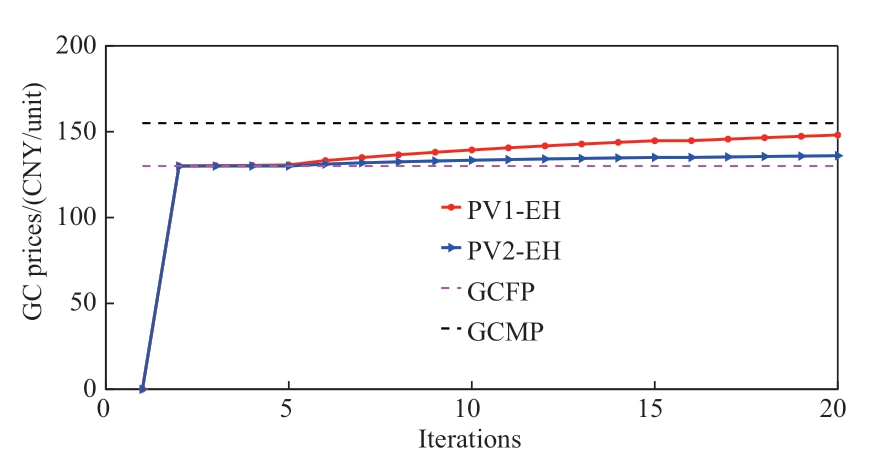
Fig. 8 GC prices for direct trading
Additionally, the average price of electricity directly traded between PV1 and EH was 0.807993 CNY/kWh,and the average price of electricity directly traded between PV2 and EH was 0.804241 CNY/kWh. The average GC prices of PV1, PV2, and EH were 148.0661 and 136.0327 CNY/unit, equivalent to 0.1480661 and 0.1360327 CNY/kWh, respectively. The EH will give priority to purchasing the GC to cover the renewable energy absorption task, and the remaining task will be considered to purchase green power to cover. Combined with the analysis of trading energy in the previous section, the EH prefers to trade the GC with the PV,which helps reduce costs. Meanwhile, the average price of electricity trading between PV2 and EH is lower than the average price of electricity trading between PV1 and EH. Therefore, EH purchases more electricity from PV2,proving the results of electricity trading in Fig. 5.
Subsequently, the operational benefits were analyzed,and multiple scenarios were designed to compare the different effects of energy cooperation.
4.3 Operational benefit comparison
Fig. 9 shows the correlation curve of CVaR-gains,demonstrating how the PV balances gains and CVaR for different risk-aversion factors δnpv. In the figure, a negative CVaR value indicates that risk leads to losses, and a positive value indicates that risk leads to gains. As the risk-aversion factor decreases, the CVaR loss increases,and the CVaR gain decreases. The PV system must take higher risks to obtain higher gains. When δnpv=0.005, the PV system seeks to maximize returns and ignores risks.When δnpv=50, the PV system chooses to minimize risks and sacrifice returns.
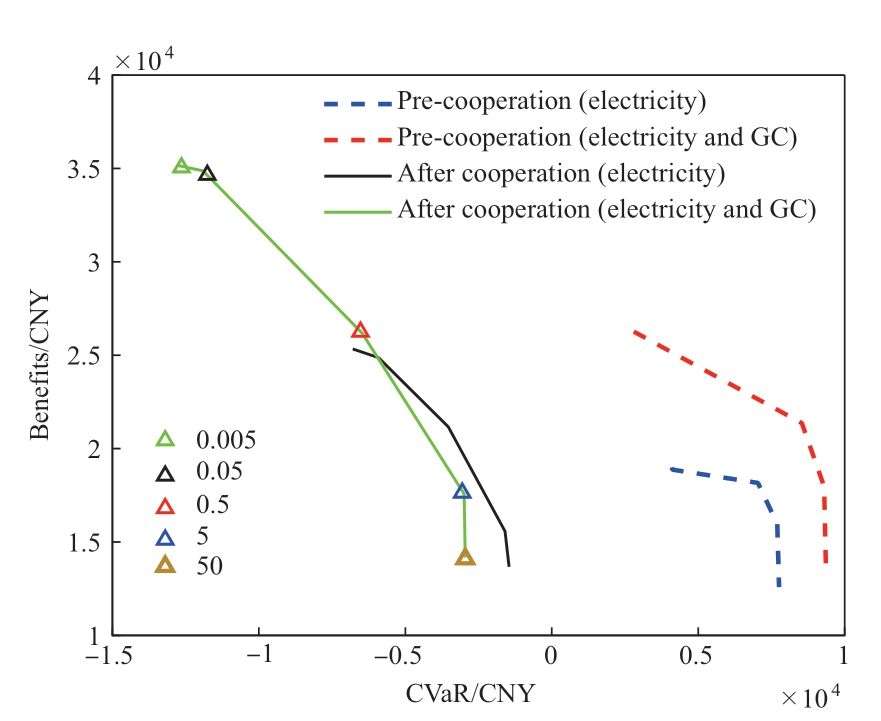
Fig. 9 Correlation curve of CVaR-gains
The slope of the CVaR-gains correlation curve is calculated, and the interval with an absolute value greater than 1 is called the “excess profit” interval, as shown in Table 2. Excess profit is defined as the gain when the increase in benefits exceeds the loss in CVaR as the riskaversion factor decreases. It was found that PV needs tomake a reasonable choice between revenue and CVaR to obtain “excess profit.” Both too-large and too-small riskaversion factors will affect the pursuit of “excess profit.” Too-small δnpv will lead to an increase in CVaR loss without a significant increase in revenue, and there is no “excess profit” to pursue. However, too-large δnpv will protect CVaR losses but will lead to a significant discount in earnings. At this time, there is an “excess profit,” but risk management limits the entity to pursue “excess profit.”
Table 2 Statistics of the slope of the correlation curve of CVaR-revenue

Note: Bolded indicates the “excess profit” range.
The participation of a PV in a partnership also affects its decisions and revenue. By comparing the dashed and solid lines in Fig. 9, in the cooperative model, the PV’s revenue and CVaR fluctuate more, and the scope for “excess profit” is greater. This is because more energy is exchanged between the PV and EH in the cooperative model. Thus, the cooperative model can accept a greater range of risks. This result supports the idea that benefits are positively correlated with risk.
Furthermore, we compared the cooperative model with and without GC transactions. A comparison of the orange and black lines in Fig. 9 shows that cooperation involving GC trading leads to a greater range of acceptable risk for PV, while exhibiting greater volatility. Therefore, the additional revenue from the GC will drive interested parties to ignore any operational risk.
Table 3 compares the returns of each entity with different risk-aversion factors. The benefit of PV1 (δ = 0.005,including GC) after cooperation improves from 27,964.65 to 35,170.21 CNY, which is a 25.77% improvement ratio.As the δ value increases from 0.005 to 50, PV1 pays increasing attention to risk control, and its return keeps decreasing, while the percentage of return improvement after cooperation decreases to 4.3%. Furthermore, PV improves its risk resistance after cooperation, which makes it more inclined to ignore risk and pursue excess profit in the cooperation model. Notably, when comparing EH(δ = 0.005), the EH cost under the scenario involving GC transactions increases because, under the renewable energy absorption task, GC only acts as a renewable energy absorption voucher but fails to reduce the energy use cost for the responsible entity.
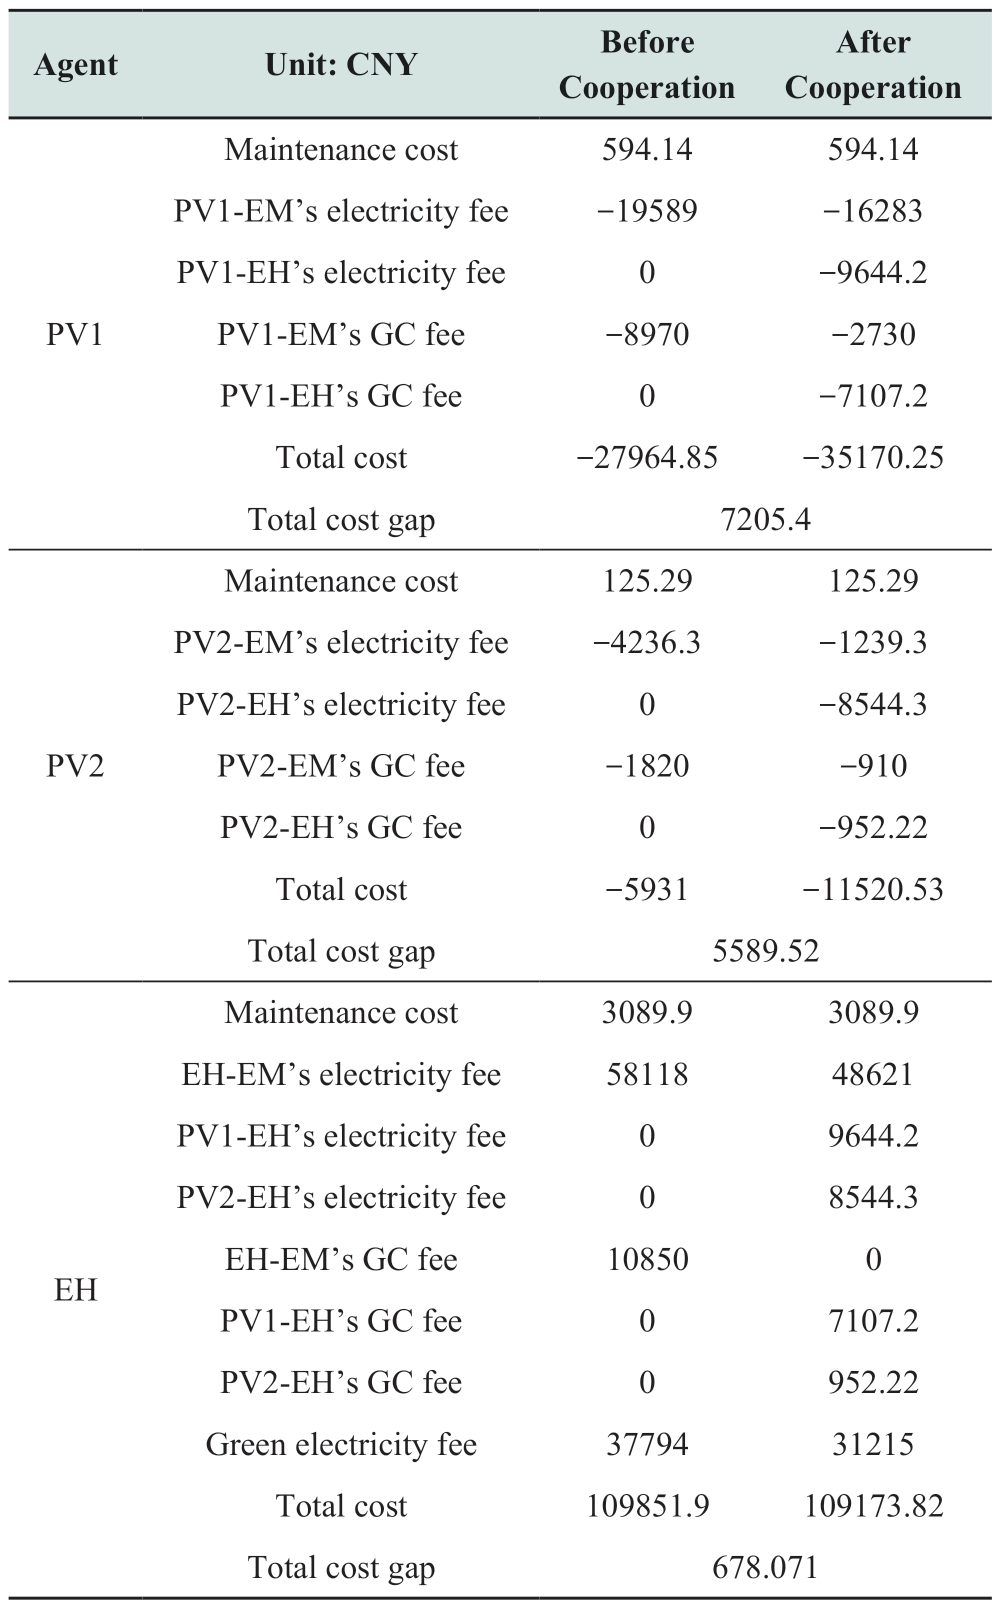
The breakdown of the benefits for each entity before and after cooperation at δ = 0.005 is presented in Table 4.
Table 4 lists the benefits for each entity before and after cooperation. Positive values in the table indicate costs and negative values indicate gains. After cooperation, the benefits of PV1 and PV2 are improved by 7205.4 and 5589.5292 CHY, respectively, while the cost of EH is decreased by 678.0708 CHY. This indicates that individual benefits are significantly improved through the tripartite cooperative operation.
Table 3 Profit comparison before and after cooperation
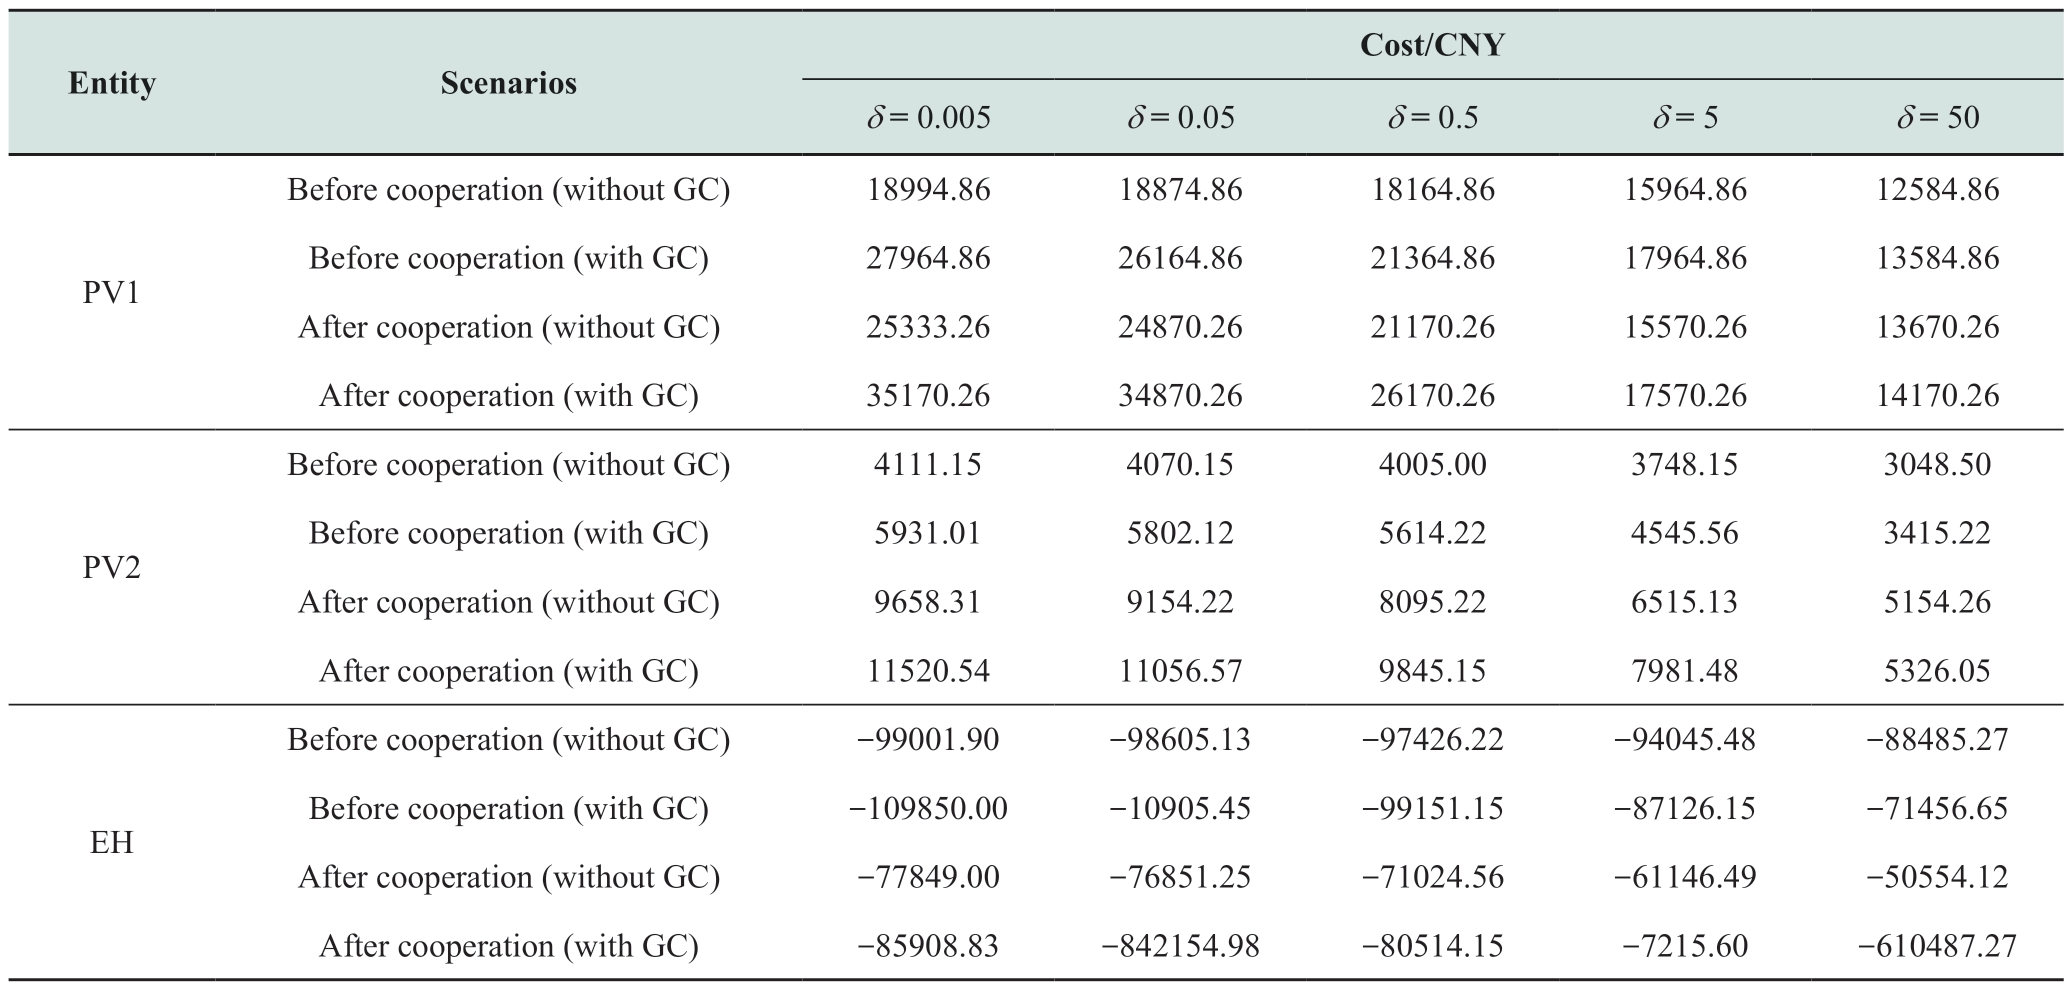
Table 4 Agent’s benefits before and after the cooperation
4.4 Influence of base price on the cooperative operation
The effect of FP on PV-EH cooperation was also explored. Scenarios 1–3 were designed to compare the impact of different FPs on PV-EH cooperation, as shown in Table 5. Scenario 1 was the basic scenario used in this study,Scenario 2 was the FP in 2021, and Scenario 3 was the FP in 2022, which were predicted based on the FP of the last two years. Comparing the three scenarios demonstrates that the benefit to each entity is substantially improved through cooperation. In the three scenarios, the benefit of PV1 increased by 25.77%, 29.63%, and 31.30%, respectively, the benefit of PV2 increased by 94.24%, 97.28%, and 98.92%,respectively, and the cost of EH decreased by 0.62%, 3.94%,and 4.17%, respectively.
Similarly, scenarios 4–6 were designed to compare the effects of different GCFPs on PV-EH cooperation, as shown in Table 6. By comparing the above scenarios, a general conclusion can be drawn as follows. With a reduction in various types of base prices, 1) the benefit of each entity is affected and tends to decrease, regardless of cooperation.2) Through cooperation, the degree of benefit enhancement or cost reduction for each entity tends to gradually increase.This further indicates that the benefits of each entity can be enhanced through cooperation. 3) Under cooperation, the lower the base price of each type, the higher the proportion of increase in the benefits of each entity and the more apparent the effect of enhancing the respective benefits through cooperation.
Table 5 Impact of FP on collaboration

Table 6 Impact of GCFP on collaboration

5 Conclusions
In this paper, a PV-EH cooperation model with GC trading is proposed. The following main conclusions are drawn:
1) GC can bring additional benefits to each entity, but under the renewable energy absorption task, GC only acts as a renewable energy absorption voucher and fails to reduce the energy cost for the task entity.
2) The cooperative model can improve the benefits of each entity, and with the reduction of the base price, the operating benefits of each entity show an increasing trend.The lower the base price is, the higher the proportion of revenue enhancement of each entity is, and the more obvious the effect of enhancing the respective operating efficiency through cooperation. Therefore, the reduction of the base price will promote each operating entity to seek third-party cooperation in order to improve the operating benefits.
3) The entities have to take higher risks in order to obtain higher excess benefits, and the additional benefits brought by GC drive the entities to pursue excess benefits at the expense of ignoring operational risks.
In the future, the proposed framework will be further applied to larger case systems.
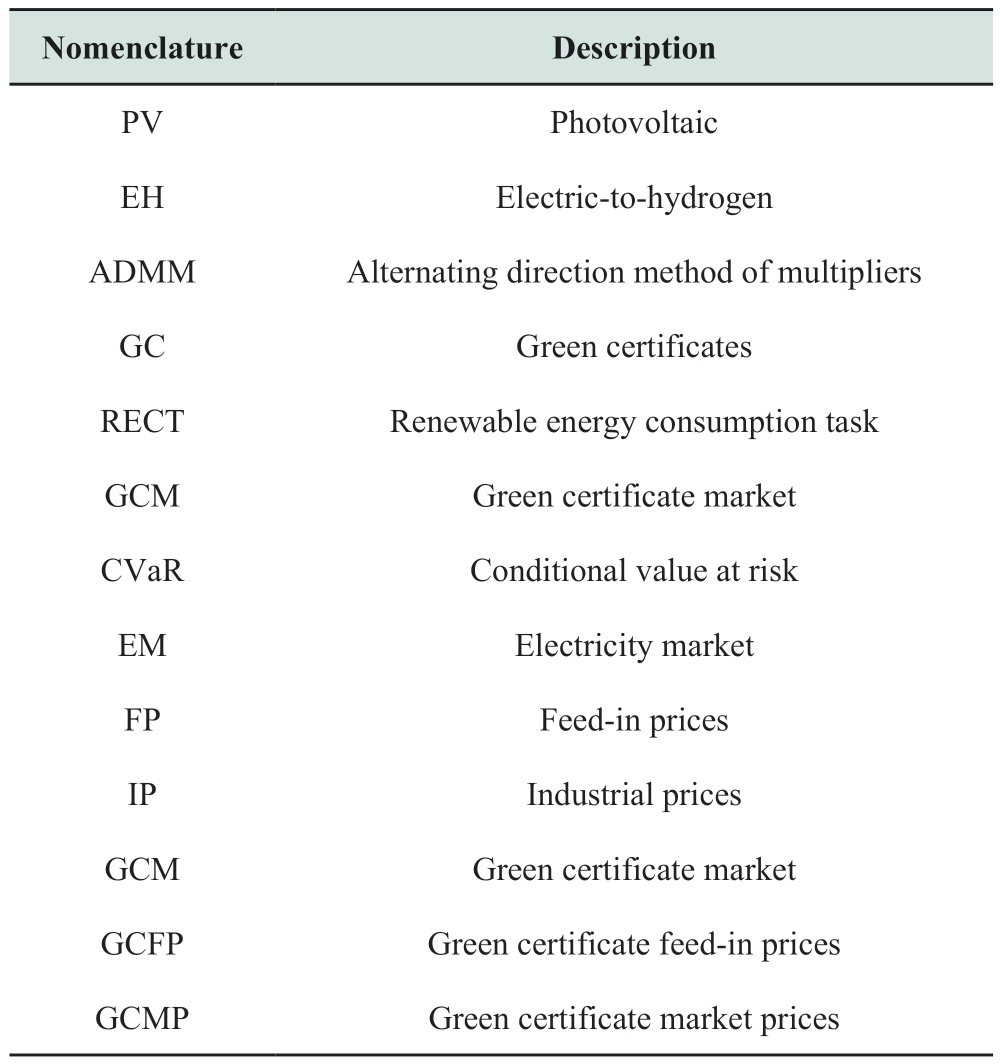
Nomenclature
Acknowledgements
This work was supported in part by the National Natural Science Foundation of China (No. 5197707).
Declaration of Competing Interest
We declare that we have no conflict of interest.
References
[1] Han S, Wu W, Guo X, et al. (2019) Practices and enlightenment of domestic and foreign demand response in electricity market.Proceedings of 2019 5th International Conference on Advances in Energy Resources and Environment Engineering (ICAESEE 2019), 3: 61-71
[2] Parandeh K, Bagheri A, Jadid S (2023) Optimal day-ahead dynamic pricing of grid-connected residential renewable energy resources under different metering mechanisms. Journal of Modern Power Systems and Clean Energy, 11(1): 11
[3] Mazzeo D, Herdem M S, Matera N, et al. (2022) Green hydrogen production: Analysis for different single or combined large-scale photovoltaic and wind renewable systems. Renewable Energy,200: 360-378, doi:10.1016/J.RENENE.2022.09.057
[4] Boretti A (2021) The hydrogen economy is complementary and synergetic to the electric economy. International Journal of Hydrogen Energy, 46(78): 38959-38963
[5] Zhou J, Ji W, Cao X, et al. (2023) A current perspective on the renewable energy hydrogen production process. Journal of Thermal Science, 32(2): 542-596
[6] Wang J, Mao J, Hao R, et al. (2022) Multi-energy coupling analysis and optimal scheduling of regional integrated energy system. Energy, 254(C): 124482
[7] Yao F, Yang X, Ge L, et al. (2022) Research on capacity optimization allocation of wind-light-hydrogen energy system.Integrated Smart Energy, 5: 56-63
[8] Jia L, Jin L, Song Y, et al. (2018) Operation optimization of power to hydrogen and heat (P2HH) in a coordinated with the district heating network. IEEE Transactions on Sustainable Energy, 10(4): 1672-1683
[9] Cheng D (2016) Review of fundamentals of engineering game theory and applications to power systems. Control Theory and Applications, 33(11): 1491
[10] Xu N, Zhou B, Nie J, et al. (2021) Research on the coordinated optimization operation method of park comprehensive energy system based on master-slave game. E3S Web of Conferences,245: 01044
[11] Wei B, Sui L, Xiang N, et al. (2018) A new operation model of hydrogen production unit and its dispatching strategy under grid multi-body scenario. Chinese Journal of Electrical Engineering(11), 3214-3225
[12] Duan J, Xie J, Xing S, et al. (2011) Gain allocation strategy of cooperative game for wind-light-hydrogen multi-energy system with run-of-river hydropower. Power Automation Equipment (2).doi:10.16081/j.epae.202302018
[13] Kenneth E F, James D L, Richard J M (1977) Game-theoretic analyses of coalition behavior. Theory and Decision. 8: 127-157
[14] Kim H, Lee J, Bahrami S, et al. (2019) Direct energy trading of microgrids in distribution energy market. IEEE Transactions on Power Systems, 35(1): 639-651
[15] Li J, Zhang C, Xu Z, et al. (2018) Distributed transactive energy trading framework in distribution networks. IEEE Transactions on Power Systems, 33(6): 7215-7227
[16] Rui T, Li G, Wang Q, et al. (2019) Nash bargaining method for multi-microgrid energy trading in distribution network. Power System Technology, 43(7): 2576-2583
[17] Wu X, Li H, Wang X, et al. (2020) Cooperative operation for wind turbines and hydrogen fueling stations with on-site hydrogen production. IEEE Transactions on Sustainable Energy,11(4): 2775-2789
[18] Wu M, Kou L, Zhang J, et al. (2019) A day-ahead nash bargaining method for economic dispatch of the multi-operator micro-grid. Electric Power, 52(11): 19-27
[19] Chen J (2020) Distributed multi-scenario optimal sizing of integrated electricity and gas system based on ADMM.International Journal of Electrical Power & Energy Systems, 117:105675
[20] Lin W, Jin X, Jia H, et al. (2021) Decentralized optimal scheduling for integrated community energy system via consensus-based alternating direction method of multipliers.Applied Energy, 302(15): 117448
[21] National Energy Administration (2018) Renewable energy electricity quota and assessment measures (draft for comments).http://zfxxgk.nea.gov.cn/auto87/201803/t20180323_3131.htm
[22] Zheng J, Wang J, Yu L (2022) How to improve the effectiveness of Chinese green certificate market? A complex network and social influence analysis. Journal of Cleaner Production, 380(1):134943, doi:10.1016/J.JCLEPRO.2022.134943
[23] Zeng L, Wang J, Zhao L (2022) An inter-provincial tradable green certificate futures trading model under renewable portfolio standard policy. Energy, 257: 124772, doi:10.1016/J.ENERGY.2022.124772
[24] Wang L, Wang Z, Li Z, et al. (2023) Distributed optimization for network-constrained peer-to-peer energy trading among multiple microgrids under uncertainty. International Journal of Electrical Power & Energy Systems, 149: 109065
[25] Li Z, Wu L, Xu Y, et al. (2023) Distributed tri-layer risk-averse stochastic game approach for energy trading among multi-energy microgrids. Applied Energy, 331: 120282
[26] Wei W (2022) Application of name="ref27" style="font-size: 1em; text-align: justify; text-indent: 2em; line-height: 1.8em; margin: 0.5em 0em;">[27] Li X, Liu Y, Guo L, et al. (2023) name="ref28" style="font-size: 1em; text-align: justify; text-indent: 2em; line-height: 1.8em; margin: 0.5em 0em;">[28] Wang L, Yao D (2023) Production planning with risk hedging under a conditional value at risk objective. Operations Research.doi:10.1287/OPRE.2022.2423
[29] Chen R (2022) Load restoration flexible optimization in wind Power integrated system based on conditional value at risk.Electronics 12(1): 178, doi:10.3390/ELECTRONICS12010178
[30] He S, Gao H, Chen Z, et al. (2023) name="ref31" style="font-size: 1em; text-align: justify; text-indent: 2em; line-height: 1.8em; margin: 0.5em 0em;">[31] Li G, Li Q, Liu Y, et al. (2022) A cooperative stackelberg game based energy management considering price discrimination and risk assessment. International Journal of Electrical Power &Energy Systems, 135(7), 107461
[32] National Development and Reform Commission (2017) Notice of the national energy administration on the launch of the distributed generation market trading pilot
[33] Zhang Y (2020) Notice on establishing a sound guarantee mechanism for renewable energy power consumption. Southern Energy Construction, 7(3): 1
[34] Karaki S H, Chedid R B, Ramadan R (1999) Probabilistic performance assessment of autonomous solar-wind energy conversion systems. IEEE Transactions on Energy Conversion,14(3): 766-772
[35] Economic Information. In 2020, the new policy of photovoltaic electricity price will be implemented, and distributed subsidies will be reduced by more than 50%. Beijing: National Energy Administration, http://www.nea.gov.cn/2020-04/08/c_138956556.htm
[36] Beijing Municipal Development and Reform Commission(2017) Notice on matters related to the rational adjustment of the electricity price structure. http://www. beijingprice.cn/c/2017-07-26/495565.shtml
Received: 2 May 2023/ Accepted: 17 July 2023/ Published: 25 August 2023
 Haobo Rong
w71909012@163.com
Honghai Kuang
wjh719090@163.com
2096-5117/© 2023 Global Energy Interconnection Development and Cooperation Organization. Production and hosting by Elsevier B.V. on behalf of KeAi Communications Co., Ltd. This is an open access article under the CC BY-NC-ND license (http: //creativecommons.org/licenses/by-nc-nd/4.0/ ).
Biographies

Haobo Rong earned his M.E. in Electrical Engineering from Hunan University of Technology in 2019. Currently, He is working as a lecturer at Nanjing Vocational and Technical College in Nanjing, China. His research interests include active distribution planning and operation.

Honghai Kuang obtained her M.S. in Power electronics and power transmission from South China University of Technology,Guangzhou, China, in 2005, and her PhD in Power electronics and power transmission from Hunan University, Changsha, China, in 2013. Professor in the School of Electrical and Electronic Engineering at Hunan University of Technology. Her research interests include intelligent planning of power systems, risk assessment, power communication systems.
(Editor Yajun Zou)
