0 Introductio n
With the reformation of modern energy systems and the continuous promotion of energy conservation, efficient and low-carbon operations have become the primary objective of integrated energy systems (IESs). An IES can complement the characteristics of different energy sources and realize the cascade utilization of energy [1]. An IES is beneficial for improving the utilization rate of renewable energy. Combined heat and power (CHP) units are widely used in IES. A CHP unit provides thermal energy to the IES. However, the heat-to-electricity operating mode of the CHP unit reduces the peak-shaving capability of the system and limits renewable energy generation [2]. Therefore,breaking the heat into the electricity mode of CHP units and improving the utilization rate of renewable energy have become the primary problems in the optimal scheduling of IESs [3]. Carbon capture system (CCS) and power-to-gas(P2G) equipment are important for electrical grids to reduce emissions from the source in a quick, efficient, and largescale manner. The CCS can capture the CO2 generated by the CHP units and convert it through P2G equipment, an improvement over the conventional heat-to-electricity mode of CHP units. With the connection between electrical and natural gas systems, P2G equipment is widely used to cut peaks, fill valleys, and reduce the penalty cost related to wind abandonment. Therefore, considering the combined effect of CCS and P2G equipment has become essential in the optimal scheduling of IESs.
Recently, numerous studies on the low-carbon optimal scheduling of IESs have been conducted from the perspective of optimal scheduling models and optimization algorithms. Studies on optimal scheduling have mainly considered multi-time scale, multi-network coupled operation, P2G equipment, and carbon trading models.Optimization algorithms used to solve the model include the particle swarm optimization algorithm, bee colony algorithm, distributed consistency algorithm, Bayesian algorithm, and other intelligent optimization algorithms.Game theory in operations research, as a new branch of modern mathematics, has a wide range of applications in finance, biology, economics, political science, and electrical engineering. The application of game theory to the optimal scheduling of IESs has become a research hotspot. Based on a cooperative game theory, a unified game model for IES was developed by encouraging different players to participate in the overall cooperative optimization operation of the system [4]. This study developed a profit distribution model to improve Shapley’s value. However, the influence of network distribution and energy transmission loss on the distribution of system benefits should be considered in the model. In [5], a cooperative game model of an IES,hydrogen, and natural gas hybrid energy storage (IESHGESS) was established considering carbon neutrality.The cooperative benefit coefficient was introduced to realize a rational design of the income strategy of the IESHGESS. However, the established model did not consider the influence of Time-of-use (TOU) price on the interests of the main IES players. An IES day-ahead optimal scheduling model considering an integrated demand response and cooperative game was established in [6]. The energy-trading mechanism between multiple IESs was processed using the cooperative game theory and solved using the Nash bargaining method to obtain a Paretooptimal energy-trading strategy. However, incentives for energy markets were not included. For an IES containing multiple communities, the authors in [7] proposed a hierarchical and zone-based optimization model of a distributed IES based on the master-slave game. City managers and community operators were considered as leaders and followers of the game, respectively, to reconcile their interests and further realize an economic,flexible, and efficient operation of the IES.
Numerous algorithms for the optimal scheduling of IES have been proposed. In [8], a hierarchical operational strategy for a distributed IES was proposed based on the master-slave game theory. In the K-means clustering algorithm, the Wasserstein distance with a gradient penalty was used to generate renewable scenarios, and the maximum profit of the IES was pursued by setting the energy prices. However, the real-time pricing mechanism of the IES has yet to be analyzed. A single-master and multi-slave game model considering an integrated demand response was proposed [9]. An improved differential evolution algorithm was used to update the price strategy of the upper layer, and a multiplex solver was combined to solve the optimization problem of the lower layer. The operational strategy with the participation of different users was analyzed to improve energy efficiency. However,the game between additional types of load aggregators and multiple integrated energy service providers was not considered. A two-stage IES energy management method considering Stackelberg game-based dynamic pricing and operational strategy optimization was constructed in [10].The NSGA-II algorithm was used to solve an optimization problem with the dual objectives of economy and energy efficiency and to improve the energy efficiency and operation economy of the system. However, the influence of energy on cooperative operation during the peak-valley period was not considered. None of the above algorithms considered the low-carbon operation of IESS.
To achieve low carbon emissions and improve the energy utilization efficiency of the system, a bilayer lowcarbon model of the IES based on the master-slave game was constructed. First, a standard carbon optimization model of the IES with CHP-CCS-P2G joint operation was established by introducing P2G and CCS to reduce the carbon emissions of the CHP units. Subsequently, based on the Stackelberg master-slave game theory, an IES bilayer optimization model was constructed, with sellers as the players in the upper-layer optimization model and energy producers, energy storage companies, and load aggregators as players in the lower-layer optimization model. The cost associated with carbon emission trading in the ladder-type carbon emission trading analysis system was introduced into the lower objective function to build a bilayer optimization model of the IES based on the Stackelberg master-slave game. The bilayer model was converted into a single-layer model using Karush-Kuhn-Tucker (KKT) conditions, and the master-slave game model was solved using the CPLEX solver. We analyzed the impact of the CHP-CCS-P2G joint operation on the interests of various parties in the IES game and the impact of different growth rates and carbon trading prices on the operational strategy of the system. Finally,the effectiveness of the proposed model in improving the energy efficiency and reducing carbon emissions of the system was demonstrated through examples.
The main contributions of this paper are summarized as follows:
1) An IES optimization model for the combined operation of CHP-CCS-P2G was proposed, and the carbon emission characteristics of the CHP units, CCS, and P2G were analyzed. Compared with an IES operated separately by CHP units, CCS, and P2G, the proposed model can effectively reduce the carbon emissions of the system.
2) A structure for the CHP-CCS-P2G joint operation was constructed using the bilayer optimization model based on the Stackelberg master-slave game theory to maximize the interests of each subject.
3) The convergence speed of the IES optimization model was improved using a combination of game theory and a mathematical program solver.
4) The effectiveness of the optimization strategy was verified in a test system, with the strategy exhibiting several advantages.
The remainder of this paper is organized as follows.In Section 1, we establish an IES that considers the joint operation of CHP-CCS-P2G, and the carbon emission characteristics of CHP, CCS, and P2G. In Section 2, we analyze the IES bilayer structure based on the Stackelberg master-slave game. Section 3 presents an IES bilayer low-carbon optimization model based on the Stackelberg master-slave game. Section 4 presents the solution to the IES bilayer carbon optimization problem based on the Stackelberg master-slave game. In Section 5, the superiority of the proposed strategy is verified using an example.Finally, in Section 6, we provide conclusions.
1 Integrated Energy System Analysis of CHP-CCS-P2G Joint Operation
To establish an electric-thermal-gas IES considering cogeneration with P2G and CCS, the P2G capture system included a heat exchanger with temperature control and a pressure vessel with a vacuum chamber. The CCS captures the CO2 generated by the CHP unit and converts it into natural gas for use in the gas turbine through the P2G equipment, thus improving the power regulation ability of the CHP, reducing the electrical-thermal coupling characteristics, and reducing CO2 emissions. Figure 1 shows the operational mode of the CHP-CCS-P2G combined electric-thermal-gas IES, which include wind turbines(WTs), photovoltaics (PVs), electrical storage (EES)systems, heat storage (HS) systems, gas turbines (GT),electrical loads (ELs), heat loads (HLs), and gas loads (GLs).
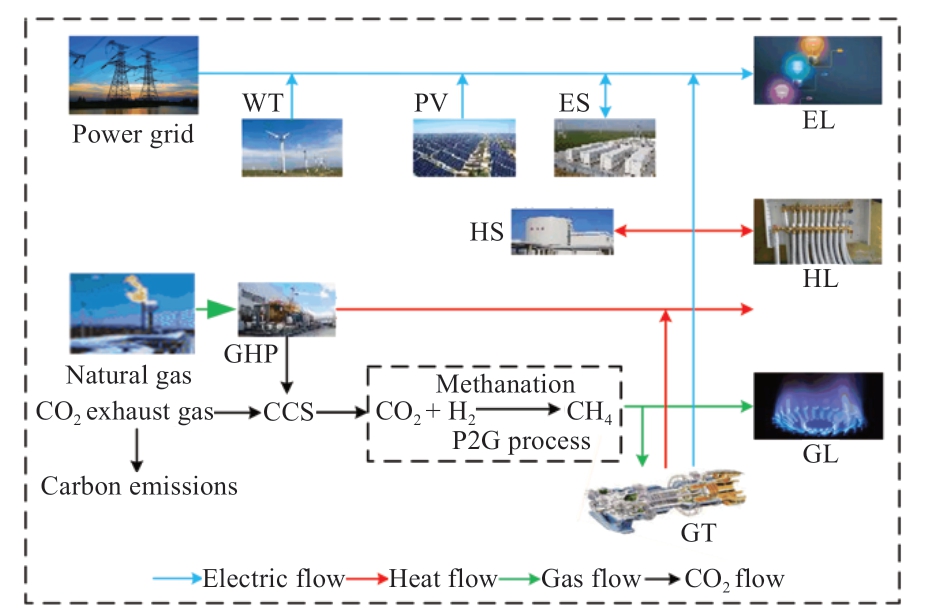
Fig. 1 Structural diagram of IES considering the dynamic characteristics of the heat network, which consists of wind turbine (WT), photovoltaic (PV), electrical storage (ES)systems, heat storage (HS) systems, gas turbines (GT),electrical load (EL), heat load (HL), and gas load (GL)
The CHP, P2G, and CCS units are aggregated into a CHP-CCS-P2G system through the joint operation of the CHP, P2G, and CCS. CO2 is generated by the CHP units,which are collected by a CCS device and converted into natural gas by the P2G system. The P2G and CCS units help reduce the purchase cost of gas turbines and the storage cost of CO2, achieving peak-shaving and valley-filling.
The electric power PCHP generated by the CHP unit can be divided into three parts: the CHP unit provided by the superior electricity network, the P2G equipment, and the CCS, as expressed in (1).
where Pgrid, PP2G, and PCCS are the powers inputted to the electricity network, P2G equipment, and CCS, respectively,by the CHP unit.
The thermoelectric coupling characteristics of the CHP units are expressed in (2).

where β1, χ, and β2 are the thermoelectric conversion coefficients of the CHP unit; β1 and χ are the thermoelectric conversion coefficients when the CHP unit outputs the minimum and maximum electrical power, respectively;β2 is the linear supply slope between the thermal and electrical energies generated by the CHP unit; QCHP is the thermal power of the CHP unit;  and
and  are the upper and lower limits of the electric power of the CHP unit,respectively; Q0 is the thermal power output corresponding to the minimum electrical power of the CHP unit.
The carbon emission  model of the CHP is expressed in (3).
Here, a1, a2, and aCO2 are the carbon emission coefficients of the CHP unit.
The P2G equipment converts the CO2 captured by the CCS device into natural gas and supplies it to gas loads and gas turbines, thereby improving the energy utilization efficiency. It is a coupled device used in electricity and gas networks. The mathematical model for the carbon emissions of the P2G system is expressed in (4).
where δ is the coefficient for CO2 calculations.
The CCS is mainly used to capture CO2 and consumes electricity during operation. The mathematical model for the CCS carbon emissions  is expressed in (5).
where PCCS is the power consumption when the amount of CO2 is provided by the CCS device to the P2G device, and α is the conversion coefficient between the CCS power consumption and captured CO2.
2 Analysis of the Bilayer Structure of IES with CHP-CCS-P2G Joint Operation Based on Stackelberg Master-slave Game Theory
Based on the Stackelberg master-slave game theory, a bilayer optimization structure of the Stackelberg masterslave game between the seller, energy producer, energy storage service provider, and load aggregator of the IES in the CHP-CCS-P2G joint operation mode is constructed, as shown in Fig. 2.
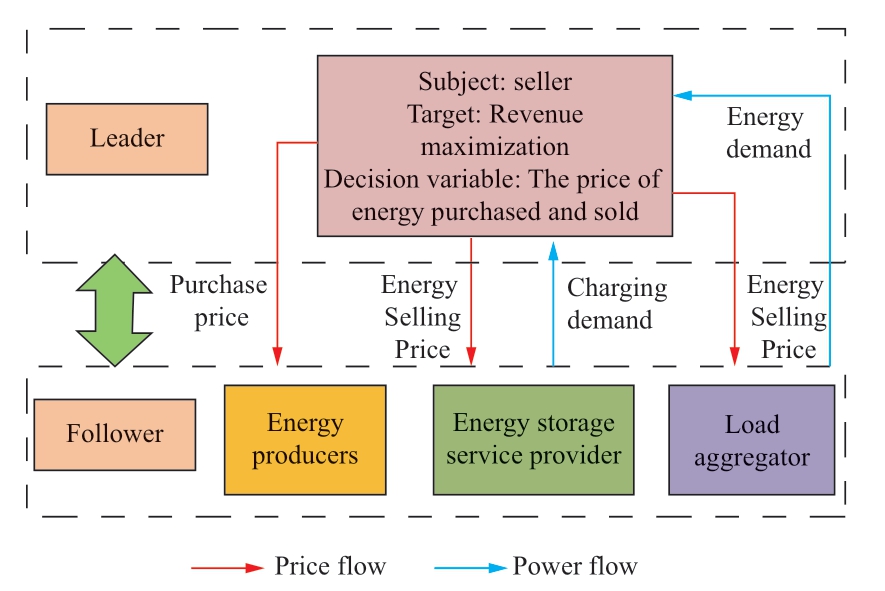
Fig. 2 Bilayer master–slave game structure diagram of IES based on CHP-CCS-P2G joint operation mode
In the IES bilayer game model of the CHP-CCS-P2G joint operation, for the sellers in the upper layer of the game, after the CHP-CCS-P2G joint operation equipment is connected, the sellers in the system optimize the allocation of supply for each load based on the quotation of each energy source. For lower-layer energy producers, energy storage service providers, and load aggregators, after the CHP-CCS-P2G joint operation equipment is connected,the CHP-CCS-P2G joint operation process can reduce the carbon emissions of the CHP units and emission trading cost in the IES. This reduces the operating cost of the system, realizing a low-carbon economic operation of the lower layer.
In the master-slave game considered in this study, the upper-layer entities are system sellers, whereas the lowerlayer entities are energy producers, energy storage service providers, and load aggregators. There is mutual influence between the upper and lower layers of the game. The seller in the upper layer of the game, as the leader, determines the energy price and sends electricity and heat prices to the energy producers, energy storage service providers, and load aggregators in the lower layer of the game. Energy producers adjust the output of various pieces of equipment under their control according to the energy price set by the seller to meet the actual energy demand. Sellers develop pricing strategies and energy storage service providers adjust their charging and discharging methods. The charging and discharging strategies of the energy storage service providers affect the energy pricing of the system vendors.When the system seller releases electricity and heat pricing strategies to the load aggregator, the load aggregator adjusts the actual energy demand of the user based on the energy prices. The load aggregator changes the energy consumption strategy of the user and provides feedback to the system seller. The seller then adjusts the energy price based on the energy consumption strategy, continuously coordinating the upper and lower layers to improve the interests of all parties.
3 IES Bilayer Low-carbon Optimization Model Based on Stackelberg Master-slave Game
3.1 Upper-layer optimal scheduling model
The seller dominates the upper-layer optimization model, and profits are obtained by determining the purchase and sale prices of energy considering the demand for electric heating supply. The objective function C1 of the upper layer model includes the selling cost Csell, purchasing cost Cbuy, and the penalty cost Cpenal of the seller’s energy supply interruption, as expressed in (6).
where

Here,  and
and  are the electric heating prices for the electricity and heat purchased by the seller, respectively; ρebuy and
  are the electric heating prices at which the seller sells electricity and heat energy, respectively; PES, PHS, PEU,and PHU represent the electrical and thermal energies sold by the seller to the energy storage service provider and the load aggregator, respectively; PEP, PHP, PEY, and PHY represent the electricity and thermal energy purchased by producers and energy storage service providers; Ph and ξh are the penalty prices associated with energy loss and interruption during energy supply.
The constraints of the upper-layer model are expressed in (8).

Here,  and
and  denote the time of electricity price and the electricity price of the electrical grid;
  and
and denote the upper and lower limits of the heat price,respectively.
3.2 Lower-layer optimal scheduling model
The lower-layer model included energy producers,storage service providers, and load aggregators as followers.After receiving the energy quotation from the system seller,the lower-layer subjects adjust their energy-use plans in a reasonable manner to maximize their interests. The lower objective function C2 primarily includes the benefit function C3 of the energy producer, which includes the revenue CEP obtained from the electric and thermal energy sold by the energy producer, operating cost COP, and carbon emission cost CCO2. The benefit function C4 of the energy storage service providers mainly includes the charge and discharge costs Cch and Cdis; the benefit function C5 of the load aggregators mainly includes the energy purchase cost CCU and benefit cost CEP, which can be written as (9).

where

Here, PPV and PWT are the abandoned energies of the PVs and wind turbines, respectively; PGT is the power of GT;ηGT is the conversion coefficient of GT; η1 is the heat loss coefficient; η2 is the heating coefficient of the bromine cooler; η3 is the recovery rate of the waste heat; a, b, and c are the cost coefficients of the CHP unit; CCHP is the operating cost of the CHP unit; κP 2G , κCCS, and κGT are the maintenance cost coefficients of P2G, CCS, and GT,respectively; κWT and κPV are the electricity abandonment cost coefficients of the wind turbine and PV, respectively;ve, ue, vh, and uh are the preference constants of the quadratic function; pe represents the electrical load demand; ph is the heat load demand.
This study used the carbon emission cost of a ladder-type carbon emission trading analysis system. The difference between the actual carbon emissions of the system and the initial carbon emission quota is divided into several intervals, and the magnitude of the difference between the actual carbon emissions of the system and the initial carbon emission quota, as well as the length of the divided interval carbon emissions, was analyzed. The excess or residual carbon emissions quota is purchased and sold through the carbon emission trading market at a stepped price, thereby reducing the carbon emissions of the system. The laddertype carbon emission trading cost model is expressed in Equation (11).

Here, Cc is the price of carbon emission trading, generally 0.256 yuan/kg; Cμ is the reward coefficient; Cβ is the growth rate of the ladder-type carbon emission trading, that is,the penalty coefficient, generally taken as 0.25; l is the carbon emission range, generally taken as 0.5;  is the actual carbon emissions of the system; ∆ECO2is the carbon emissions actually involved in the carbon emission trading market; Egrid, ECHP, and EGT represent the actual carbon emissions of the power grid, CHP units, and GT units,respectively.
The constraint for electric power balance is expressed in (14).

Here,  and
and  are the powers of the wind turbines and photovoltaic units, respectively; Pes,ch and Pes,dis respectively refer to the charging and discharging powers of the storage equipment, respectively; Pbuy and Psell represent the purchasing and selling powers of the system, respectively;and QEL is the electrical load of the system.
The thermal power balance constraint is expressed in (15).
where QCHP is the heating power of the CHP unit; QGT is the heating power of GT; Hes,ch and Hes,dis respectively are the charging and discharging powers of the heat storage equipment, respectively; QHL is the thermal load of the system; PIHP is the power exchanged between the system and the heating network.
The constraint for gas power balance is expressed in (16).
where Ggrid is the gas power purchased by the system, GP2G is the gas power converted via P2G; GCHP and GGT represent the gas powers consumed by the CHP unit and GT,respectively, and QGL is the gas load of the system.
The node voltage and pressure constraints are expressed in (17).

Here, ui is the node voltage, uimin and uimax represent the minimum and maximum values of the node voltage,respectively, yi is the node air pressure, and yimin and yimax are the minimum and maximum values of the node air pressure,respectively.
The constraints on the CHP-CCS-P2G system are given by (18).

Here,  and
and  are the upper and lower limits of the P2G output, respectively;
  and
and  are the minimum and maximum powers of the CCS device, respectively.The operating constraints of GT are expressed in (19).
where  and
and are the upper and lower limits of the GT output, respectively.
The constraint for the energy storage device is expressed in (20).

Here, Hes is the actual energy storage device,  and
and are the upper and lower limits of the energy storage device, respectively, and
  and
and  are the maximum charging and discharge powers of the energy storage device,respectively.
4 Model Solving
The Stackelberg master-slave game is a hierarchical game that reflects the sequence of decisions between various subjects. In the game process, the leader takes the lead in making decisions, and followers develop their operational strategies according to the decision information produced by the leader. In the IES constructed in this study, the system sellers, energy producers, energy storage service providers,and load aggregators are considered the subjects of independent interest. The sellers formulate a price strategy that maximizes their interests, and the energy producers,energy storage service providers, and load aggregators reasonably adjust the power of each unit according to the prices set by the sellers. The power information is transferred to the upper seller, and there is mutual influence between the upper and lower layers, which is in agreement with the Stackelberg master-slave game theory.
The IES master-slave game model established in this study primarily includes participants, strategy sets,and payment functions. The participants in the game are the seller E, energy producer S, energy storage service provider C, and load aggregator U. The game strategy set is the seller’s energy pricing![]() The output of the energy producer units in each period is expressed as L2 =(PM T,PCHP ). The charging and discharging power of the energy storage service providers in each period is represented by L3 =( PE Y,PHY ). The demand response of the load aggregator in each period is expressed as L4 =( Pt , Ph ). Here, Pt and Ph are the electrical and heat loads of the system, respectively. The payment function C ={C ESR,C EP,C EU,CESP } is the benefit cost for the four subjects, which can be calculated using Equations (7) and(10): Suppose the seller’s equilibrium strategy is L*1 and the optimal response strategy sets of the energy producers,energy storage service providers, and load aggregators are
The output of the energy producer units in each period is expressed as L2 =(PM T,PCHP ). The charging and discharging power of the energy storage service providers in each period is represented by L3 =( PE Y,PHY ). The demand response of the load aggregator in each period is expressed as L4 =( Pt , Ph ). Here, Pt and Ph are the electrical and heat loads of the system, respectively. The payment function C ={C ESR,C EP,C EU,CESP } is the benefit cost for the four subjects, which can be calculated using Equations (7) and(10): Suppose the seller’s equilibrium strategy is L*1 and the optimal response strategy sets of the energy producers,energy storage service providers, and load aggregators are![]() and L*4, respectively. If the optimal response of sellers,energy producers, energy storage service providers, and load aggregators satisfies (21),
and L*4, respectively. If the optimal response of sellers,energy producers, energy storage service providers, and load aggregators satisfies (21),

then the strategy set (L*1 , L*2 , L*3 , L*4) is the equilibrium solution of the IES when the interests of the players in the game are maximum. L*1( −i) is another strategy besides L1i.When the game reaches an equilibrium solution, no player can increase their profits by adjusting their own strategy sets.
The above scenario shows that the constraints of the strategy sets of the sellers, energy producers, energy storage service provider, and load aggregators satisfy (18)-(20). Hence, the strategy sets of the game are all bounded,nonempty, convex closed sets. Because the objective functions are continuous convex functions of each set of strategies, the master-slave Stackelberg game presented in this study has a unique solution at equilibrium.
To obtain the equilibrium solution of the IES, the KKT condition and linear relaxation technique in the convex optimization theory were used to transform the bilayer optimization model into a single-layer optimization model.First, the lower-layer nonlinear programming problem was t ransformed into a constraint problem between electricity and heat prices and the power of each unit using KKT conditions. The bilayer optimization model was transformed into a single-layer model by introducing the relaxation variablesµ1~ µ14and defining the lower-layer model Lagrangian function,as expressed in(22).

The specific solution process of the lower-layer model is shown in Appendix A.
Through the above process, the original nonconvex problem can be transformed into a convex problem and finally solved by calling the commercial solver complex.
Figure 3 shows the flowchart for solving IES.

Fig. 3 IES solution flowchart
5 Case Study
This study simulated an IES coupled with an IEEE 39-node electrical grid system, a six-node heat network system,and a six-node gas network system. The P2G equipment is connected to 32 nodes of the electrical grid and two nodes of the gas network, and the CCS is connected to 39 nodes of the electrical grid. Appendices B1, B2, and B3 present the values of the IES node parameters. The test system is described in Appendix C. Table 1 presents the operating parameters of the IES.
Table 1 Operation parameters of the equipment in IES

Figure 4 shows the forecast curves for the system load demand, wind power, and PV power generation.

Fig. 4 Power prediction curve
5.1 Stackelberg equilibrium analysis of masterslave game
Based on the Stackelberg master-slave game, three different scenarios were established to verify the superiority of the proposed IES optimal scheduling strategy. Scenario 1 involves an IES without any P2G devices or CCS. In Scenario 2 involves independent operations of the CHP unit, P2G equipment, and CCS unit in the IES. Scenario 3 involves the joint operation of the CHP, P2G, and CCS units. The optimized IES was obtained according to the three different scenarios, as shown in Table 2.
Table 2 IES operation results in different scenarios

As shown in Table 2, comparing Scenarios 1 and 3, we find that Scenario 3 considers P2G equipment and CCS to capture the CO2 generated by the CHP units; thus, CO2 emissions are reduced by 5.9% compared with Scenario 1.In Scenario 3, the P2G device performs electrical conversion on the wind power output, decreasing the phenomenon of wind and light abandonment and reducing the energy purchase and carbon emission costs of the system. Comparing Scenarios 2 and 3, the CHP-CCS-P2G combined operation mode in Scenario 3 helped reduce the transmission cost of CCS, carbon sequestration cost of the P2G equipment, the total operation cost, and carbon emissions of the IES.
Figure 5 shows the scenery output curves in the three different scenarios.
As shown in Fig. 5, the P2G equipment and CCS are introduced in the IES for joint operation with the CHP units.CCS provides the captured CO2 to the P2G equipment,which converts the CO2 into natural gas to ensure the energy efficiency of the system and overcome the limitation of the CHP heat-to-electricity model on the consumption rate of renewable energy units. During peak electricity prices, the output of the renewable energy increases, and the CHPCCS-P2G joint operation mode improves the utilization rate of the renewable energy.
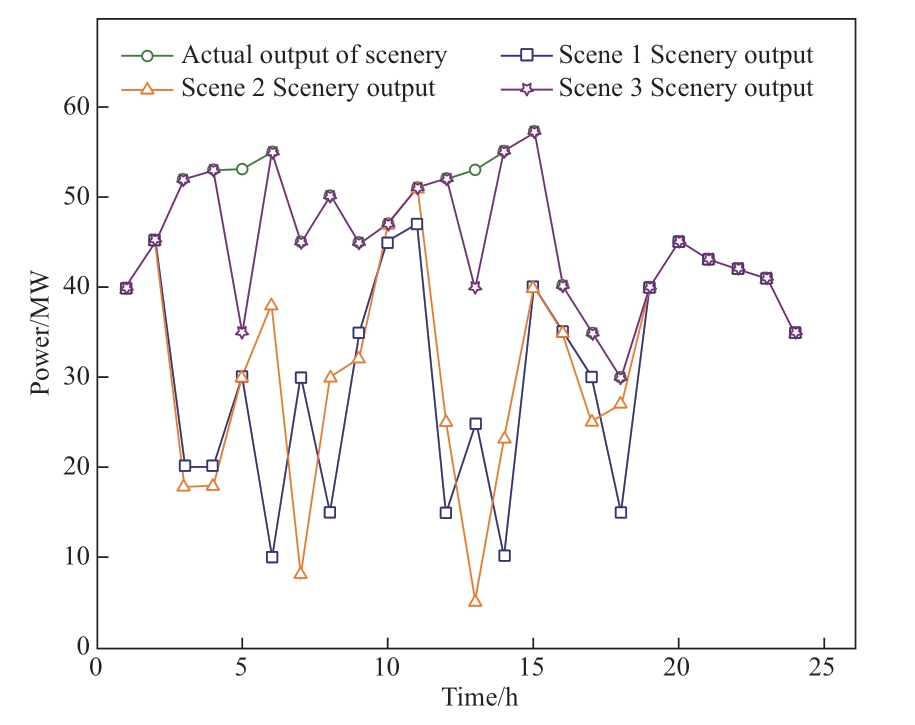
Fig. 5 Scenery output curves in three different scenarios
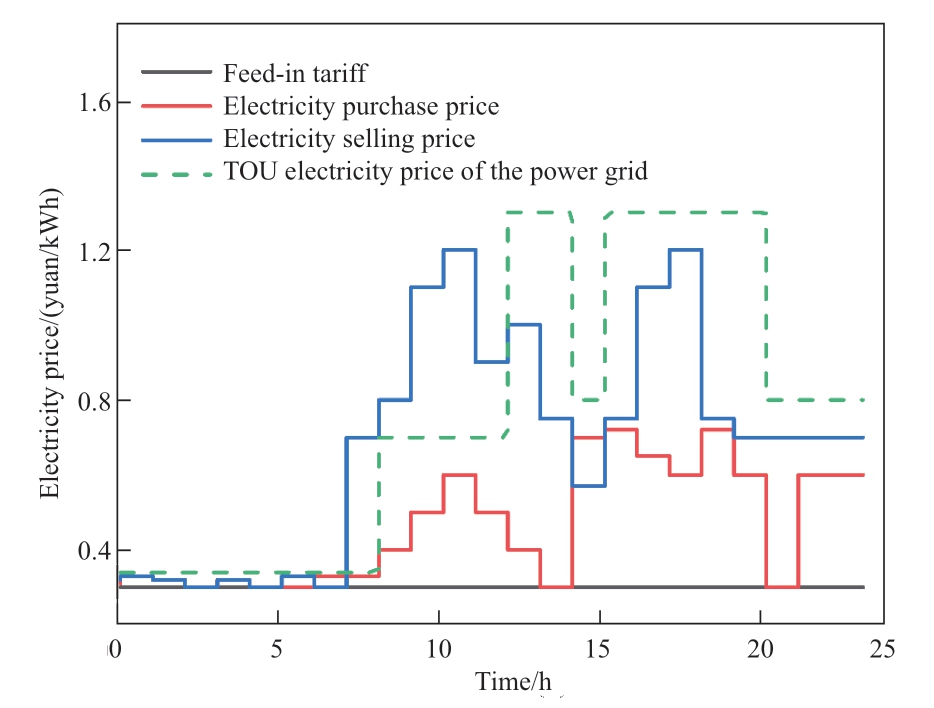
Fig. 6 Electricity price in the Stackelberg master-slave game
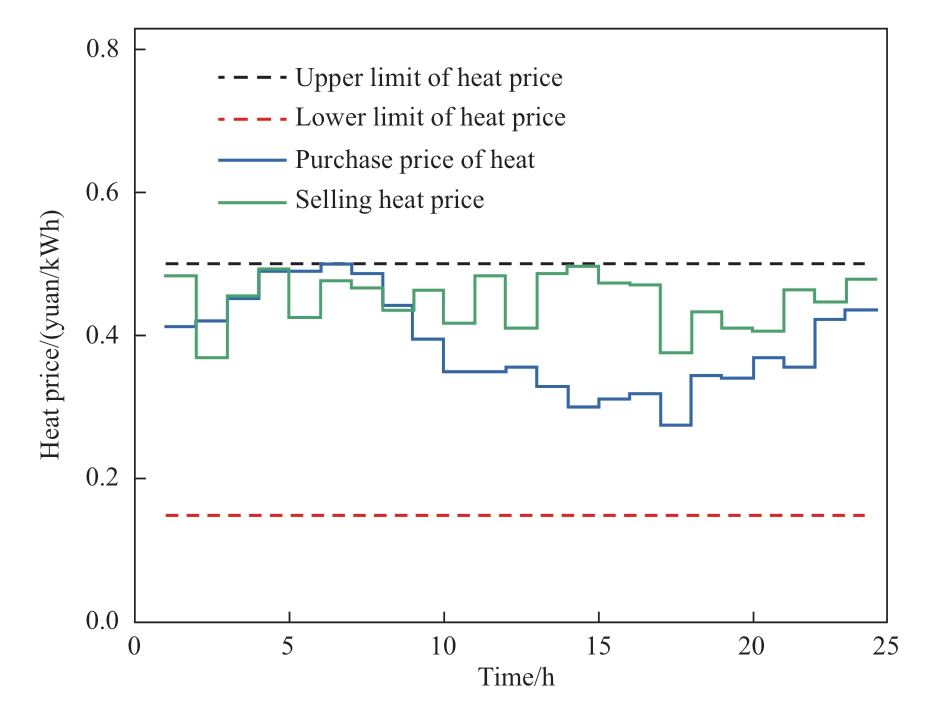
Fig. 7 Heat price in the Stackelberg master-slave game
5.2 Optimization analysis of the integrated energy system under Stackelberg master-slave game
The IES in Scenario 3 is optimized under the Stackelberg master-slave game balance. As the leader, the top seller sets the electricity and heat prices according to the TOU price.The lower-layer energy producers, storage providers, and load aggregators adjust the output of the system equipment according to the vendor’s pricing plan. The upper and lower layers determine the optimal pricing strategies. Figures 6 and 7 show the electricity and heat price optimization curves of the combined CHP-CCS-P2G system under the Stackelberg master-slave game, respectively.
As shown in Figs. 6 and 7, the game equilibrium solution is solved by considering the standard operation of the CHP-CCS-P2G mode according to the TOU electricity and heat prices. The sellers, as the upper leaders, set the electricity and heat prices. The three players in the lower layer develop their trading strategies according to the operating procedure of the pricing adjustment system of the seller. When the game reaches equilibrium, each player receives the highest returns. The optimization results are consistent with the leader’s advantage in making the first decision in the master-slave match. Simultaneously, the follower can choose his own optimal decision based on the leader’s optimal pricing decision.
Figure 8 shows the profits of each player in Scenario 3 under the Stackelberg master-slave game equilibrium.
As shown in Fig. 8, the game reaches equilibrium, and the seller’s aggregate interests exhibit an upward trend. The benefits to the service providers are at a steady layer. Energy producers and load aggregators saw their earnings decrease and then plateau. When the game reaches equilibrium under the price set by the upper leader, the subjects in the upper and lower layers cannot obtain higher returns by adjusting their strategies independently, and each subject reaches its optimal state.
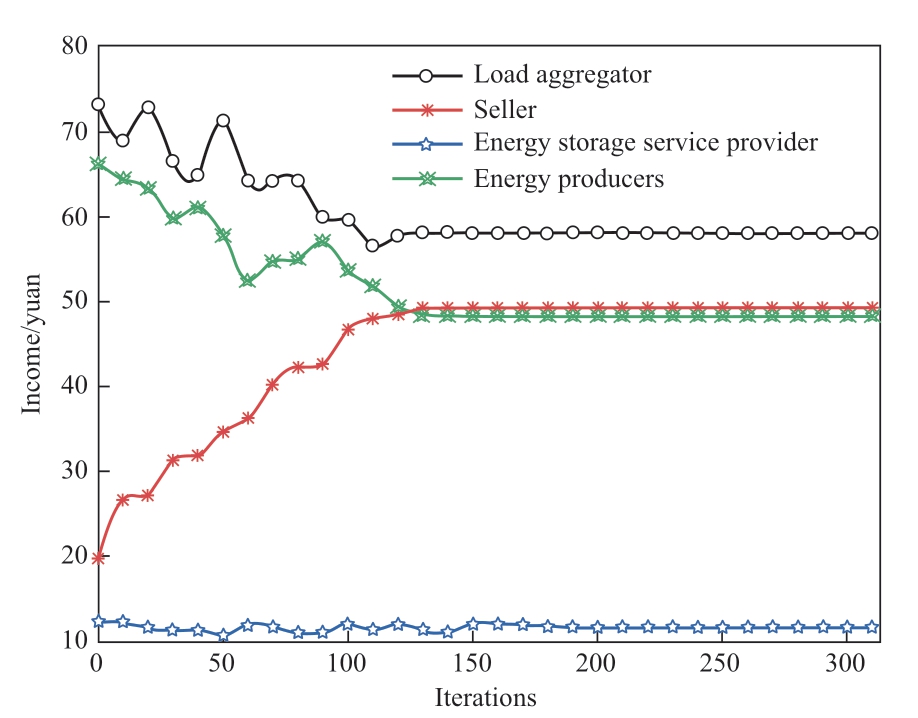
Fig. 8 Return curve of each subject
When the upper seller sets the heating price, the lower main body adjusts the optimization results of the electrical load, as shown in Fig. 9.
As shown in Fig. 9, the storage device is in the charging state from to 0:00 to 08:00. Because the cost of operating and maintaining a wind turbine is low, the output of the WT is used to supply the electrical load required by the system. During this period, lower electricity prices allowed the energy storage service providers to buy electricity at lower storage prices. The load aggregator also charges the device with as much power as possible from wind sources, and the PV power is sold to the energy producers. During peak electricity consumption,the generating set has more output, and surplus electricity can be stored through the storage device. This reduces the cost of abandoning wind power and improves the energy efficiency. From 09:00 to 12:00, the system relies on discharging the WT, PV, CHP, and storage devices to meet the electrical load requirements. The P2G equipment converts the CO2 captured by the CCS, and the electricity price is higher during this period. The joint operation of CHP-CCS-P2G helps reduce the amount of electricity purchased by the system from the best power grid and reduces the cost of electricity purchase. During 1:00-19:00 and 22:00-24:00, the electrical load of the system was mainly provided by the CHP and WT.
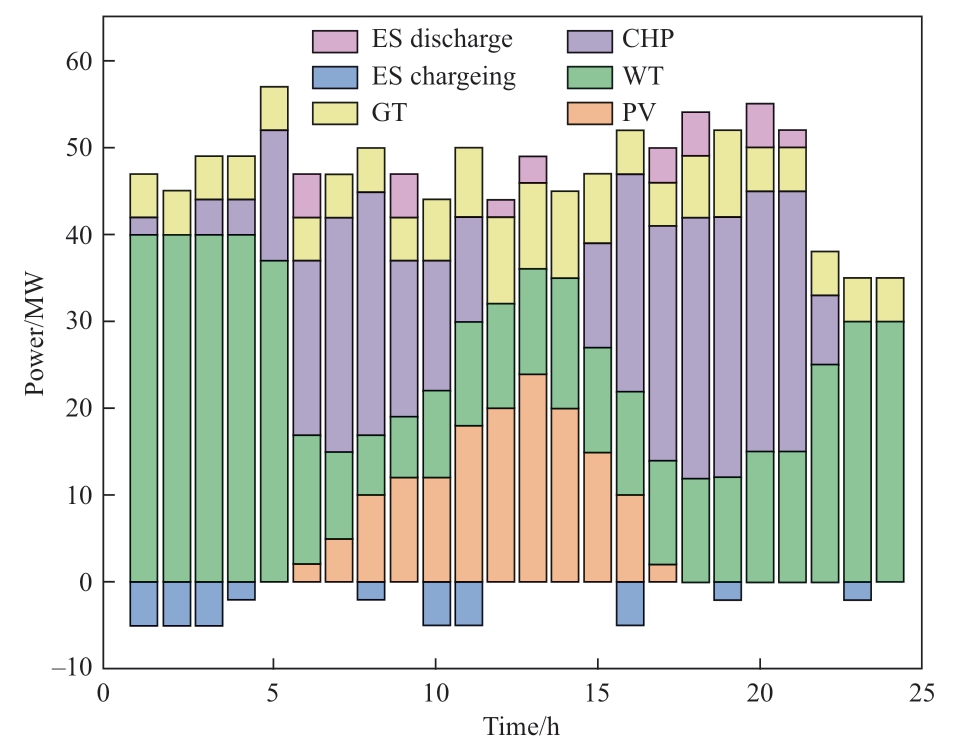
Fig. 9 Electrical load optimization results
Figure 10 shows the heat load optimization.
The heat load is primarily provided by the CHP units,heat storage devices, and gas turbines, as shown in Fig.10. During the peak hours of the heat load, the CHP unit output increases. When the heat load demand reaches a maximum, the heat storage device discharges, and at this time, the GT output increases, which jointly provides the heat load required by the system. With the decrease in the heat load demand, the heat-storage device is charged, and the heat load of the system is mainly provided by the GT and CHP units. Figure 11 shows the results of the gas load optimization.
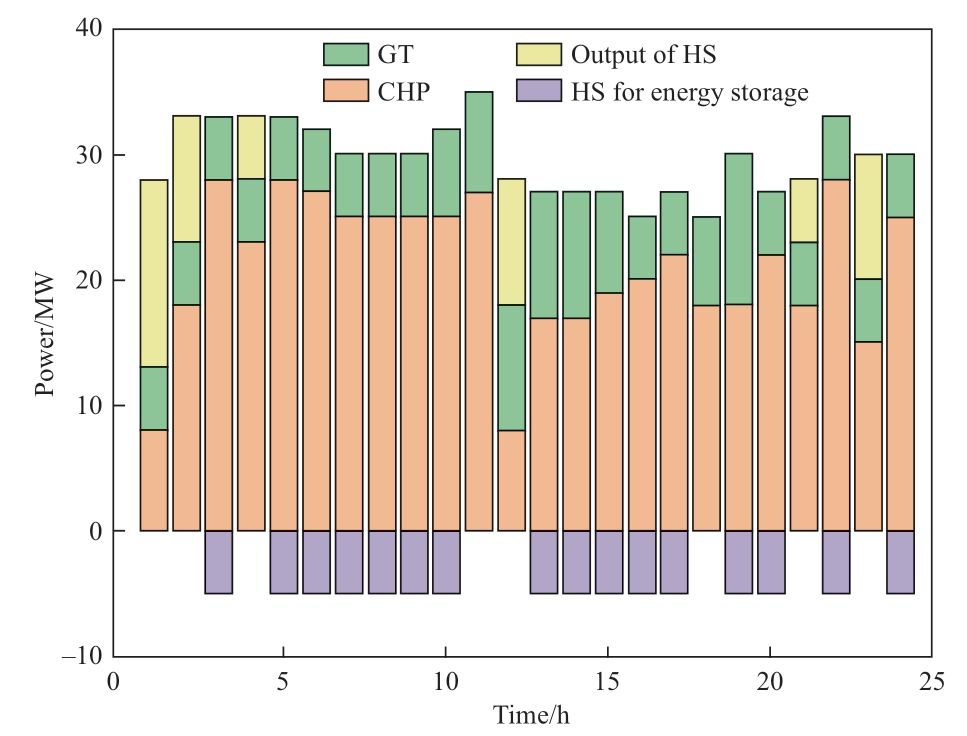
Fig. 10 Heat load optimization results
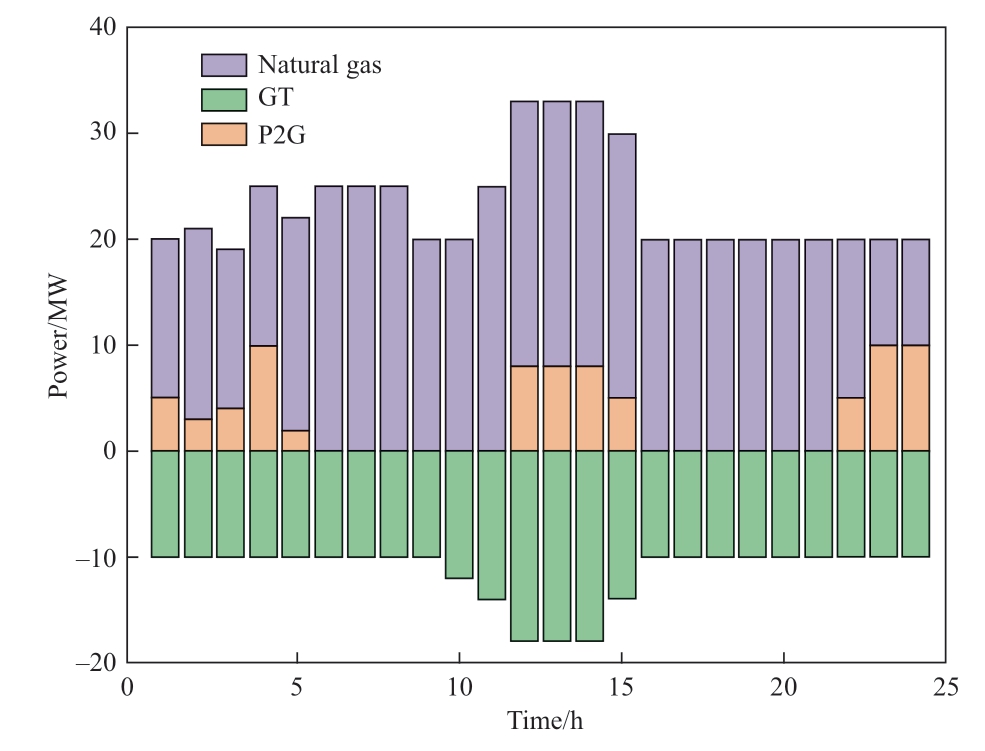
Fig. 11 Gas load optimization results
As shown in Fig. 11, the gas power consumed by the GT units is provided by the gas source and the CHP units.From 22:00 to 4:00 and from 12:00 to 15:00, the WT and PV units reach their maximum outputs. The P2G equipment can convert the surplus electric energy of the WT and PV units into gas energy to meet the demand of the gas load.The introduction of P2G equipment reduces the amount of gas purchased by the system, reduces the operating costs of the system, and also improves the utilization rate of wind power and solar energy, breaking the traditional “heat-to-electricity” operation mode of cogeneration.The introduction of power-to-gas equipment reduces the amount of gas purchased and operating costs by the system,and also improves the utilization rate of wind power and solar energy, breaking the traditional CHP unit “heat to electricity” operation mode.
The above results show that in the bilayer optimal model of the multiagent CHP-CCS-P2G joint operation of the IES, the lower-layer followers reasonably adjust the operational strategy of the system equipment according to the upper-layer leader’s pricing to maximize the benefits of each main body. This model overcomes the limitations of the conventional heat-to-electricity mode and improves the energy efficiency, thus verifying its superiority.
5.3 Benefit analysis of ladder-type carbon emission trading mechanism
We used ladder-type carbon emission trading to analyze the carbon emission trading costs of the IES jointly operated by CHP-CCS-P2G. By dividing the difference between the actual carbon emissions of the system and the initial carbon emission quota into several intervals, we analyzed the CO2 emitted to the atmosphere at different growth rates and carbon emission trading prices. Figure 12 shows the carbon emissions under different growth rates and carbon emission trading prices. Clearly, with an increase in the price growth rate, the ladder price difference increases, and the CO2 emitted to the atmosphere by the IES jointly operated by CHP-CCS-P2G is more sensitive to the carbon emission trading price, and the corresponding carbon emission trading price gradually decreases when the system is stable.After the carbon emission trading price reached 150 yuan,the carbon emissions of the IES tended to stabilize.

Fig. 12 Carbon emissions under different growth rates and carbon emission trading prices
6 Conclusions
An IES is associated with a low energy utilization rate and high carbon emissions. In this study, we extensively investigated the influence of the heat-to-electricity mode of the CHP units on the optimum operation of the system and the joint operation mechanism of the CHP units, P2G equipment, and CCS. The proposed IES bilayer low-carbon optimal scheduling method is based on the Stackelberg master-slave game applied to multiagent joint operation.By introducing P2G equipment and CCS, we established an IES bilayer low-carbon optimal scheduling model for CHP-CCS-P2G joint operation. Sellers were the upper optimization subjects, while the energy producers, energy storage service providers, and load aggregators were the lower optimization subjects. The lower-layer followers reasonably adjusted the output of each unit based on the electricity and heat prices set by the upper-layer sellers and provided feedback regarding the power value to the upper layer. The upper layer adjusted the energy prices based on input from the lower layer. The interests of each subject were maximized by playing games in the upper and lower layers. Finally, a simulation was conducted wherein the IES was coupled with an IEEE 39-node electrical grid system,a six-node heat network, and a six-node gas network. The results showed that the incorporation of the P2G and CCS devices helped reduce the carbon emissions of the system,while improving the utilization efficiency of the wind and PV energies. The carbon emissions of the IES jointly operated by CHP-CCS-P2G under different carbon emission trading prices were analyzed. When the carbon emission trading price reached 150 yuan, the carbon emissions of the IES remained unchanged.
We did not explore an energy market trading mechanism suitable for IES. Therefore, the impact of market factors on the operational economy of IES should be the focus of future studies.
Appendix A Solving process of the lowerlayer model
The KKT transformation constraints for the lower model are expressed in (A1).
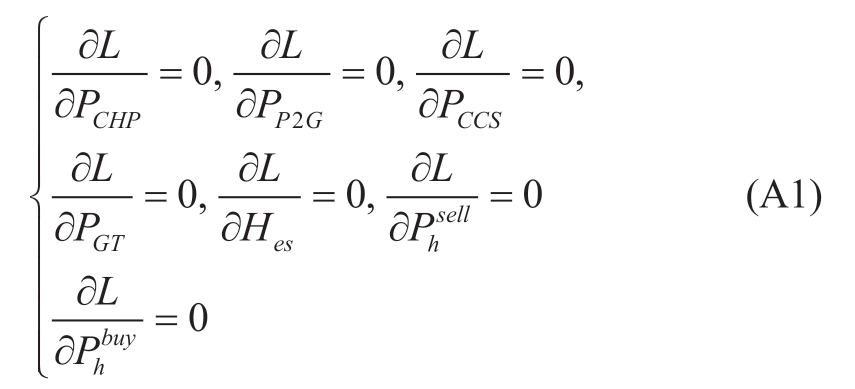
The complementary relaxation conditions are expressed in (A2).
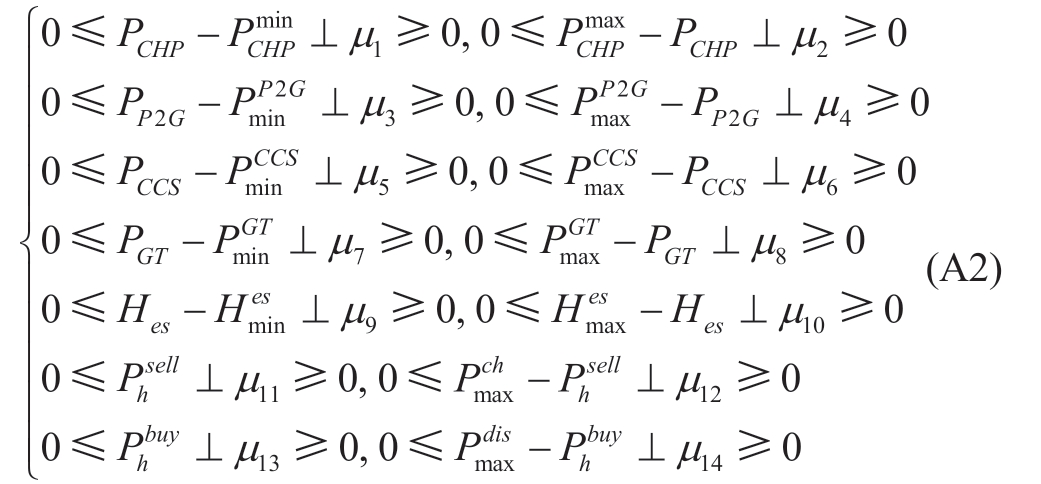
The nonlinear constraint (A2) is converted to a linear constraint using the big M method, as expressed in (A3)-(A9):
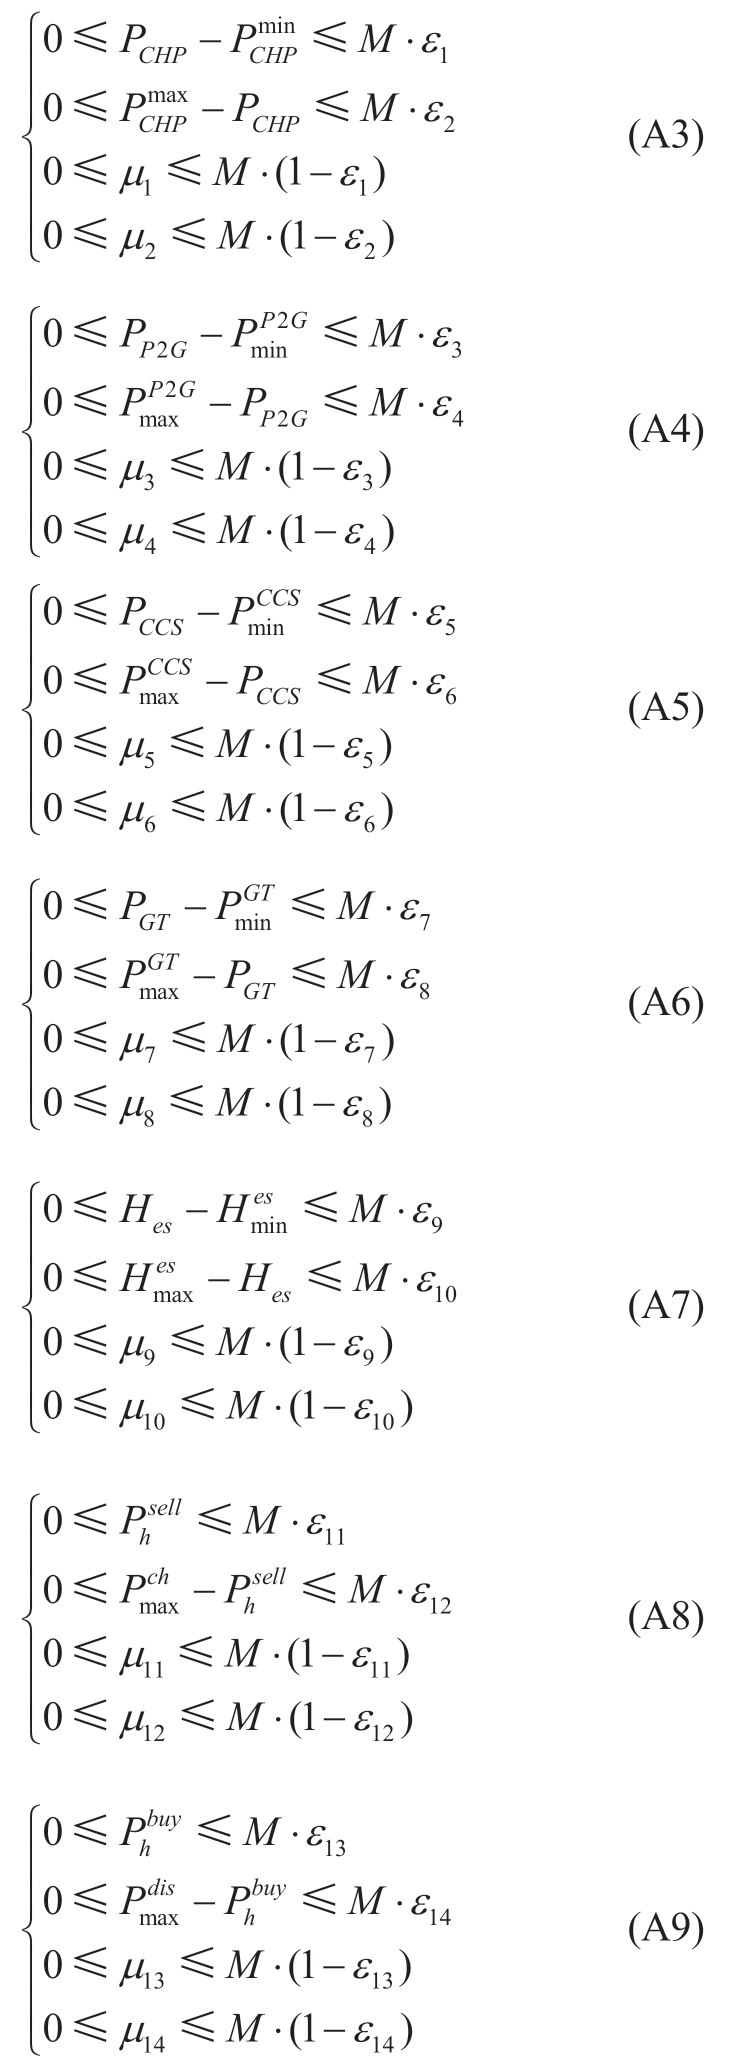
Here, M is a sufficiently large positive number, and ε 1~ε14 are variables ranging from 0 to 1.
After the KKT condition transformation of the lower model, (A1) is taken as the equality constraint of the upper model, and Equations (A3)-(A9) are taken as the inequality constraints of the upper model. The bilayer optimization model is converted to a single-layer model, as expressed in (A10).
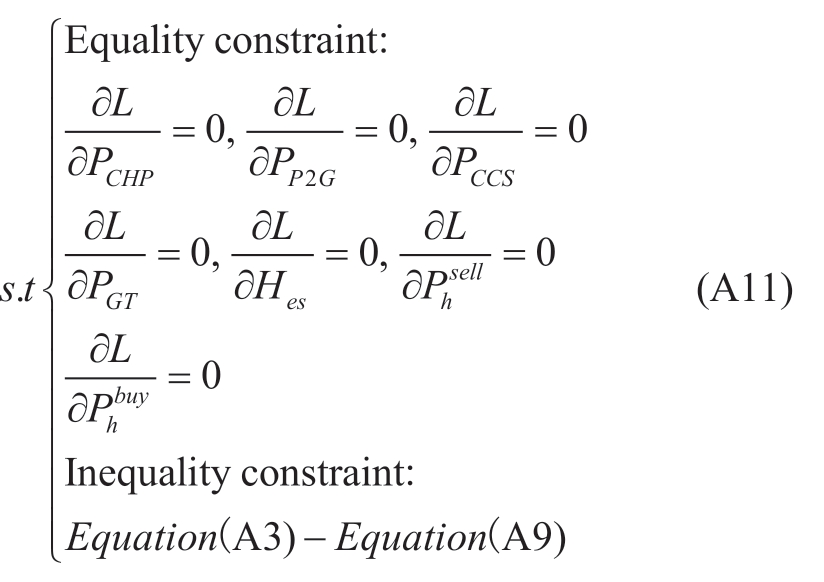
The constraints are expressed in (A11).
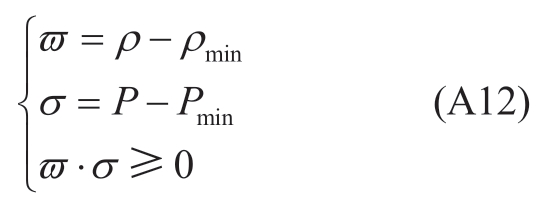
Because the objective function was nonlinear, the original nonlinear nonconvex problem was relaxed using the McCormick envelope method. We transformed the product term [ρ ⋅P] of the price and power into an objective function. ρis a parameter of![]() , and P is a parameter of a{PE S,PE S,PE U,PH U,PE P PH P,PE Y, PHY}.Let Y= ρ⋅P . The objective function is transformed as expressed in (A12).
, and P is a parameter of a{PE S,PE S,PE U,PH U,PE P PH P,PE Y, PHY}.Let Y= ρ⋅P . The objective function is transformed as expressed in (A12).
Here,
Appendix B The values of the IES node parameters
Table B1 Unit parameters of CHP
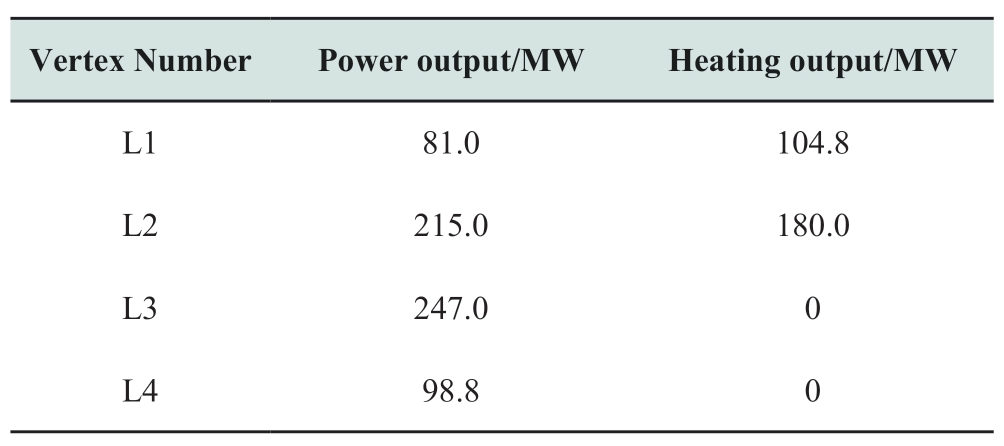
Table B2 Gas turbine unit parameters
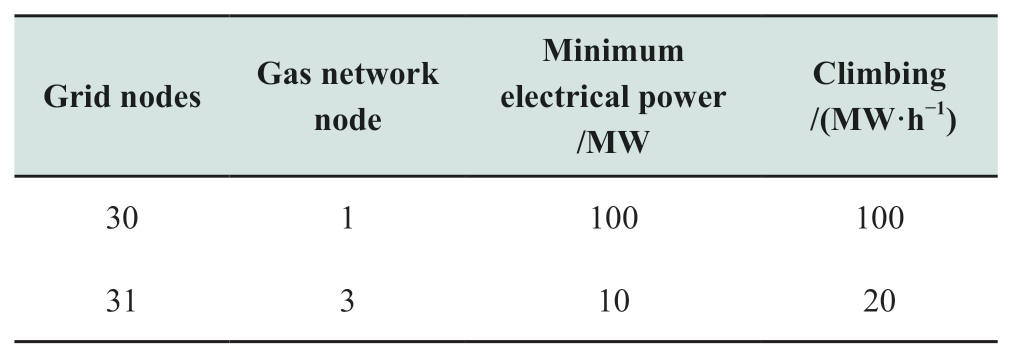
Table B3 Node data parameters of the natural gas system

Appendix C
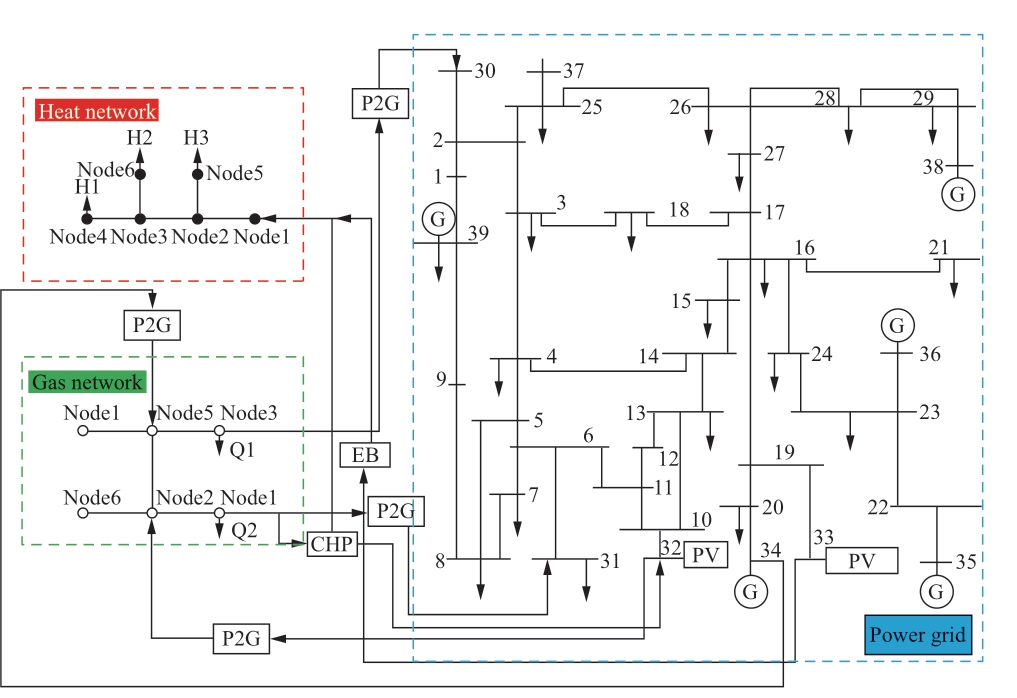
Fig. C IES testing system
Acknowledgements
This study was supported by the National Natural Science Foundation of China (Grant No. 62063016)
Declaration of Competing Interest
We declare that we have no conflict of interest.
References
[1] He J, Li Y, Li H, et al. (2020) Application of game theory in integrated energy system systems: A review. IEEE Access, 8:93380-93397
[2] Cheng H, Ai Q (2022) Integrated demand response design of integrated energy system with mobile hydrogen energy storage in time-domain two-port model. Electronics, 11(24)
[3] Chen S, Conejo A J, Wei Z (2021) Conjectural variations equilibria in electricity, natural-gas, and carbon-emission markets.IEEE Transactions on Power Systems, 36(5): 4161-4171
[4] Wang Y, Liu Z, Cai C, et al. (2022) Research on the optimization method of integrated energy system operation with multisubject game. Energy, 245
[5] Tan C, Geng S, Tan Z, et al. (2021) Integrated energy systemhydrogen natural gas hybrid energy storage system optimization model based on cooperative game under carbon neutrality.Journal of Energy Storage, 38
[6] Chen C M, Deng X, Zhang Z, et al. (2021) Optimal day-ahead scheduling of multiple integrated energy systems considering integrated demand response, cooperative game and virtual energy storage. IET Generation, Transmission & Distribution, 15(11)
[7] Li P, Wang Z, Yang W, et al. (2020) Hierarchically partitioned coordinated operation of distributed integrated energy system based on a master-slave game. Energy, 214
[8] Li Y, Wang B, Yang Z, et al. (2022) Hierarchical stochasticscheduling of multi-community integrated energy systems in uncertain environments via Stackelberg game. Applied Energy, 308
[9] Lu Q, Guo Q, Zeng W (2023) Optimal dispatch of community integrated energy system based on Stackelberg game and integrated demand response under carbon trading mechanism.Applied Thermal Engineering, 219(PB)
[10] Huang Y, Wang Y, Liu N (2022) A two-stage energy management for heat-electricity integrated energy system considering dynamic pricing of Stackelberg game and operation strategy optimization. Energy, 244(PA)
[11] Yuan G, Gao Y, Ye B (2021) Optimal dispatching strategy and real-time pricing for multi-regional integrated energy systems based on demand response. Renewable Energy, 179: 1424-1446
[12] Li X, Wang L, Yan N, et al. (2021) Cooperative dispatch of distributed energy storage in distribution network with PV generation systems. IEEE Trans Appl Supercond, 31(8): 1-4
[13] Zhang Y, Zhao H, Li B, et al. (2022) Research on dynamic pricing and operation optimization strategy of integrated energy system based on Stackelberg game. International Journal of Electrical Power & Energy Systems, 143: 108446
[14] Cheng Y, Zhang N, Lu Z, et al. (2019) Planning multiple energy systems toward low- carbon society: A decentralized approach.IEEE Trans Smart Grid, 10(5): 4859-4869
[15] Jiang Y H, Mei F, Lu J X, et al. (2021) Two-stage joint optimal scheduling of a distribution network with integrated energy systems. IEEE ACCESS, 9: 12555-12566
[16] Wang Y, Liu Z, Cai C, et al. (2022) Research on the optimization method of integrated energy system operation with multi-subject game. Energy, 245
[17] Yang W, Xia Y, Yu X, et al. (2022) Optimal dispatch of agricultural integrated energy system with hybrid energy storage.energies, 15(23): 9131
[18] Chen C M, Deng X, Zhang Z, et al. (2021) Optimal day-ahead scheduling of multiple integrated energy systems considering integrated demand response, cooperative game and virtual energy storage. IET Generation, Transmission & Distribution, 15(11):1657-1673
[19] Yu H, Wu S C, Xu J, et al. (2022) Game optimal scheduling among multiple energy hubs considering environmental cost with incomplete information. Automation of Electric Power Systems,46(20): 109-118
[20] Luo Y W, Li C R, Zhang L, et al. (2020) Energy simulation and optimal scheduling of integrated energy system considering hybrid energy storage. Electric Power, 53(10): 96-103
[21] Fan S L, Li Z S, Wang J H, et al. (2018) Cooperative economic scheduling for multiple energy hubs: A bargaining game theoretic perspective. IEEE Access, 6: 27777-27789
[22] Guo H, Shi T, Wang F, et al. (2020) Adaptive clustering-based hierarchical layout optimisation for large-scale integrated energy systems. IET Renewable Power Generation, 14(17): 3336-3345
[23] Ma W, Deng W, Pei W, et al. (2022) Operation optimization of electric power-hot-water-steam integrated energy system. Energy Reports, 8(S5): 475-482
[24] Lu Q, Guo Q, Zeng W (2023) Optimal dispatch of community integrated energy system based on Stackelberg game and integrated demand response under carbon trading mechanism.Applied Thermal Engineering, 219: 119508
[25] Wei N, Jia Y, Tao H, et al. (2022) Low-carbon economic dispatch of integrated energy system considering carbon trading and integrated demand response with CCER. Journal of Physics:Conference Series, 2401(1): 1173-1177
[26] Chen M, Lu H, Chang X, et al. (2023) An optimization on an integrated energy system of combined heat and power, carbon capture system and power to gas by considering flexible load.Energy, 273
[27] Yang H Z, Li M L, Jiang Z Y, et al. (2020) Multi-time scale optimal scheduling of regional integrated energy systems considering integrated demand response. IEEE Access, 8: 5080-5090
[28] Zhang J L, Kong X F, Shen J, et al. (2023) Day-ahead optimal scheduling of a standalone solar-wind-gas based integrated energy system with and without considering thermal inertia and user comfort. Journal of Energy Storage, 57: 1113-1122
[29] Wang L, Hou C, Ye B, et al. (2021) Optimal operation analysis of integrated community energy system considering the uncertainty of demand response. IEEE Transactions on Power Systems,36(4): 3681-3691
[30] Yu X B, Zheng D D (2020) Cross-regional integrated energy system scheduling optimization model considering conditional value at risk. International Journal of Energy Research, 44(7):5564-5581
Received: 17 May 2023/ Accepted: 25 July 2023/ Published: 25 August 2023
 Lizhen Wu
wulzlut@163.com
Cuicui Wang
2420245035@qq.com
Wei Chen
17693100904@163.com
Tingting Pei
peitt52@163.com
2096-5117/© 2023 Global Energy Interconnection Development and Cooperation Organization. Production and hosting by Elsevier B.V. on behalf of KeAi Communications Co., Ltd. This is an open access article under the CC BY-NC-ND license (http: //creativecommons.org/licenses/by-nc-nd/4.0/ ).
Biographies

Lizhen Wu received the M.S. degree in control theory and control engineering from the Lanzhou University of Technology,Gansu, China, in 2004, and a Ph.D. degree in control theory and control engineering from the Lanzhou University of Technology in 2017. She studied power systems and their automation at the National Active Distribution Network Technology Research Center, Beijing Jiaotong University, Beijing, China, in 2015. She is currently an associate professor/master’s supervisor at the College of Electrical and Information Engineering, Lanzhou University of Technology, where she teaches courses on power electronics, control theory, and renewable energy systems. Her interests include distributed generation and microgrids, microenergy grid coordination control, power quality control, artificial intelligence,>

Cuicui Wang was born in Tianshui, China in 1999. She received the B. Eng. degree in 2021. She is a master’s degree candidate at the Lanzhou University of Technology, Gansu,China, since 2021. Her interests include the optimization and scheduling of IES.

Wei Chen received the M.S. degree in Power Systems and Automation from Xi’an Jiaotong University, Xi’an, China, in 2005,and the Ph.D. degree in Control Theory and Control Engineering from Lanzhou University of Technology in 2011. He is currently a professor and doctoral supervisor at the College of Electrical and Information Engineering,Lanzhou University of Technology, where he teaches courses on power systems, automation, and control theory. His interests include smart grids, intelligent control theory and applications, artificial intelligence, power system stability analysis, and power qualitycontrol technology.

Tingting Pei received the Ph.D. degree in renewable energy and smart grid from Lanzhou University of Technology, Lanzhou, China,in 2020. She was a lecturer with the College of Electrical and Information Engineering,Lanzhou University of Technology since 2021.The author current research interests include fault diagnosis, reconfiguration, intelligent operation and maintenance of photovoltaic power generation system.
(Editor Yanbo Wang)
