0 Introduction
A distribution switchgear is responsible for distributing electrical energy from the circuits of the upper distribution equipment to nearby loads, providing protection, monitoring,and control of the loads [1, 2].Usually, the internal structure of the switch cabinet is divided into a bus room, a circuit breaker room, a secondary control room, and a feeder room.With component aging, abnormal conditions, and foreign matter intrusion, the internal switch cabinet may cause partial discharge, excessive current carrying, and other phenomena, which can result in a local temperature rise.Owing to the closed internal structure of the switchgear,internal heating can easily induce high-temperature and high-pressure gases, arc discharge, and other processes,threatening safe operation of the power grid.To find an abnormal temperature in the switch cabinet in time, an online temperature-monitoring system is an important component of the switch cabinet.The system consists of temperature sensors, temperature display instruments,and system analysis software.A temperature sensor is usually installed on the measurement point in the cabinet and obtains the temperature through contact.Infrared temperature sensors installed outside of the cabinet can obtain temperatures without contact.With the help of temperature sensors, the online temperature-monitoring system can find hidden dangers in time, prevent short circuit accidents caused by high-temperature burn and insulation aging breakdown, and improve the reliability of the power supply to realize intelligent identification of the switch cabinet state, and automatic operation and maintenance.
However, when evaluating the temperature rise through a temperature-monitoring system, it is difficult to obtain a temperature field with important dynamic information with high temporal and spatial resolution from only discrete point temperature values.Furthermore, only the temperature of the dispersion point can be collected by the monitoring system.If only contact temperature sensors are used for measurement, a large number of sensors are required to monitor sensitive parts.Owing to space and insulation distance limitations, sensors cannot be installed at all points that must be monitored.In addition, installation of a large number of sensors can interfere with the temperature field.If a non-contact temperature sensor is used to measure the temperature, it is difficult to determine the temperature distribution in the internal space of the power-distribution switch cabinet[3, 4].Moreover, the data collected by a noncontact infrared temperature sensor are primarily infrared thermal images.The volume of this type of data requires significant data storage and transmission.
To better understand the temperature rise rule of the switch cabinet and provide theoretical support for temperature rise early warning, researchers have conducted three-dimensional modeling and temperaturefield simulations of the switch cabinet using finite element simulation software such as COMSOL and Ansys, and studied the temperature rise characteristics of the switch cabinet in the fault state.In the internal temperature distribution rule of the switch cabinet, researchers have studied the relationship between the temperature rise of the switch cabinet and the current, resistance, and other factors [1, 2].In addition, a large number of studies have been conducted on the influence of cooling fans, outlets,circuit breaker materials, contact states, load current sizes,and other factors on the temperature rise[3-6].To study the temperature rise suppression measures of switchgears,researchers have simulated the internal structure of different switchgears, forced convection heat dissipation and other working conditions[6, 7], and studied different temperature rise suppression schemes.Studies have reported the temperature rise change rules of switchgears with faults such as short circuits, partial discharges, and bad contacts,and introduced the principles of different temperature rise suppression measures.The forced convection heat dissipation of the fan is helpful in reducing the temperature rise of the switch cabinet.The improvement in the flowfield inside the contact box through a diversion device is also helpful in reducing the temperature rise.In the study of temperature rise characteristics and suppression measures,the temperature-field simulation accuracy is extremely high and can simulate a variety of possible conditions, with reliability and efficiency.Previous research results show a number of temperature rise rules and temperature control measures for the switchgear.However, accurate perception and timely warning of the temperature rise of the switchgear in a three-dimensional space is still a difficult problem for operation and maintenance personnel.In recent years,explosions and burn-out accidents have continued to occur in transport switchgears.For example, for switchgears with a hand cabinet, more than 100 sets are burned annually in China due to arc and other high-temperature heating.Thus, there is an urgent need for reliable temperature-field reconstruction and temperature-rise diagnosis technologies.
To solve these problems, a method for temperaturerise fault-identification based on tensor block-matching is proposed in this study.Based on the external temperature information of the power distribution cabinet collected by an infrared thermometer, and tensor block-matching and lowrank tensor super-resolution, the method first searches for the appropriate tensor block in the temperature-field tensor dictionary, and then tries to fill the target space area with the tensor block from the outside to the inside to realize threedimensional temperature-field reconstruction inside the power distribution cabinet.By comparing the position of the heat source and the power distribution cabinet components in the reconstructed 3D temperature-field, non-intrusive temperature rise fault-identification is realized.Simulation experiments were conducted for the power distribution cabinet.
1 Analysis of heat transfer mechanism and visual temperature characteristics of continuum
In this study, the finite volume method was used to analyze the heat transfer mechanism of a continuous medium inside a power distribution cabinet.The finite volume method is the most widely used method for numerical calculation of flow and heat transfer problems [8].First, the computational domain was divided into several control bodies; all variables were stored in the geometric center of the control bodies.The discrete equation was derived by integrating the control volume of the conservation governing equation to ensure the conservation characteristics of the discrete equation.We consider the steady-state heat transfer in the heat diffusion process of the power distribution cabinet; the temperature of each point in the heat transfer system of the power distribution cabinet changes only with the location and not with time[9-12].According to Fourier’s law, the heat passing through a given section in unit time is directly proportional to the temperature change rate and section area in the direction perpendicular to the section:
where Q represents heat (J), H is the heat transfer area (m2),z represents the coordinates on the heat conduction surface(m), Temp is the temperature (K), k is a constant (W·m-1·K-1).The value of k is related to the thermal conductivity of the material, thermal conductivity of air, heat dissipation area,and other factors.Considering its one-dimensional steadystate conduction, the following should be satisfied.
where L is the source term, which represents the newly added energy per unit volume within a unit of time.Integrating into the control volume
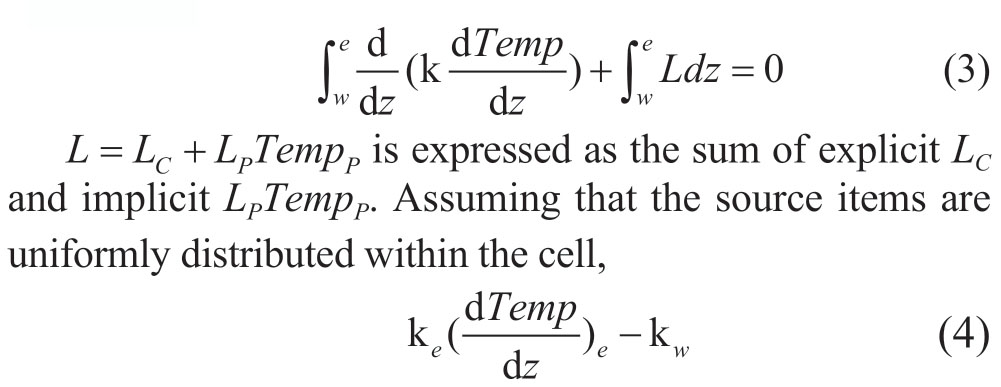
where the derivative on the interface is calculated by the value difference quotient of the center of the adjacent unit.


This is the governing equation in the discrete form for any element.
According to this formula, the heat flux, mass flow rate, and momentum flux on the control volume surface have continuity; that is, there is a correlation between each neighborhood of the temperature graph.Thus, from the perspective of visual temperature characteristics, the temperature field formed in the distribution cabinet can be regarded as continuous, and its texture information also has continuity.Let the tensor to be repaired be I ∈Rs×t l×.The area with correct information (hereafter referred to as the source area) and the area to be repaired (hereafter referred to as the target area) are respectively recorded as C and T;the value of the target area T is uniformly labeled as a α.Let the tensor block centered at point p be X( p )∈Rn× n×n.In the set of tensor blocks in X( p) , all points in source region C are denoted as ΦC.The set of tensor blocks X( p) , whose existential points are all in the target region T, is denoted as T.The boundary curve between the source region C and the target region T is denoted as δT ⊂ T, and the set of tensor blocks centered on the point t ∈ δT is denoted as PT⊂ ΦT.
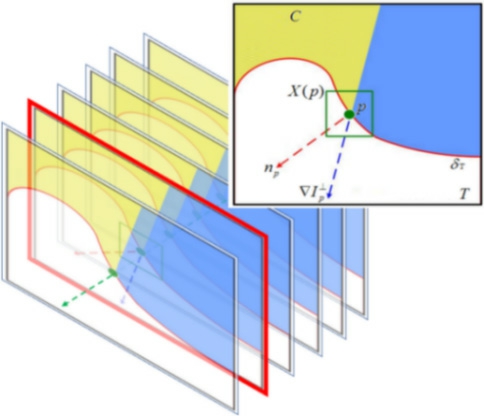
Fig.1 Diagram of tensor block-matching
As shown in Fig.1, the boundary point P of the priority repair is found in the source area C and target area T.Similar adjacent tensor blocks were obtained after discretization by taking advantage of the continuity of texture information in the temperature field.The tensor blocks in the target area were repaired based on similar adjacent tensor blocks.
Because the texture information of the temperaturefield formed in the distribution cabinet also has continuity,the adjacent tensor blocks after discretization should be similar and share an approximate 26-neighbor correlation coefficient.This is the theoretical basis for 3D temperaturefield reconstruction of the distribution cabinet using tensor block-matching and tensor block super-resolution methods.
2 Three-dimensional temperature-field reconstruction based on tensor blockmatching
During temperature-field reconstruction of the nonintrusive power distribution cabinet, the sensor data are the temperature information of the power distribution cabinet shell.Thus, the target area must be repaired layer by layer from the outside to the inside.The repair order is determined by the priority of the tensor block to be repaired.As the repair process for each tensor block to be repaired is independent, existing methods seldom consider the continuity of the change in information of adjacent tensor blocks in the tensor, leading to accumulation of errors and sudden changes in adjacent pixels, resulting in undesirable repair effects (block effect) [13].
To solve this problem, we propose a two-stage data repair process of “rough repair - fine repair”to reconstruct the 3D temperature-field information.In the coarse restoration stage, the tensor block-matching method is used to reconstruct the temperature-field body.In the fine restoration stage, tensor super-resolution is used to smooth the values of adjacent pixels in the temperature field.
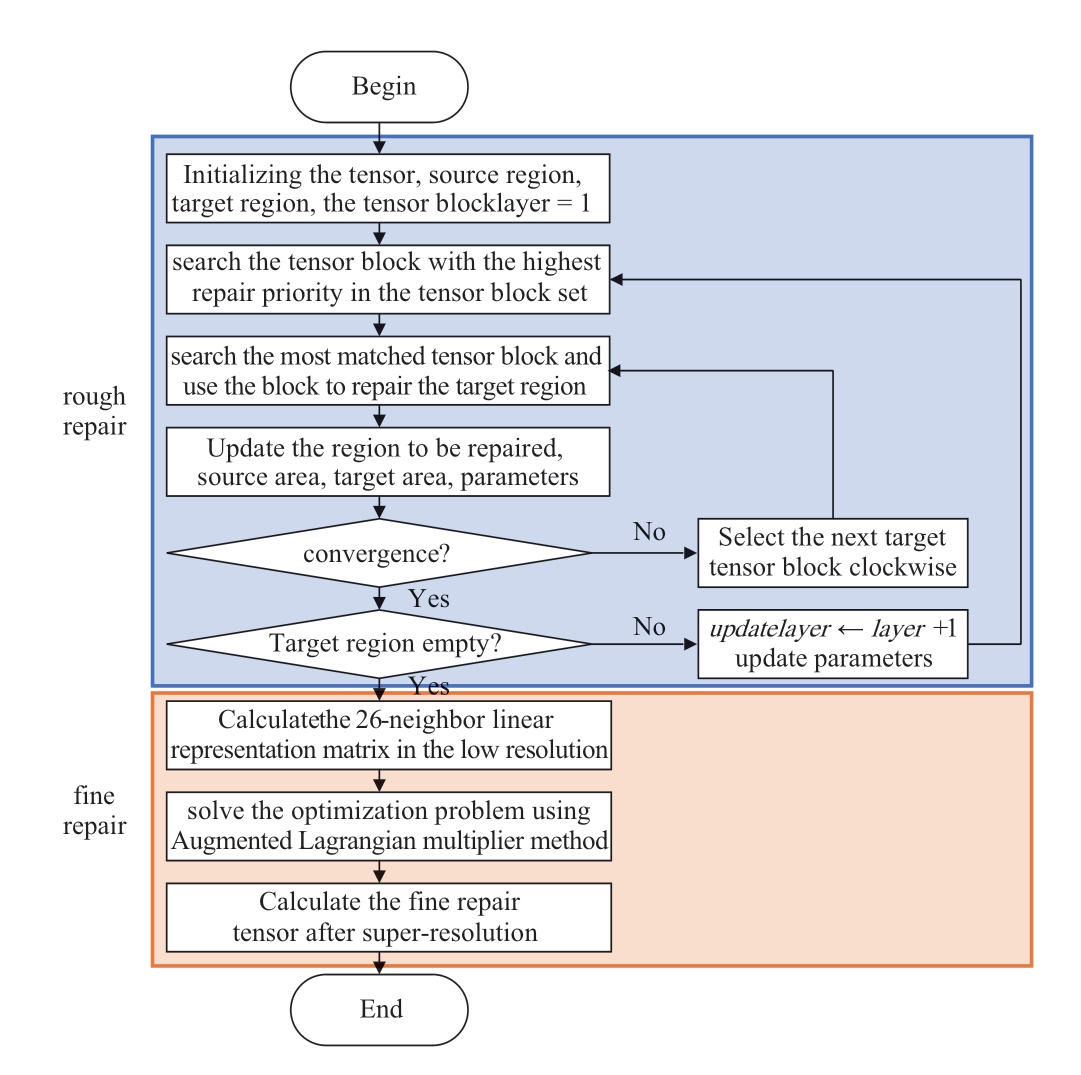
Fig.2 Flowchart of 3D temperature-field reconstruction based on tensor block-matching
As shown in Fig.2, the 3D temperature-field reconstruction was divided into two stages: coarse and fine repair.In the coarse repair process, the tensor,source area, target area, and parameters to be repaired are initialized.The target area with the highest priority for repair is searched, and updated using the most matched similar tensor block.The source area and target area are updated, and the convergence is assessed.If convergence occurs, the next target tensor block (clockwise) is selected for repair, and it is determined whether the target area is empty.In the process of fine repair, the neighborhood coefficient matrix of the rough repair tensor is calculated.The augmented Lagrange multiplier method is used to solve the optimization problem; the fine repair tensor is calculated, and the reconstructed three-dimensional temperature-field is obtained.
2.1 Rough repair of 3D temperature field
In the rough repair stage, the 3D temperature field inside the power distribution cabinet is reconstructed by searching for the appropriate tensor block in the temperaturefield tensor dictionary based on the outside temperature information collected by the infrared thermometer.Next, the target space area is filled from the outside to the inside using tensor block-matching technology.To determine the repair order of the tensor blocks, the tensor block with the highest repair priority is found in the collection of tensor blocks:

The method first repairs the outermost layer of the target region T, that is, the collection of tensor blocks PT ⊂ ΦT.In the tensor block set PT, the tensor block with the highest priority is searched according to formula (7), and the most matched tensor block in the source region C is searched for and repaired.The tensor block is repaired clockwise (or counterclockwise) until it converges and is repaired layerby-layer from outside to inside.
During tensor repair, there are often overlapping areas between adjacent tensor blocks.As natural tensors such as the temperature field usually have continuous differentiable properties, the texture information of the tensor in the overlapping region should be continuous.Thus, information on the repaired region should be considered when evaluating the most matched tensor blocks [14].The selection of the optimal matching blocks can be described as
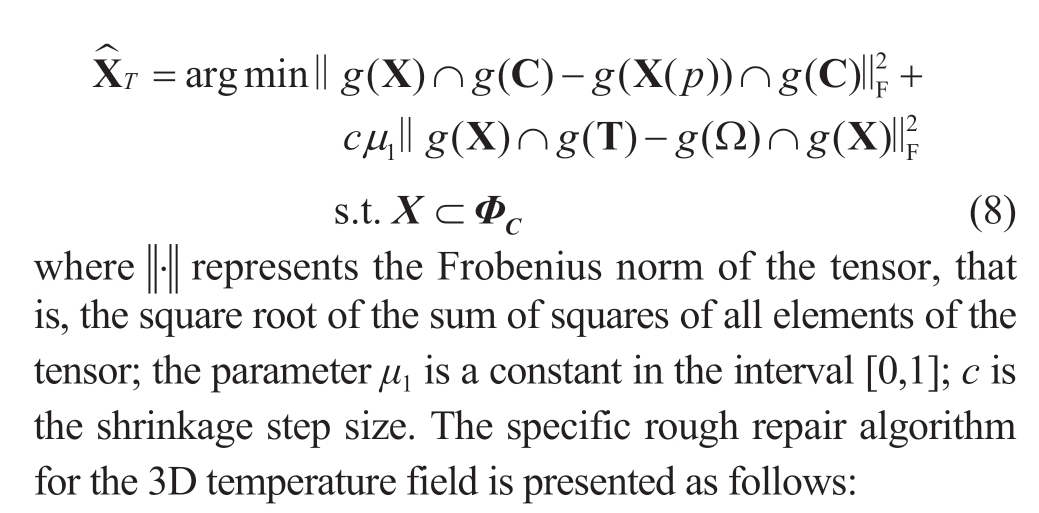
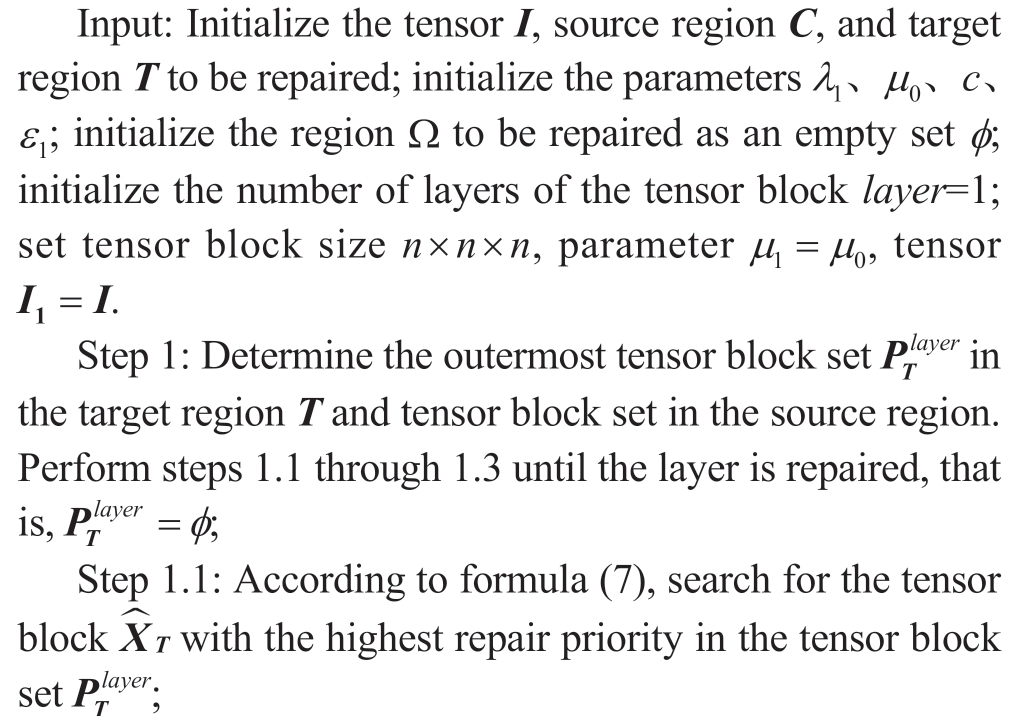
Step 1.2: For the tensor block ^X T in need of rough repair, search the most matched tensor block XC from the source region C according to formula (8) and use the tensor block XC to repair the target region.

Step 2: If the target region T =φ, update the rough repair tensor I1, and terminate the algorithm; otherwise, update the number of layers in the tensor block layer ←layer+1,initialize the adjustment parameters μ1 ← μ0, and return to Step 1.
Output: The coarsely repaired tensor I1
2.2 3D Temperature-field precision repair
In the fine repair stage, the proposed method uses tensor super-resolution technology to fill in the temperature field obtained from rough repair and realizes temperature-field information smoothing inside the power distribution cabinet.To obtain a high-resolution tensor from a low-resolution tensor without changing the main contour information of the tensor, we must increase the number of pixels according to the texture characteristics of the tensor.
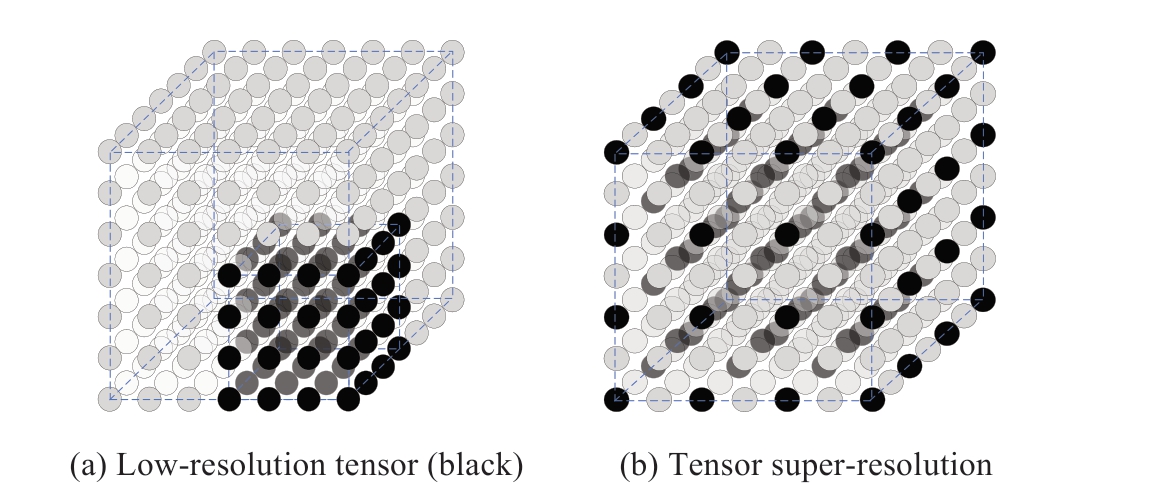
Fig.3 Diagram of tensor super-resolution
Many unknown pixels appear when the low-resolution tensor I1 obtained from the coarse restoration of the threedimensional temperature-field is extended to the highresolution tensor.Fig.3 shows how a 4 × 4 ×4 lowresolution tensor expands into a 7 × 7 ×7 higher-resolution tensor; the black dot represents a known element and the gray dot represents an unknown element.
According to the similarity of texture features between the low-resolution tensor and the high-resolution tensor,for the same element, the 26-neighbor linear representation coefficient βk in the low-resolution tensor and the 26-neighbor linear representation coefficient αk in the high-resolution tensor should be equal, k=1,...,26.The 26-neighbor linear representation matrix S was constructed with the 26-neighbor linear representation coefficients αk of each element in the high-resolution tensor corresponding to the three-dimensional temperature-field tensor I1 as the column vector.However, the corresponding linear representation coefficients of the position-filled elements in the high-resolution tensor are mostly missing.Thus, the 26-neighbor linear representation matrix S with missing data can be regarded as the sum of the low-rank matrix A and the sparse matrix E (noise matrix).The repair problem of the 26-neighbor linear representation matrix E can be described as the following optimization problem:

where Y denotes the Lagrange multiplier matrix, and μ2 denotes the contraction factor.The specific 3D temperaturefield precision repair algorithm is described as follows.
Input: Initialize the tensor to be repaired I1; initialize parameters λ2, μ2, and the iteration step size ρ.
Step 1: Construct the 26-neighbor linear representation matrix S and solve the following optimization problem using Singular Value Decomposition (SVD) and the contraction operator method;
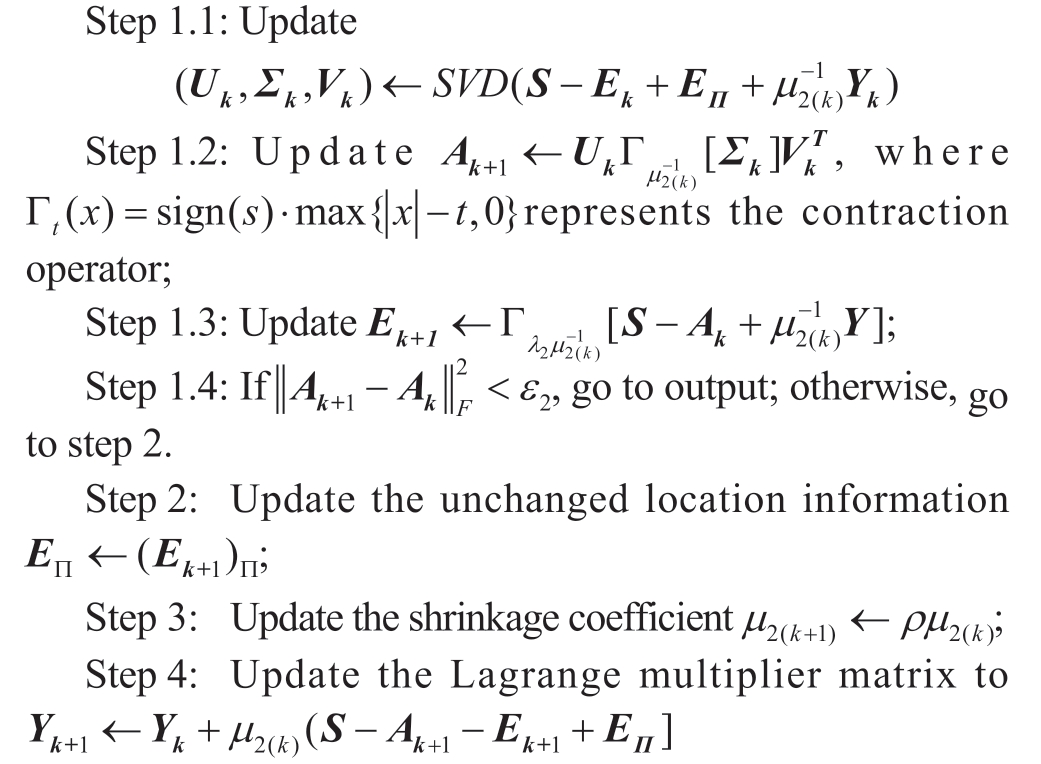
Step 5: Construct tensor I2 based on 26-neighbor linear representation matrix;
Output: The tensor I2 after the fine repair.
3 Realization of temperature rise faultidentification for non-interventional distribution cabinet
Based on the 3D temperature-field in the cabinet repaired in the previous chapter, the proposed method locates the heat source position in the 3D temperaturefield of the power distribution cabinet by setting the clustering rules and temperature threshold and comparing and analyzing the position of the power distribution cabinet components to realize non-interventional temperature rise fault-identification.
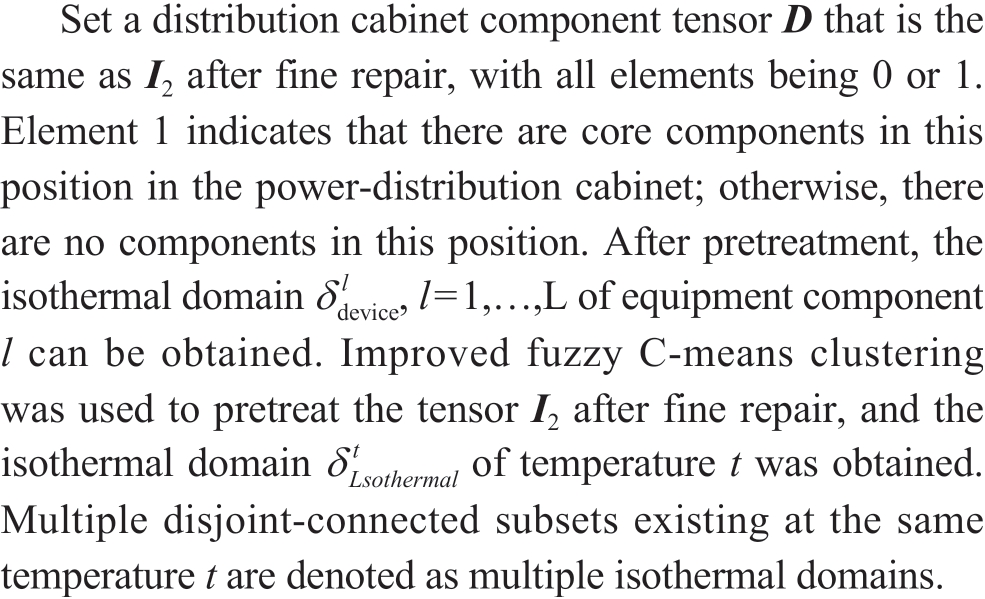
For any temperature t '<t, we found adjacent isothermal
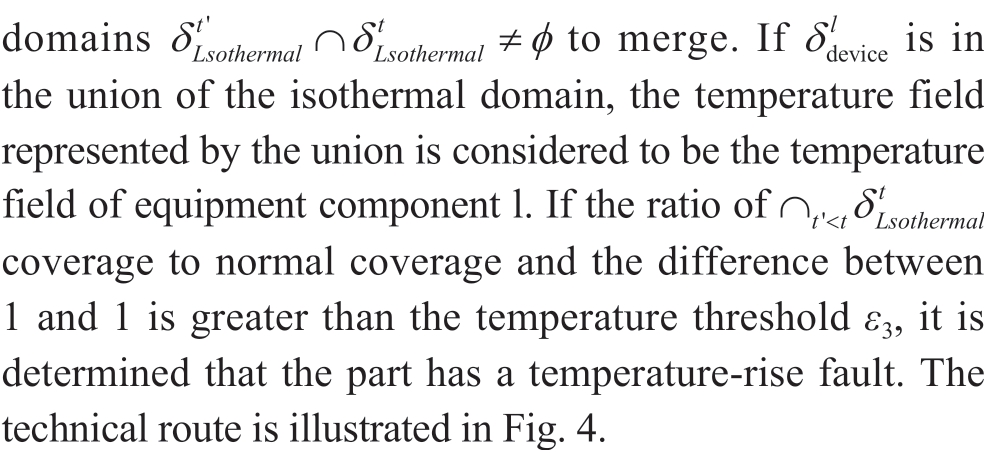
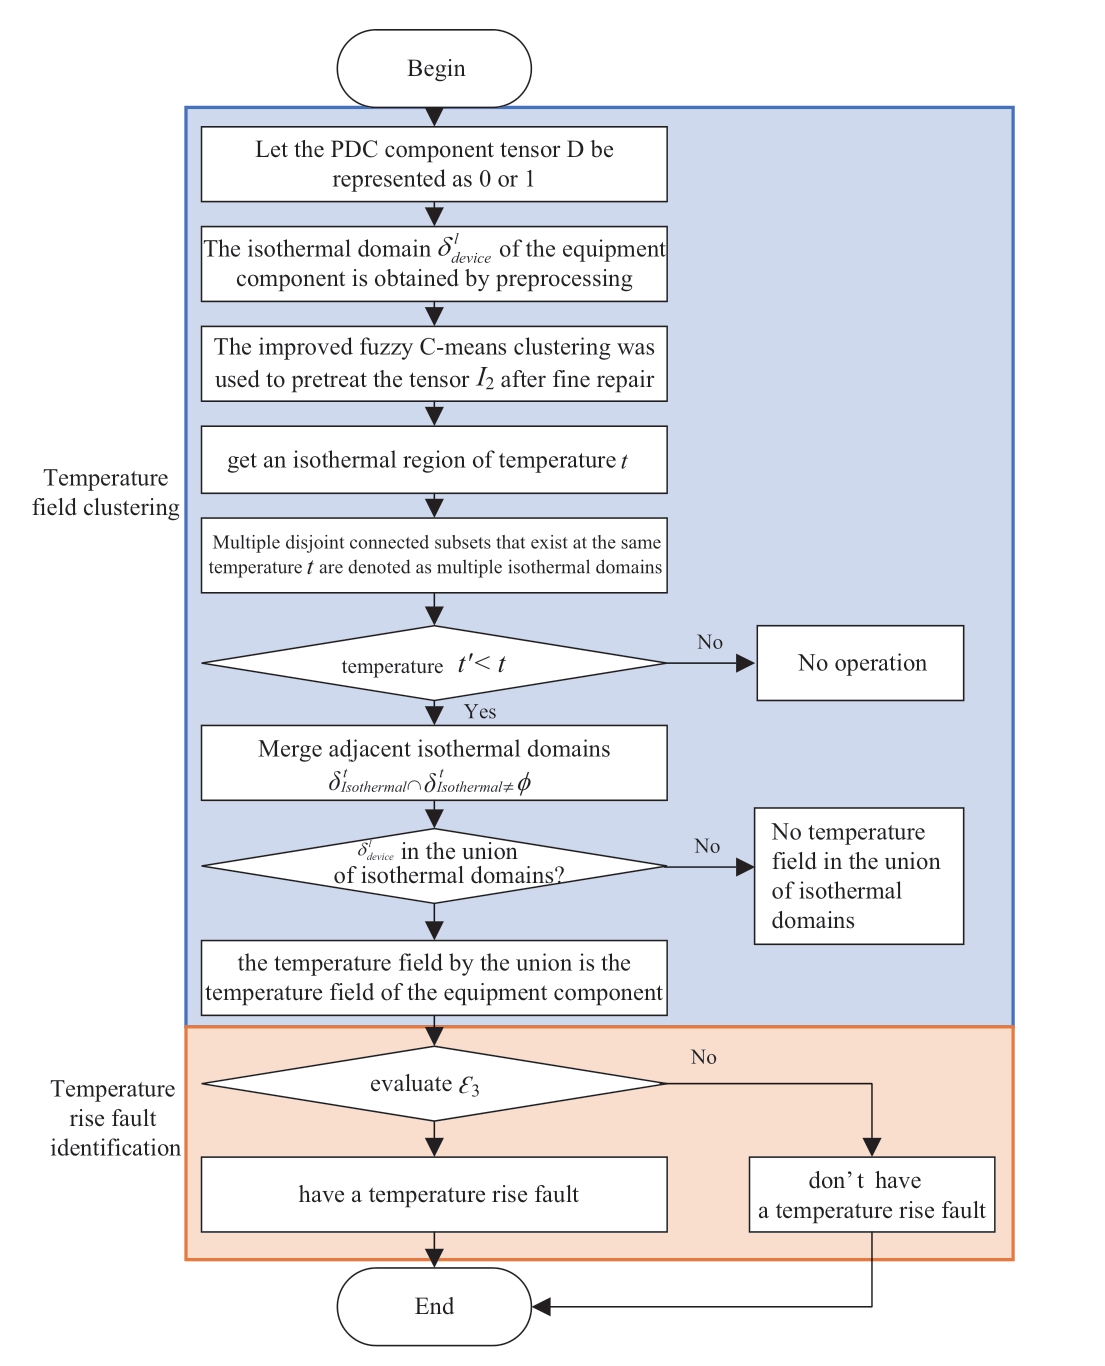
Fig.4 Diagram of temperature rise fault-identification of distribution cabinet based on temperature-field clustering
4 Simulation experiment and result analysis
4.1 Simulation experiment
To verify the fitting effect of the proposed method on the two-dimensional temperature profile and three-dimensional temperature field, a physical simulation platform was built to support a simulation experiment of temperature rise faultidentification.COMSOL software was used to generate simulation data to support the simulation experiment of the temperature-field reconstruction.
In the construction of the physical simulation platform,we selected a power distribution cabinet test bed with a size of 1000 mm×600 mm×400 mm as the main body of the experimental platform; the heat source temperature was 150 ℃.Temperature sensing equipment included a Templin Yunke H60 infrared thermal imager with a standard temperature measuring range of -20 °C to 150 °C and an infrared image size of 640 × 480 pixels.To calibrate the temperature data of the infrared thermal imager, we used the wireless temperature sensor ETS-ApolO-2G4.The physical simulation platform built in this study is illustrated in Fig.5.
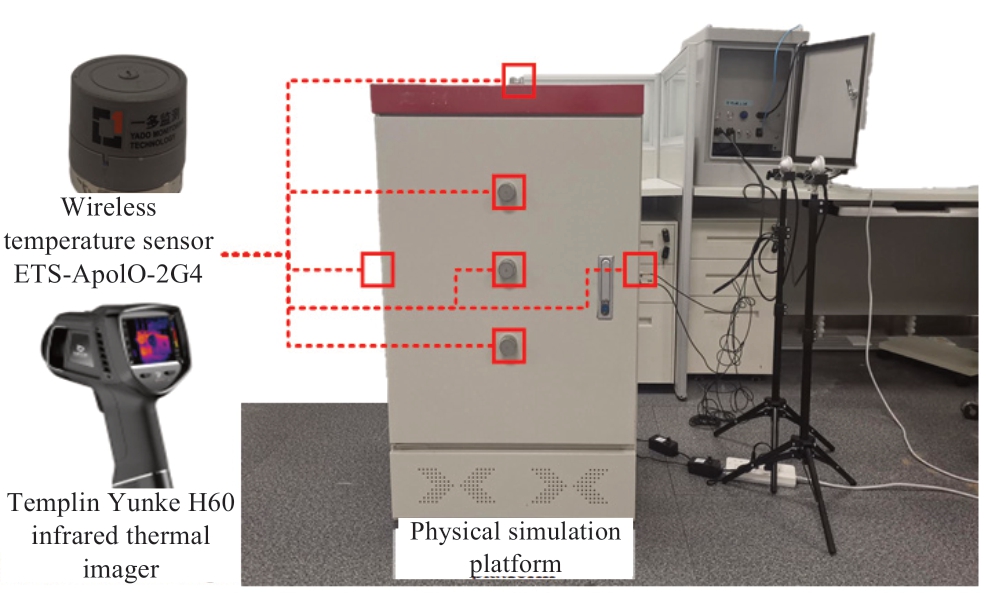
Fig.5 Physical simulation platform of distribution cabinet
Table 1 Main material parameters of distribution cabinet

In the COMSOL software simulation, a distribution model of the temperature-field was established.The free tetrahedron grid mesh subdivision was established, and the bus was set to the heat source of the abnormal temperature rise of components, through the solid heat transfer and heat transfer fluid coupling solving method for simulation and analysis of the steady-state temperature field of the distribution switchgear.Table 1 presents the primary material parameters of the power distribution cabinet.
4.2 Results analysis
In this study, a method for identifying the temperature rise fault of a non-interventional distribution cabinet based on tensor block-matching is proposed; the temperature-field information is reconstructed using two-stage data repair.As the accuracy of 3D temperature-field reconstruction is directly related to the accuracy of temperature rise fault-identification,this section analyzes the simulation experimental results of 3D temperature-field reconstruction and temperature rise fault-identification of the power distribution cabinet.
4.2.1 Reconstruction of 3D temperature field of power distribution cabinet
In the simulation experiment, 500,000 tensor block construction dictionaries of 7×7×7 pixels with the same material parameters and different heat source sizes were randomly generated.The corner of the low-temperature side of the tensor was denoised as (0,0,0), and the corner of the high-temperature side of the tensor was denoised as[??] to accelerate the rough repair efficiency of the threedimensional temperature field.The parameters of the initial 3D temperature field rough restoration model are presented
as follows: λ1=0.35,μ0 =0.85,c=1.007,ε1=20,λ1=0.15; the parameters of the initial 3D temperaturefield precision restoration model are μ2 =0.85,ρ=0.995,ε2 =0.05; the block size was initialized to 7×7×7 pixels.All simulation experiments were conducted in a Tensorflow environment using an Intel Core i7-8550U @1.99 GHz and NVIDIA Quadro P500 @ 1455 MHz.
Each axis of the three-dimensional temperature field was quartered; five two-dimensional temperature profiles were taken from the axes x, y, and z.Fig.6 compares the original data obtained from the COMSOL software simulation and the results of two-dimensional temperature profile reconstruction.
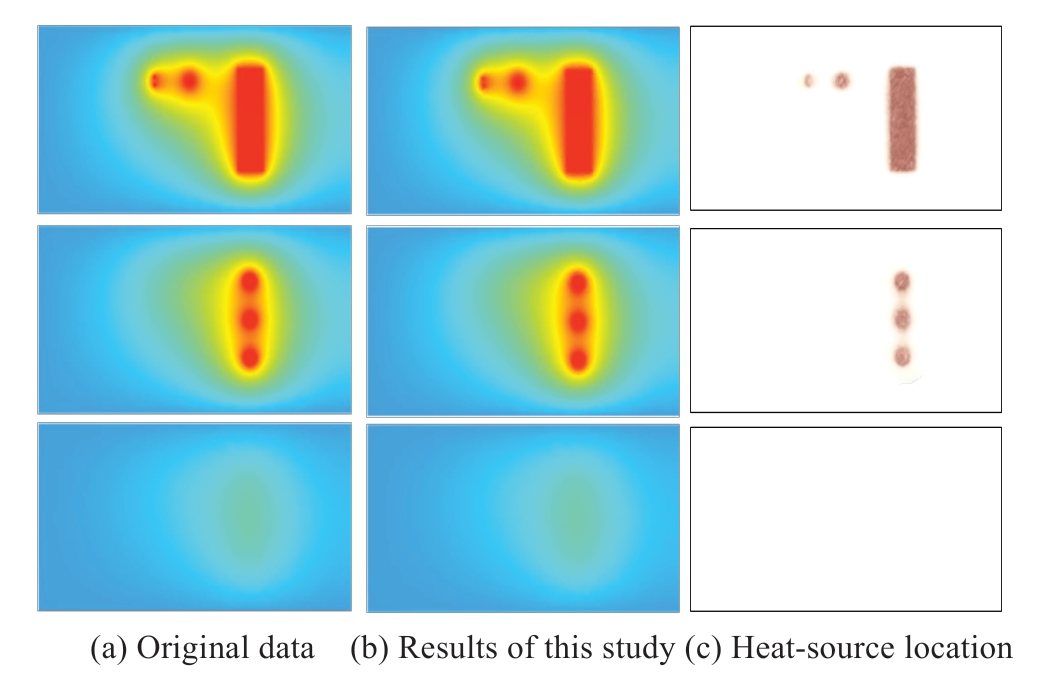
Fig.6 Diagram of 2D temperature-profile reconstruction
This study used the peak signal-to-noise ratio (PSNR)index to evaluate the rationality of the two-dimensional temperature profile.PSNR is defined based on the mean square error (MSE), and is calculated as

MSE refers to the subtraction, square, summation, and averaging of the pixel values at the same position in the two images.The larger the PSNR, the higher is the image quality.
Generally, for natural images such as temperature profiles, the higher the PSNR index value, the more consistent are the subjective evaluation habits.Focusing on random two-dimensional temperature profile images,we used the DnCNN [15, 16] and Shift-map [17, 18]algorithms as the control group to verify the effectiveness of the proposed method with different sampling methods and sampling rates.
Table 2 Performance comparison of 2D temperature-profile reconstruction
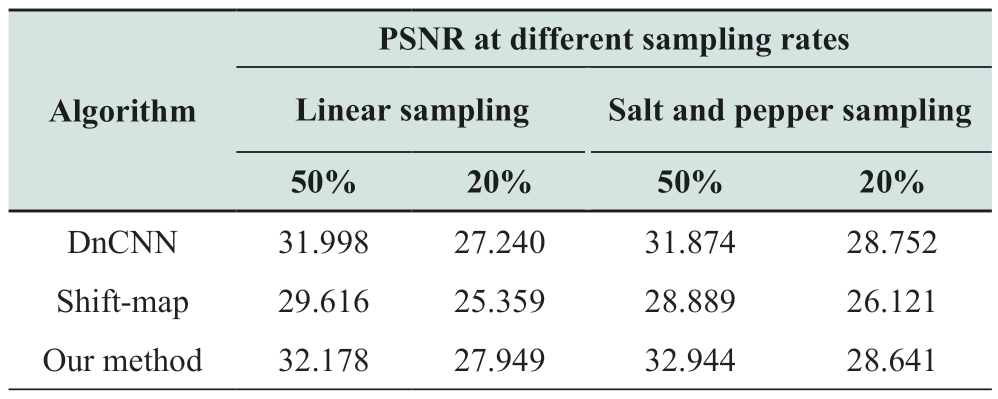
Table 2 indicates that the proposed method demonstrated better performance than the DnCNN and Shift-map algorithms in two-dimensional temperature-profile reconstruction, and the visual effect is more consistent with subjective evaluation rules.Salt-and-pepper sampling had a better reconstruction effect than linear sampling.

Fig.7 Diagram of 3D temperature-field reconstruction
Assuming that the 1000×600×400 power distribution cabinet was cold outside and hot inside, the 3D temperaturefield reconstruction simulation experiment was carried out using the power distribution cabinet temperature-field simulated by COMSOL software.Fig.8 shows the effects of the 3D temperature-field reconstruction.
In this study, the root-mean-square error (RMSE) was used to represent the reconstruction error of the temperature field.In general, the lower the RMSE index, the higher is the reconstruction accuracy.DnCNN [15, 16] and Shift-map[17, 18] algorithms were used as the control group to verify the effectiveness of the proposed method with different sampling methods and sampling rates.
Table 3 Performance comparison of 3D temperature-field reconstruction

From Table 3, compared with the traditional method,the temperature-field reconstruction error in this study was reduced by 82.42%.The data in Table 3 show that the proposed method performed better than the DnCNN and Shift-map algorithms in 3D temperature-field reconstruction.Salt-and-pepper sampling had a better reconstruction effect than linear sampling.In addition, as with most data repair algorithms, the size of the tensor block also influenced the results of tensor repair.In this study, we used an empirical selection method to determine the size of the tensor block.
4.2.2 Identification of power distribution cabinet temperature rise faults
In the simulation experiment, we used a physical simulation platform including a power distribution cabinet test bed with a size of 1000 mm × 600 mm × 400 mm.Assuming that the power distribution cabinet was cold outside and hot inside, the temperature distribution data of the front, rear, left, right, and upper surfaces of the cabinet housing were known.The parameters of the coarse and fine restoration models in the 3D temperature field were the same as those in the previous section.The temperature rise fault-identification model parameters were: ε3 =0.05;Initialize the block size to 7×7×7.All simulation experiments were conducted in a Tensorflow environment using an Intel Core i7-8550U @ 1.99 GHz and NVIDIA Quadro P500 @ 1455 MHz.Fig.9 compares temperature rise faultidentification in a non-interventional distribution cabinet.
In Fig.8(a), the small figure at the lower left corner shows the outside temperature information of the power distribution cabinet collected by the infrared thermometer.The heat source in the middle is larger in diameter and brighter in color than those on both sides, indicating that the reservoir is hotter than the reservoir on either side.Setting the clustering rules and temperature threshold, the small figure in the lower left corner of Fig.8(b) shows the heat source information calculated using the proposed method.The heat source in the middle has a higher temperature than those on both sides, consistent with the location of the faulty parts in the physical simulation.In addition,simulation experiments were conducted to verify the heat sources including the joint of the three-phase inlet bus bar,the contact point of the upper and lower plum contacts, and the contact point of the breaker contacts.The heat source temperature, temperature rise position, and air flow rate were the variables.Their values are presented in Table 4;200 different temperature rise conditions were simulated.
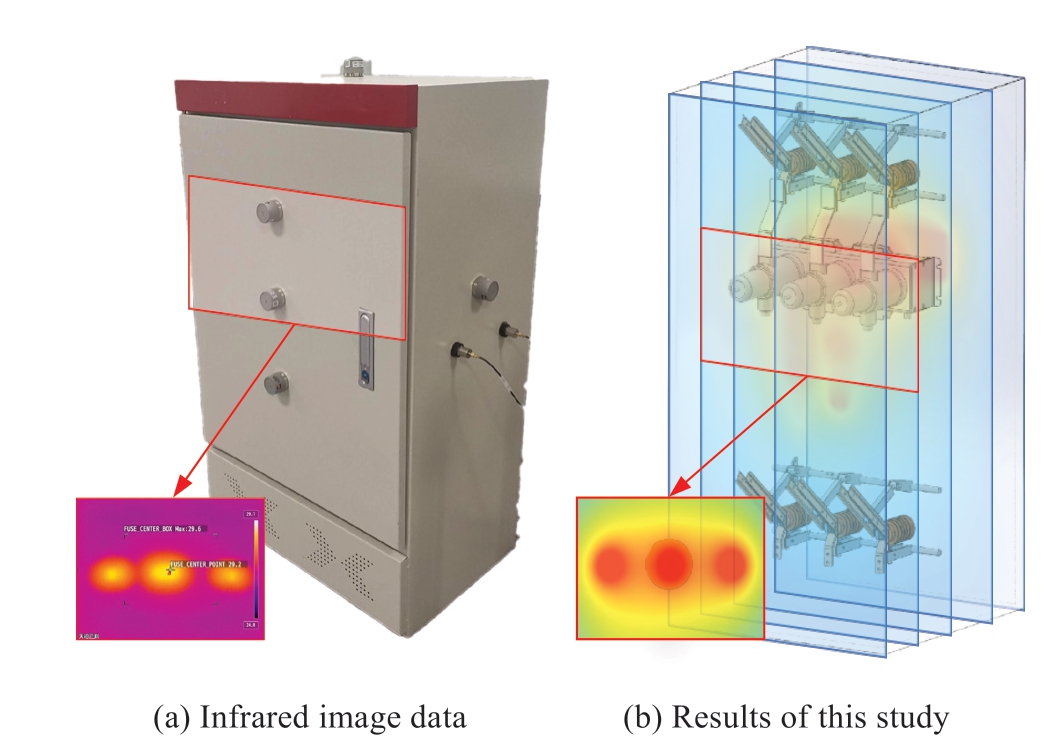
Fig.8 Diagram of non-intrusive temperature rise faultidentification of distribution cabinet
Table 4 Parameter value ranges in different working conditions

The proposed method was used to assess faults in different temperature rise conditions.For 50 independent repeated tests, the temperature rise fault-identification accuracy exceeded 86%, confirming the effectiveness of the proposed non-interventional temperature rise faultidentification method.It is more suitable for studying threedimensional reconstruction of the steady single physical field of the switch cabinet.It may be less applicable in threedimensional reconstruction of transient multi-field coupling.
5 Conclusions
In this study, a non-intrusive temperature rise faultidentification method for distribution cabinets based on tensor block-matching is proposed.The temperature field was reconstructed using a two-stage data repair concept with rough and fine repairs.Setting the clustering rule and temperature threshold, we found the location of the heat source in the three-dimensional temperature field and compared it with the location of the distribution cabinet components to identify a temperature rise fault.The main conclusions are presented as follows.
1) The temperature field formed in a continuous medium can be regarded as having continuous differentiability.The discretized adjacent tensor block has approximately 26 adjacent correlation coefficients.
2) This method is based on external temperature information of the distribution cabinet collected by an infrared thermometer and uses a three-dimensional tensor to reconstruct the temperature field of the distribution cabinet.
3) Compared with the traditional method, the error of the temperature-field reconstruction method was reduced by 83.87%.Non-intrusive temperature rise fault-identification was realized by comparing the positions of the heat source and distribution cabinet components.The simulation results showed that the accuracy of the temperature rise faultidentification was greater than 86%.
Acknowledgements
This paper is supported by the CEPRI project “Key Technologies for Sparse Acquisition of Power Equipment State Sensing Data”(AI83-21-004) and National Key R&D Program of China (2020YFB0905900).
Declaration of Competing Interest
We declare that we have no conflict of interest.
References
[1] Wang L, Wang R, Li X, et al.(2019) Simulation analysis on the impact of different filling gases on the temperature rise of C-GIS.IEEE Transactions on Components, Packaging and Manufacturing Technology, 9(10): 2055-2065
[2] Wang L, Wang R, Li X, et al.(2019) Temperature rise simulation of medium voltage cubicle type gas insulated switch-gear based on coupling of multi-physical fields, IEEE Access, 7(1): 45395-45404
[3] Li J, Man J, Zhou D, et al.(2015) Simulation analysis and experimental research on temperature distribution of metalenclosed high voltage switchgear handcart contactor.High Voltage Apparatus, 51(8): 74-79
[4] Du L, Ding Y, Shi W, et al.(2018) Simulation and test researches on influence factors of temperature rise in switchgear.Electrical Engineering, 19(9): 51-54, 59
[5] Wu J, Wang Z, Lu H, et al.(2020) Calculation of GIS temperature rise considering effect of gas flow and experimental study.High Voltage Engineering, 46(3): 815-823
[6] Peng T, Tang B, Zhao L, et al.(2021) Study on the temperature rise characteristics of medium-voltage switchgear under typical contact failure.High Voltage Engineering, 47(12): 4331-4345
[7] Wang Z, Wang R, Yao C, et al.(2021) Simulation study on the influence of forced convection heat dissipation on temperature rise of switch-gear.High Voltage Engineering, 47(3): 1064-1074
[8] Ma X, Wang L, Wang R, et al.(2022) Simulation study on temperature rise characteristics of medium voltage switchgear under fault conditions.High Voltage Engineering, 48(06): 2276-2282
[9] DongP, Yang X, Jia P, et al.(2022) Simulation and safety design of short circuit arc impact process in 10 kV high voltage switchgear.High Voltage Engineering, 48 (01): 328-336
[10] Mayboudi L S (2022) Practical heat transfer: using MATLAB and COMSOL.Mercury Learning and Information: 38-69
[11] Zhang X(2015) Fundamentals of thermal engineering.Higher Education Press: 46-74
[12] Gao Y, Liu B, Li T, et al.(2021) Study on heat conduction with heat source based on linear product boundary element method.Journal of Civil Engineering and Management, 38 (06): 95-99
[13] Cao F, Cai M, Tan Y, et al.(2016) Image super-resolution via adaptive p (0<p<1) regularization and sparse representation.IEEE Transactions on Neural Networks and Learning Systems,27(7): 1550-1561
[14] Cao F, Cai M, Tan Y (2015) Image interpolation via low-rank matrix completion and recovery.IEEE Transactions on Circuits& Systems for Video Technology, 25(8): 1261-1270
[15] Zhang K, Zuo W, Chen Y, et al.(2016) Beyond a gaussian denoiser: residual learning of deep CNN for image denoising.IEEE Transactions on Image Processing, 26(7): 3142-3155
[16] Wang Q, Zhang H, Zhang R, et al.(2021) EIT image reconstruction method based on DnCNN.IEEE International Instrumentation and Measurement Technology Conference.Glasgow, United Kingdom: IEEE, 1-5
[17] Svärm L, Strandmark P (2020) Shift-map image registration.20th International Conference on Pattern Recognition.Istanbul,Turkey: IEEE, 2341-2345
[18] Zhang Y, Xiao J, Hays J, et al.(2013) FrameBreak: dramatic image extrapolation by guided shift-maps.2013 IEEE Conference on Computer Vision and Pattern Recognition.Oregon, Portland:IEEE, 1171-1178
Received: 29 December 2022/ Accepted: 28 February 2023/ Published:25 June 2023
Yuanpeng Tan
tanyuanpeng@epri.sgcc.com.cn
Jie Tong
tongjie1@epri.sgcc.com.cn
Zhonghao Zhang
zhangzhonghao@epri.sgcc.com.cn
Qizhe Zhang
zhangqizhe@epri.sgcc.com.cn
Wenhao Mo
mowenhao@epri.sgcc.com.cn
Yingqiang Zhang
zhangyingqiang@epri.sgcc.com.cn
Zihao Qi
qizihao2021@163.com
2096-5117/© 2023 Global Energy Interconnection Development and Cooperation Organization.Production and hosting by Elsevier B.V.on behalf of KeAi Communications Co., Ltd.This is an open access article under the CC BY-NC-ND license (http: //creativecommons.org/licenses/by-nc-nd/4.0/ ).
Biographies

Jie Tong was born in Shanxi, China in 1983.He received his Ph.D.degree in computer system structure from Beijing University of Aeronautics and Astronautics in 2011.He is now working as a professor-level engineer in the Artificial Intelligence Application Department, China Electric Power Research Institute (CEPRI).His research interests include equipment online monitoring, condition assessment, and fault diagnosis.

Yuanpeng Tan was born in Tangshan, China in 1987.He received his Ph.D.degree in power information technology from North China Electric Power University in 2017.He is now working as a senior engineer in the Artificial Intelligence Application Department, China Electric Power Research Institute (CEPRI).His research interests include smart sensing, power equipment inspection,knowledge graphs, graph computing, and other technologies.

Zhonghao Zhang was born in Shanxi,China in 1991.He received his Ph.D.degree in electrical engineering from Tsinghua University in 2019.Since 2019, he has been an engineer in the Artificial Intelligence Application Department, China Electric Power Research Institute (CEPRI).His research areas include power equipment inspection, deep learning, and fault diagnosis.

Qizhe Zhang was born in Shanxi, China in 1995.He received his Ph.D.degree in electrical engineering from North China Electric University in 2022.Since 2022, he has been an engineer in the Artificial Intelligence Application Department, China Electric Power Research Institute (CEPRI).His research areas include power equipment inspection, fault diagnosis, and other technologies.

Wenhao Mo was born in Shijiazhuang, China in 1996.He received his Master’s degree in control science and engineering from Harbin Institute of Technology in 2020.Since 2020,he has been an engineer in the Artificial Intelligence Application Department, China Electric Power Research Institute (CEPRI).His research areas include power equipment inspection, deep learning, and image processing.

Yingqiang Zhang was born in Xingtai, China in 1990.He received his Master’s degree in computer architecture from NCEPU in 2017.Since 2021, he has been an engineer in the Artificial Intelligence Application Department,China Electric Power Research Institute(CEPRI).His research areas include deep learning, NLP, and electric power knowledge graphs.

Zihao Qi was born in Hubei, China in 1999.He received his Bachelor’s degree in computer science from Beijing University of Posts and Telecommunications in 2021.He is now pursuing an M.S.degree in the Artificial Intelligence Application Department, China Electric Power Research Institute (CEPRI).His research areas include power equipment inspection, deep learning, and fault diagnosis.
(Editor Yanbo Wang)
