0 Introduction
User-side flexible resources such as distributed power,energy storage, and adjustable loads have a small capacity,diverse parameters, and several types and points.Using load aggregators acting as “bridges”between users and the grid,flexible resources with several points, wide areas, and small individual capacities on the user side can be aggregated to achieve full-time viewable, measurable, and adjustable data aggregated into a whole to participate in peak regulation,frequency regulation, voltage regulation, standby, barrier elimination, energy trading, and other auxiliary services.Current approaches to electricity use optimization models optimize and regulate customer behavior to maximize household economy, comfort, and safe and economical grid operations.However, it is difficult to model or simplify the heterogeneity of flexible loads because of the wide variety of flexible load devices involved in power optimization and response and the highly differentiated parameters.Here, we proposed a multi-objective power usage optimization model for power users, which uses a id="generateCatalog_3" style="text-align: left; text-indent: 0em; font-size: 1.4em; color: rgb(195, 101, 0); font-weight: bold; margin: 0.7em 0em;">1 Optimization strategies for customer electricity consumption considering relevance of equipment consumption
1.1 Analysis of customer load regulation potential
Analyzing the optimization potential of customers is a prerequisite and basis for developing optimization management solutions.Factors such as price, temperature,operating conditions, and customer habits influence the potential for optimization.Therefore, it is difficult to accurately model customer loads and analyze their potential[2].Because historical electricity consumption data can visually reflect the electricity consumption patterns of customers, a id="generateCatalog_5" style="text-align: left; text-indent: 0em; font-size: 1.2em; color: rgb(195, 101, 0); font-weight: bold; margin: 0.7em 0em;">1.2 User load elasticity factor
The electricity consumption profiles of different electricity consumers vary because of the differences in their electricity consumption habits and production patterns, and their ability to adjust and migrate their loads varies.Here,a load elasticity factor is used to identify the flexibility and controllability of the temporal variation in a customer’s electricity consumption load [4].Regarding load curves,a large mean squared deviation implies that the similarity of the user’s historical electricity load is not great.User 3 chooses to use more periods for electricity consumption,and the load is irregular or has a certain degree of flexibility.Hence, the load is more adjustable [5].The load elasticity of this category of customers is relatively high and can be optimized through market price signals from the power company, as well as incentive mechanisms to guide optimization.Using one month of historical daily load data as the basis, the magnitude of the temporal elasticity of the load curve is measured using the mean squared deviation of the daily load curve.The expression for the load elasticity coefficient of the customer at each period is shown in the formula below.

Where E(t) is the load elasticity coefficient of the customer’s load at time t.Pave(t) is the normalized average electricity consumption for period t in a month.
1.3 Customer power optimization potential assessment
Suppose a customer has time elasticity at a certain time.In that case, it implies that the customer can choose to shift the peak electricity consumption to the valley or flat period according to the tariff policy at that time.On the contrary,if the customer has no time elasticity or little elasticity, the customer’s electricity consumption at that time is more regular or fixed.It cannot shift electricity according to the time-sharing tariff or can shift very little electricity.Simultaneously, the potential for optimization is also affected by the amount of power and the load factor of the current load in each period [6].The higher the load factor,the higher the load capacity that can be shifted during peak hours, and the higher the average cost of electricity, the stronger the customers’willingness to be guided by tariff incentives.The lower the load factor, the higher the load capacity that can be added during valley hours.Therefore,the potential for customer optimization is influenced by two key factors: the capacity for peak load shifting and the capacity for valley load carrying.Both factors are influenced by the current peak and valley load consumption and load elasticity factor, expressed as follows:

CrF and GrG are the migration capacity of the peak hour load and the load-carrying capacity of the valley hour load on Day R, respectively; TF is the set of peak electricity hours; TG is the set of valley electricity hours; Prmax is the original maximum load value of the daily load curve on Day r; (Prmax-Pr(t)) is the difference between the original peak load and the load of valley electricity hours, which is set as the remaining load-carrying capacity and cannot increase.The maximum daily load peak after electricity consumption optimization can be avoided to increase the capacity pressure on the grid [7].The migration capacity of the peak hour load is determined by the load volume of each peak hour and the load elasticity of the hour.The larger the load volume and the higher the load elasticity, the larger the migration capacity of the peak hour load.Similarly,the higher the remaining power in the valley hours, the higher the load elasticity and load-carrying ability in the valley hours.Finally, the potential for optimizing electricity consumption is determined by the smaller of these two capacities, as electricity optimization usually does not change the total amount of electricity used, and the load that can be relocated during peak hours is eventually relocated to valley hours.Therefore, based on the load elasticity and the current load curve, the following indicator of the potential for optimizing electricity can be defined, i.e., the potential for optimizing electricity on Day r is expressed below.Cr0 is the electricity consumption optimization potential on Day R.

1.4 Identification of customer equipment power consumption correlation based on mutual relationship number
Most power users use multiple devices.Users have different needs for different devices, and there is also a certain correlation between the use of different devices,mainly in the electricity connection and the load curve,owing to the correlation of the production process, which results in a constant proportion of power consumption for each equipment over a certain period.Because the production process can take several days or even longer,this linkage does not constrain the optimization of daily electricity consumption.Another type of correlation is that different devices have a close time connection, some of which are used in conjunction with each other.Hence, they overlap in time, while others are used successively, with a relative displacement in time.Suppose the correlation between these devices is not considered in optimizing electricity consumption.In that case, the optimized load of each device will operate independently, which will significantly impact the comfort of users and even make it impossible to achieve the optimization plan [8].Users may also reject a more economical optimization strategy because of the loss of comfort when making decisions.In the study of multi-objective power optimization strategies for electricity users, the optimization strategy meets the actual power needs of users.It is feasible only by considering the relevance of each piece of equipment used by the users.
The type, quantity, and relevance of electricity consumption varies from customer to customer.Power companies cannot model the relevance of each customer’s equipment usage because customers are typically unable to accurately describe the connection between equipment usage.Therefore, a style="font-style: italic;"> Hij is as follows:
T is the time shift interval, which is generally considered as the collection interval of electricity consumption data;Pi(t) and Pj(t) are the daily load curves of the ith and jth devices of the household, respectively; x is the time shift of the load sequence; H(i, j, x) is the correlation coefficient of the load sequence when the time shift is x; and H(i, j, x) ∈[0,1].The correlation coefficient is the correlation coefficient after the time shift of the two power-load series,as shown in Fig.1, where the time shift corresponding to the maximum value of the correlation coefficient represents the time lag (overrun) between the power consumption of the different devices.
The correlation number quantifies the degree of correlation between different types of customer equipment usage.The correlation coefficients obtained using singleday electricity consumption data were random, and those obtained using multi-day electricity consumption data were discrete, which cannot directly characterize customers’real electricity consumption habits.Based on the interrelationship clusters obtained from multi-day electricity consumption data, the cohesiveness of the interrelationship clusters was measured using a silhouette to identify the significance of the degree of interrelationship between each piece of equipment and the real equipment usage habits of customers [10].The silhouette determines cluster cohesion and separation by analyzing the similarity of each sample to the other samples in the cluster and the similarity of that sample to the samples in the other clusters.Clusters of electricity consumption interrelationships were obtained for Devices i and j for consecutive days of load data.The silhouette can be expressed as follows:
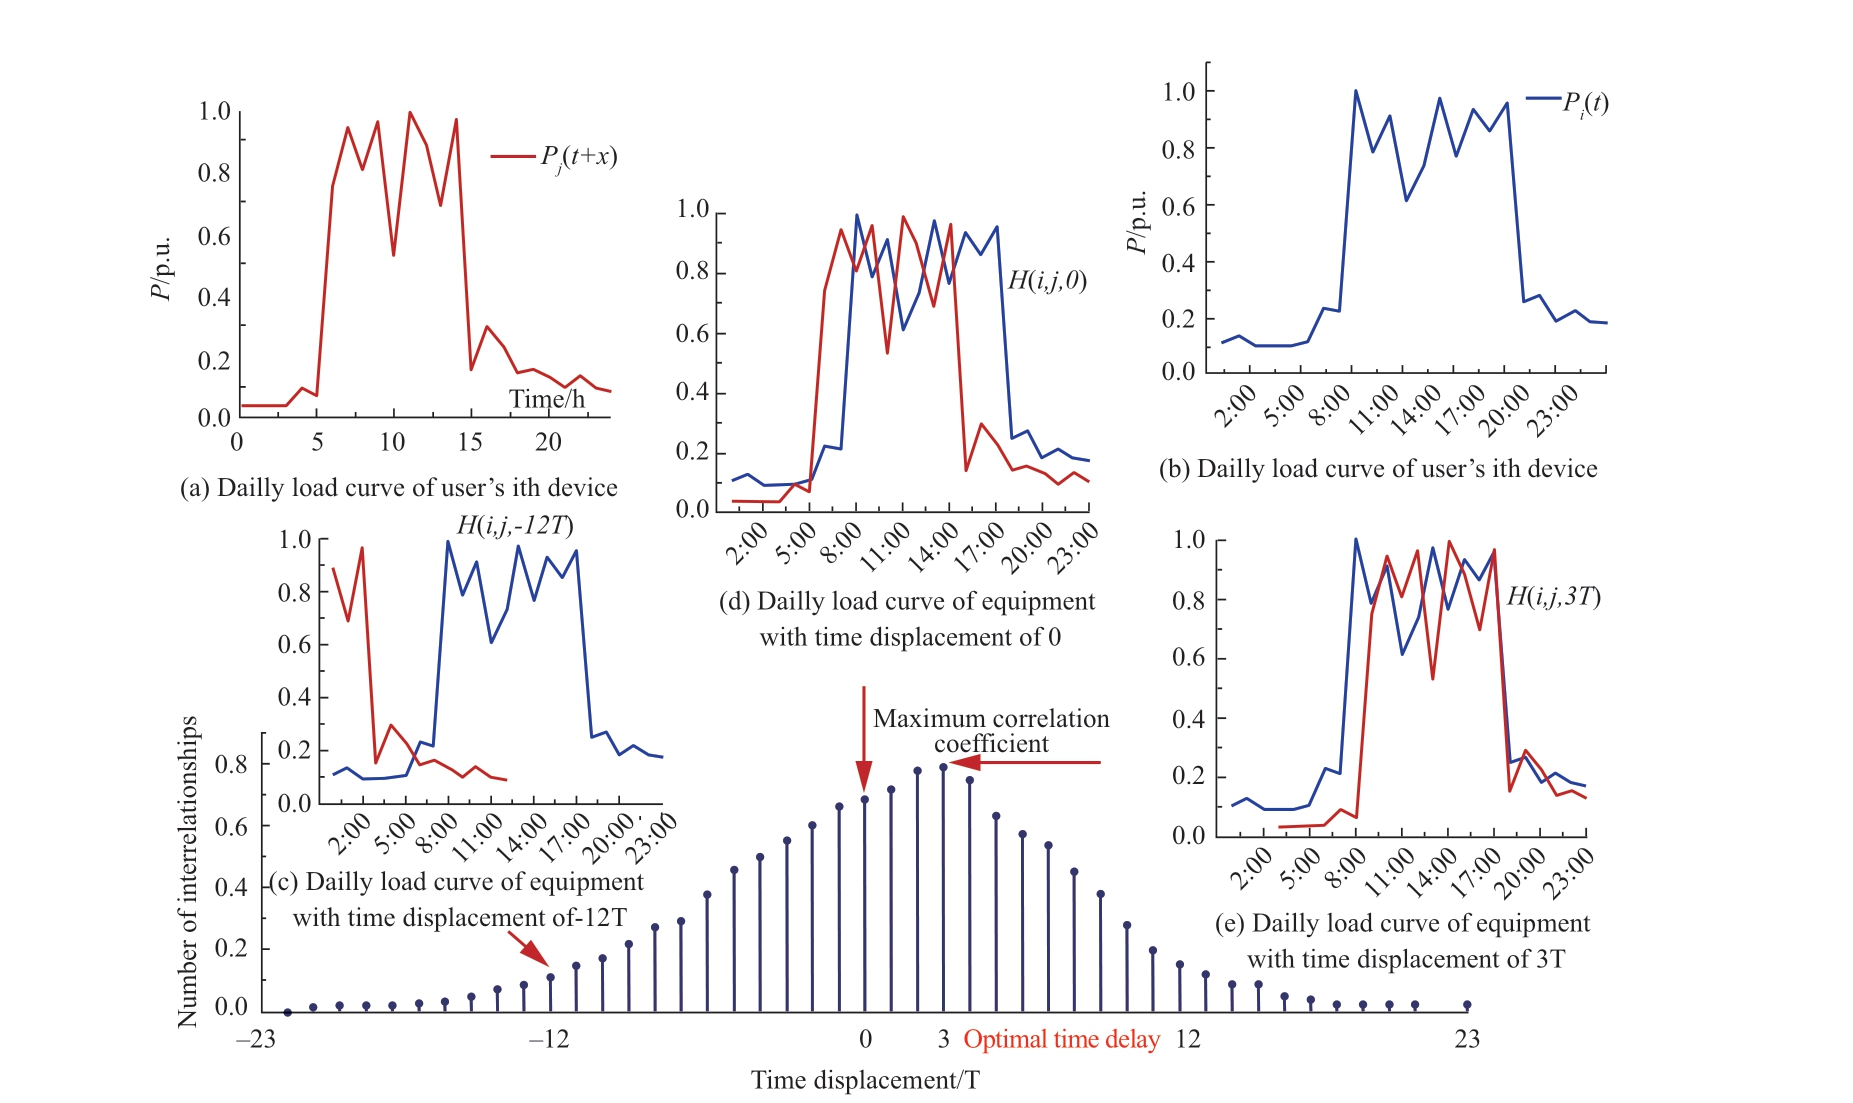
Fig.1 Load time shift and cross-correlation coefficient
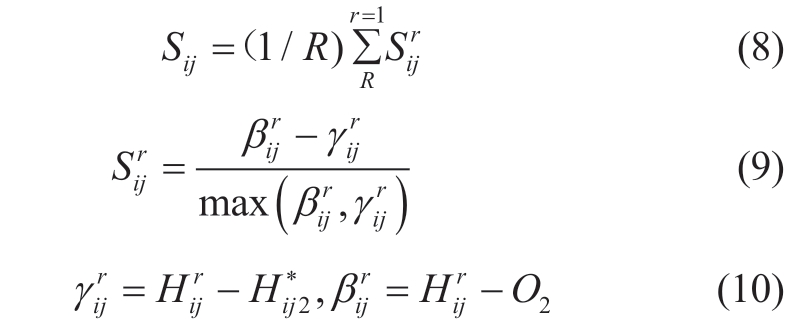
Sij is the silhouette of the cluster of interrelationship numbers of electricity consumption curves of Equipment i and j;  is the silhouette of the interrelationship between Devices i and j on Day r in the cluster; Hij* is the cluster average interrelationship number, whose value is the arithmetic mean of Hij; O is a sequence of length N with all elements zero; γijr is the Euclidean distance between the interrelationship number and the cluster average interrelationship number on Day r for Devices i and j; βijr is the Euclidean distance between the number of power interrelationships of Devices i and j on Day r and the zero sequence (i.e., the coordinate axis).When the distance within the cluster of interrelationships was smaller and the distance from the axis was larger (i.e., the larger the interrelationship value), the silhouette was larger, indicating that the user’s habit of using the two devices together was more significant.Furthermore, the average number of cluster interrelationships Hij* is the standard interrelationship number of Devices i and j.The multi-device power usage correlation matrix and its silhouette matrix for the ME devices of a user are as follows:

2 Multi-objective optimization model for customer electricity consumption considering equipment electricity consumption correlation
2.1 Tariff cost-based economic objectives for electricity consumption optimization
Grid companies typically use tariff incentives to encourage customers to participate in peak and valley reductions to improve the safety and economy of grid operations.The most common tariff incentive is a peakvalley (time-sharing) tariff [11].By appropriately adjusting the tariffs for peak and trough consumption, customers can be guided to shift some of their peak consumption to the trough, thereby reducing the pressure on the grid during peak hours and increasing the consumption rate of renewable energy, such as wind and light, during the trough.Under the peak-to-valley tariff, electricity consumers choose a more economical way to use electricity to reduce their electricity bills.Therefore, the total cost ratio of electricity bills before and after electricity optimization is used in this section, thereby reducing the pressure on the grid during peak hours and increasing the consumption rate of renewable energy, such as wind and light, during low hours.With the incentive of peak and valley (time-sharing) tariffs,electricity consumers will choose a more economical way of using electricity to reduce electricity expenditure, as shown in the equation below.
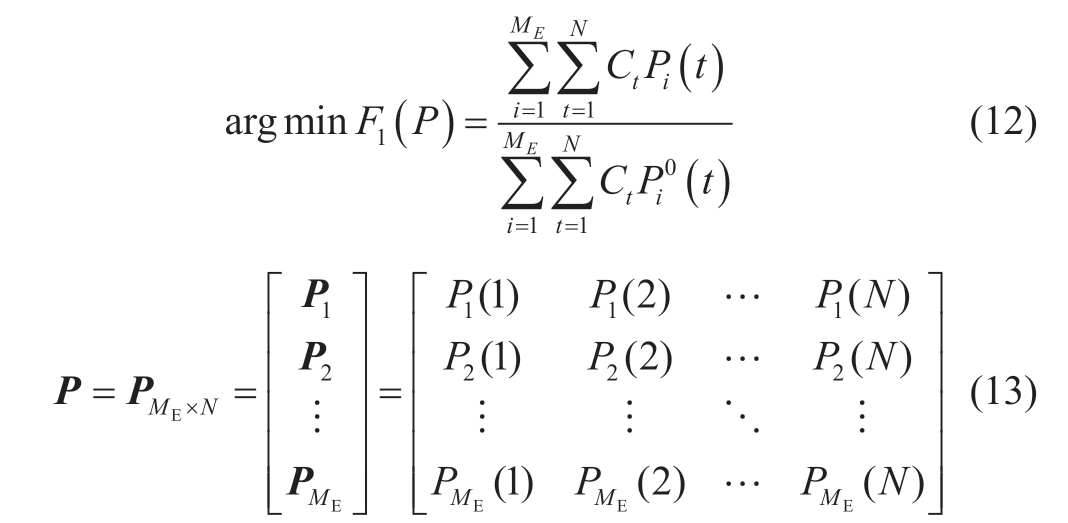
Where Pi0 (t) denotes the initial electricity consumption of Device i at time t.Pi (t) is the optimized electricity consumption of Device i at time t.Ct is the electricity price at time t.This section uses the peak and valley tariffs implemented in a province as a reference, as presented in Table 1.
Table 1 Peak valley price of a province

2.2 Comfort objectives for electricity optimization based on electricity consumption offset and equipment relevance
The purpose of using electrical equipment is to meet their production and living needs.When using electricity,they consider the cost of electricity and their comfort with electricity [12].User 3 refers to the impact of changes in electricity consumption plans or habits on users and is closely related to the extent to which the operating hours of electrical equipment are adjusted.The more the electricity optimization program adjusts the running hours of the equipment, the lower the user’s comfort with electricity,and the less it adjusts the running hours of the original equipment.The closer the electricity usage is to the original habits, the higher the user’s comfort with electricity.Customers can choose their electricity consumption methods without targeted electricity optimization to fully meet their needs when their comfort level is at its highest.
When optimizing electricity management, customers will only accept optimization if they believe that the cost savings will be sufficient to compensate for the loss of comfort caused by changes in electricity consumption [13].Therefore, the original electricity consumption load curve is used as the most comfortable way for the customer to use electricity, and the offset ratio of the optimized electricity consumption curve to the original curve is defined as one of the customers’electricity comfort objectives, which is expressed as follows:

In addition, owing to the limitations of users’electricity consumption habits or production processes, the use of certain equipment has a certain degree of electricity correlation.The smaller the change in the number of interrelationships between different pieces of equipment before and after optimization, the smaller the impact of optimization on the user’s electricity consumption habits or production processes [14].Therefore, the change in the interrelationship between the electricity consumption curves of each device before and after optimization is taken as the second comfort target for customer electricity optimization to avoid disrupting the interrelationship between the use of each device during optimization.The expression is shown in the formula below.
Where Hij is the number of interrelationships in the optimized equipment electricity consumption profile [15].The greater the number of interrelationships between the two devices, the more significant the user’s habit of using the two devices together, and the greater the impact on the user’s comfort when the number of interrelationships changes.Therefore, the contour coefficient is used as the weight of the change in the number of interrelationships.
3 Multi-objective optimization model for customer electricity consumption
The electricity consumption optimization model attempts to optimize the economy and comfort of the customer’s electricity consumption, considering the customer’s demand and the results of the load elasticity coefficient and equipment consumption correlation, based on historical load data identification.In addition, the multi-objective optimization of electricity consumption must satisfy both power and electricity constraints [16].The power constraint implies that the operating power of the equipment does not exceed its maximum capacity with the historical maximum load of the equipment at its capacity limit.Power constraint refers to the fact that customers generally tend to adjust their load to other periods without being compensated for additional power cuts owing to their production and living needs rather than directly cutting back [17].Therefore, it is considered that the daily electricity consumption before and after optimization should remain constant, and the corresponding expressions for the operating power and electricity constraints are shown in the formula below.

Pimin and Pimax are the maximum and minimum power of Equipment I, respectively.α is the upper limit of the power deviation ratio, here α = 0.02.In summary, with the total cost of electricity expenditure, minimum power deviation,and minimum change in equipment power consumption correlation as the optimization objectives, the constructed multi-objective optimization model for electricity consumption is shown in the equation below.
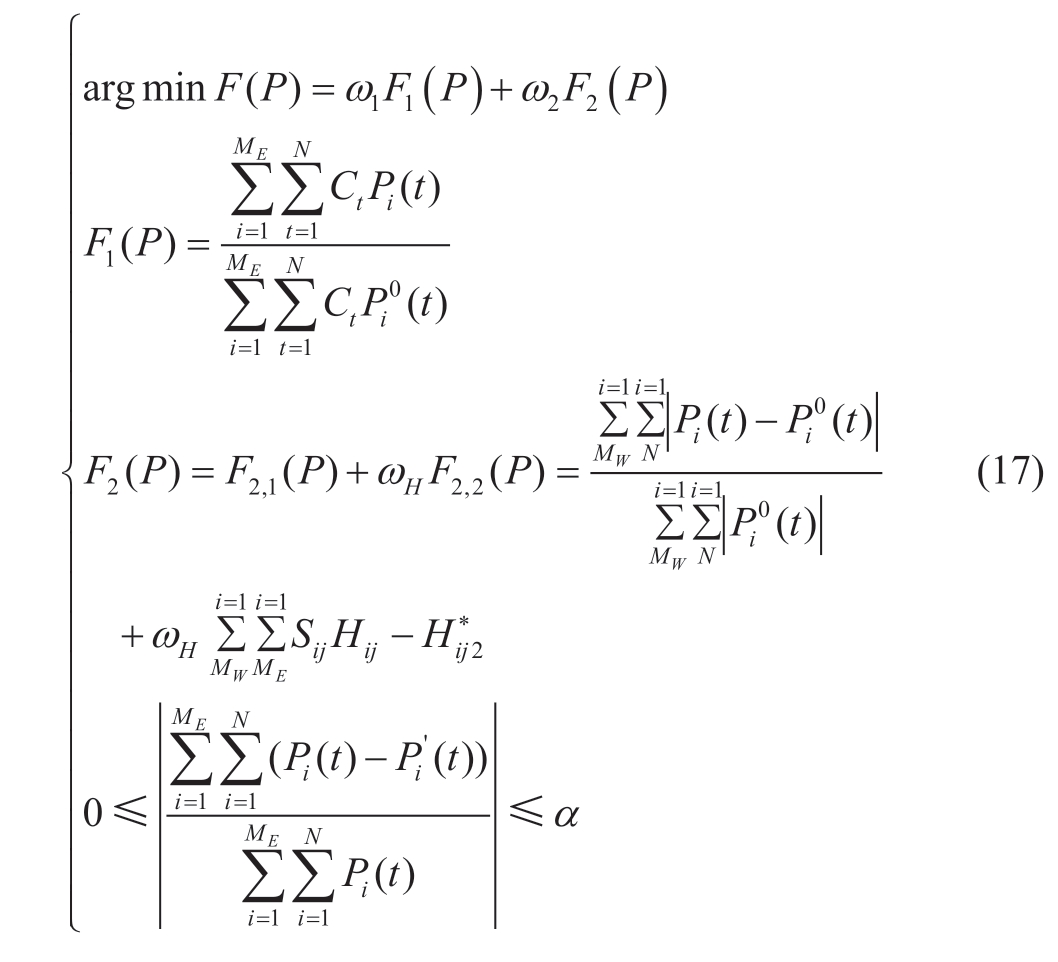
Where ω1 and ω2 are the weighting coefficients for the economy and comfort objectives, respectively, both taken as 0.5 here.DH is the electricity consumption relevance weighting coefficient used to determine the weights of the electricity consumption offset and relevance in the comfort objective function.Based on the user-side electricity consumption data, different users’potential for electricity consumption optimization is assessed to determine the target users for electricity consumption optimization management.The electricity consumption data of their main electricity consumption equipment is collected and analyzed.The final electricity consumption optimization results are generated for users’reference to realize user-side electricity consumption management, with the following main steps[17].First, based on the historical load data of customers from the electricity consumption information collection system, the load elasticity coefficient of customers was analyzed, and their electricity consumption optimization potential was evaluated.Second, for customers with a high potential for electricity consumption optimization, the load of their main electricity-consuming equipment was collected and analyzed using sub-metered or non-intrusive load identification, and the correlation of the electricity consumption of each piece of equipment was identified.Third, the real-time load data of users are collected and uploaded to the system or distributed management equipment for power consumption optimization analysis,and the optimal power consumption mode is pushed to users for reference [18].The main steps are as follows.First, based on the user’s historical load data, analyze the user’s load elasticity coefficient and evaluate its power consumption optimization potential.Second, for users with high power consumption optimization potential,adopt the means of submeter or non-intrusive load identification to collect and analyze the load of their main power equipment and identify the correlation of power consumption of each user’s equipment.Finally, collect the user’s real-time load data, upload them to the system or perform power consumption optimization analysis in the distributed management equipment, and push the optimal power consumption mode to the users for their power consumption reference [19].
4 Example analysis
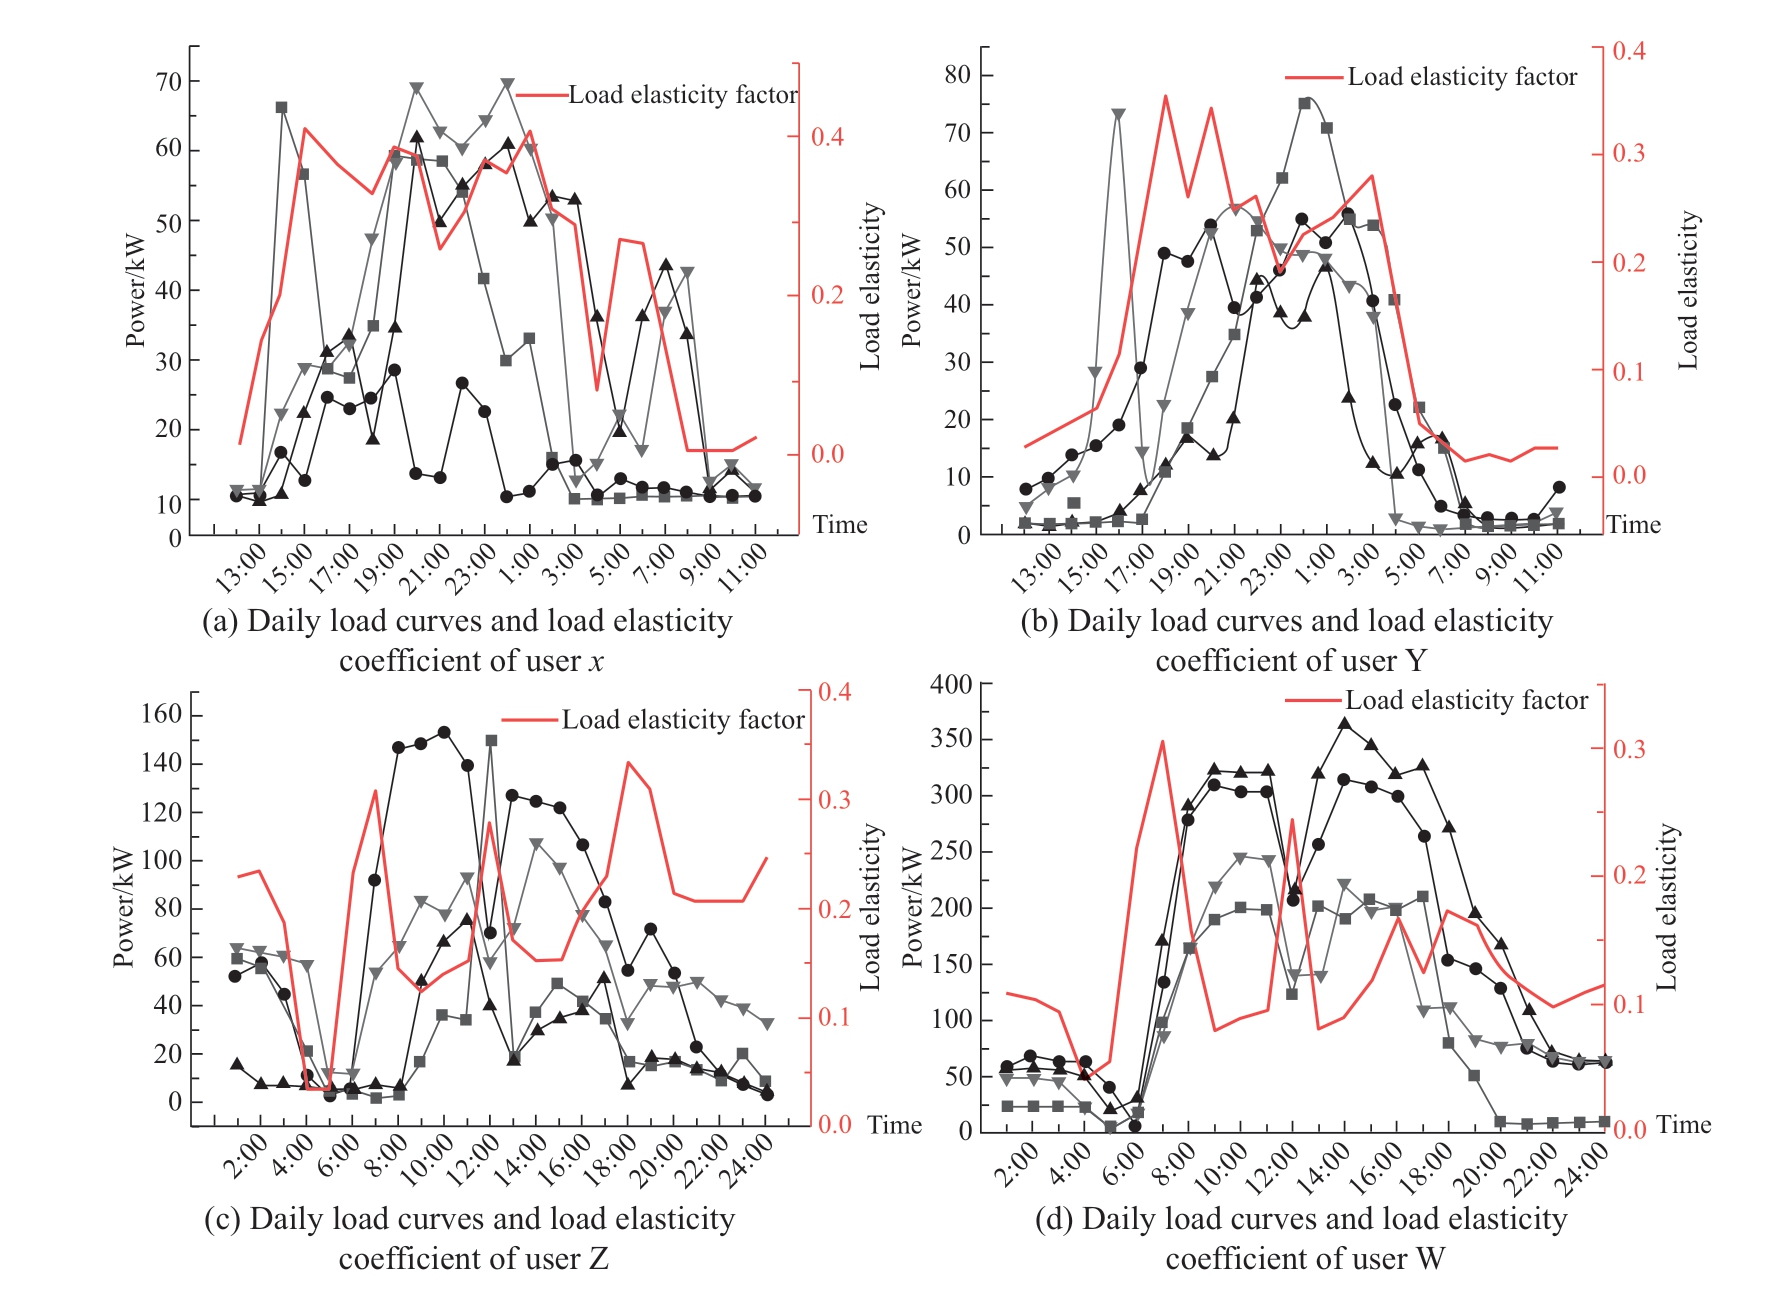
Fig.2 Daily load curves and load elasticity coefficient of four consumers
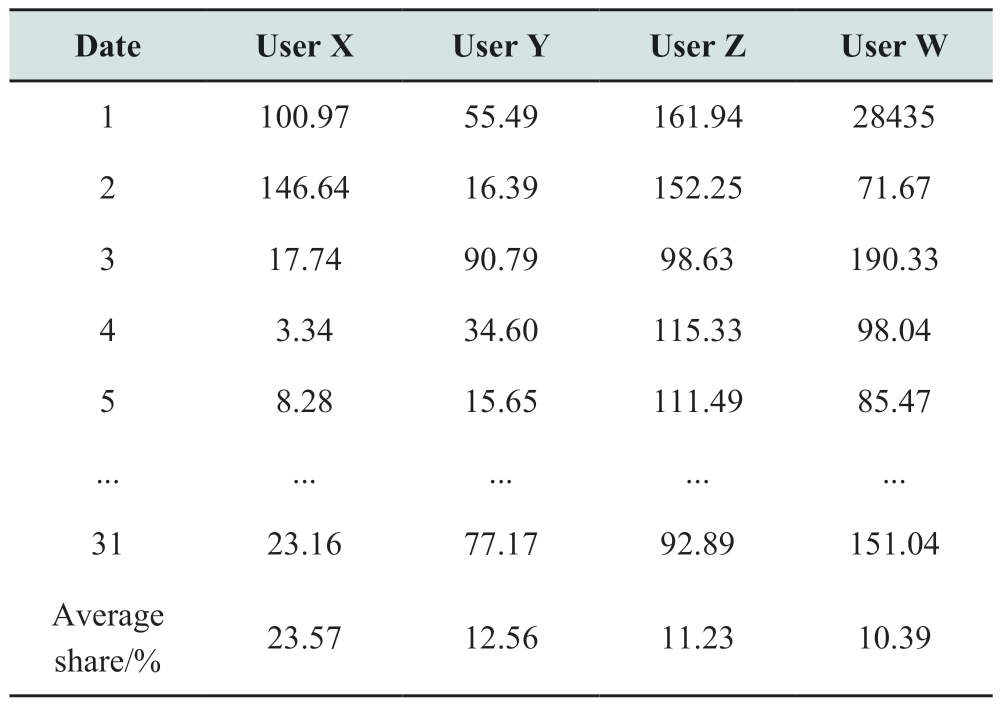
Four small businesses in a city were selected as examples of calculations, where Users X and Y are nighttype loads and Users Z and W represent daytime-type loads; complete load data were collected for all four users in a month.First, the load elasticity coefficients of the four users were analyzed and identified based on their load data.The daily load curves and load elasticity coefficients for the four customers are shown in Fig.2.The nighttime load was analyzed from 12:00 a.m.to 12:00 p.m.the next day for the convenience of analysis such that the electricity consumption curve was as continuous as possible.The load elasticity coefficients of User X are larger in each period,caused by the start-stop time of its load and more changes in the shape of the electricity consumption curve, indicating that the user’s electricity consumption is less regular and more flexible.The overall load elasticity factor of User Y is slightly lower than that of X.Its electricity load is concentrated at night from 8:00 to 5:00 the next day, and the load elasticity coefficients of Users Z and W are smaller than those of X and Y.Because the electricity consumption loads of Z and W are more regular, the load elasticity coefficients of C and D are significantly smaller than those of A and Y [20].Because the electricity consumption of Z and W is more regular, the electricity consumption is more stable during working hours; therefore, the periods with higher load elasticity coefficients are concentrated in the start-stop periods.Furthermore, based on the load elasticity curve, the potential value of electricity consumption optimization for customers was evaluated, and the results are presented in Table 2 [21].
The optimization potential of User X was larger, with a theoretical value of more than 20% of the total electricity consumption, whereas the optimization potential of the remaining three users was smaller (approximately 10%).Combining Table 1 and the elasticity coefficient diagram,we can see that the load of User Y is mainly the load in the valley hours; hence, the peak hour electricity consumption that can be migrated is smaller, resulting in a smaller electricity consumption optimization potential; a load ofUsers Z and W is mainly the peak hour load, but this User D does not have the habit of working at night.Hence, the load elasticity in the valley hours at night is smaller, and a large amount of peak-hour electricity consumption cannot be migrated to the valley hours.In contrast, User X has a large load elasticity coefficient and muscular load flexibility and also has the characteristic of producing electricity at night during the valley hours.Thus, it can migrate the peak hours to the valley hours and realize the improvement of the electricity consumption economy [22].
Table 2 Electricity consumption optimization potential of the four customers/kWh
4.1 Results of equipment electricity consumption correlation analysis
Because the potential of electricity consumption optimization of User X is large, the electricity consumption data of User X were used as an example to analyze the electricity consumption correlation of the equipment and perform electricity consumption optimization analysis [23].The user has three main electronic devices: A, B, and C.The number of electric interrelationships among the three devices is shown in Fig.3, and the contour coefficients of the electric interrelationships of the three devices were Sab=0.756, Sac=0.814, and Sbc=0.792 [24].The time shift corresponding to the maximum value was greater than 0.7.Combining the results of the interrelationship number and its contour coefficient, the electricity correlation among the three devices is significant and should be considered in electricity optimization.These correlations should be considered in power optimization [25].

Fig.3 The number of interrelationships between the electrical loads of each piece of equipment of User X
4.2 User multi-objective optimization results
The electricity consumption data of User X for the first ten days of the month were selected for the optimization analysis.The electricity consumption curves before and after optimization of this customer on the 2nd, 4th, and 7th days are shown in Figs.4-6, where Fig.4b shows the optimization results without considering the electricity consumption correlation (ωH=0), and Fig.4c shows the optimization results considering the electricity consumption correlation (ωH=1).The optimization results for ten consecutive days are shown in Table 2.
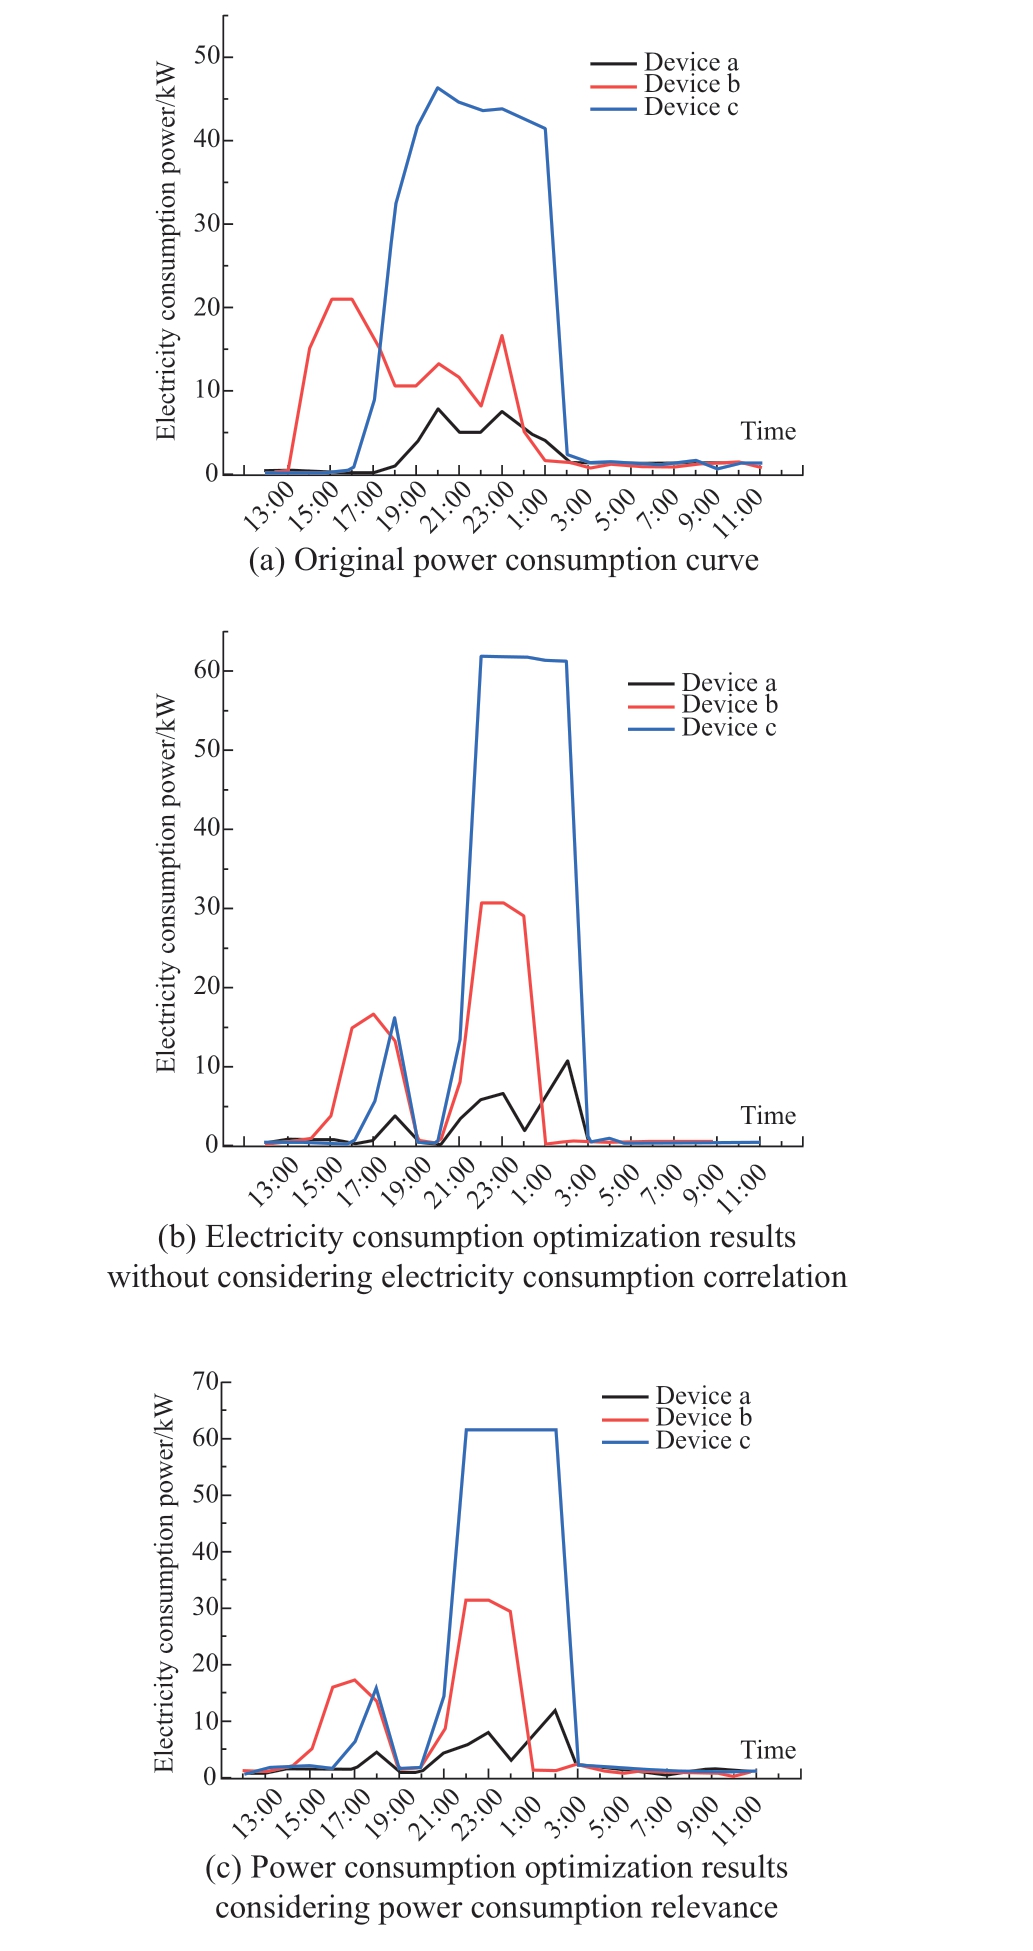
Fig.4 Electric consumption optimization results of User A (2nd)
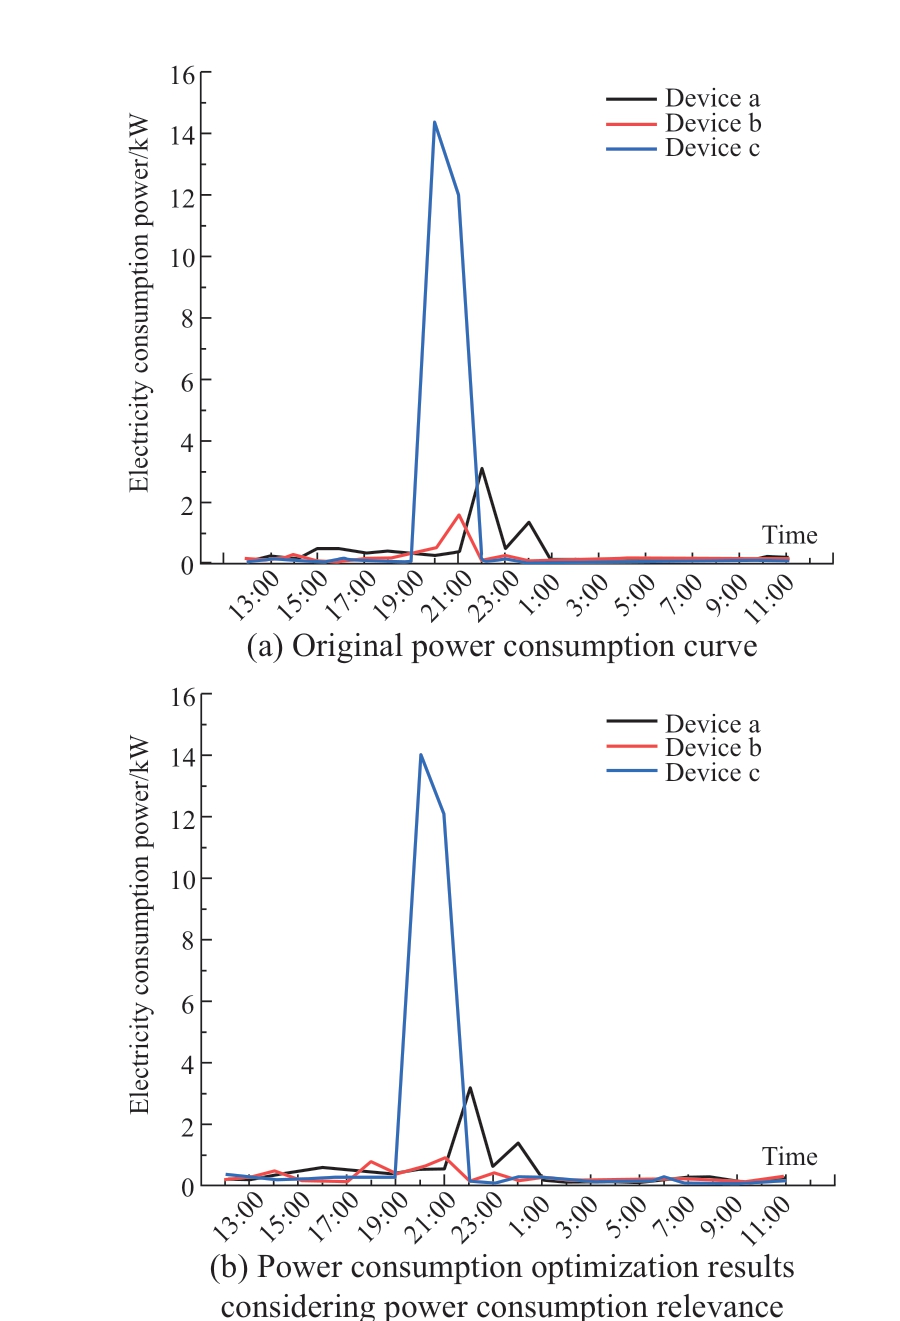
Fig.5 Electric consumption optimization results of User A (4th)
According to Fig.4, the user’s electricity consumption load on the 2nd day is larger and concentrated between 18:00-2:00 of the next day, and the peak electricity consumption accounts for more, while the optimized electricity consumption schemes in Figs.4b and 4c both choose to avoid the peak in the peak tariff period of 19:00-21:00 and continue the high load after 21:00 to improve the user’s electricity consumption economy.Comparing Figs.4b and 4c, without considering the electricity consumption correlations of different devices,all the electricity consumption of Device A is relocated to the valley hours, and the optimized three devices cannot be adjusted according to the original usage coordination relationship.After considering the device consumption correlations, a part of the electricity consumption of Device A is retained in the peak hours based on the correlations of each device determined by the standard mutual relationship number in Fig.3.After considering the correlations of the equipment, a portion of the load of Equipment A is reserved for peak hours to match the electricity consumption of Equipment B and C from 15:00 to 18:00.Thus, the optimization scheme considering the correlations of the equipment is more in line with the actual electricity demand of customers.According to Fig.5, the user’s electricity consumption on the 4th day is less.The optimized electricity consumption curve is the same as the original electricity consumption curve, which indicates that this model chooses to target comfort and reduce load migration as much as possible when the user uses less electricity.According to Fig.6, although the user’s electricity consumption on the 7th day is larger, the user has avoided the peak tariff period of 19:00-21:00 in the original electricity consumption; thus, in the electricity consumption optimization, only a small amount of peak hour electricity is shifted to reduce the electricity bill while maintaining the user’s comfort as much as possible [26].

Fig.6 Electric consumption optimization results of User A (7th)
Comparing Fig.2 and Fig.3, it can be seen that without considering the electricity consumption correlation of different equipment, all the electricity consumption of device a is relocated to the valley hours and the optimized electricity consumption of the three equipment cannot be adjusted according to the original usage relationship, after considering the electricity consumption correlation of the equipment, based on the electricity consumption correlation of each equipment determined by the standard mutual relationship number in the figure, part of the electricity consumption load of the device a is kept in the peak[27].The optimized solution, which takes the equipment correlation into account, is, therefore, more in line with the actual electricity demand of the customer.From Fig.4 and Fig.5, it can be seen that the user’s electricity consumption on the 4th day is less, and the optimized electricity consumption curve is the same as the original electricity consumption curve, indicating that the model chooses to target comfort and reduce load migration as much as possible when the user uses less electricity [28].
Table 3 infers that the model’s main objective in optimizing the electricity consumption of this customer on Days 1, 2, 6, 9, and 10 is the economy, with more peak-hour electricity being shifted to the valley hours, thereby resulting in poorer comfort for the customer but greater savings in electricity costs.For the remaining days, owing to lower electricity consumption or higher economy of the original electricity consumption, the model’s objective resulted in less shifting of electricity and lesser savings in electricity costs but better comfort [29].Simultaneously, the results of the electricity saving benefit and electricity shift rate achieved by electricity optimization are consistent with the results of the load elasticity-based electricity optimization potential analysis, indicating that the electricity optimization potential analysis method proposed here can be used as a basis for determining whether a customer has the potential for electricity optimization, and thus guide further electricity optimization management [30].
Table 3 Electricity consumption optimization results for Customer 1 for ten consecutive days

5 Conclusion
This study proposed a multi-objective power consumption optimization model that considers the correlation degree of the power consumption of equipment to address the problems of customers’lack of knowledge of their power consumption and low levels of optimization management.The proposed multi-objective power consumption optimization model considered customers’economic and comfortable power consumption and the relevance of customers’equipment power consumption,which can reduce the cost of power consumption while avoiding a decline in customers’comfort.The analysis of the actual customers’electricity consumption data shows that the results of the load elasticity-based electricity optimization potential analysis are consistent with the economic benefits of the electricity optimization scheme,indicating that the proposed electricity optimization potential analysis method can be used as a basis for determining whether customers have electricity optimization potential.Based on this, the results of power optimization that identify and consider the correlation of equipment power consumption do not change the correlation of power consumption among equipment and are therefore more consistent with the actual power demand of customers and are also more feasible.Furthermore, the analysis based on the actual customer load data shows that the proposed optimization potential analysis method can initially determine whether the customer has the potential to optimize electricity, which can be used as a basis for further guidance in electricity optimization management.The proposed optimization strategy identifies and considers the equipment power consumption correlation.Hence, it is more consistent with the actual electricity demand of the customer.The proposed power consumption optimization strategy identifies and considers the equipment power consumption correlation degree; therefore, it is more in line with the actual power demand of customers.
Considering the stochastic nature of customer electricity consumption in practice, subsequent studies will consider the interrelationship among different loads and how relevant features are reflected in the model.Owing to the increasing demand for grid peaking and new energy consumption, subsequent research will study a real-time power consumption optimization strategy based on two-way grid-user interaction to provide more accurate and flexible optimal power consumption for power users.
Declaration of Competing Interest
We declare that we have no conflict of interest.
References
[1] Bao H, Guo S, Mo J, et al.(2023) An analysis method for residential electricity consumption behavior based on UMAPCRITIC feature optimization and SSA-assisted clustering.Energy Reports, 9(S3): 245-254
[2] Sayyad N, Hadi Q, Kazem Z, et al.(2014) Large consumer electricity acquisition considering time-of-use rates demand response programs.Arabian Journal for Science and Engineering,39: 8913-8923
[3] Laurinec P, Lucká M (2018) Clustering-based forecasting method for individual consumers electricity load using time series representations.Open Computer Science, 8(1): 38-50
[4] Fernandes R C, Geisler R A, Tenfen D, et al.(2015) Demand side management of electricity aiming to minimize cost of residential consumers.Journal of Clean Energy Technologies, 4(5): 321-324
[5] Li S, Wu W, Lin Y (2022) Robust name="ref6" style="font-size: 1em; text-align: justify; text-indent: 2em; line-height: 1.8em; margin: 0.5em 0em;">[6] Kuang Y, Wang X, Zhao H, et al.(2021) Model-free demand response scheduling strategy for virtual power plant considering risk attitude of consumer.CSEE Journal of Power and Energy Systems, 9(2): 516-528
[7] Zhao Q, Li H, Wang X, et al.(2019) Analysis of users’electricity consumption behavior based on ensemble clustering.Global Energy Interconnection, 2(6): 479-488
[8] Jia H, Peng R, Yang L, et al.(2022) Reliability evaluation of demand-based warm standby systems with capacity storage.Reliability Engineering & System Safety, 218: 108132
[9] Xu Z, Qu H, Shao W, et al.(2016) Virtual power plant-based pricing control for wind/thermal cooperated generation in China.IEEE Transactions on Systems, Man, and Cybernetics: Systems,46(5): 706-712
[10] Hu B, Pan C, Shao C, et al.(2021) Decision-dependent uncertainty modeling in power system operational reliability evaluations.IEEE Transactions on Power Systems, 36(6): 5708-5721
[11] Fang F, Yu S, Xin X (2022) name="ref12" style="font-size: 1em; text-align: justify; text-indent: 2em; line-height: 1.8em; margin: 0.5em 0em;">[12] Zhang Y, Wang L, Ding H, et al.(2021) An overview of virtual power plant prospects from the perspective of optimal scheduling,market bidding and transient analysis.Proceedings of the 2021 IEEE Sustainable Power and Energy Conference (iSPEC),Nanjing, China, pp 281-286
[13] Baringo A, Baringo L (2017) A stochastic adaptive robust optimization approach for the offering strategy of a virtual power plant.IEEE Transactions on Power Systems, 32(5): 3492-3504
[14] Yan X, Gao C, Song M, et al.(2022) An IGDT-based day-ahead co-optimization of energy and reserve in a VPP considering multiple uncertainties.IEEE Transactions on Industry Applications, 58(3): 4037-4049
[15] Wu B, Han Y, Xin J (2021) An intelligent method for prepayment electricity customer selection.Proceedings of 2021 China International Conference on Electricity Distribution (CICED), pp 953-958
[16] Liu S, Zhao Y, Lin Z, et al.(2020) name="ref17" style="font-size: 1em; text-align: justify; text-indent: 2em; line-height: 1.8em; margin: 0.5em 0em;">[17] Wang Y, Zhang N, Chen Q, et al.(2018) name="ref18" style="font-size: 1em; text-align: justify; text-indent: 2em; line-height: 1.8em; margin: 0.5em 0em;">[18] Du X, He Y, Huang J (2021) Random sample partition-based clustering ensemble algorithm for big data.Proceedings of the 2021 IEEE International Conference on Big Data, Virtual approach, pp 5885-5887
[19] Wang Y, Chen Q, Hong T, et al.(2019) Review of smart meter data analytics: applications, methodologies, and challenges.IEEE Transactions on Smart Grid, 10(3): 3125-3148
[20] Jokar P, Arianpoo N, Leung V C M (2017) Electricity theft detection in AMI using customers’consumption patterns.IEEE Transactions on Smart Grid, 7(1): 216-226
[21] Park K, Nguyen M C, Won H (2015) Web-based collaborative big data analytics on big data as a service platform.Proceedings of 2015 17th International Conference on Advanced Communication Technology (ICACT), pp 564-567
[22] Beecks C, Uysal M S, Seidl T (2015) Gradient-based signatures for big multimedia data.Proceedings of the 2015 IEEE International Conference on Big Data, NW Washington, DC,United States, pp 2834-2835
[23] Yu W, Zhang H, Wang X, et al.(2022) Research on intelligent assessment model of influencing factors of electricity satisfaction under the “Carbon Peak and Carbon Neutral”.Proceedings of the 2022 IEEE 2nd International Conference on Electronic Technology, Communication and Information (ICETCI),Changchun, China, pp 613-616
[24] Zhang T, Wang C, Hui Q, et al.(2019) Coordination scheduling model for minimum energy consumption of cogeneration of cool, heat and electricity.Proceedings of 2019 11th International Conference on Measuring Technology and Mechatronics Automation (ICMTMA), Qiqihar, China, pp 150-153
[25] Zhang S, Ye X, Ren Y (2019) Prediction and optimization on energy consumption of data center based on multi-layer feedforward neural network.Proceedings of the 2019 IEEE 8th International Conference on Advanced Power System Automation and Protection (APAP), Xi’an, China, pp 1480-1483
[26] Huang X, Fu Y, Zhang J, et al.(2019) The impact of electric vehicle development on grid load power and electricity consumption.Proceedings of 2019 12th International Conference on Intelligent Computation Technology and Automation(ICICTA), Xiangtan, China, pp 158-161
[27] Lv Y, Zhou Q, Qie Z, et al.(2021) Research on operation strategy of concentrating solar power considering grid voltage stability and clean energy consumption.Proceedings of 2021 International Conference on Power System Technology (POWERCON),Haikou, China, pp 1094-1099
[28] Ma C, Wang Y, Zhang J, et al.(2021) Research on user electricity consumption behavior and energy consumption modeling in big data environment.Proceedings of the 2021 IEEE 2nd International Conference on Big Data, Artificial Intelligence and Internet of Things Engineering (ICBAIE), Nanchang, China, pp 220-224
[29] Wang Y, Wan P, Li X (2021) Optimization scheduling method of power grid energy-saving based on fuzzy decision.Proceedings of 2021 6th International Symposium on Computer and Information Processing Technology (ISCIPT), Changsha, China,pp 321-324
[30] Liu Z, Liu W, Zeng Y, et al.(2021) A power and load optimization scheduling model based on flexible thermal load participating in assisted peak regulation.Proceedings of 2021 6th Asia Conference on Power and Electrical Engineering (ACPEE),Chongqing, China, pp 1065-1071
Received: 8 January 2023/ Accepted: 4 May 2023/ Published: 25 June 2023
Ying Liu
120222206398@ncepu.edu.cn
Jiangping Liu
1334900952@163.com
Zong Wang
liuying20000909@163.com
Hui Hu
1484103539@qq.com
Shaoxiang Xu
maqianxin57@163.com
Jiabin Wang
973376984@qq.com
2096-5117/© 2023 Global Energy Interconnection Development and Cooperation Organization.Production and hosting by Elsevier B.V.on behalf of KeAi Communications Co., Ltd.This is an open access article under the CC BY-NC-ND license (http: //creativecommons.org/licenses/by-nc-nd/4.0/ ).
Biographies

Jiangping Liu received his bachelor’s degree in power system automation from Wuhan University of Water Resources and Electric Power in 1995 and his master’s degree in computer application from Wuhan University of Water Resources and Electric Power in 2000.He is currently working in Hubei Power Trading Center Co., Ltd.His research interests are in power market and power trading as well as power dispatching and operation.

Zong Wang received his bachelor’s degree from Zhejiang University in 1990.He is currently the Deputy General Manager of the Power Trading Center of State Grid Hubei Electric Power Company.His research interests include power system production, operation and power trading compliance management.

Jiabin Wang received his bachelor’s degree in engineering from Huazhong University of Science and Technology in 1996 and his master’s degree in engineering from Huazhong University of Science and Technology in 2005.He is currently working in the Power Trading Center of State Grid Hubei Electric Power Company, and his research interests include grid planning and power trading.

Hui Hu received her bachelor’s degree in law and finance from Zhongnan University of Economics and Law in 2011 and her master’s degree in engineering from Three Gorges University in 2019.She currently works at the Power Trading Center of State Grid Hubei Electric Power Company, and her research interests include power trading and legal compliance.

Shaoxiang Xu received his B.S.degree from Wuhan University in 2010, M.Sc.degree from Nanyang Technological University in Singapore in 2011, and Ph.D.degree from Huazhong University of Science and Technology in 2018.He is currently working in the Power Trading Center of State Grid Hubei Electric Power Corporation, and his research interests include power markets and power system stability and control.

Ying Liu received her bachelor’s degree in economics from Jiangxi University of Finance and Economics in 2018, and she is pursuing her master’s degree at North China Electric Power University, where her research focuses on new energy and power markets.
(Editor Yajun Zou)
