0 Introduction
With the advantages of an extended cycle life,low self-discharge rate,high energy density,high power,and environmental friendliness,lithium batteries have been widely used in energy storage systems,including electric vehicles and energy storage power plants [1].With the circulation of the battery,the active material inside the battery generates loss,resulting in an increase in the internal resistance and aging of the battery.The aging of lithium batteries may affect their performances,and even cause safety accidents.As an important indicator of the battery aging status,the accurate estimation of the state of health(SOH) has an important role in ensuring a safe and stable operation of energy storage systems.
In general,the SOH refers to the percentage of current capacity and rated capacity of the battery.The SOH is different from the features of voltage,current,and temperature; there is no approach to measure them directly by an external sensor.The current common health state estimation methods are model-based and style="font-size: 1em; text-align: justify; text-indent: 2em; line-height: 1.8em; margin: 0.5em 0em;">The equivalent circuit model (ECM),electrochemical model,and empirical degradation model (EDM) are commonly used models for SOH estimation.Instead of studying the complex physicochemical reaction processes inside the battery,the ECM-based methods are based on a circuit model,use a filtering algorithm for parameter identification,and update the model parameters for SOH estimation.For example,Yu [3] identified parameters of the ECM by the recursive least-squares (RLS) method,and then used the self-adaptive H∞ filtering algorithm for the estimation of SOH.Xu [4] also identified the parameters by RLS,and then estimated the SOH.Although the modelbased approach is simple with a low computation cost,the adaptability is poor and the estimation results are more dependent on the effectiveness of the parameter identification and filtering algorithms.
The electrochemical model is based on the internal physicochemical mechanism of the cell to derive the equation [5].A series of equations based on the reactions inside the battery can describe the aging mechanism of the battery in detail.Doyle [6] developed a two-dimensional porous electrode model,which can describe the dynamic mechanism inside the cell and be adapted to different materials of lithium batteries by parameter tuning.However,the decay equation of the electrochemical model is complex,the parameter identification is difficult,and the calculation cost is high.Thus,it is not suitable for online application in battery management systems (BMSs).
The EDM can be used to model the entire life span of the battery,the parameters can be easily identified,and the computational cost is low,which is suitable for online applications.Dong [7] developed a conditional threeparameter degradation model by controlling the rate of capacity decline.Singh [8] applied a semiempirical model to the discharge profile of a lithium battery to determine the SOH after each discharge cycle.However,the EDM-based methods can depict only the overall trend of battery aging,while they cannot depict the local fluctuations of battery capacity.
Different from the model-based approaches,in the style="font-size: 1em; text-align: justify; text-indent: 2em; line-height: 1.8em; margin: 0.5em 0em;">Back propagation (BP) neural networks have been widely used to address nonlinear problems [14].Owing to the simple structure and implementation,the BP neural network is used as a main method for the estimation of SOH in this study.The principle of the BP neural network is to adjust the weights and thresholds of the network by BP of the errors,to minimize the network errors.However,the BP neural network easily falls into local optimal solutions in the regression prediction process,which leads to a low learning rate.This problem is generally solved by optimizing the weights and thresholds.In this study,a novel backpropagation neural network with an improved atom search optimization algorithm (IASO-BP) SOH estimation method is proposed to optimize the BP neural network by acquiring the optimal weights and thresholds of the BP network through the IASO algorithm.The incremental capacity (IC)features are extracted from the battery charging section voltage data.Dt_DT is extracted from the battery charging section temperature data by the traversal method.The BP neural network is trained with IC features and Dt_DT as an input and health status as an output.The initial weights and thresholds of the BP network are optimized by IASO to establish the battery SOH prediction model.Finally,the feasibility of the proposed features and estimation method is validated by training and testing with publicly available datasets.
The reminder of this paper is organized as follows.Section 1 mainly introduces the battery aging data and extraction of HFs.Section 2 presents the SOH estimation method based on the BP neural network optimized by the IASO algorithm.The validation of the SOH prediction model by testing and discussion of results are presented in Section 3.The conclusions are presented in Section 4.
1 Battery aging data analysis and feature extraction
The performance degradation caused by the loss of lithium ions,electrolyte,and other active materials is increased with the number of charge and discharge cycles of Li-ion batteries [15].There are numerous parameters of the battery,such as the voltage,current,temperature,internal resistance,capacity,and power.However,the capacity cannot be directly measured by sensors as the voltage and current.Thus,it is necessary to estimate the current available capacity of the battery by the characteristics that can be directly measured.In general,SOH refers to the ratio between the current available capacity and rated capacity of the battery.The SOH is defined as
where Cr and Ct are the rated capacity and capacity at time t,respectively.In this study,we use battery aging data from a NASA dataset and Oxford dataset.
1.1 Battery datasets
The NASA battery datasets are based on LG Chem 18650 batteries,rated at 2 Ahr [16].Batteries B0005,B0006,B0007,and B0018 are tested for aging at a constant temperature of 24 °C.Tests are performed under charging,discharging,and electrochemical impedance spectroscopy(EIS) measurement operating conditions.As depicted in Table 1,the four batteries are charged by a constant current,followed by a constant voltage.In the constantcurrent charging section,the battery is charged with a constant current of 1.5 A until the battery voltage reaches 4.2 V.The battery is then charged at a constant voltage of 4.2 V until the charging current drops to 20 mA.The batteries are discharged in different modes.The batteries are discharged at a current of 2 A until the voltage drops to the specified value.The capacity change of each cell during the experiment is shown in Fig.1.As depicted in Fig.1,the capacity of the battery does not monotonically decrease during the experiment,and there is a localized capacity regeneration.
Table 1 NASA battery charging and discharging modes


Fig.1 NASA battery capacity trends with the cycle time
The Oxford University Battery Aging dataset [17] is based on 8 Kokam 740-mAh lithium-ion pouch batteries for long-term battery aging tests.The Oxford battery was charged at a constant current of 2C (1C = 740 mA) at a constant temperature of 40 °C and discharged under the working conditions of Urban Artemis.The battery data are measured at 1C current charge/discharge every 100 cycles until the battery life is terminated.
1.2 Analysis and extraction of HFs
The selection and extraction of HFs have an important role in SOH estimation.Appropriate HFs can effectively improve the accuracy of SOH estimation.In practical applications,the battery discharge conditions are complex and variable,while the charging conditions are relatively consistent.Therefore,the HFs of the battery charging segment are more suitable for the estimation of the battery status in practical life.As the style="font-size: 1em; text-align: justify; text-indent: 2em; line-height: 1.8em; margin: 0.5em 0em;">Different from standard cell aging measurements,the IC analysis [20] converts the voltage plateau caused by the electrochemical internal reaction equilibrium into an intuitively identifiable peak on the IC curve.The appearance of the IC peak is closely related to the phase transition phenomenon in the process of lithium-ion intercalation and delamination of the active material [21].The peak of the IC curve is closely related to the loss of lithium inventory and active material of positive and negative electrodes inside the battery [22,23].
The main aim of the IC analysis is to analyze the changing rate of the capacity relative to the battery voltage.According to this principle,the equation for the IC curve is derived:
where Q and V are the capacity and voltage,respectively,I is the current,and t is the time.
According to (2),the numerical calculation amplifies the effect of measurement noise on the IC curve,particularly at the voltage plateau [24].As the presence of noise has an impact on the extraction of HFs,the data need to be processed.Zhang [25] reduced the noise of the data using the smoothing spline approach.To address this issue,the data curves of the cells were reconstructed during the experiments,and the IC curves were smoothed by local weighted quadratic regression with weighted linear least squares and quadratic polynomial model for local regression.The span size was set to 0.5.Considering the first charge data of B0005 as an example,the IC curves before and after the smoothing process are shown in Fig.2.
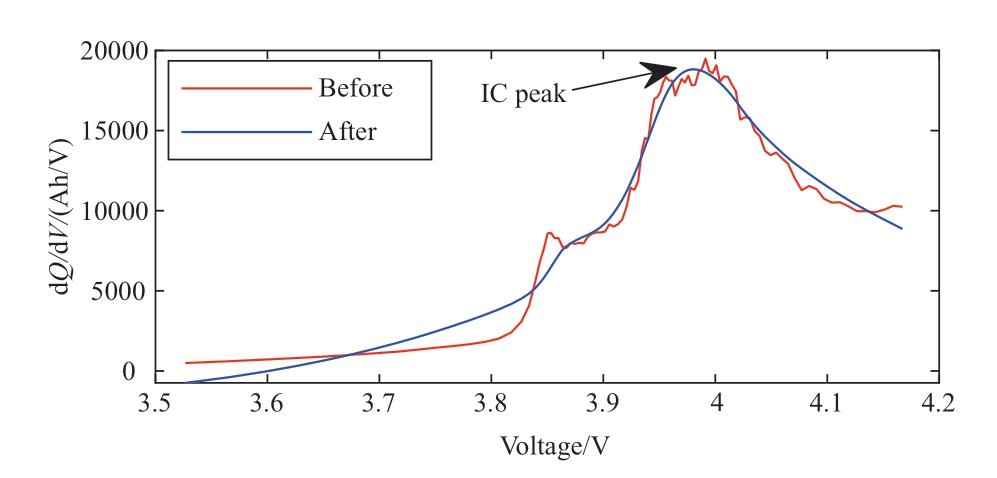
Fig.2 Results before and after IC curve optimization
In the life span of the battery,the IC curve changes with the aging of the battery.We consider the change in the IC curve after the optimization of battery B0005 as an example in Fig.3.

Fig.3 Trend of the IC curves with the circulation for B0005
The chemical reaction phenomena inside the cell are converted into uniquely shaped peaks,heights,and positions in the IC curve by the IC analysis [26].The change in the IC curve in Fig.3 shows that the highest peak of the IC curve decreases with the charge and discharge cycles of the battery and that the trend of its location changes significantly [27].Figure 3 shows that the peak of the IC curve (Pic) is changed within a certain voltage range with the increase in the number of cycles.The corresponding voltage fragment for the NASA cell B0005 is [3.95,4.05].Hence,the extraction of Pic can be performed by analyzing only the data of a specific voltage segment,without the need for complete charging data.However,the charging start at a high voltage may lead to the loss of IC-based HFs.Ruan[28] solved this problem by extracting morphological IC characteristics and voltage entropy information for different initial charging voltages and using multistage estimation.The key issue is to implement SOH estimation in the case of incomplete data.To solve this problem,one approach is to develop HFs that can be extracted in any voltage fragment.Another approach is to divide the battery charging process into several segments and analyze them separately.In future studies,the estimation methods can be improved by the above methods.
In the process of charging and discharging,the temperature of lithium batteries varies with the degree of aging,so that the change in temperature also has a certain reference effect on the SOH estimation of the battery.The complete charging section data are inconvenient to obtain,so that the data fragment can be selected to represent the health status of the battery.With the cycle of charging and discharging,the SOH of the battery decays subsequently.The HF of variation amount of equal-time charging temperature can be constructed,and the correlation between Dt_DT and SOH can be studied.Considering the batteries Cell1 and B0005 as reference cells,the optimal charging time segments for the NASA and Oxford datasets were obtained by the traversal method.Figure 4 shows the Pearson correlation between Dt_DT and SOH obtained for different values of charging time for each cell.The Pearson correlation is defined in (3).There is an isochronous temperature variation characteristic of the battery with a strong correlation with SOH in the constant-current charging section.Figure 4 shows that the correlations of the temperature changes obtained at different time periods exhibit large differences.The optimal time fragment for the Oxford dataset is [1000,1550],while the optimal time fragment for the NASA dataset is [2100,3100].

Fig.4 Pearson correlation analysis of the optimal temperature variation time period of the charging period with SOH

where R is the Pearson correlation coefficient,n is the numberoftotalsamples,xiistheHFs,yi is theSOH,and ,
, are the meanvalues ofHFsandSOH,respectively.The Pearson correlation analysis can be used to measure the linear correlation between two variables with values of [-1,1].The results of the correlation analysis of HFs with SOH are shown in Table 2.
Table 2 Correlation analysis of different factors with SOH

As shown in Table 2,the Pearson correlation coefficients between Pic and SOH of each cell are above 0.9.The absolute values of the correlation coefficients between Dt_DT of each cell are above 0.8.The results demonstrate a strong correlation between the selected HFs and health status,which is suitable for SOH estimation.
2 Estimation method of the health status
All id="generateCatalog_7" style="text-align: left; text-indent: 0em; font-size: 1.2em; color: rgb(195, 101, 0); font-weight: bold; margin: 0.7em 0em;">2.1 BP neural network
The BP neural network is a widely used network model characterized by BP of errors.Owing to the strong self-learning,self-adaptive,and excellent generalization capabilities,BP networks are suitable for the estimation of SOH.As shown in Fig.5,the BP network consists of an input layer,output layer,and serval hidden layers.For the construction of BP neural networks,determination of the number of layers,number of neurons per layer,and weights of the network is necessary.In general,with a network with more layers,a higher accuracy is achieved,but the whole network is more complex and may cause over-fitting.Hence,the BP neural network is generally set with 1–2 hidden layers.The number of nodes in the input and output layers of the network is determined by the input and output characteristics,while the number of nodes in the hidden layer is different.Different numbers of nodes in the hidden layer also cause differences in the magnitude of prediction errors.The number of neurons in the hidden layer is generally determined by the empirical formula
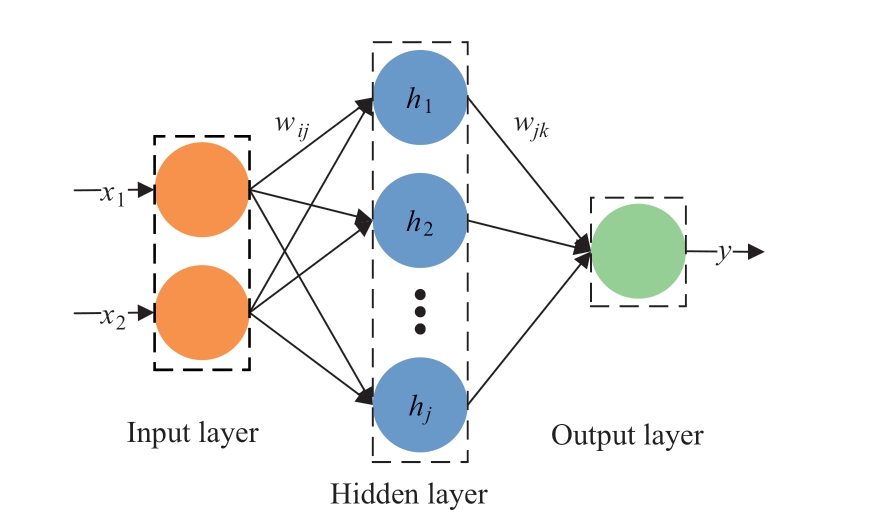
Fig.5 Topology of a BP neural network with a single hidden layer
where j,m,and n are the numbers of neurons in the hidden layer,input layer,and output layer,respectively.The value of a is an integral from 1 to 10.The mean square error (MSE)of the training set is used as an indicator to find the number of nodes corresponding to the smallest MSE by the traversal method as the optimal number of nodes in the hidden layer.
However,BP neural networks also have limitations.The training of the BP neural network requires more parameters.Moreover,the prediction results are easily trapped in a local optimum and depend on the representativeness of the training samples.
2.2 IASO algorithm
Heuristic optimization algorithms are fundamental theories and mathematical models inspired by real-world physical phenomena and biological behavior.
The ASO algorithm is an iterative heuristic global optimization algorithm based on an atom dynamic model,simulating the phenomenon of atomic displacement in a molecular system composed of atoms due to the interaction forces and systemic binding forces.The neighboring atoms in a molecular system interact with each other while being bound by the global optimal atom.Owing to the gravitational forces between atoms,they search extensively throughout the search space during their motion,while the repulsive forces enable them to further exploit potential regions.This implies that the acceleration is updated by the interaction forces between atoms to further update the velocity and position,thereby achieving the purpose of global search.
PSO,GA,and simulated annealing (SA) are three classical optimization algorithms.The PSO algorithm is proposed to simulate the migration and flocking behaviors obtained during bird foraging.Its advantage is that fewer parameters need to be adjusted,while a disadvantage is that it can be easily trapped into local optima and is difficult to provide the exact optimal solution.The GA is a simulation of biological genetic and evolutionary processes.The advantage of GA is population search,which is easily parallelized and can be used in a wide range of applications.A disadvantage is that the genetic operator with a singlepoint crossover and basic bit variation cannot bring out the advantages of global search and easily falls into local optima.The SA is inspired by the heating and cooling of the material during metallurgical annealing.SA is strongly influenced by the number of iterations and may miss the optimal solution when the number of iterations is small.
Some algorithms may fail to step out of the local optimum in the process of seeking the optimum.In ASO,the interaction forces between every two atoms throughout the iterations are either repulsive or attractive in the former stage and only attractive in the latter stage.Although the former repulsion makes the convergence of ASO slower,it can enhance the global search ability in the whole space and effectively prevent the optimization from prematurity.Numerous real-world problems are considered to be multimodal functions with a certain number of local optima.Through a statistical analysis,Zhao [30] showed that ASO significantly outperformed PSO,GA,SA,gravitational search algorithm,and wind driven optimization in comparison of different types of benchmark functions.
For optimization algorithms,a more uniform distribution of the initial population in the search space is beneficial to improve the optimization efficiency and solution accuracy of the algorithm.Tent mapping is a segmented linear mapping function with a simple mapping structure and relatively uniform distribution density of the results presented by the mapping.Therefore,the improvement in ASO by combining the tent mapping optimization strategy can further improve the search capability.The tent mapping can be expressed as

where a is generally 0.5 and n is the number of mappings.
Owing to the simplicity and ease of implementation,the IASO is convenient for practical applications.The flow of the IASO algorithm is as follows:
1) Configure the network parameters,initialize the parameters of ASO with the tent mapping strategy,and determine the initial population size,maximum number of iterations,etc.
2) Calculate the atomic individual fitness and keep it as the current optimal solution.
3) Update the individual atomic acceleration based on the interatomic potential energy relationship.
4) Update the atomic individual velocity.
5) Update the atomic individual position.
6) Update the atomic individual fitness and current optimal solution according to the fitness.
7) Repeat steps (3–7) until reaching the current optimal solution according to the fitness.
8) Export the optimal solution and optimal fitness.
2.3 Estimation of SOH
The main problem regarding the BP neural network is that it can easily fall into local optimal solutions and converge slowly.Therefore,the weights and thresholds of the BP neural network are optimized by combining the strong optimization-seeking ability and fast convergence of the IASO algorithm to avoid falling into local optimal solutions and improve the estimation accuracy.
The entire process of the IASO-BP-based SOH estimation method is shown in Fig.6.
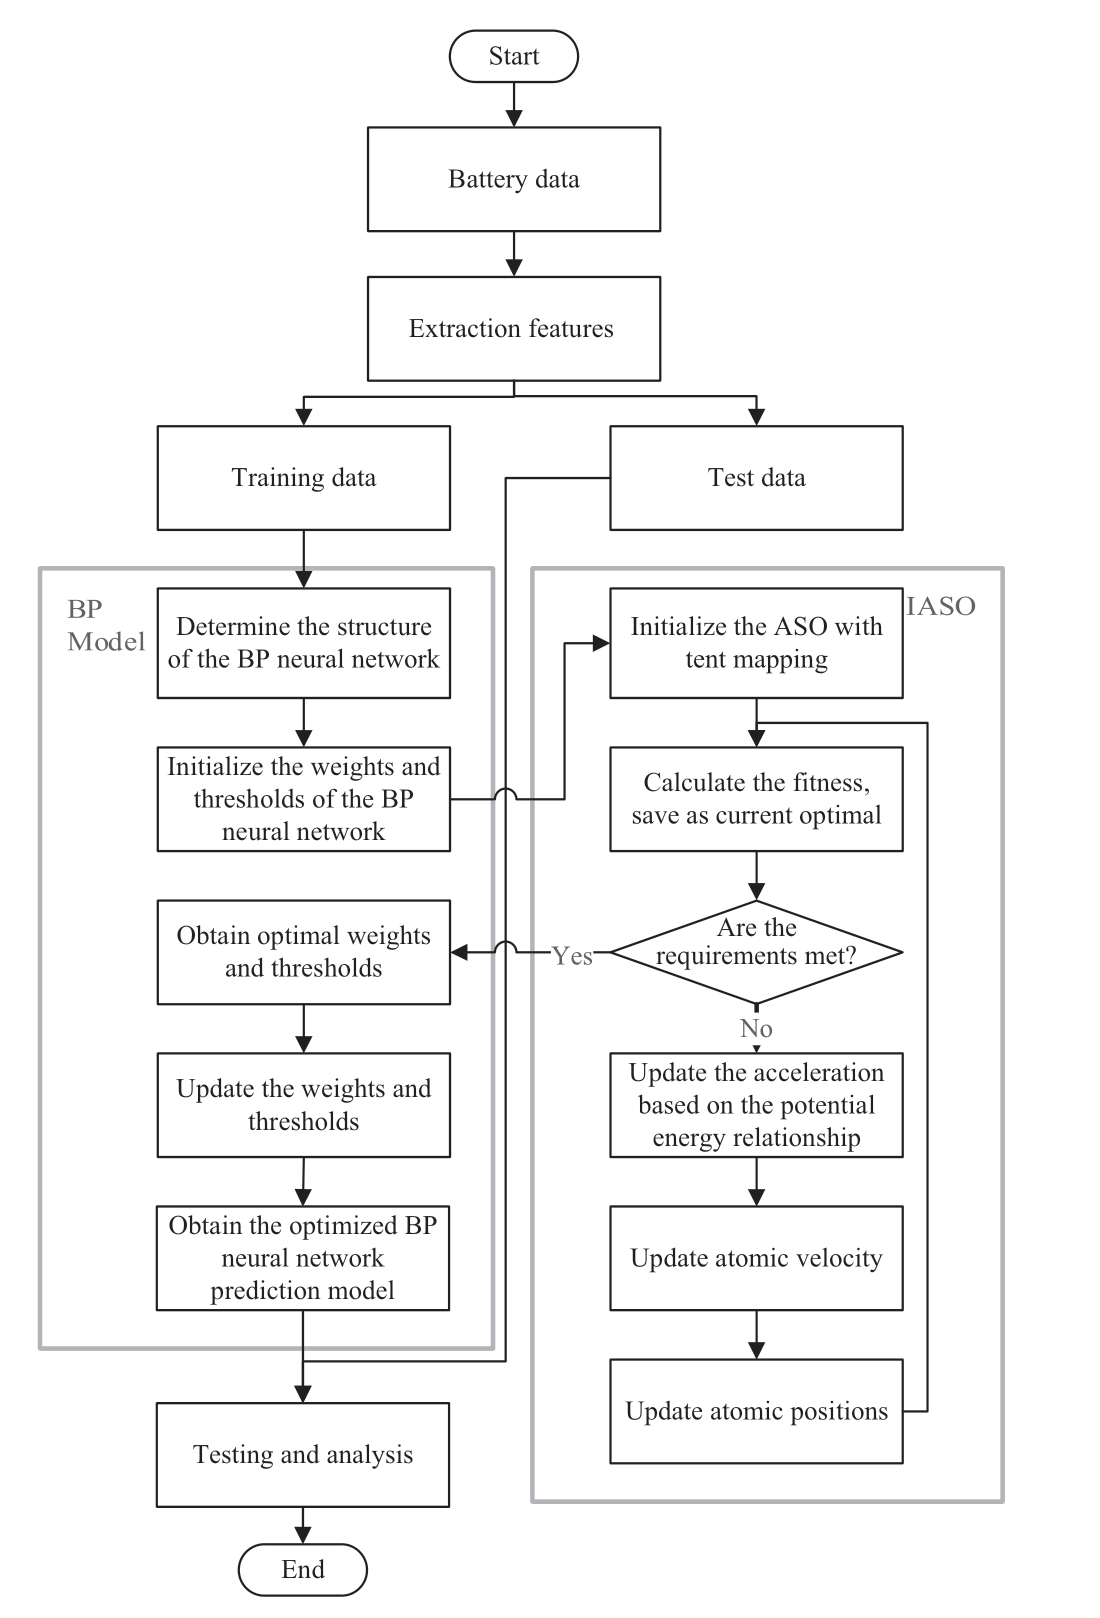
Fig.6 Experimental flow of the SOH estimation method based on IASO-BP
The HFs and real value of the battery SOH are extracted from the battery data and divided into training and test sets.Subsequently,the structure of the BP network is determined based on the training set data,and the initial values of its weights and thresholds are obtained.The initial values of the parameters of the BP network are optimized with the ASO algorithm improved by tent mapping.The MSE of the current output is then calculated and used as the fitness value.Further,it is determined whether the requirements are met.The atomic positions in the molecular space are updated by iterations until the fitness value meets the requirements or until the maximum number of iterations is reached,and the optimization is completed.The optimal prediction model is constructed with the optimized weights and thresholds.Finally,the prediction model is tested with the test set data to verify whether the estimation accuracy of the prediction model based on Pic and Dt_DT meets the requirements.
3 Results and discussion
In this section,the estimation results and feasibility of the SOH estimation method based on Pic and Dt_DT are evaluated and validated with battery data from NASA and Oxford battery datasets,as described in Fig.6.In addition,BP,Elman network (ELMAN),and least squares support vector machine (LSSVM) are employed as control tests to verify the optimization effect and estimation accuracy of the proposed method.The test protocol was set as follows.
1) NASA dataset.Training of the prediction model with the first 100 cycles of battery B0005 and testing of the performance of the prediction model using the last 66 cycles of battery B0005 and first 100 cycles of batteries B0006 and B0007.
2) Oxford dataset.Training of the prediction model with the first 50 cycles of Cell1 and testing of the model with the last 28 cycles of Cell1 and all data of Cell2 and Cell3.
The test results and errors of NASA and Oxford cells are shown in Fig.7.

Fig.7 Results and errors of battery SOH estimation based on Pic and Dt_DT with different methods
Figure 7 shows that the BP-based SOH estimation results are easily trapped to local optimal solutions and that the IASO-BP approach can effectively avoid this problem and improve the accuracy of SOH estimation.As shown in Fig.7,the SOH estimation method based on Pic,Dt_DT,and IASO-BP has high estimation accuracy and feasibility.Fig.7 (a)–(c) show the estimation results and errors of NASA batteries B0005,B0006,and B0007 for different methods.Fig.7 (d)–(f) show the estimation results and errors of Oxford batteries Cell1,Cell2,and Cell3 for different methods.The estimation results based on the proposed method are closer to the true values of SOH for both NASA and Oxford datasets compared to other methods,as shown in Fig.7.
To quantitatively analyze the estimation accuracies of different methods,the mean absolute percentage error(MAPE) is chosen as an index,defined as

where xi and xi' are the true and estimated values,respectively,and N is the size of the samples.
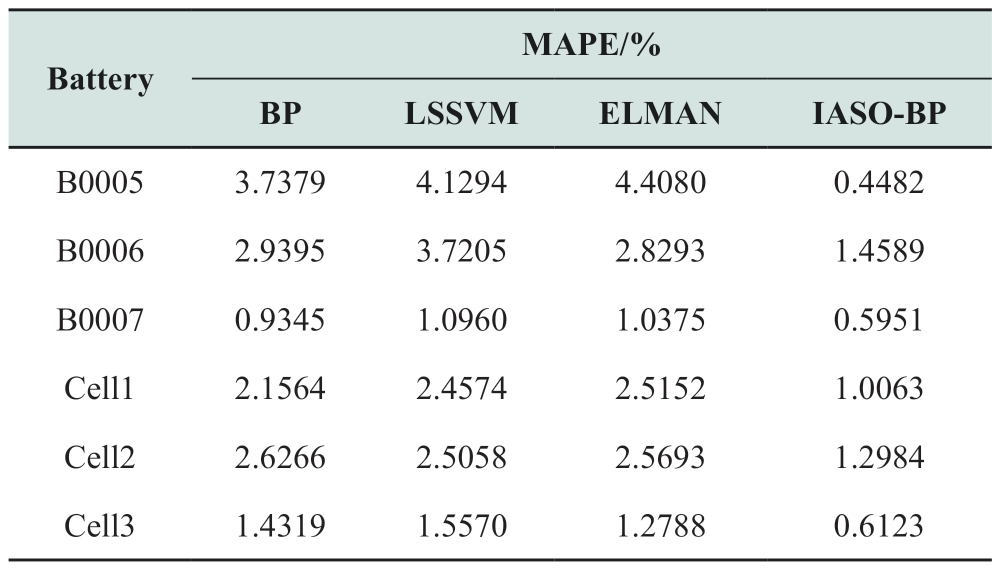
Table 3 shows the evaluation of the prediction performances of different methods based on Pic and Dt-DT.Table 3 shows that the maximum MAPE based on the BP neural network estimation method is 3.74% for the NASA dataset and 2.63% for the Oxford dataset.The maximum MAPE based on the IASO-BP estimation method is 1.46% for the NASA dataset and 1.30% for the Oxford dataset.For both LSSVM and ELMAN,the maximum prediction errors are above 4% for the NASA dataset and above 2.4% for the Oxford dataset.The results demonstrate that IASO effectively improves the BP neural network.The proposed method can provide high-accuracy estimation results for both NASA and Oxford datasets.
Table 3 Estimation errors of different methods
4 Conclusion
The style="font-size: 1em; text-align: justify; text-indent: 2em; line-height: 1.8em; margin: 0.5em 0em;">Acknowledgements
This study was supported by National Natural Science Foundation of China (Grant No.51677058).
Declaration of competing interest
We declare that we have no conflict of interest.
References
[1] Sarmah S B,Kalita P,Garg A,et al.(2019) A review of state of health estimation of energy storage systems: Challenges and possible solutions for futuristic applications of li-ion battery packs in electric vehicles.Journal of Electrochemical Energy Conversion and Storage,16(4): 040801
[2] Ng M F,Zhao J,Yan Q,et al.(2020) Predicting the state of charge and health of batteries using name="ref3" style="font-size: 1em; text-align: justify; text-indent: 2em; line-height: 1.8em; margin: 0.5em 0em;">[3] Yu Q,Xiong R,Yang R,et al.(2019) Online capacity estimation for lithium-ion batteries through joint estimation method.Applied Energy,255: 113817
[4] Xu Z,Wang J,Lund P D,et al.(2022) Co-estimating the state of charge and health of lithium batteries through combining a minimalist electrochemical model and an equivalent circuit model.Energy,240: 122815
[5] Lin X,Lu W (2017) A battery model that enables consideration of realistic anisotropic environment surrounding an active material particle and its application.Journal of Power Sources,357: 220-229
[6] Doyle M,Fuller T F,Newman J (1993) Modeling of galvanostatic charge and discharge of the lithium/polymer/insertion cell.Journal of the Electrochemical Society,140(6): 1526
[7] Wang D,Miao Q,Pecht M (2013) Prognostics of lithium-ion batteries based on relevance vectors and a conditional threeparameter capacity degradation model.Journal of Power Sources,239: 253-264
[8] Singh P,Chen C,Tan C M,et al.(2019) Semi-empirical capacity fading model for SoH estimation of Li-Ion batteries.Applied Sciences,9(15): 3012
[9] Salkind A J,Fennie C,Singh P,et al.(1999) Determination of state-of-charge and state-of-health of batteries by fuzzy logic methodology.Journal of Power Sources,80(1-2): 293-300
[10] Reddy K R K,Gunasekaran A,Kalpana P,et al.(2021)Developing a blockchain framework for the automotive supply chain: A systematic review.Computers & Industrial Engineering,157: 107334
[11] Tian J,Xiong R,Shen W (2020) State-of-health estimation based on differential temperature for lithium ion batteries.IEEE Transactions on Power Electronics,35(10): 10363-10373
[12] Chaoui H,Ibe-Ekeocha C C (2017) State of charge and state of health estimation for lithium batteries using recurrent neural networks.IEEE Transactions on Vehicular Technology,66(10):8773-8783
[13] He Y-J,Shen J,Shen J-F,et al.(2015) State of health estimation of lithium-ion batteries: A multiscale Gaussian process regression modeling approach.AIChE Journal,61: 1589-1600
[14] Lin H,Kang L,Xie D,et al.(2022) Online state-of-health estimation of lithium-ion battery based on incremental capacity curve and BP neural network.Batteries,8(4): 29
[15] Chen Z,Zhao H,Zhang Y,et al.(2022) State of health estimation for lithium-ion batteries based on temperature prediction and gated recurrent unit neural network.Journal of Power Sources,521: 230892
[16] Saha B,Goebel K (2007) Battery Data Set,NASA Ames Prognostics Data Repository.http://ti.arc.nasa.gov/project/prognostic- name="ref17" style="font-size: 1em; text-align: justify; text-indent: 2em; line-height: 1.8em; margin: 0.5em 0em;">[17] Birkl,C (2017) Oxford Battery Degradation Dataset 1.University of Oxford
[18] Zhao S,Zhang C,Wang Y (2022) Lithium-ion battery capacity and remaining useful life prediction using board learning system and long short-term memory neural network.Journal of Energy Storage,52: 104901
[19] Zhang C,Zhao S,He Y (2021) An integrated method of the future capacity and RUL prediction for lithium-ion battery pack.IEEE Transactions on Vehicular Technology,71(3): 2601-2613
[20] Fly A,Chen R (2020) Rate dependency of incremental capacity analysis (dQ/dV) as a diagnostic tool for lithium-ion batteries.Journal of Energy Storage,29: 101329
[21] Zhang Y,Liu Y,Wang J,et al.(2022) State-of-health estimation for lithium-ion batteries by combining model-based incremental capacity analysis with support vector regression.Energy,239:121986
[22] Birkl C R,Roberts M R,McTurk E,et al.(2017) Degradation diagnostics for lithium ion cells.Journal of Power Sources,341:373-386
[23] Han X,Lu L,Zheng Y,et al.(2019) A review on the key issues of the lithium ion battery degradation among the whole life cycle.eTransportation,1: 100005
[24] Li X,Yuan C,Li X,et al.(2020) State of health estimation for Li-Ion battery using incremental capacity analysis and Gaussian process regression.Energy,190: 116467
[25] Zhang C,Zhao S,Yang Z,et al.(2022) A reliable data drivenbased state-of-health estimation model for lithium-ion batteries in electric vehicles.Frontiers in Energy Research.doi: 10.3389/fenrg.2022.1013800
[26] Anseán D,García V M,González M,et al.(2019) Lithium-ion battery degradation indicators via incremental capacity analysis.IEEE Transactions on Industry Applications,55(3): 2992-3002
[27] Chang C,Wang Q,Jiang J,et al.(2021) Lithium-ion battery state of health estimation using the incremental capacity and wavelet neural networks with genetic algorithm.Journal of Energy Storage,38: 102570
[28] Wei Z,Ruan H,Li Y,et al.(2022) Multistage state of health estimation of lithium-ion battery with high tolerance to heavily partial charging.IEEE Transactions on Power Electronics,37(6):7432-7442
[29] Zhao W,Wang L,Zhang Z (2019) A novel atom search optimization for dispersion coefficient estimation in groundwater.Future Generation Computer Systems,91: 601-610
[30] Zhao W,Wang L,Zhang Z (2019) Atom search optimization and its application to solve a hydrogeologic parameter estimation problem.Knowledge-Based Systems,163: 283-304
Full-length article
Received: 18 September 2022/ Accepted: 24 November 2022/ Published:25 April 2023
 Yuhang Zhang
2021859838@qq.com
Yu Zhang
zhangyu7210@163.com
Tiezhou Wu
wutiezhou@163.com
2096-5117/© 2023 Global Energy Interconnection Development and Cooperation Organization.Production and hosting by Elsevier B.V.on behalf of KeAi Communications Co.,Ltd.This is an open access article under the CC BY-NC-ND license (http: //creativecommons.org/licenses/by-nc-nd/4.0/).
Biographies

Yu Zhang graduated from Hubei Institute of Technology in June 1992.She graduated from Hubei Institute of Technology in June 1999 with a master’s degree in engineering.She is a Professor at School of Electrical and Electronic Engineering,Hubei University of Technology.

Yuhang Zhang graduated from Bohai University with a bachelor’s degree in 2019.He is pursuing a master’s degree at Hubei University of Technology.

Tiezhou Wu graduated from Huazhong University of Science and Technology with a Doctor of Science degree in System Analysis and Integration in 2010.He is an Executive Vice President of Hubei University of Technology Solar Energy Research Institute,Director of Key Laboratory of Solar Power Generation and Energy Storage Operation Control,and Executive Vice Director of Hubei Collaborative Innovation Center for Efficient Utilization of Solar Energy.
(Editor Yajun Zou)
