0 Introduction
The energy industry accounts for the greatest proportion of the total global carbon emission.The path to the transition of the energy system directly determines the decarbonization trajectory.China is the largest carbon emitter and energy consumer in the world.Accordingly,attention has been focused on how the country plans to transition its energy system to become carbon neutral [1].In September 2020,China estimates that its carbon emission may peak by 2030.It announced that its target is to become carbon neutral by 2060.According to China’s net-zero carbon emission goal,2060 is anticipated to be the turning point for fossil fuel markets,renewable energy generation,and overall national energy transition process.Currently,owing to the dependency on electrification,national and global energy consumption is rising significantly.Consequently,atmospheric pollution and global climate change have become the most crucial concerns for GEP in power systems.In recent years,China has increased the generation capacity of hydroelectric,solar,and wind power plants [1–3] to reduce CO2 emissions.According to the“China Electricity Council,” China produced 390 GW of hydropower,330 GW of wind power,and 310 GW of solar power at the end of 2021.
Because of the numerous benefits offered by technologies that emit less carbon dioxide,new forms of energy have emerged as essential components of energy transition.Therefore,developing a novel GEP model capable of considering constraints related to carbon emissions is necessary.Several academics have conducted research on a variety of strategies for power generation and transmission considering climate change.In [4],a framework for power system planning and operation methods using a low-carbon economy model was established.In [5,6],a power planning method for grid-connected microgrid systems based on cost–benefit analysis was devised.Another study [7]developed a “low-carbon” GEP model considering carbon emissions and coal combustion constraints.In [8,9],a “lowcarbon” GEP model with carbon capture power plants was established.In [10],the carbon reduction benefits of power supply technologies (such as those of solar and wind) were incorporated into power generation planning.In [11],a“low-carbon” grid planning model was developed based on multi-scenario modeling techniques to adapt to developing low-carbon power sources.In [12],a renewable energy incentive system was introduced into the power supply planning model to promote clean energy development.
In [13,14],a generation expansion framework and pathways for the energy transition process were devised.In [15],the authors considered emission costs for power generation expansion.
According to the literature,most planning methods for GEP are generally based on mathematical optimization[4–15].Among these,the “mathematical optimization”technique can theoretically determine the optimal result.However,because of the high degree of calculation involved and non-fossil energy regulations,the method’s performance is unsatisfactory.Some systems have volatile and random outputs and encounter problems during possible peak adjustment [16].Accordingly,we propose a general algebraic modeling system (GAMS)-based [17] mixedinteger linear programming (MILP) [18] approach,which is an efficient collaborative optimization method.The approach,which depends on theoretical considerations,is processed based on the CPLEX solver.The proposed method depends on an automatic assessment and can identify the best possible solution.This paper proposes an MILP-based long-term GEP method that considers the most crucial carbon emission constraint for the low-carbon power sector [19].
This paper is arranged as follows.The first section presents the mathematical framework for long-term GEP.Both environmental and economic concerns are considered.Subsequently,an algorithmic approach is proposed to solve the model based on optimization and flexibility analysis.Then,the simulation and validation of the proposed model and algorithmic approach using analytical data from the International Energy Agency (IEA) are presented.Finally,recommendations for sustainable and reliable energy development are discussed.
1 Mathematical Framework
1.1 Objective function
The objective function of the proposed model is to reduce the total cost of the system to the extent possible to satisfy the electricity demand such that the carbon emissions from the power sector are reduced in the long term.Five different cost functions—investment cost in GEP,operational and maintenance costs of all power plant technologies,fuel cost,variable non-fuel cost of different power technologies,and load cut cost (including carbon emissions and resource constraints)—are considered.The objective function is

where y is the planning year; d is the discount rate; Cc,Om,Fc,Nfc,and Lcc are the investment,operation and maintenance,fuel,variable non-fuel,and load cut costs,respectively.For the sets,variables,and parameters,five subscripts (p,y,g,h,and fl) are considered to cover different dimensions (technology,year,vintage,load hour,and fuel type).The following equations are used:
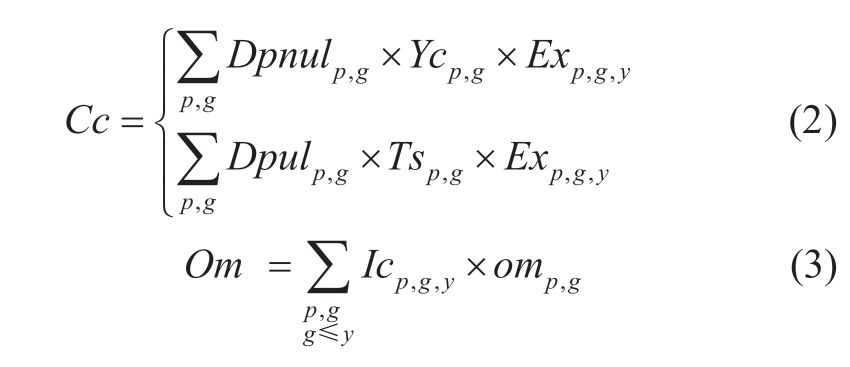
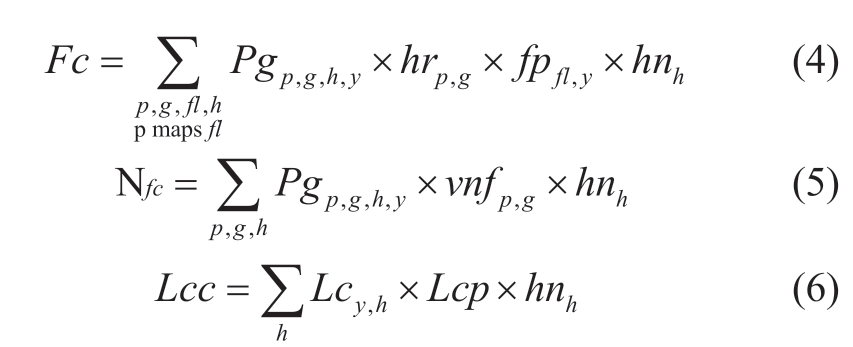
where Dpulp,g and Dpnulp,g are the investments per power plant technology (units with and without typical size,respectively) commissioned in the vintage year,g; Ycp,g and Exp,g,y are the annual capital costs per power plant technology,p,and existing power plant unit whose useful life has not yet expired,respectively; Icp,g,y is the installed capacity of individual power plant technologies in the year of commissioning and the current year,y; omp,g is the fixed operation and maintenance cost per power plant technology,p,in the vintage year,g; Pgp,g,h,y is the power generation of each power plant technology in the vintage year,g,load hour,h,and current year,y; hrp,g is the heat rate of every power plant technology in the vintage year,g; fpfl,y and hnh are the annual fuel prices and the number of hours demanded in a typical load hour,h,respectively; vnfp,g is the variable non-fuel cost of different power plant technologies,p,in the vintage year,g; Lcy,h is the load cut at the typical load hour,h,in the current year,y; and Lcp is the load cut price (a load cut is opted only when further investments are not possible).
1.2 Constraints
The necessary constraints in the MILP-based GEP model typically include power balance,reserve,installed capacity,generation,resource,investment,carbon emission,equality,rated power,and unit operational constraints.
1) The power balance constraint is as follows:
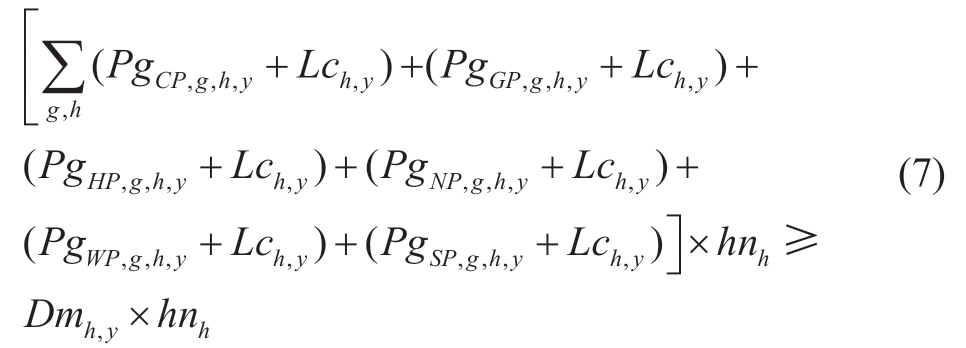
where PgNP,g,h,y ,PgCP,g,h,y,PgGP,g,h,y,PgHP,g,h,y,PgWP,g,h,y,and PgSP,g,h,y represent hydropower and coal,gas,nuclear,wind,and solar power plant technologies,respectively,in the vintage (g),load hour (h),and year (y).The demand for power in the typical load hour is denoted by Dmh,y.Here,the load cut,Lch,y,is introduced to the power balance equation as a non-covering demand choice.Equation (7) ensures that with the power balance constraint,the total generation capacity after expansion can satisfy the maximum load demand of the target year.
2) The reserve constraint is given by
where Rsy is the reserve margin for the newly installed target capacity.Equation (8) indicates that the installed capacity and new investments must include the reserve margin target.
3) The capacity constraints are as follows:

Equations (9) and (10) represent the electricity generated by each power plant technology for each year during the load hour that must not exceed the installed capacity.The power generation of units with a typical size must be lower than or equal to the nominal power of the operating units.
4) The power generation constraint is given by
where Utp is an indicator of the availability of renewable resources from 0 to 1.Equation (11) states that the annual electricity generated by each power plant technology in a given load hour must not exceed the annual installed capacity multiplied by the utilization rate and renewable resource availability indicator.
5) The resource constraint is

where Rofl,y is the maximum natural resource per GWh of fuel per year.Equation (12) states that the total fuel consumption of electricity generation technologies must be greater than or equal to the consumption of different electricity generation technologies within a given load hour(excluding wind and solar power plants,which have no fuel consumption).
6) The carbon emission constraint is expressed as
where E maxy is the maximum carbon emission per million ton per year.This emission is equal to the fuel consumption multiplied by the carbon emission factor,emffl,of power plant technologies.Equation (13) indicates that the emissions resulting from the generation of electricity by various new power plant technologies must not exceed the maximum emission.
7) The investment constraint is

where Iv maxp is the maximum investment per technology(GW).Equation (14) indicates that the cumulative installed capacity must not exceed the maximum limits of hydropower and solar,wind,and nuclear power plants.This constraint applies to all the years that the model is applied.
8) The equality constraint is

where Usp,g,y and Unp,g,y are the size of the generators and number of units to be installed,respectively.Equation (15)represents the new investment in different power plant technologies that must be equal to the size of the generator and number of units required for generation expansion.
9) The rated power constraint is as follows:
where OPup,g,h,y is the operational unit per power plant technology (p),and Techminp,g denotes the percentage of the unit rated power.Equation (16) indicates that the power generation from different power plant technologies must be greater than or equal to the rated power of the operating unit.
10) The unit operational constraints are given by the following:
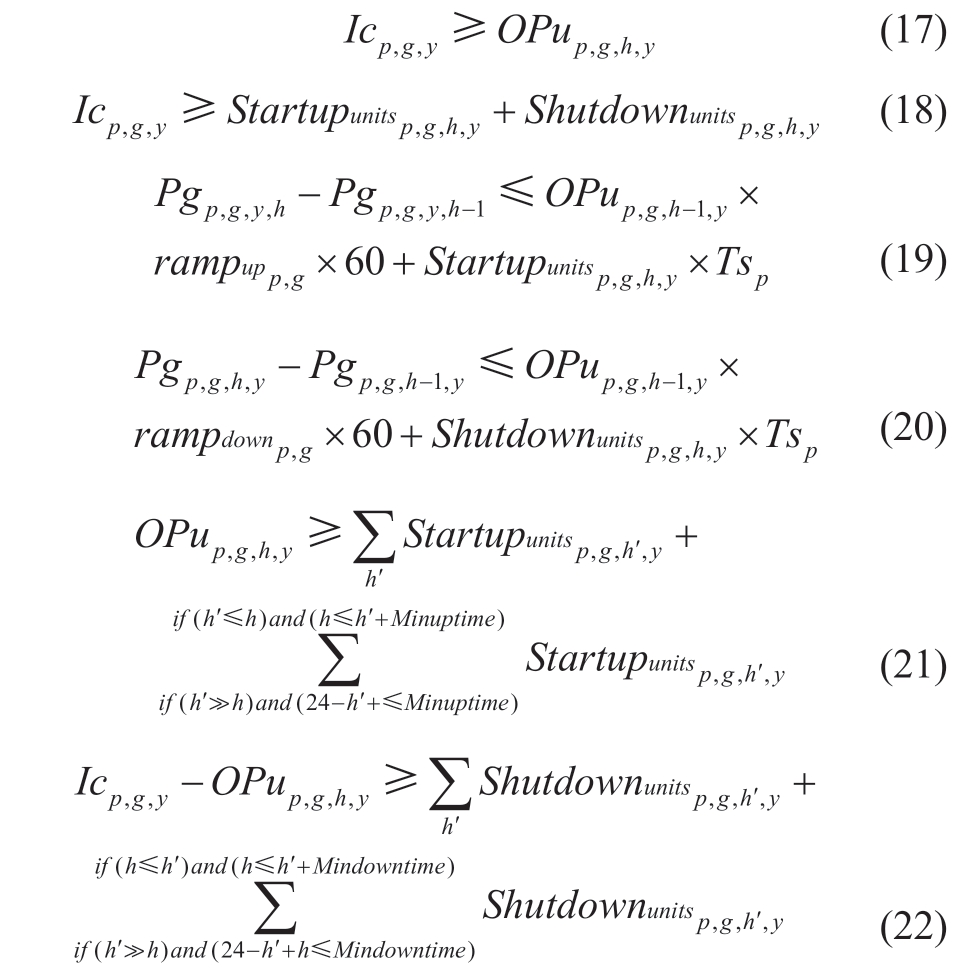
where Startupunitsp,g,h,y and Shutdownunitsp,g,h,y are the numbers of the startup and shutdown units of different power plant technologies (p),respectively; rampupp,g and rampdownp,g are the ramp up and ramp down of power plant technology (p)during the vintage year (g),respectively.Equation (17)represents the constraint on the units in operation in the projected year.Equation (18) indicates that newly added units are allowed to provide their nominal power output during the startup.Equation (19) calculates the maximum ramp-up rate for a power plant with specific technology(p),vintage year (v),hours of operation (h),and demand projection year (y).The equation states that the total electricity output difference between the current (Pgp,g, h, y)and previous (Pgp,g,h−1,y) hours of the power plant must not exceed the sum of the product of the number of units operating during the previous hour (OPup,g,h−1,y) and rampup rate![]() multiplied by 60.Moreover,it must not exceed the product of the number of startup units
multiplied by 60.Moreover,it must not exceed the product of the number of startup units![]() and typical unit size (Tsp) of the plant.This equation limits the rate at which the power plant can increase its electricity output based on the number of operating units,ramp-up rate,and typical unit size,ensuring that the rampup rate does not exceed the rate calculated by the equation for a given hour and year.Equation (20) represents the constraints on the ramp-down rate of electricity generation in the power system.The ramp-down rate is defined as the rate at which a power plant reduces its electricity output from one hour to the next.The equation indicates that the difference between the electricity output in the previous(Pgp,g,h−1,y) and current (Pgp,g,h,y) hours must be less than or equal to the product of the ramp-down rate
and typical unit size (Tsp) of the plant.This equation limits the rate at which the power plant can increase its electricity output based on the number of operating units,ramp-up rate,and typical unit size,ensuring that the rampup rate does not exceed the rate calculated by the equation for a given hour and year.Equation (20) represents the constraints on the ramp-down rate of electricity generation in the power system.The ramp-down rate is defined as the rate at which a power plant reduces its electricity output from one hour to the next.The equation indicates that the difference between the electricity output in the previous(Pgp,g,h−1,y) and current (Pgp,g,h,y) hours must be less than or equal to the product of the ramp-down rate![]() multiplied by 60 and the number of units operating in the previous hour (OPup,g,h−1,y) plus the product of the number of startup units in the current hour
multiplied by 60 and the number of units operating in the previous hour (OPup,g,h−1,y) plus the product of the number of startup units in the current hour![]() and the typical unit size (Tsp).This equation ensures that the ramp-down rate is within acceptable limits and that the power system operates efficiently and effectively.Equation(21) represents the time at which start-ups occur and is considered for calculating the minimum units in operation for each plant.The minimum uptime determines whether a unit activated on hour h' remains in operation on hour h.Equation (22) represents the time when shutdowns occur and is considered for calculating the minimum number of units in the synchronization process for each plant.The minimum downtime determines whether a unit deactivated during h' must be considered unavailable for electricity production during h.
and the typical unit size (Tsp).This equation ensures that the ramp-down rate is within acceptable limits and that the power system operates efficiently and effectively.Equation(21) represents the time at which start-ups occur and is considered for calculating the minimum units in operation for each plant.The minimum uptime determines whether a unit activated on hour h' remains in operation on hour h.Equation (22) represents the time when shutdowns occur and is considered for calculating the minimum number of units in the synchronization process for each plant.The minimum downtime determines whether a unit deactivated during h' must be considered unavailable for electricity production during h.
2 Optimization Procedure
Based on the foregoing mathematical demonstration,the overall operating cost of the system in power investment decisions depends on the actual operating capacity,heat rate,lifetime,utilization rate (coal and gas),and typical size of the unit.However,no apparent functional connection exists between the “decision variables” and actual operating power of the unit.To resolve this difficulty,an MILP approach based on flexibility and sensitivity is proposed.The critical determinants of the model for new investment decisions are carbon emission factors,reserve margin,resource availability,fuel consumption,and fuel price within a target time horizon.The research considers 2020–2060 (the period set by China to work on achieving carbon neutrality) as the time span.This study explains the primary method for comparing renewable energy investments with different costs and time horizons.First,the annual investment cost is determined; then,the annual return on investment is considered.The mathematical equation is as follows:
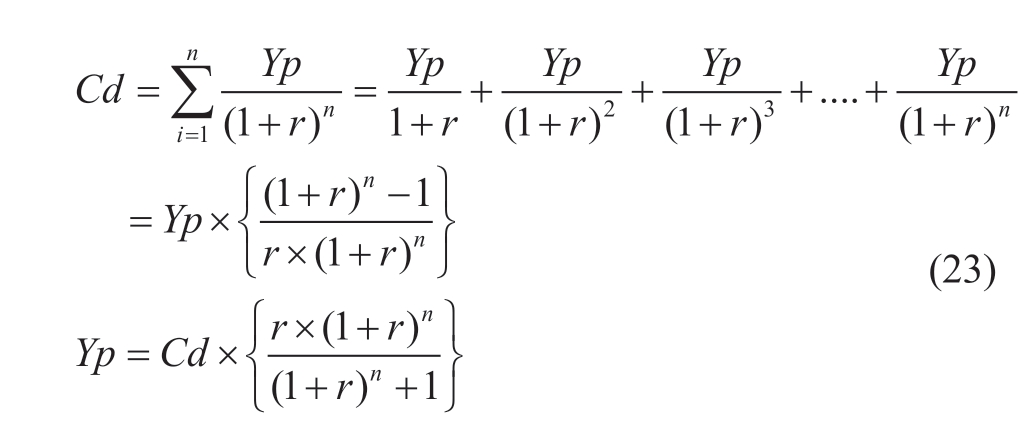
where Cd is the current investment data leading to a regular annual payment (Yp) with the interest rate,r,and time horizon,n.Equation (23) implies that the annual investment cost is a function of current capital expenditure,investment time horizon,and interest rate.
As shown in Fig.1,the overall process used in this study can be divided into five steps.
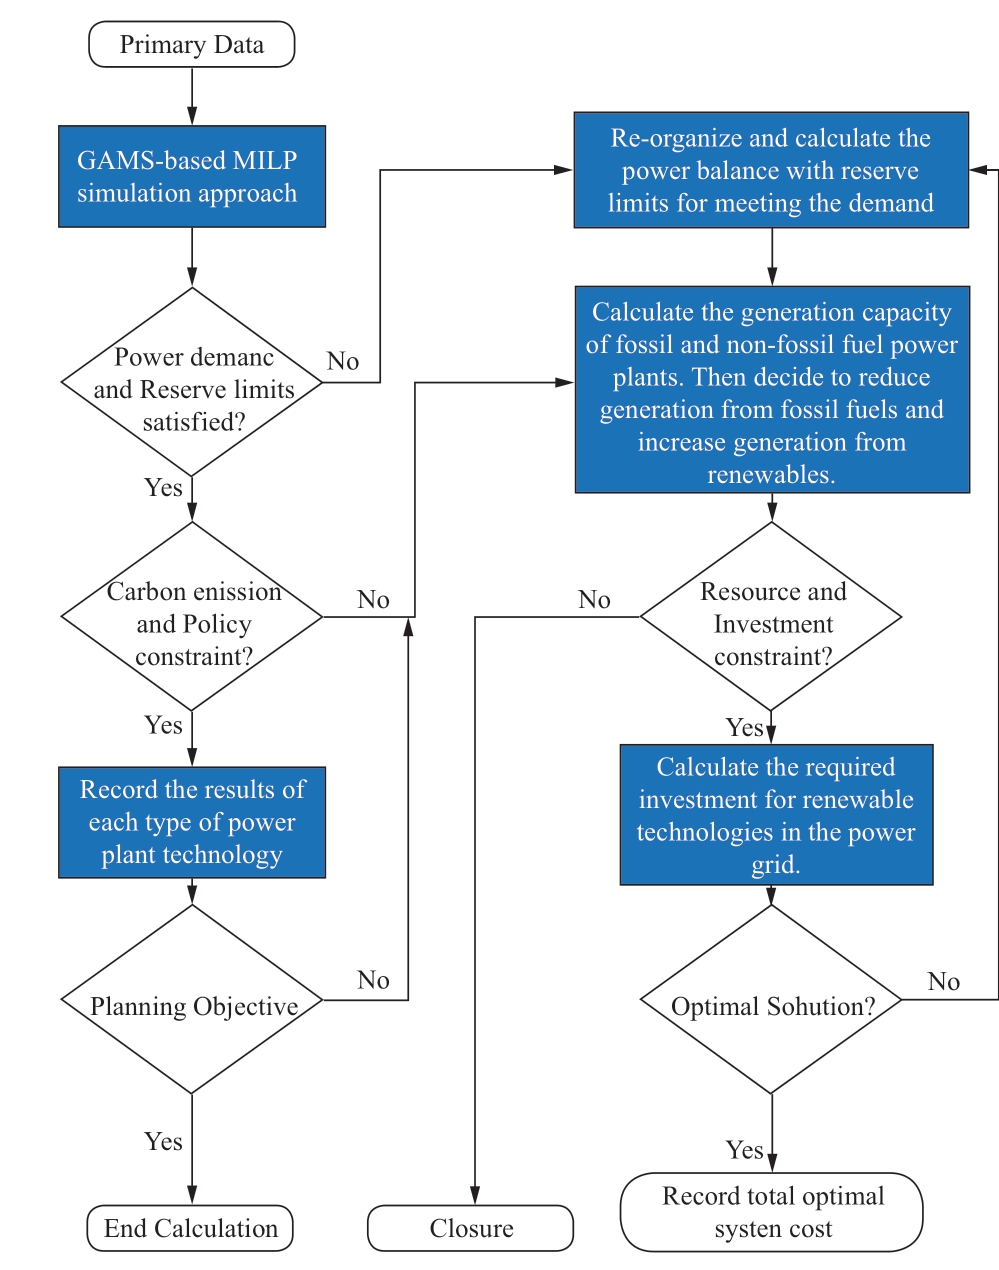
Fig.1 Overall Optimization framework
Step 1: Input the initial data,including plant,demand,fuel,and other relevant data.Define the set,parameter,variable,and equation according to the mathematical analysis in the GAMS platform.
Step 2: According to the initial power generation variables,check the power balance constraint and reserve margin of each load hour.If the demand is satisfied,proceed to the next stage.Otherwise,perform the iterative process to reorganize and perform the calculation using the CPLEX solver to satisfy the demand.
Step 3: The low-carbon emission requirement is verified by activating the carbon emissions and policy constraints.If various power plant technologies satisfy the requirements,the next phase is to record the results and evaluate whether the outcomes achieve the planning objective.Otherwise,reduce fossil fuel generation and increase non-fossil fuel generation by activating the resource constraint.If the latest fossil power units exist,their generation capacity is first reduced.If no latest fossil-based power units are available,the generation capacity of the current fossil-based power units declines in terms of the emission and principle of the optimal economy until the carbon emission requirements are satisfied.To compensate for the power generation capacity of the reduced fossil-based unit,the capacity of non-fossilbased power units is expanded according to the principle of an optimal economy.
Step 4: If the generation result does not satisfy the resource constraint,the calculation is stopped,and the operation is aborted.If the foregoing condition is satisfied,the renewable investment condition is checked,and the number of generation units required for non-fossil fuels is calculated.
Step 5: In the last phase,check whether the solution is feasible.If an optimal solution is not found,proceed to Step 2.The optimal system cost is calculated,and the results are recorded if a feasible solution is found.
3 Result Analysis
3.1 Numerical data
This study considers the entire structure of China’s power industry.For the analysis,the time horizon is 2020–2060 (the period set by China to work on achieving carbon neutrality).This study considers 2020 as the year of commissioning and considers the hourly load demand.The reserve rate,interest rate,discount rate,and maximum annual carbon emission are set to 10%,0.1%,0.01%,and 100 Mtoe,respectively.This MILP-based generation expansion optimization model is implemented in GAMS.Moreover,the commercial solver CPLEX is used to simulate the model on a computer with an Intel(R) Core(TM) i7-6500U CPU 2.60-GHz processor and 16-GB RAM.The proposed model solves 44 299 single equations,11 844 discrete variables,and 24 571 single variables.The simulation time is 9.922 s.
3.2 Experimental Outcomes
The proposed MILP-based generation expansion optimization model accounts for carbon emissions and policy constraints to achieve carbon neutrality.In the case study,the emission rates are calculated considering the heat rate,carbon emission factor,and corresponding utilization hours of different power plant technologies.As shown in Fig.2,the carbon emissions of the power sector sharply reduce after 2030 and remain between the 1.5°and 2° policy scenarios of China’s CO2 emission reduction trends.China announced its 14th and 15th Five-year Plans(FYPs),on “controlling coal consumption,” and “phase out” policy for 2060.The research model is based on these policies.As shown in Fig.2,by 2025,CO2 emissions is expected to reach 40.37 billion tons by strictly limiting coal consumption.Coal-based power sources are targeted to decrease starting from 2026 onwards owing to the coal phase-out policy until 0.98 billion ton is reached by 2060.The foregoing offers a proper generation expansion in the power sector.
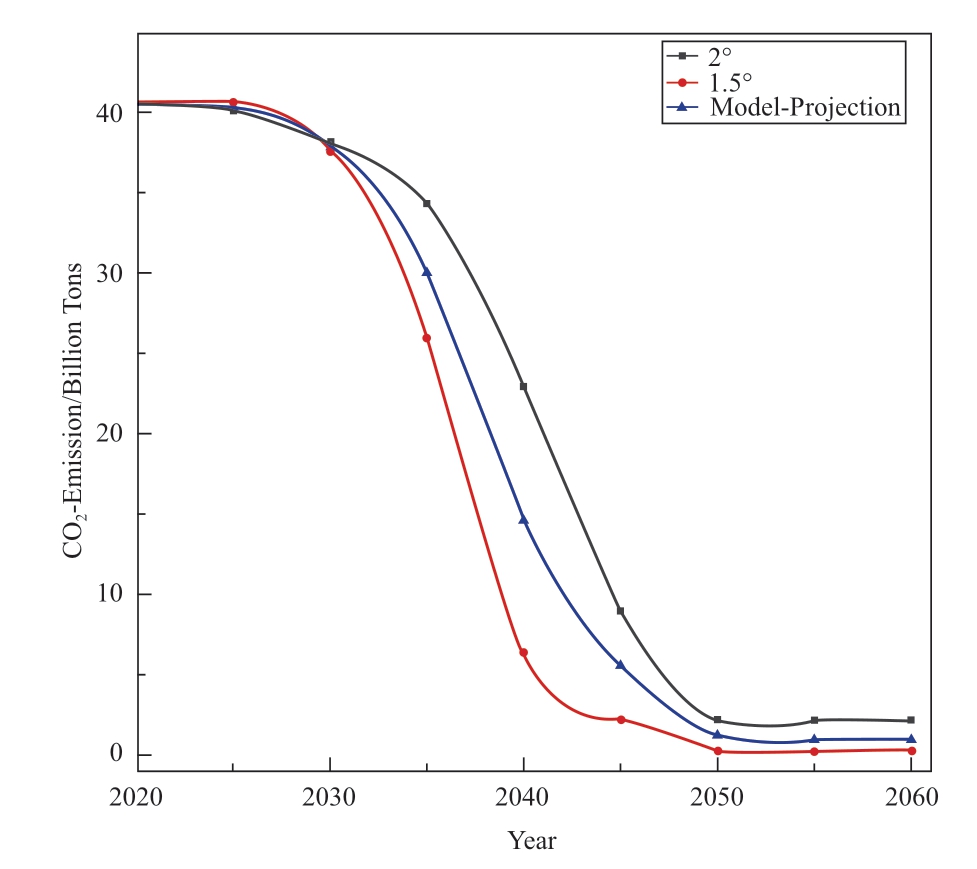
Fig.2 Carbon emission for different policy scenarios
The shift toward renewable energy sources (RESs)in response to carbon emission constraints is reflected by the changes in the maximum installed capacity of power plants,as shown in Fig.3.The data presented in the figure show that the total installed capacity increased significantly from 2200 to 7565 GW.This increase is mainly due to advances in renewable energy technologies,which play an increasingly important role in the energy mix.In contrast,the installed capacity of fossil fuel power plants has decreased from 1235 to 935 GW.This decline highlights the reduced reliance on fossil fuels as an energy source and the shift to cleaner and more sustainable alternatives.Overall,the changes in the installed power plant capacity shown in Fig.3 demonstrate a shift toward a more sustainable energy mix characterized by greater reliance on RESs and reduction in the use of fossil fuels.
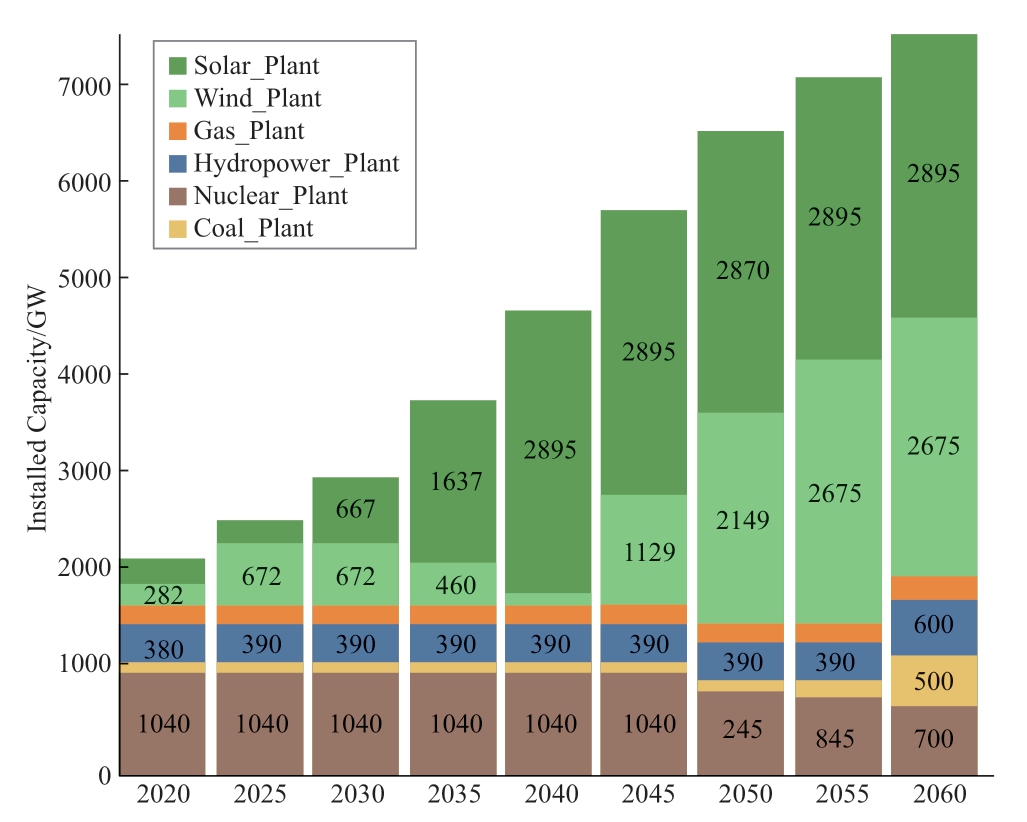
Fig.3 Installed capacity of different power plant technologies
The generation capacity of each significant power plant technology is shown in Fig.4.The figure shows a shift toward RESs,particularly solar and wind and away from traditional fossil fuel sources,such as coal-fired and gasfired power plants.By 2060,solar energy is anticipated to have the highest generation capacity,followed by wind energy,showing the growing importance of RESs in satisfying future energy demands.The decrease in the generation capacity of coal and gas power plants and the more modest increase in capacity of hydropower and nuclear power plants indicate a shift away from traditional energy sources.The proposed model clearly depicts the changing landscape of energy generation and the role of different power plant technologies in satisfying energy demand.
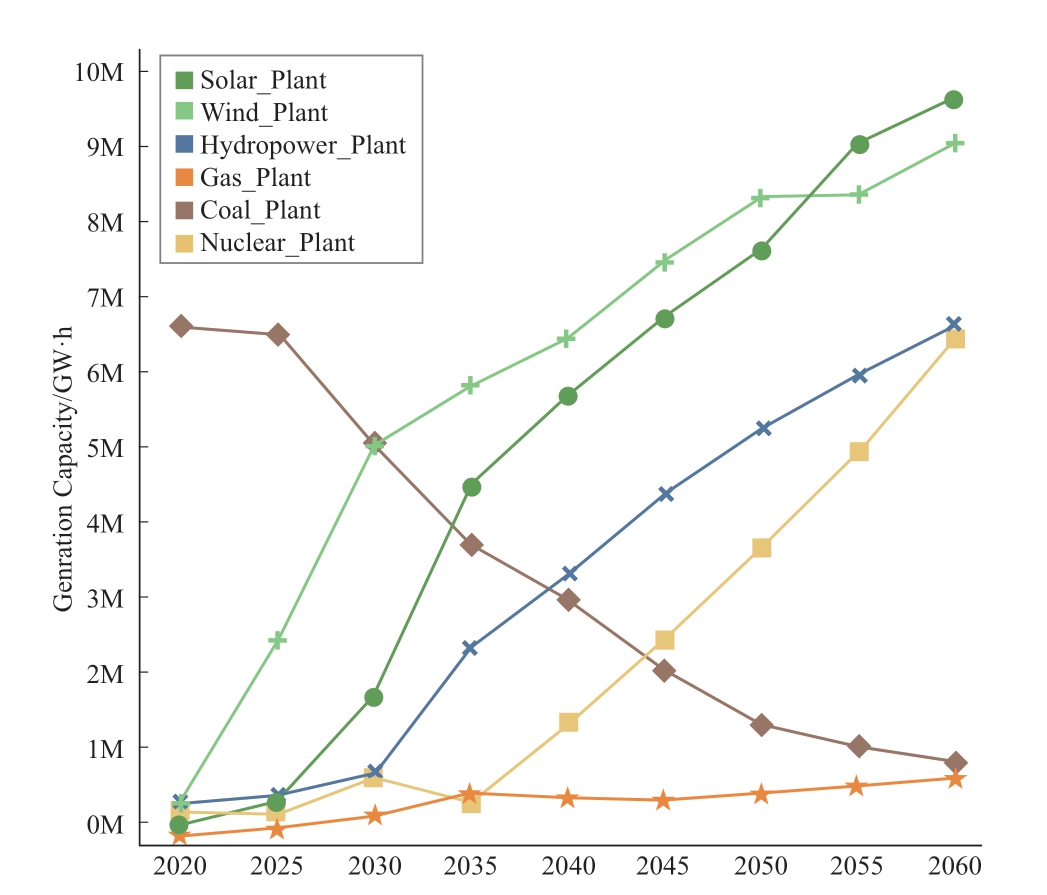
Fig.4 Power generation capacity of different power plant technologies
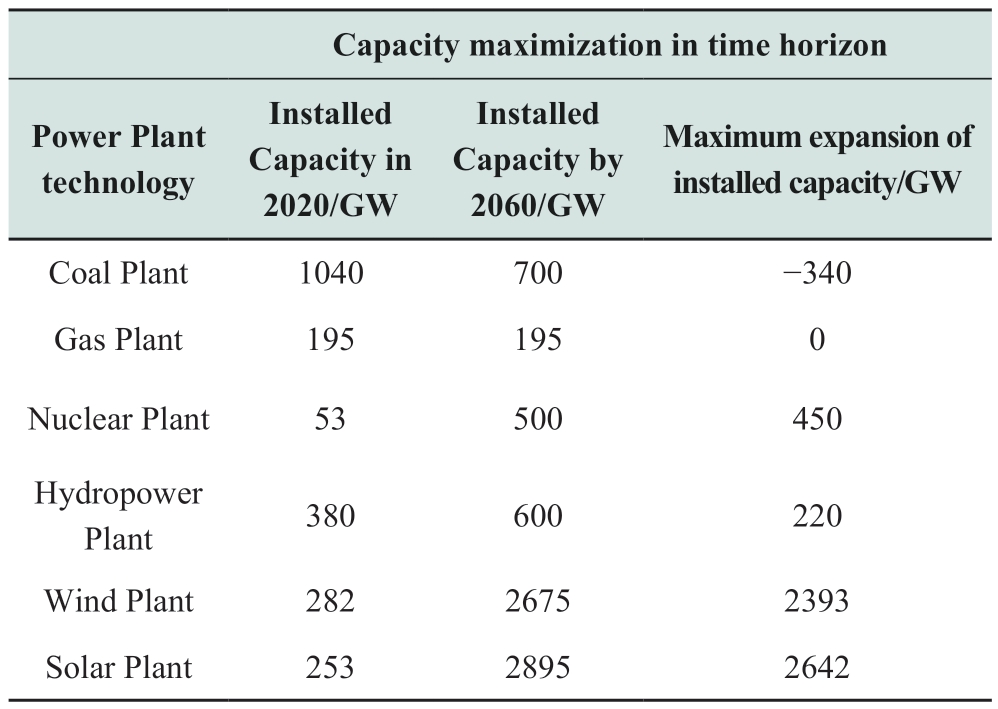
Table 1 summarizes the current power resource status of China as determined by the foregoing analysis.
Table 1 Power resource status in China
The hourly electricity generation by power plant type over the course of a typical day from 2020 to 2060 is shown in Fig.5.The figure illustrates that nuclear and coal plants are the least fluctuating categories,with continuous operations throughout the day in 2020.However,the generation capacities of hydropower and gas,wind,and solar power plants dynamically adjust to changes in electricity demand.The figure shows an increasing trend toward the increased use of RESs over the years,as evidenced by the increasing share of renewables in electricity generation after 2020.One notable observation from 2035 is the significant decrease in coal-based electricity production as a result of the CO2 emission constraints implemented in the model.To compensate for this reduction,the data show an increase in the stable power output of the nuclear and natural gas plants.Furthermore,solar power plants are a crucial source of electricity generation,especially during daytime,whereas hydropower and wind and gas power plants adjust their outputs to satisfy variable load demands.By 2050,the data show a continued decline in coal-based electricity production,with natural gas as the primary source during peak hours,in accordance with the policy scenario and carbon emission constraints outlined in the proposed model.Fig.5.provides a comprehensive overview of the hourly power generation trends by power plant type,highlighting the shift toward the adoption of RESs and the gradual phasing out of fossil fuel-based electricity production.The data support the objective of the proposed model,which aims to attain a low-carbon energy mix by implementing carbon emission constraints.
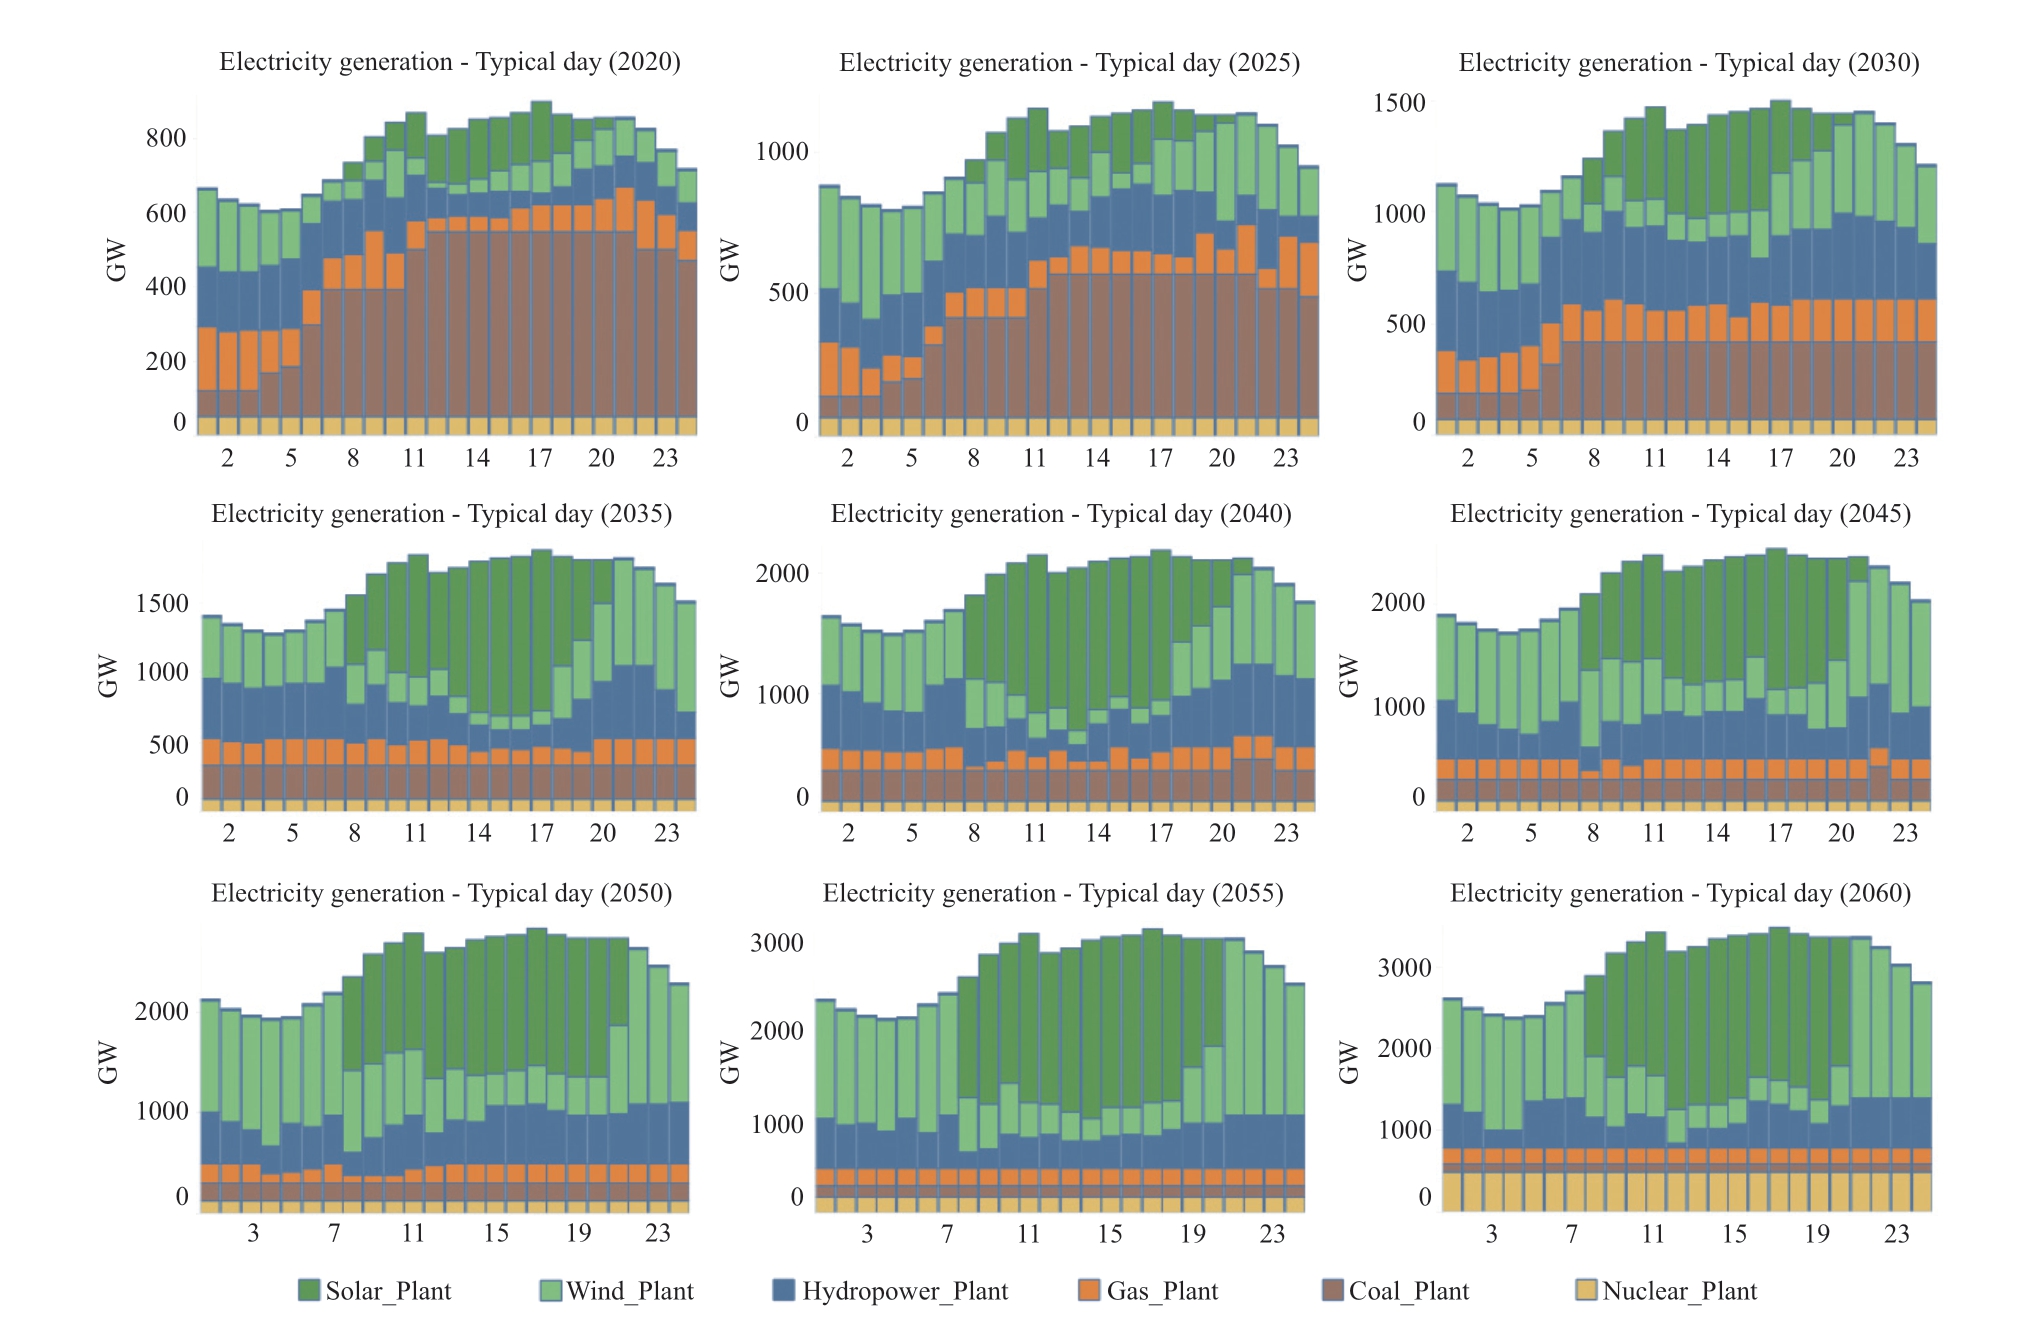
Fig.5 Hourly electricity generation on a typical day from 2020 to 2060
As shown in Fig.6,fossil fuel consumption is decreasing owing to low fossil fuel power generation,environmental concerns,and the goal of achieving low-carbon emissions.Coal consumption dropped from 18 691.18 (fuel) to 4500 TW∙h.
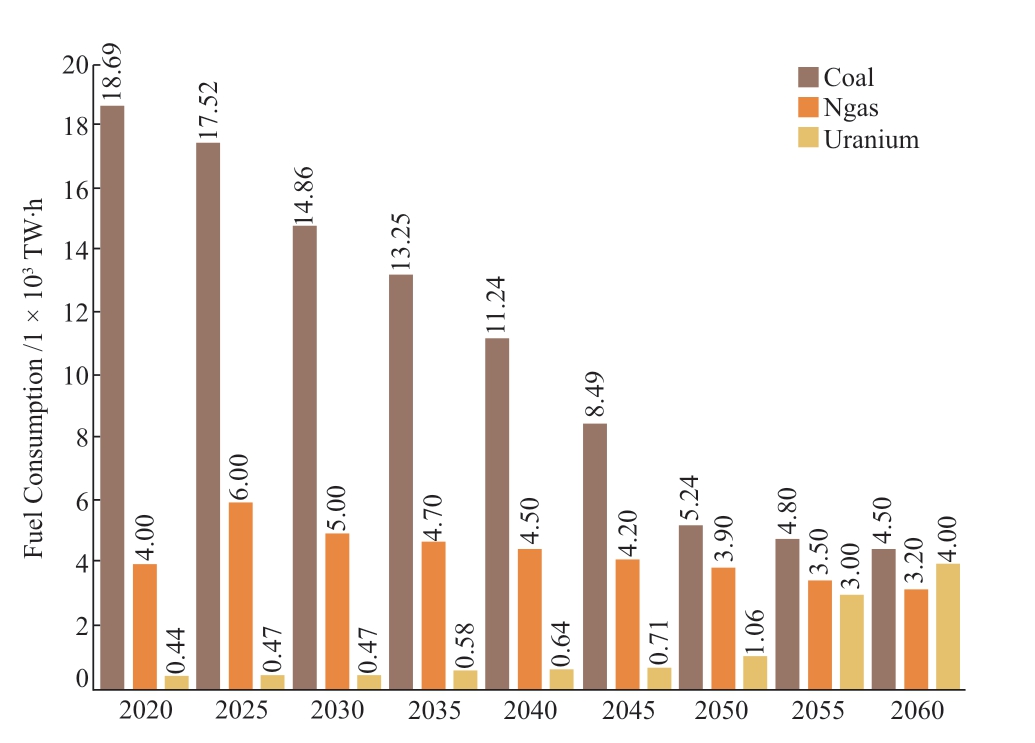
Fig.6 Fossil fuel consumption over time horizon
Moreover,as shown in Fig.7,owing to CO2 emission concerns,investments in coal-fired and gas-fired power plants decline.By 2060,the investments in renewable power plant technologies,particularly wind and solar,are anticipated to be to approximately 2093 and 2814 GW,respectively.The figure further implies that solar and wind power are the dominant sources of the newly added capacity in the generation grid.Fluctuation in the newly added capacity between solar and wind occurs owing to geographical concerns,installation,operation,and maintenance cost,priority of investing in a particular technology,and predictable electricity output.In contrast,the total investments in hydropower and nuclear power plants are expected to be 128 and 330 GW,respectively.Moreover,the increase in demand and the reserve margin constraint are foreseen to lead to new investments.
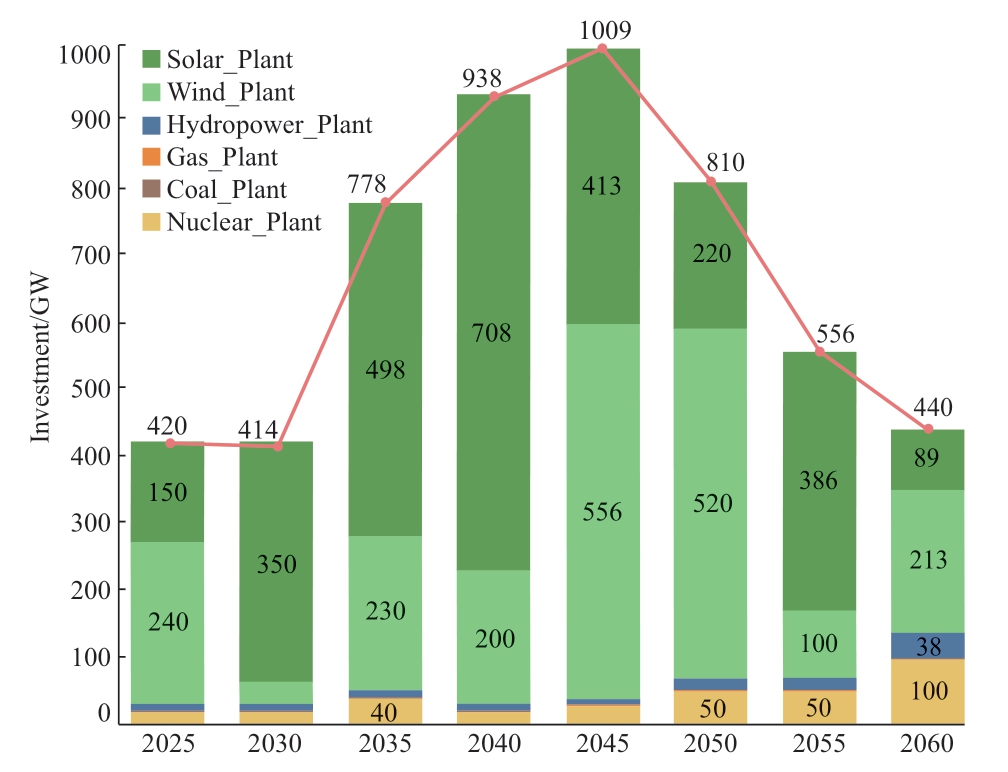
Fig.7 Newly added renewable energy capacity in planning horizon
The CO2 emission constraint gradually marginalizes electricity production by conventional power plants.
The overall optimal cost of the integrated power system with the predicted future demands is presented in Fig.8.The total cost increases with the investment in renewable technology.By 2060,the cost of the system is expected to increase from 2420.7 to 4462.8 billion yuan.The figure illustrates that after 2045,the total cost of the system starts to decrease because sufficient renewable units are already in action,and a relatively small amount of investment is required during these years.As a result,the overall system cost is considerably reduced.After 2055,previously installed renewable units start expiring due to their short lifespan.Accordingly,new investments in solar,hydropower,nuclear,and wind energy are required during these years.These are anticipated to increase the system cost to approximately 3575 billion yuan to 4462 billion yuan by 2060.The above figure shows the trend of the projected future power demand (GW) and system cost (billion yuan).The blue and orange bars denote the power demand and the system’s total cost,respectively.The proposed model further predicts that the cost of the system may significantly decrease; this differs from the anticipated annual increase in the rate of power demand.The development of a model that simultaneously reduces cost and satisfies ever-increasing demand is one of the most critical aspects of this study.The fact that the proposed model satisfies both requirements,as demonstrated in Fig.8,indicates its feasibility.
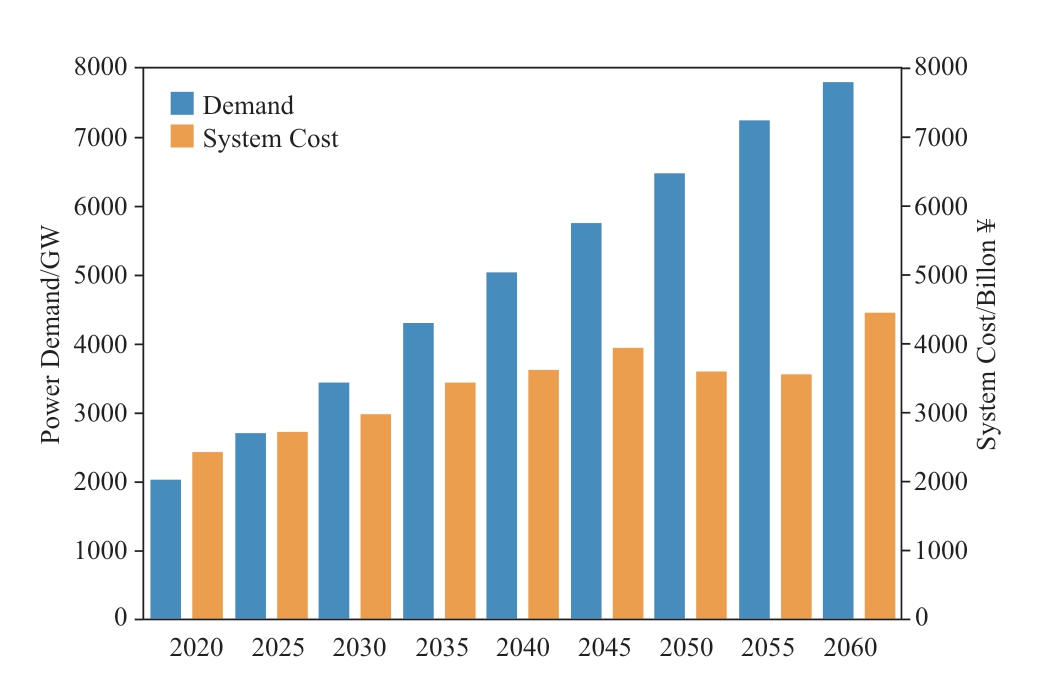
Fig.8 Total optimal system cost with predicted future demand
3.3 Analyzing and contrasting different modeling scenarios
This study considers the three most crucial modeling cases for comparison.First,it considers the “China 2050 High-penetration Renewable Energy Scenario and Roadmap” study [20].This research formulated a power sector improvement approach under a fixed socioeconomic development goal with significant penetration of RESs.The other two cases were conducted by the IEA [21] based on the energy transformation scenarios of China and the IEA World Energy Outlook [22].“New Policies Scenario (NPS)and the Sustainable Development Scenario (SDS)” in the long-term evolution of China’s power system were presented[21].The current study considers the 2035 and 2050 milestones for comparison.As shown in Fig.9,the total capacity of China’s High-penetration RES (5060 GW) is the largest among all the modeling cases.This can increase the total system cost owing to the extensive penetration of renewable technologies over a certain period.Nevertheless,the total installed capacity does not considerably differ from those of the other modeling cases,including our model scenario (3812 GW); this balances the total optimal system cost.The analysis indicates that the ratio of non-fossil to fossil fuel technology in the NPS modeling case of the IEA is 56%–44%.This assumed range is low and suits the highly ambitious objective of the 2060 green development in the power sector.The proposed model yields a 35%–65% nonfossil-to-fossil-fuel ratio,which is a relatively reasonable solution compatible with the IEA SDS (32%–68%)modeling case.As shown in Fig.10,the total capacity of the China HP RES model in 2050 is approximately 6854 GW; the ratio of non-fossil to fossil fuels is 17.6%–82.4%.In contrast,the proposed model (2050 model) yields a result of approximately 6569 GW corresponding to a ratio in the range 17.7%–82.3%.As summarized in Table 2,the total power generation calculated by the China HP RES model in 2050 is 26 865.3 TW∙h.In contrast,the proposed model computes approximately 27 592.8 TW∙h.The absolute gap between these two models is approximately 727.5 TW∙h.
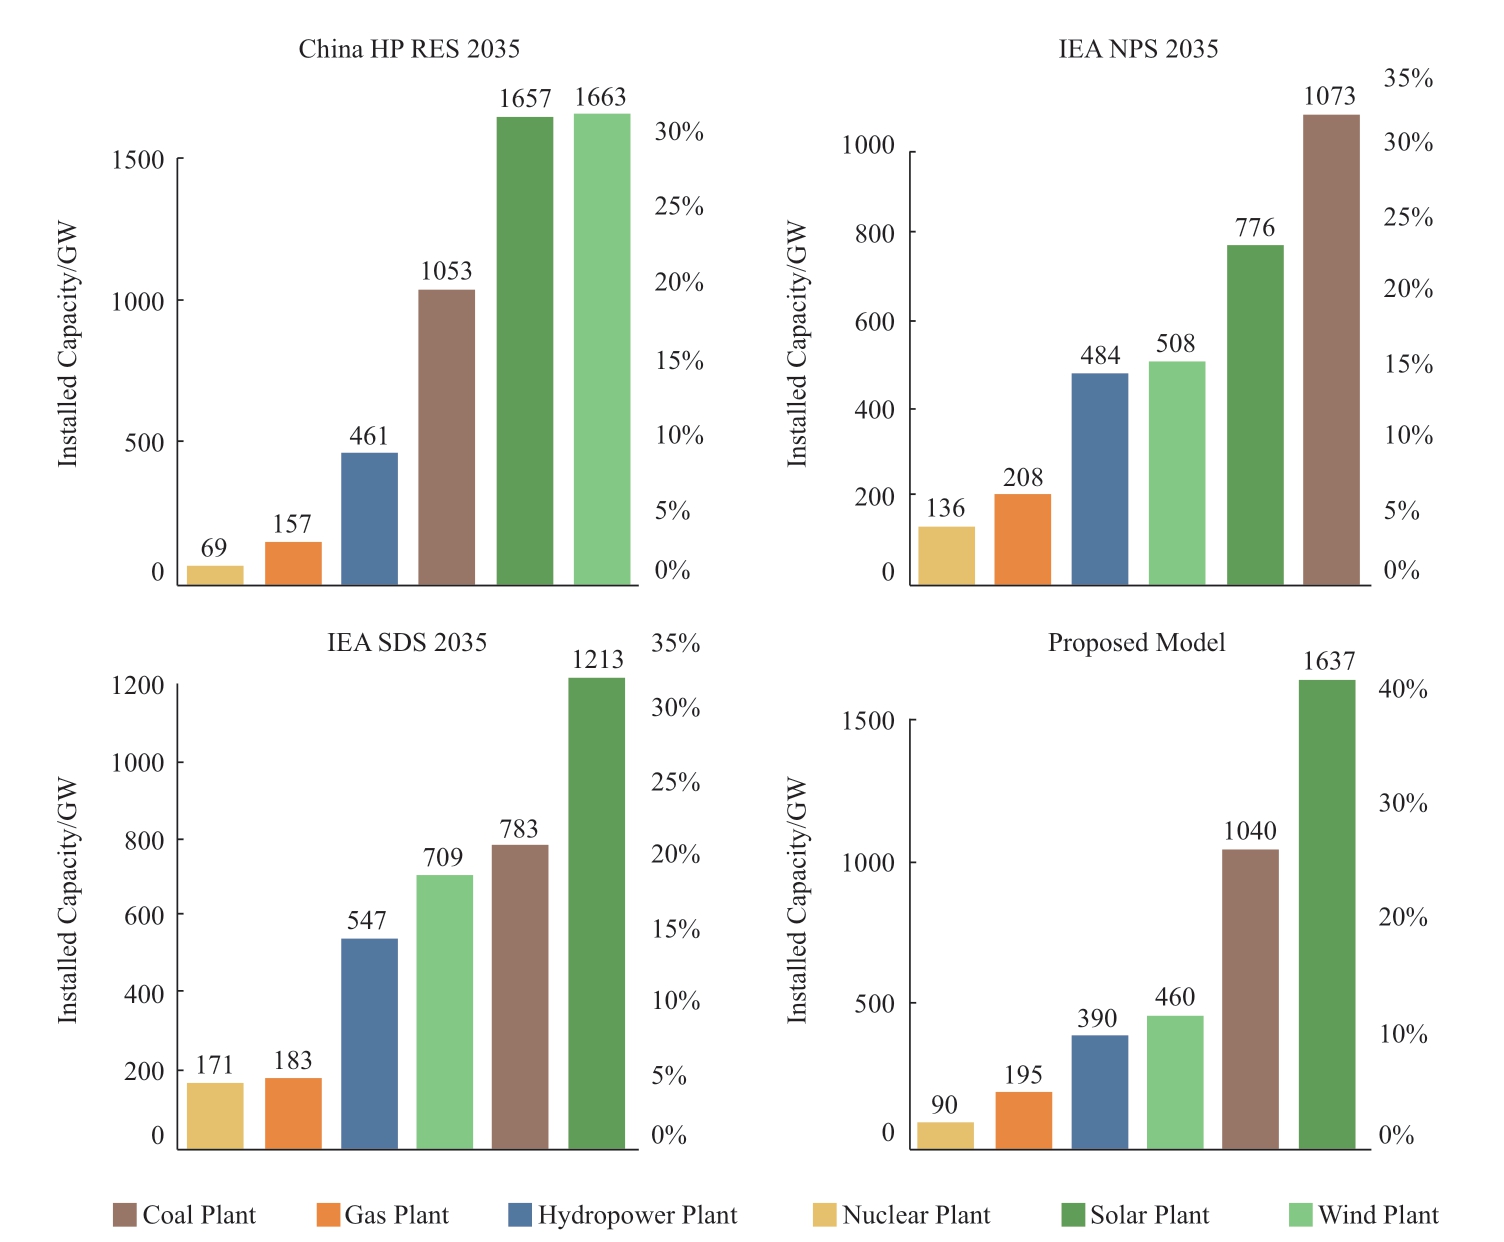
Fig.9 Installed capacity projection based on various modeling cases in 2035
Table 2 Generation and emission scenario by 2050
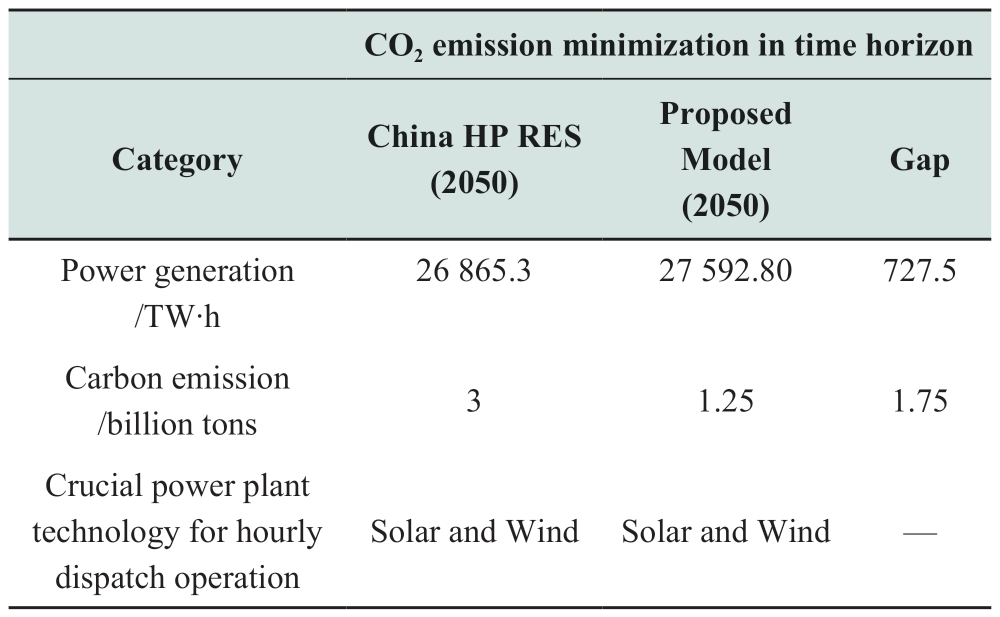
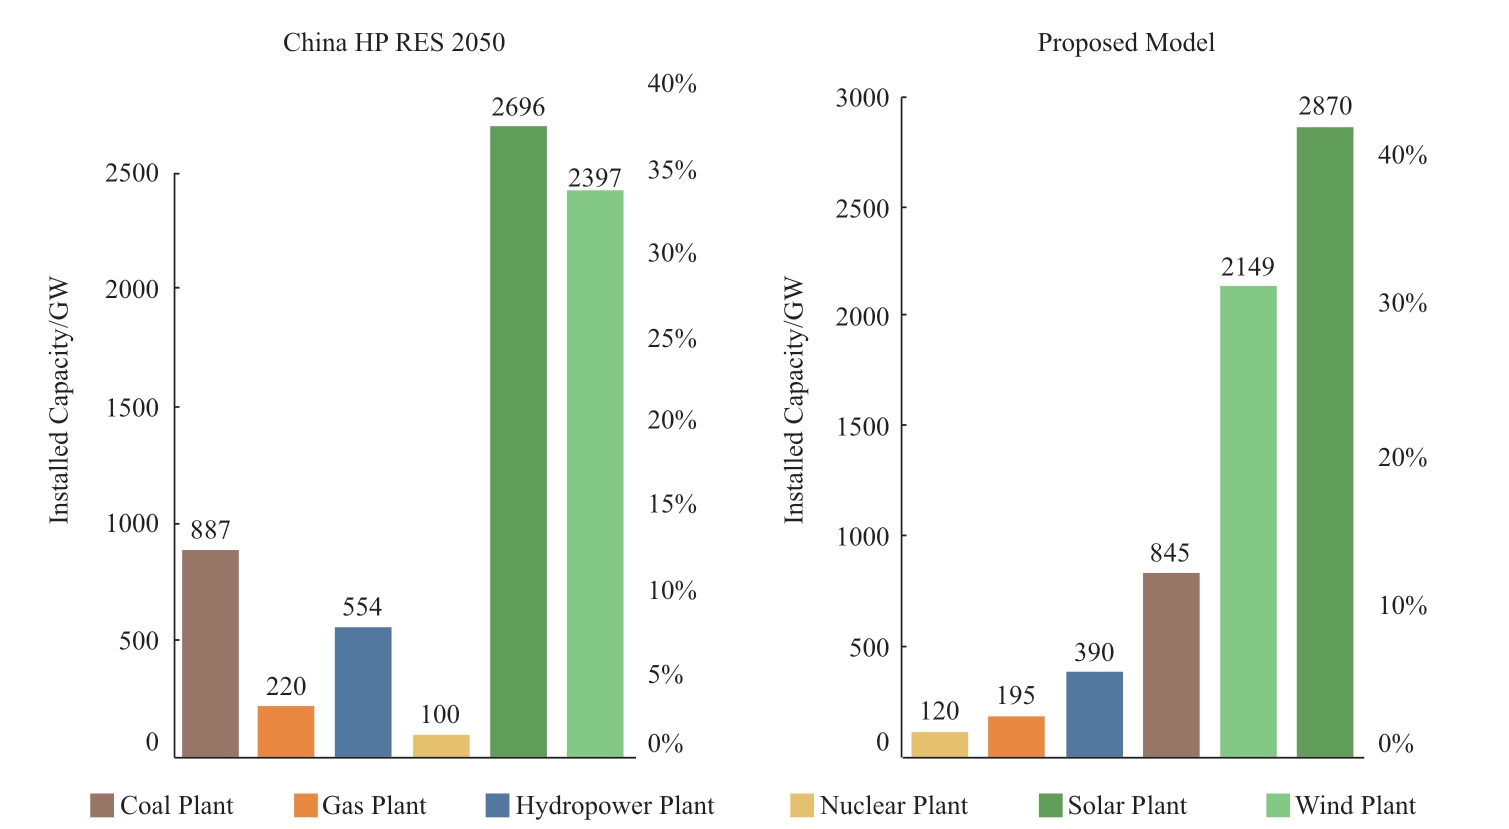
Fig.10 Installed capacity projection between China HP RES and proposed model in 2050
The contribution of renewable energy to power generation is approximately 85.8% in the China HP RES modeling case.
In contrast,in the proposed modeling case,the renewable energy is approximately 77.7%,which is a valuable consideration for achieving the ambitious netzero emissions target by 2060.In the China HP RES modeling case,the total carbon emission is anticipated to reach 3 billion tons from the present level.However,in the proposed modeling case,the total carbon emission decreases to approximately 1.25 billion tons,signifying extremely low carbon emissions.This assumption can significantly contribute to China’s carbon neutral goals by 2060.
From a policy perspective,the NPS of IEA explores the proposed and current policies,focusing on spot market reform and increasing the regional trade in electricity supply.In contrast,IEA-SDS explores different “advanced flexibility options” for thorough transformation by integrating advanced technologies into the power system.However,China is a “coal-dominated” energy system where low-cost renewable technologies have a significant role in the transition.In this case,the market structure for renewable technologies,the adverse social and environmental impacts of thermal plant decommissioning,and the new technology infrastructure are not sufficiently mature.This presents significant challenges to lowcarbon transition goals.Therefore,the Paris Agreement,China’s 14th and 15th five-year plan for “controlling coal consumption” and achieving “phase out,” and the high integration of renewable technologies to attain carbon neutrality by 2060 have been considered in the formulation of the proposed model.According to the foregoing results,the proposed model can provide the most efficient energy transition strategies to reduce the carbon peak and attain the carbon neutral goal by 2060.
4 Recommendations
4.1 Initiate a plan of action to adjust the positioning of coal power functions
The rapid development of power industries in China can lead to spontaneous and robust economic growth in the coming decades.Even with a significantly high percentage of RESs in the future power grid,traditional energy supplies,such as coal and gas,are expected to play a significant role in the rapid development and flexible energy transition of power industries.According to the case study,more than 75% of the amount of electricity generated and 51% of the installed capacity in 2020 are provided by the traditional power supply.Coal-fired power plants are the dominant source of domestic installed capacity and power generation.This study shows that the dependency on installed coalfired power plants is anticipated to gradually reduce to 34% and 9.25% by 2030 and 2060,respectively.This is due to the focus on renewable energy,carbon emissions,policy concerns,and flexible management.Empirical analysis shows that coal is no longer the primary energy source in the future.It can only be used to satisfy peak load demand and as a backup power source.The study results show that the use of RESs is economically and technically feasible to satisfy future demands.
However,the policy scenarios for fossil fuel-based power supplies must be reviewed and modified according to critical actions,such as accelerated decommissioning,flexibility modification,and switching to backup power.Here,some policy suggestions are presented for fossil fuelbased power supply to achieve the carbon neutrality goal by analyzing the following concerns.
1) Gradually reduce coal-fired power generation,and curtail coal unit generation and utilization hours.Meanwhile,the government must retain high-performance coal-fired units for flexibility modification and as backup units.
2) Other power sources (renewables,nuclear,and pumped hydropower) must resort to the support services of fossil fuels.Feasible capacity compensation reparation costs must be provided to control the cost of viable operation of coal-fired units.Moreover,achieving the short-term,midterm,and long-term carbon neutrality goals in the energy sector may be beneficial.
3) The flexibility transformation of coal-fired power units can be more economical because of the high construction costs of hydroelectric plants and energy storage facilities.However,different strategies must be adopted depending on the emission,peak regulation,and efficiency of fossil fuel power units.
4.2 Accelerate the construction of clean energy sources,and build a diversified supply system
Increasing the proportion of RESs is necessary for GEP planning to satisfy climate protection objectives.The high availability of RESs has promoted the strategic transformation of power systems.Our case study indicates that by 2060,the share of renewable power generation increases from approximately 11% to 57%,and power generation from coal drops from approximately 60% to 5%.Power generation from natural gas slightly increases from approximately 2.49% to 2.60%,and that of hydropower rises from 17.9% to 19.80%.Power generation from nuclear power plants increases from 4.95% to 19.23%.For hourly dispatch operations,solar and wind power are expected to contribute significantly to satisfy the variable load demand.Our study indicated that solar and wind power dominated the power sources for increasing the share of renewable energy power generation.Renewable energy investment in China must focus on solar energy rather than on wind energy considering their installation,operation,and maintenance costs.Nuclear power is an efficient,stable,and clean energy source.This can be a valuable supplement to replace coal power and build a carbon neutral energy supply.In contrast,gas power plays a role in satisfying the peak demand.The following can be considered.
Expand the development mode,and diversify the use of clean energy because clean energy can gradually evolve into a primary power source.Therefore,adhering to centralized and distributed development and optimizing the layout in different phases are appropriate.
Strengthen the top-level design,implement the overall coordination of the electricity market,enrich the variety of transactions,improve the trading mechanism,and accelerate the construction of a complete and coordinated electricity market system.
4.3 Accelerate the exploration of carbon-negative technology
Our study shows that by 2050,the design lifespans of a certain number of coal power plants have not been reached;hence,these plants are not decommissioned.Consequently,they can increase emit carbon emissions.In this regard,the technology of carbon capture,usage,and storage (CCUS)can play a significant role in the thorough decarbonization of the power sector.Based on the optimal power allocation and evaluation results,the following can be considered.
Accelerating initiatives to reduce integration costs can promote the use of CCUS.To promote the large-scale commercial application of CCUS technology as soon as possible,relevant departments must increase the investment in research and workforce.
5 Conclusion
This research proposes a GEP model to integrate different power plant technologies,fuel types,and hourly load distributions.The model concurrently considers all the available power supply and demand elements for a unit commitment to ensure a feasible solution for the entire power system; MILP solves the optimization problem.The proposed model considers a scenario based on China’s power system as a case study.The empirical results indicate six benefits that can be derived from this study.(1) This study considers the hourly operational simulation scope for unit commitment to satisfy the power balance inside the planning horizon.Consequently,the model can replicate the inconsistency and overall flexibility of the power system,particularly when variable amounts of renewable energy are generated.(2) Owing to the detailed representation of the reserve power market,the model can produce the daily power supply profile of the examined case study.(3) The model developed in this study provides the choice of load cut when the existing power capacity is insufficient to satisfy the electricity demand.(4) The model proposes a viable investment decision by evaluating the installed capacity,utilization,and emission rates.(5) The model offers precise policy recommendations to achieve carbon neutrality.(6) This study attains a balance among power technologies for future investment by considering the economic and environmental perspectives.
The scope of improvement of the proposed model can be further extended.The focus of the model is more on macrolevel planning; hence,future work will center on more refined minute-level operational simulations.The prediction of future power growth trends must be refined.Similarly,renewable energy exhibits seasonal fluctuations in power generation.In this case,the energy storage technology can play a vital role because of its peak shaving and regulation ability.In a future work,we will explore CCUS technology in detail and quantitatively analyze their impact on energy transition.
The proposed MILP-based GEP model may be employed by countries with similar future states because the results are scientifically significant.The experimental study demonstrates the efficacy of the model in dealing with GEP.
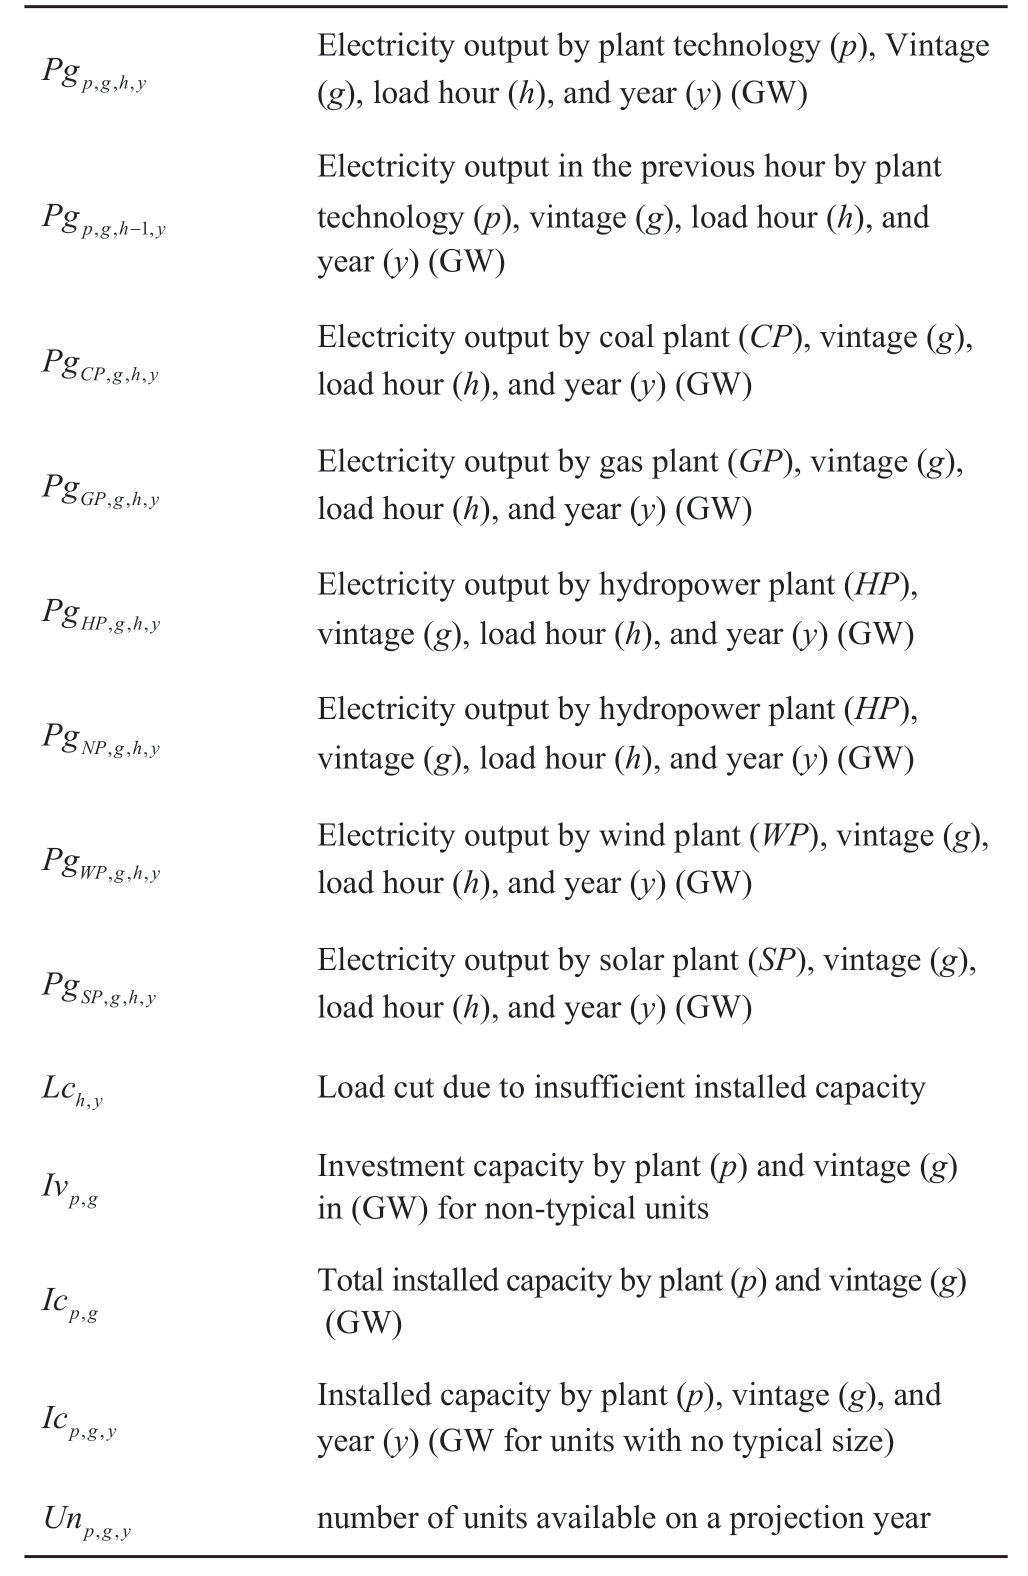
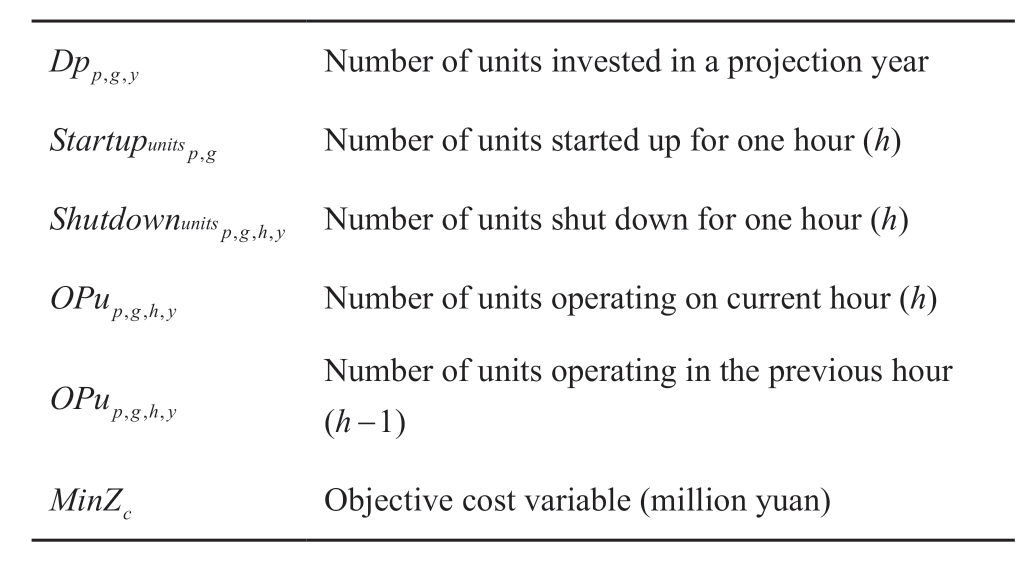
Nomenclature
A.Sets
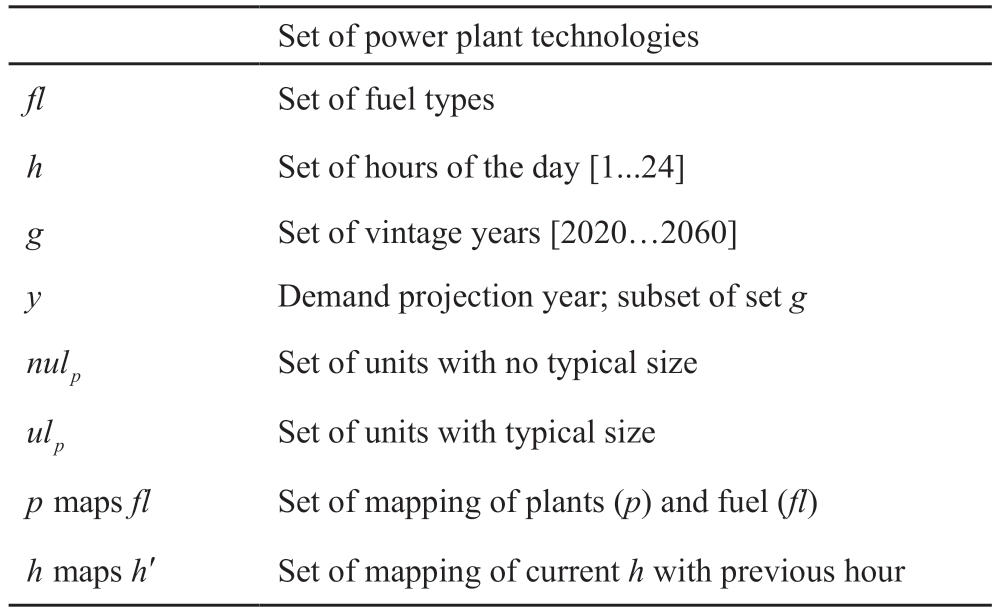
B.Parameters
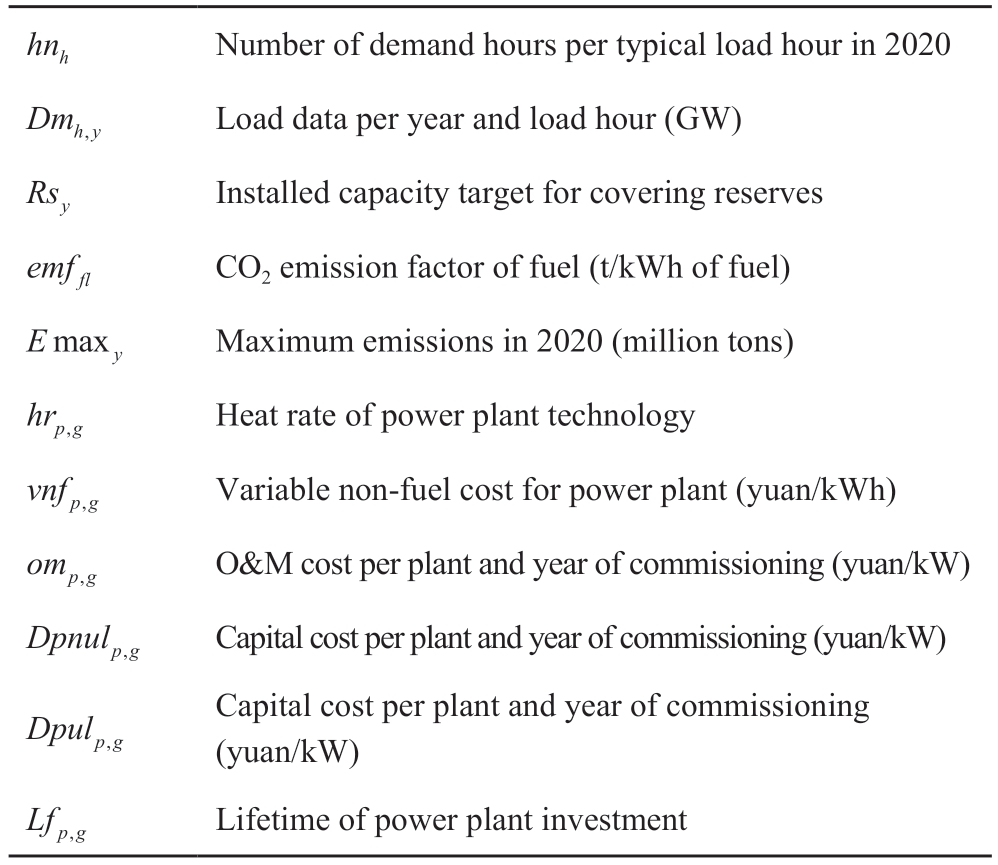
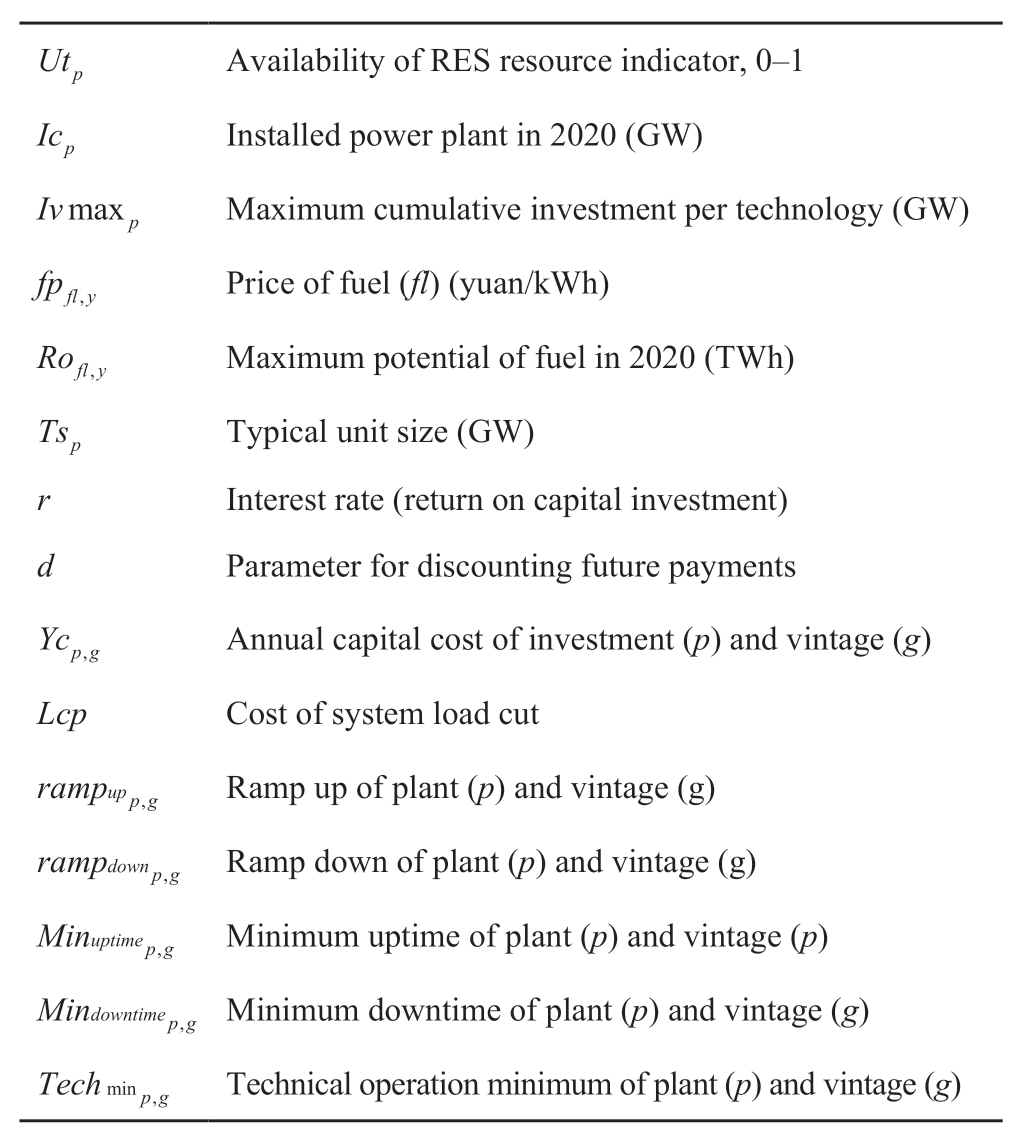
C.Variables
Acknowledgements
This study was supported by the Natural Science Foundation of Shandong Province (No.ZR2019MEE078)and Education and Teaching Reform Research Project of Shandong University (“Development of an experiment platform to support the intelligent energy courses”).
Declaration of Competing Interest
We declare that we have no conflict of interest.
References
[1] Xu Y C (2018) China's giant state-owned enterprises as policy advocates: The case of the state grid corporation of China.The China Journal,79(1): 21-39
[2] BP Company (2006) BP Statistical Review of World Energy June 2020
[3] Ji Z,Chen Q X,Zhang N,et al.(2013) Low-carbon generation expansion planning model incorporating carbon capture power plant.Power Syst Technol,37(10): 2689-2696(in Chinese)
[4] Lou S H,Lu S Y,Wu Y W,et al.(2013) An overview on lowcarbon power system planning and operation optimization.Power System Technology,37(6): 1483-1490(in Chinese)
[5] Rebennack S (2014) Generation expansion planning under uncertainty with emissions quotas.Electric Power Systems Research,114: 78-85
[6] Han X J,Wang L N,Gao T,et al.(2016) Generation planning of grid-connected micro-grid system with PV and batteries storage system based on cost and benefit analysis.Transactions of China Electrotechnical Society,31(14): 31-39,66(in Chinese)
[7] Luo J S,Lu C,Meng F J (2016) Generation expansion planning and its benefit evaluation considering carbon emission and coal supply constraints.Automation of Electric Power Systems,40(11): 47-52(in Chinese)
[8] Ji Z,Kang C Q,Chen Q X,et al.(2013) Low-carbon power system dispatch incorporating carbon capture power plants.IEEE Transactions on Power Systems,28(4): 4615-4623
[9] Y Mi,C Liu,J Yang,et al.(2021) Low-carbon generation expansion planning considering uncertainty of renewable energy at multi-time scales.Global Energy Interconnection,4(3): 261-272
[10] Duan J M,Wang Z X,Wang C M et al.(2015) Renewable power planning considering carbon emission reduction benefits.Power System Technology,39(1): 11-15(in Chinese)
[11] Du E S,Sun Y L,Zhang N,et al.(2015) Transmission expansion planning model facilitating low-carbon power sources development.Power System Technology,39(10): 2725-2730(in Chinese)
[12] Zhang X H,Yan P D,Ge S P,et al.(2016) Multi-scenario flexible generation expansion planning under incentive system of renewable energy.Advanced Technology of Electrical Engineering and Energy,35(3): 26-33(in Chinese)
[13] Chen H F,Wang F,Xu Y Z,et al.(2020) A Generation Expansion Planning Method for Power Systems With Largescale New Energy.13th International Conference on Intelligent Computation Technology and Automation (ICICTA).Xi’an,China.IEEE,638-642
[14] Zhang Y Z,Zhang N,Dai H C,et al.(2021) Model construction and pathways of low-Carbon transition of China's Power System.Electric Power,54(3): 1-11(in Chinese)
[15] Akbarzade H,Amraee T (2019) A Model for Generation Expansion Planning in Power Systems Considering Emission Costs,2018 Smart Grid Conference (SGC).Sanandaj,Iran.IEEE,1-5
[16] Shu Y B,Zhang Z G,Guo J B,et al.(2017) Study on key factors and solution of renewable energy accommodation.Proceedings of the CSEE,37(1): 1-9(in Chinese)
[17] Soroudi A (2017) Power system optimization modeling in GAMS,Springer
[18] Aghaei J,Amjady N,Baharvandi A,et al.(2014) Generation and transmission expansion planning: MILP–based probabilistic model.IEEE Transaction on Power Systems,29(4): 1592-1601
[19] Pozo D,Sauma E E,Contreras J (2012) A three-level static MILP model for generation and transmission expansion planning.IEEE Transactions on Power Systems,28(1): 202-210
[20] NDRC (2015) 2050 High Renewable Energy Penetration Scenario and Roadmap Study.Energy Research Institute: Beijing,China
[21] Wang Q R (2019) China Power System Transformation.IEA,Paris
[22] Cozzi L (2018) World Energy Outlook 2018.IEA,Paris
Full-length article
Received: 16 August 2022/ Accepted: 21 February 2023/ Published: 25 April 2023
 Hasan Mehedi
hasanmehediswust@gmail.com
Xiaobin Wang
wangxiaobinlq@163.com
Shilong Ye
slgye@ucdavis.edu
Guiting Xue
xueguiting@163.com
Islam Md Shariful
sharif@mail.sdu.edu.cn
Fang Shi
shifang@sdu.edu.cn
2096-5117/© 2023 Global Energy Interconnection Development and Cooperation Organization.Production and hosting by Elsevier B.V.on behalf of KeAi Communications Co.,Ltd.This is an open access article under the CC BY-NC-ND license (http: //creativecommons.org/licenses/by-nc-nd/4.0/).
Biographies

Hasan Mehedi received his B.E.degree in Electrical Electronics and Communication Engineering from Pabna University of Science and Technology,Bangladesh,in 2017.Currently,he is pursuing his M.E.degree in Electrical Engineering under the Key Laboratory of Power System Intelligent Dispatch and Control of the Ministry of Education in Shandong University,Jinan,China.His present research interest is power system planning,modeling,and integration of renewable energy in the distribution grid.

Xiaobin Wang received his B.E.degree in Electrical Engineering from University of Jinan,Jinan,China.He is currently working toward an M.E.degree in Electrical Engineering with the Key Laboratory of Power System Intelligent Dispatch and Control of the Ministry of Education in Shandong University,Jinan,China.His research interests include fault locations in distribution networks.

Shilong Ye majors in applied math,college of letter and science,University of California Davis,California,USA.His research interests include power system planning and operation.

Guiting Xue received his Ph.D.from Shanghai Jiao Tong University in 2014.He works as a senior engineer at the Haidian Branch of Beijing Electric Power Company,Beijing,China.His research interests include power system stability and control and PMU technology and its applications.

Islam Md Shariful received his M.A.in Economics from Shandong University,China in 2021.He is currently pursuing his Ph.D.in Economics at the School of Economics,Shandong University,Jinan,China.His present research areas are international trade,energy security,and renewable energy in Belt and Road Initiative (BRI) countries.

Fang Shi received his B.E.degree in Electrical Engineering from the China University of Petroleum,Dongying,China in 2006; M.E.degree in Electrical Engineering from the State Grid Electric Power Research Institute,Nanjing,China in 2009; and Ph.D.from Shanghai Jiao Tong University,Shanghai,China in 2014.He is currently an Associate Professor in the Key Laboratory of Power System Intelligent Dispatch and Control of the Ministry of Education,Shandong University,Jinan,China.His research interests include power system stability and control and phasor measurement units (PMU)technology and its applications.
(Editor Yanbo Wang)
