0 Introduction
China has proposed the construction of a new power system with renewable energy as its primary component.It is driven by the annually increasing installed capacity of wind and photovoltaic(PV)power[1].In 2021,China's installed capacity ratio of distributed to centralized PV systems in was 0.31:0.69,which lags Germany’s 1:1 equilibrium model[2,3].In September 2021,the National Energy Administration was anticipated to launch 676 PV pilot projects nationwide,adding 135.2 million kW of distributed PV[4].In the future,distributed PV will gain greater acceptance,and the impact of voltage fluctuation and out-of-limit risk resulting from fluctuation will become more pronounced.Currently,the industry requires suppression of short-term fluctuations[5,6].
Recently,extensive research has been conducted on controlling operations for distribution networks with distributed generation.Initially,the inverter operated in constant power factor or constant-voltage mode.Traditional reactive power compensation devices such as OLTC[7]and capacitors[8]have been used to control the system.Static Var Compensator(SVC),Static Var Generator(SVG),and other new equipment have been considered in the most recent scenarios.Owing to the increase in the penetration rate,the regulation speed and flexibility of conventional equipment cannot keep up with the rapid changes in PV,and the price of new equipment,such as SVG,is high.Considering that the PV output is less than the rated power,the industry is now focused on maximizing the regulation capacity of PV inverters and implementing active regulations to satisfy the safe operation requirements of systems[9,10].
Active inverter control can either be centralized[11],local[12],or distributed[13].The centralized control center collects the status information of each distribution network node and develops an optimization model for the reactive power output of the inverter.Owing to the long control cycle,there is a possibility for the voltage to exceed the threshold because of short-term fluctuations[14].Regularly and independently,the local-control PV system collects the voltage of its access node.It adjusts the reactive power output using a droop-control strategy,which effectively reduces voltage fluctuations.Owing to the lack of coordination between inverters,the output may cause the access node voltage to exceed the threshold or the net loss to increase[15].The distributed control inverter simultaneously monitors the voltage of each PV system.When there is a chance for one voltage to exceed the permissible threshold,the reactive power is immediately adjusted.Accordingly,the adjusted status is simultaneously sent to the adjacent inverter as a control command.Following that,reactive power utilization of all inverters converges and becomes consistent through an iterative update between inverters.All inverters share the regulation task,and each PV has the same responsibilities.The distributed regulation effect is between the centralized and local;however,it is rarely used because of the high requirements for timely communication and elevated risk of communication system failure[13].
Considering the lack of cross-level coordination between the three controls,some researchers have proposed cooperative control between multiple controls to achieve multi-timescale control.In[16],a DG reactive power output optimization model was established by utilizing the system loss and voltage deviation as multi-object functions.Accordingly,an adaptive strategy was proposed to balance centralized and local controls.These findings indicate that the proposed model can adapt to DG fluctuations better than single mode of control.During a control fault,reference[17]proposed a coordinated control strategy for centralized and local controls and adjusted the voltage to avoid a voltage outside the threshold.The results demonstrated that the coordinated strategy can effectively reduce security risks during a system emergency.The control strategy proposed in[18]was predicated on a sensitivity analysis of the voltage to the PV reactive power output within the voltage safety range,and the local control parameters of the inverter were optimized to minimize the total reactive power.In[19],the interval model was utilized to establish robust centralized local control by considering the unpredictability of active power.Reference[20]proposed the dynamic reduction local control of active power by establishing a centralized local optimization model to reduce the overall reduction of active power.Utilizing scenario analysis,a previous study determined a reasonable range of local control slope parameter values to establish a slope determined a reasonable range of local control slope parameter values and established a slope optimization model with minimal network loss as the objective[21],thereby enhancing the operational economy while maintaining safety.
Nevertheless,the centralized local model made optimization decisions based on the source load prediction data of the subsequent control section.When shortterm fluctuations in the period are significant or the load changes abruptly,the control strategy may not consider the fluctuations during this control period,resulting in an outof-limit voltage at the access node.The collaborative control model utilizes global data for periodic and centralized optimization of the local control strategy.The local reactive power output is dynamically determined by the product of the droop control slope and voltage fluctuation value of the access node.The previous studies considered reactive power control in collaborative control and ignored the coordination and cooperation between active and reactive power.To account for the unpredictability of distributed PV systems,a robust control model is frequently employed for system optimization,which reduces the economics of system operation.During an extreme local fluctuation,more extreme measures,such as machine and load shedding,are implemented instead of local control.
This study proposes a two-stage generation method of centralized local control strategy to enhance the capability of a high-permeability distribution system to deal with short-term PV fluctuations and reduce the operational risk resulting from uncertainty.Initially,the reactive and active power reduction of the PV inverter was optimized to minimize network loss and active power reduction based on prediction data for the next 15 min.Subsequently,the voltage distribution and inverter output information were transmitted to the local control optimization.The primary objectives of local optimization include maintaining the optimal network loss as much as possible and reducing the short-term fluctuations of PV generation.A minutelong interval model was developed,and local control was simulated.The droop control slope parameters of each inverter were optimized to minimize the voltage fluctuation loss and opportunity constraint relative to the first stage.The two-stage optimization procedure enabled active power reduction,served as a reactive power reference,and generated the local control slope,which were then transmitted to the inverter for centralized local control.
1 Central-local control considering opportunity constraint of fluctuation
The present work proposes a two-stage control strategy generation method for optimizing and implementing the centralized local control strategy by optimizing two different time scales,namely 15-minute centralized control and 1-minute local control.The overall structure of the model is shown in Fig.1.
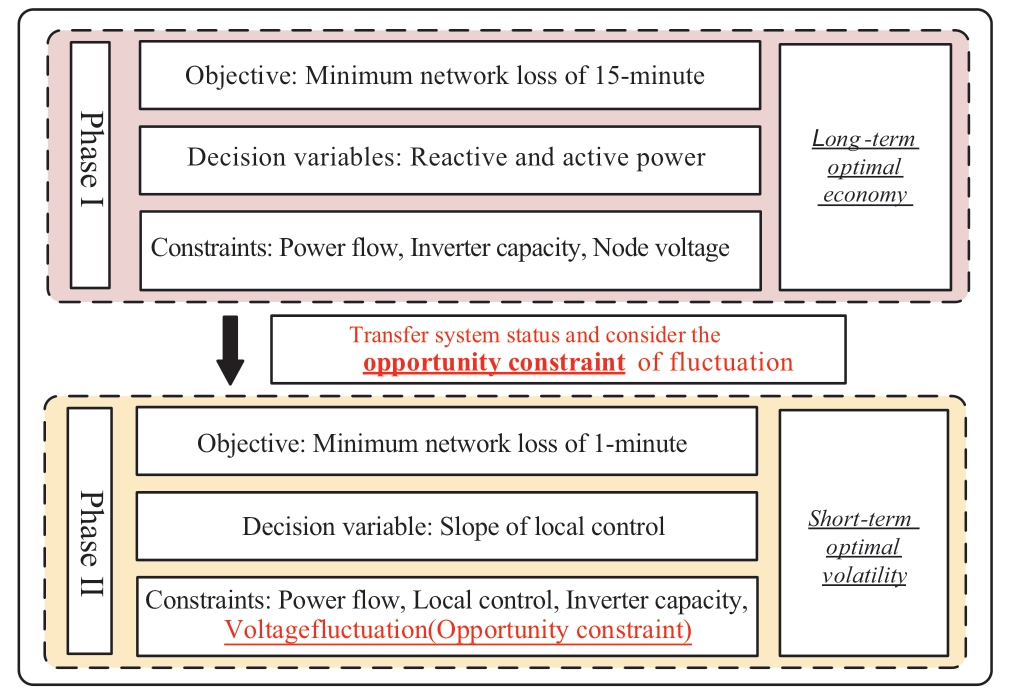
Fig.1 General framework of the proposed model
1.1 Phase I:PV output optimization considering active power reduction
In the initial stage,the active and reactive outputs of the inverter are optimized to minimize the weighted comprehensive loss and light rejection based on the 15-minute prediction data.The model is described in the following section.
1.1.1 Decision variable
The decision variable matrix Xt1 is composed of the active reduced power ![]() and reactive power
and reactive power ![]() of the PV inverter at node i at time t1 and is assumed to be zero when no PV is accessed.
of the PV inverter at node i at time t1 and is assumed to be zero when no PV is accessed.

where i=1,…,N-1and N represents the total number of nodes.
1.1.2 Objective function
The objective function ft1 consists of network loss and active power reduction,whereas the weight coefficient coordinates the PV consumption and operation economy.

where iand j represent the distribution network nodes,Vt1(i)represents the voltage of node i,ij indicates the branch between two points,G(ij),B(ij),δt1(ij)represent the susceptance,conductance,phase angle difference of the ijbranch,respectively,and E denotes the set of system branches.
1.1.3 Constraint condition
(a)Inverter capacity
where ![]() represents the predicted active power of the PV inverter at node
represents the predicted active power of the PV inverter at node![]() represents the reactive power output of the centralized control,and SPV(i)refers to the rated capacity of the inverter.
represents the reactive power output of the centralized control,and SPV(i)refers to the rated capacity of the inverter.
(b)Power balance
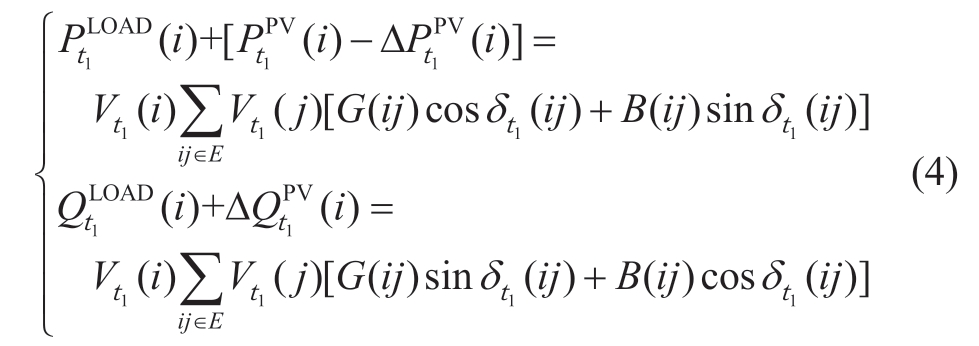
where ![]() and
and ![]() represent the active and reactive power predicted for the load at node i,respectively.
represent the active and reactive power predicted for the load at node i,respectively.
(c)Voltage security
where Vmaxand Vmin indicate the maximum and minimum node voltage,respectively.
1.1.4 Second-order cone-based solution
In the first stage,second-order cone programming is employed to solve the nonlinear non-convex model of the inverter output optimization.The power balance was converted into DistFlow form[22].
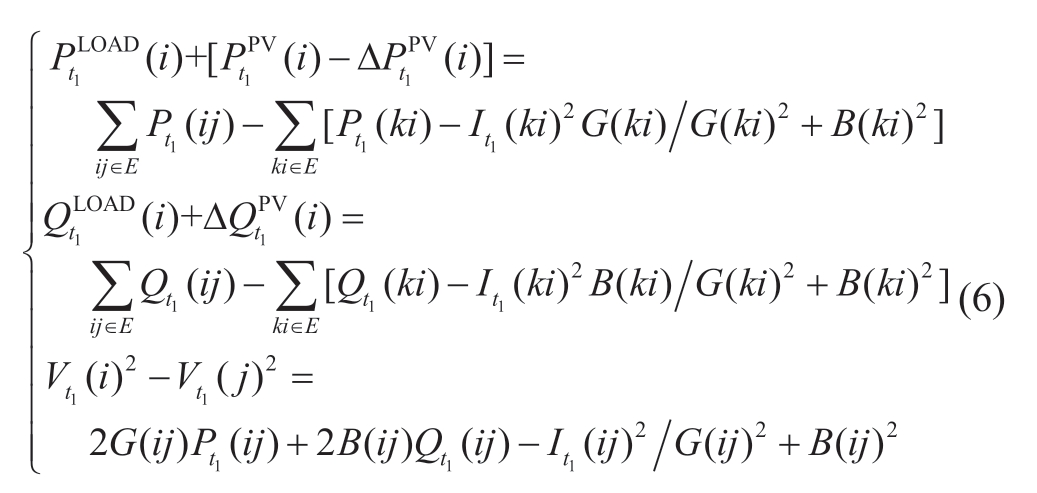
where k represents the node of the distribution network and Pt1(ij)/Qt1(ij)represents the active/reactive transmission power of the ij branch.Here,we replace Vt1(i)2 with the variable ![]() and
and ![]() and relax the equality constraints to obtain the expression below[23].
and relax the equality constraints to obtain the expression below[23].
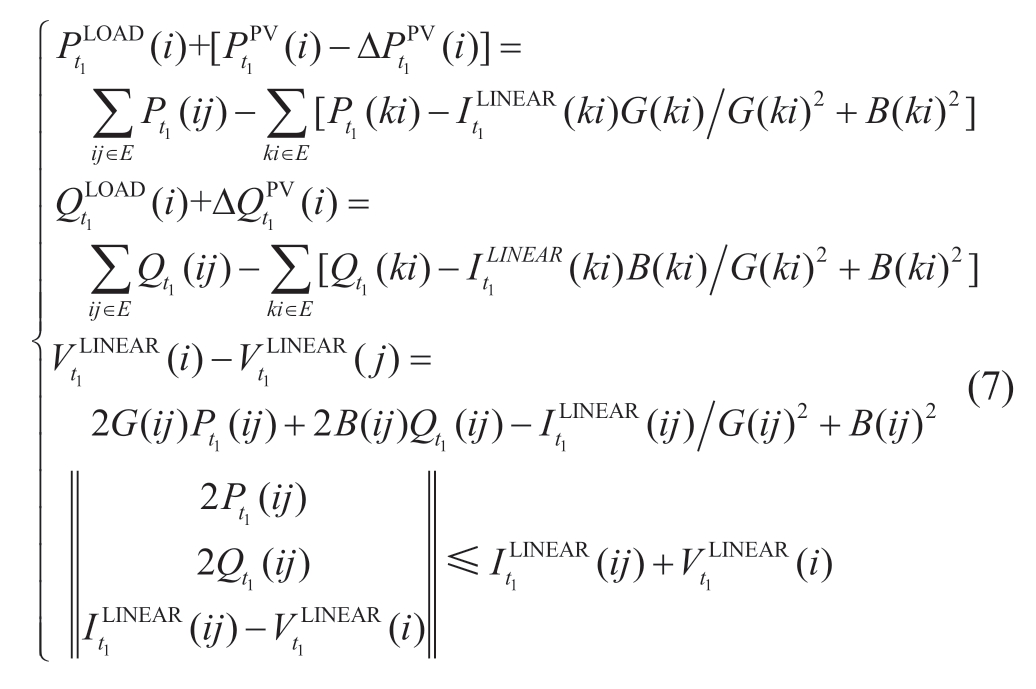
where(2)and(5)are transformed below
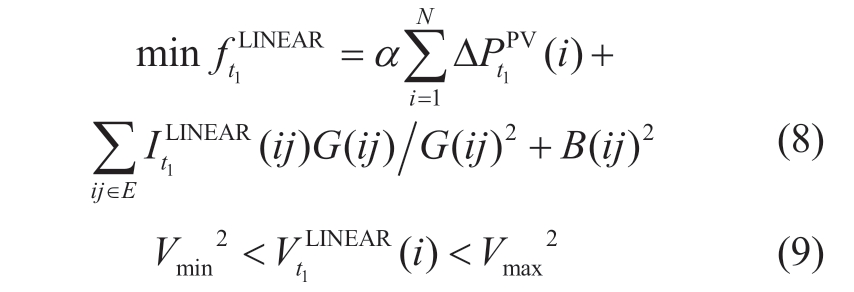
Model(3,7,8,9)were transformed into a second-order cone form solvable using a commercial solver[24].
1.2 Phase II:Local control slope optimization considering fluctuation opportunity constraint
Based on the active and reactive outputs of the inverter in the first stage,the second stage optimizes the local control slope of each inverter such that the system can track the optimal voltage distribution on a short timescale via the inverter reactive power local control.The model ensures that the node voltage does not exceed the threshold and maintains the loss level of the operating network during short-term fluctuations.The interval model was utilized to model short-term fluctuations,simulate the minutelevel local control operation of the inverter,calculate the fluctuation state of the system,and solve the slope optimization model using the opportunity constraint method.
1.2.1 Decision variable
The decision variable matrix Yt1 consists of the inverter local control slope mt1(i)inperiod t1 and is assumed to be zero in the absence of PV.
1.2.2 Minute-by-minute fluctuation
The 1-minute prediction datawere generated using a linear interpolation method based on the 15-minute prediction data.

where t2 = 1…,15.Using the interval model,the uncertainty error between the predicted and real data was assessed.

where σPV/σLOAD indicates the PV/load uncertainty parameter determined using conventional data fitting.
1.2.3 Objective function
The objective function calculates the average network loss to stabilize the voltage following the effects caused by fluctuations and tracks the optimal system state in the first stage.

1.2.4 Constraint condition
(a)Local control
The reactive power output of the local control strategy is directly proportional to the voltage fluctuation between inverter access nodes.In this study,the local control cycle lasted for 1 min,which is the same as the prediction cycle.
(b)Slope parameter
The slope determines the compensation relationship between the reactive power output and voltage fluctuation.A scenario analysis method was employed to derive the value range.The lower limit can fundamentally suppress the fluctuation of the access point.
where SV-Q represents the sensitivity matrix system from reactive power to voltage.Extreme voltage fluctuations can be controlled using the upper limit of the slope.

where ΔVt2(i)max/ΔQt2(i)max represents the maximum voltage deviation at the minute scale of node i and the remaining reactive power regulation capacity.min[a,b]denotes the minimum value-determining function.
(c)Inverter capacity
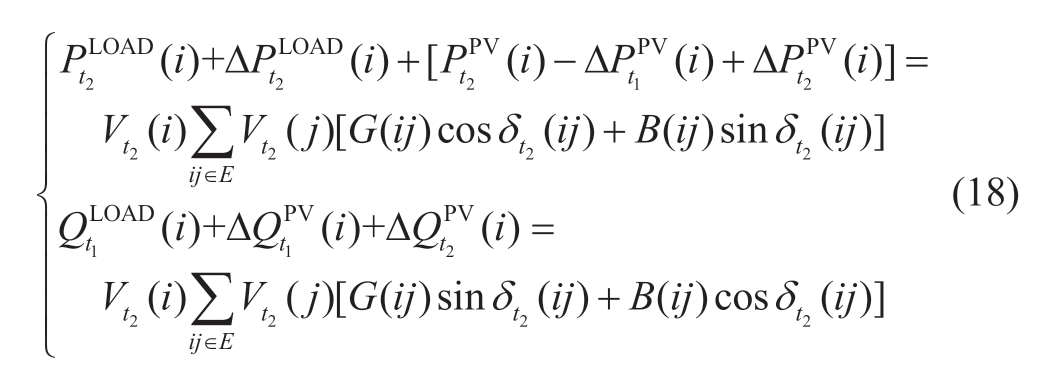
(d)Power balance
(e)Fluctuation chance constraint
If the voltage fluctuations operate at an acceptable level of risk,the operational economy and DG absorption capacity are enhanced.To ensure the voltage level is maintained,the centralized local control model based on chance-constrained programming considers the probability of short-term voltage fluctuations as the constraint condition.Chance-constrained programming enables the planning decision to partially violate the constraints,while limiting the probability to a specified confidence level.Therefore,the rigid constraints of traditional optimization become flexible to achieve a moderate compromise between the optimization and constraint satisfaction[25].By modifying the local control parameters,the network can prevent the voltage from exceeding the threshold.The probability of voltage fluctuations can be expressed using the following equation:

where f0 denotes the voltage fluctuation risk without considering the uncertainty,δ symbolizes the robustness factor,and ΔUi denotes the voltage fluctuation risk of node i.Probability was calculated using the statistics of the timeseries data.Moreover,wi denotes the weight coefficient of node i.Considering that the voltage at the end of the line and nodes near the PV are more sensitive to fluctuations,a weight model is established considering the difference in inverter capacity to enhance the weight of sensitive nodes.

where Z(ij)represents the ijbranch impedance,![]() represents the source/load apparent power of node i,and i0,ihead,iend correspond to the system balance node,start node,and end node of the feeder at node i,respectively[26].A mathematical model of the local control based on chanceconstrained programming is presented below.
represents the source/load apparent power of node i,and i0,ihead,iend correspond to the system balance node,start node,and end node of the feeder at node i,respectively[26].A mathematical model of the local control based on chanceconstrained programming is presented below.

(f)Voltage security
1.2.5 Sensitivity based problem solving
The slope optimization model in the second stage is a nonlinear and non-convex optimization problem.The voltage control effect of each cycle necessitates 15 iterations of power flow calculations;consequently,the sensitivity theory and differential evolution algorithm were utilized to solve the problem.Based on the initial system voltage state,the Taylor series expansion power balance is as follows:
where St1/ X t1 represents the matrix of the node injection quantity(active/reactive)and state quantity(phase angle/
voltage)in the first stage,ΔSt2/ΔX t2 represents the matrix of the change in the injection quantity and state quantity in the second stage,f denotes the functional relationship between the injection quantity and change quantity,and Jt1 represents the Jacobian matrix of the system power flow calculation,which can be obtained by disregarding higher-order terms as follows:

JP/Q-δ/V represents active/reactive-phase angle/voltage sensitivity matrix,which is substituted into(12)and(14)for the active and reactive changes,respectively.

where(19)can be linearized to yield(26)below.

The objective function in(13)can be linearized as shown below by disregarding the minute-scale phase angle change.

The solution for the control effect of each cycle was reduced to fifteen times the linear sensitivity calculation.To further solve the optimal global solution,a differential evolution algorithm was employed to encode the slope space,and the feasibility of the solution set was evaluated based on inequality constraints.Figure 2 illustrates the model solution method.
2 Case analysis
2.1 System parameter
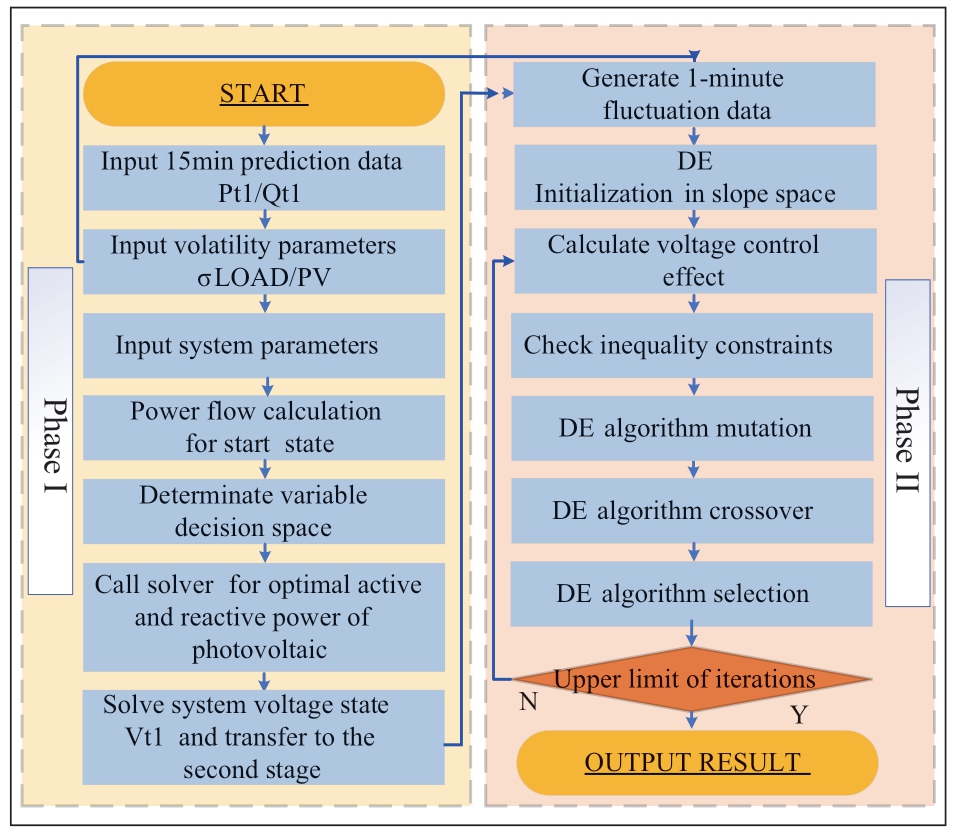
Fig.2 Solution flow chart
Based on the standard example,an enhanced IEEE 33-node simulation was adopted,and eight distributed PV systems were accessed.The system architecture is illustrated in Fig.3.Table 1 lists the rated capacity of each PV system.
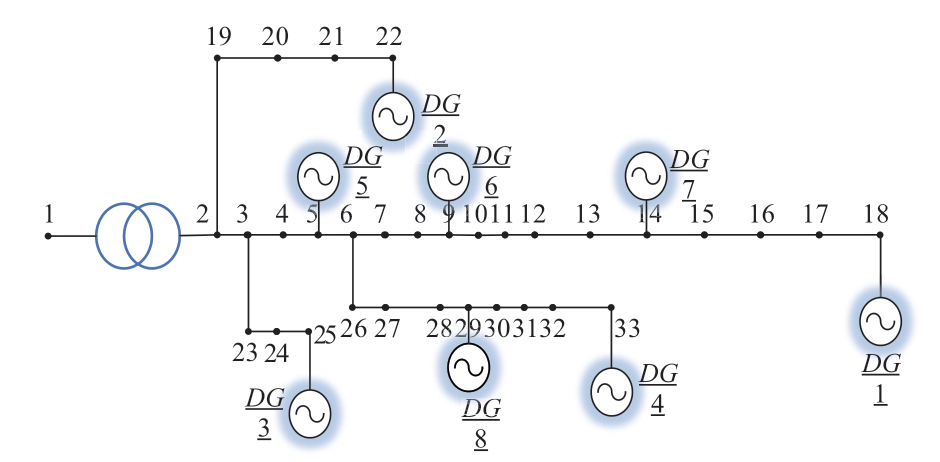
Fig.3 Improved 33-node system structure
Table 1 Rated capacity of PV system

Figure 4 illustrates the daily power curves for each system node.Before active control was implemented,the PV permeability was 40%.The remaining model parameters are listed in Table 2.The simulation program was implemented using MATLAB(R2016a).The program was modelled using the Yalmip library in the initial phase,and the CPLEX toolkit was utilized to solve the function.The Matpower library models the program in the second phase,and a differential evolution algorithm was employed to solve the function.Table 3 lists the parameters of the differential evolution algorithm.
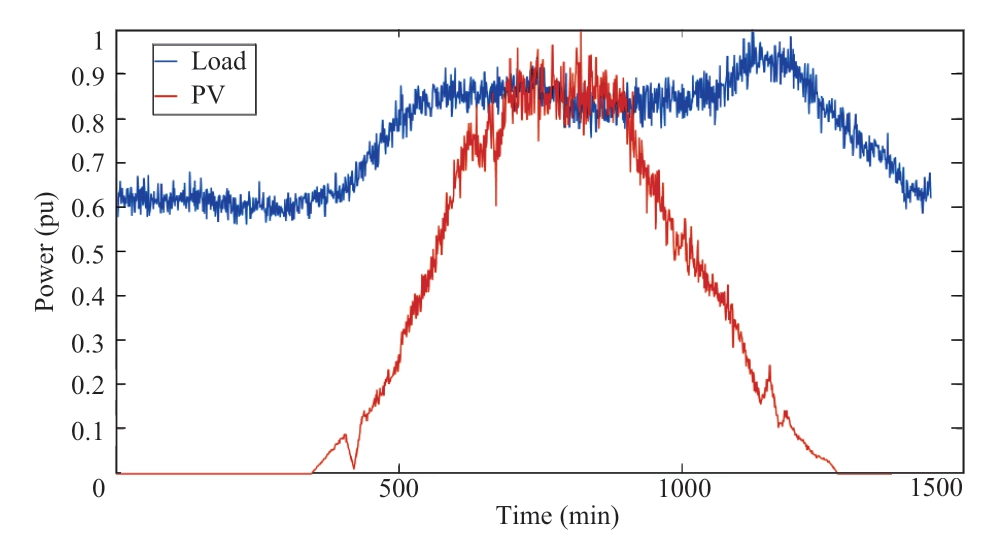
Fig.4 PV and load power curve
Table 2 Case parameter
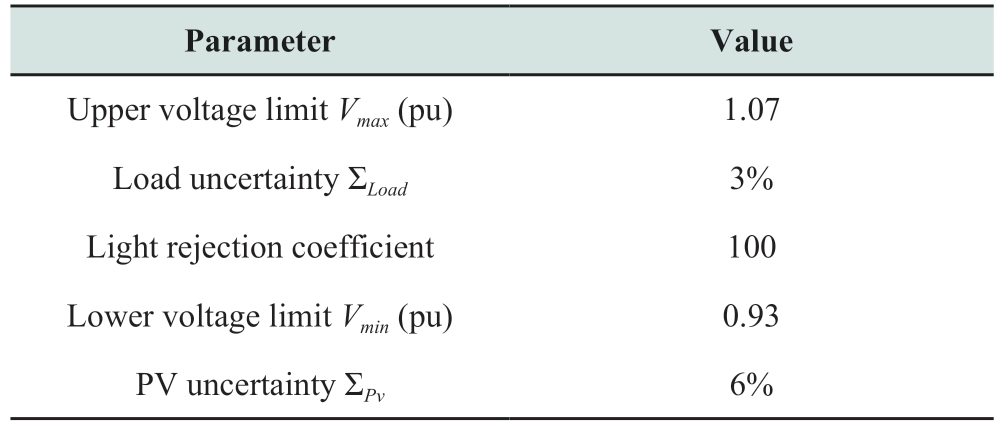
Table 3 DE algorithm parameter

2.2 Result and analysis
Three sets of comparison scenarios are developed to verify the efficacy of the proposed model.
Scenario 1(S1):The distribution system in Scenario 1 lacks active control.Figure 5 depicts the intraday voltage operation curve for Scenario 1 of the system.
Scenario 2(S2):Scenario 2 implements centralized local control to minimize network loss[21]without considering the opportunity constraint of short-term fluctuation.
Scenario 3(S3):The proposed two-stage centralized local control strategy,which considers the opportunity constraint of short-term fluctuation for the inverter,is implemented in Scenario 3.
As depicted in Fig.5,if active control is not implemented,the intraday voltage of each node exhibits a trend that initially rises before falling.During the day,the maximum voltage of the PV grid point was 1.10335 pu,which exceeded the upper limit by 3.12%.However,the light intensity was weaker in the evening and the load increased.The minimum voltage was 0.9253 V per unit,and the lower limit exceeded by 0.51%.The cumulative overlimit duration of the system was 198 min,with a maximum continuous over-limit duration of 19 min.A visible problem in the system is a severe voltage out-of-limit,with the outof-limit problem of PV-accessed nodes being the most prominent.Meanwhile,the average daily power loss of the system was 143.33 kW,and the network loss rate was 4.8%.
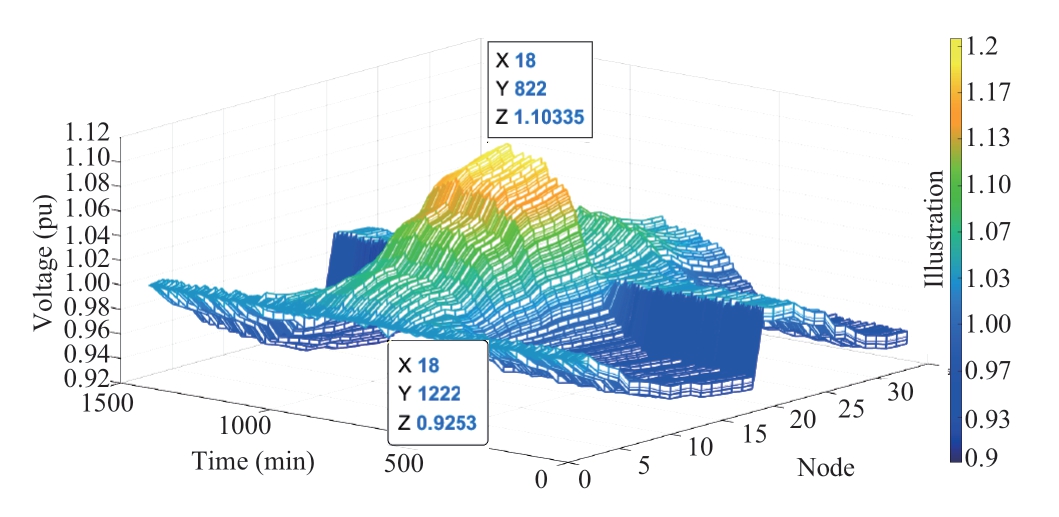
Fig.5 Voltage distribution without control
2.2.1 Control comparison
The confidence interval was initially set to 100%.The model was converted into a model for robust optimization.The algorithm was applied fifty times to solve the established model using the same data.The results indicate that the optimization converges within fifty iterations.Figure 6 and Table 4 depict one total-daily system voltage distribution diagrams and the calculated voltage quality index statistical data,respectively.
Table 4 Voltage index
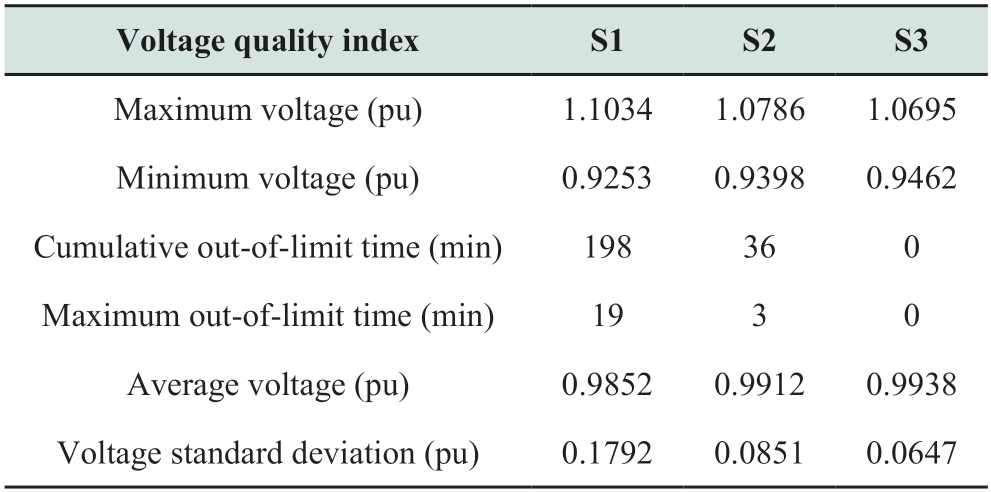
Table 4 and Fig.6 reveal that compared to S1,S3 and S2 reduce the maximum voltage by 0.034 pu and 0.025 pu,respectively,increase the minimum voltage by 0.021 pu and 0.015 pu,increase the average node voltage by 0.87%and 0.61%,and decrease the voltage standard deviation by 71.7% and 63.7%,respectively.Therefore,the proposed model eliminates the problem of exceeding the upper threshold.Table 5 lists the economic indicators for the three scenarios.Using 15 min as the statistical period,Fig.7 depicts the time sequence change trend of the average network power loss during each period in a day.
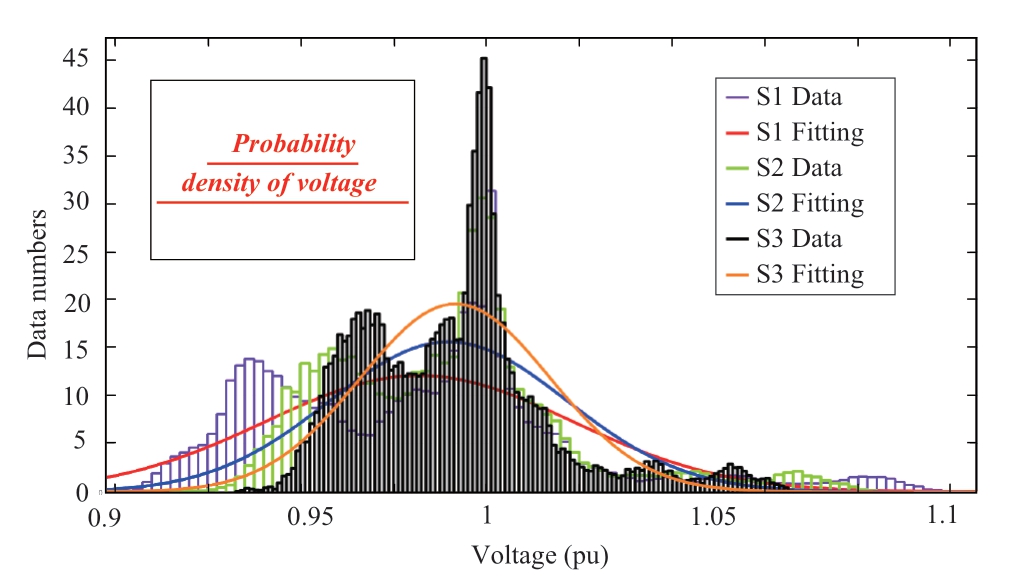
Fig.6 Voltage distribution
Table 5 Economic index
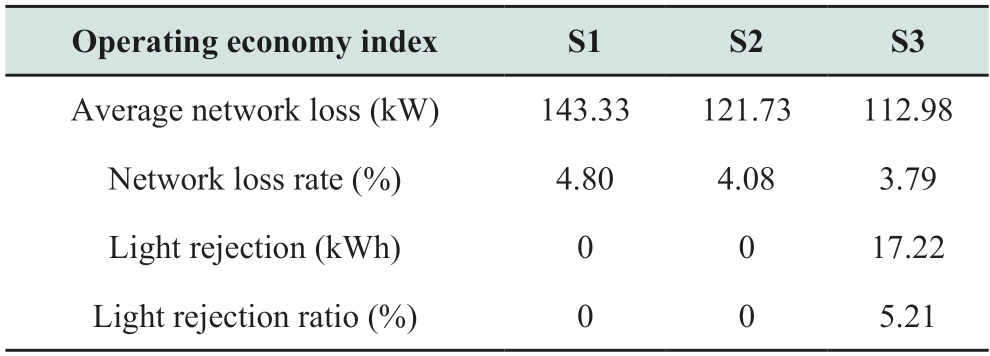
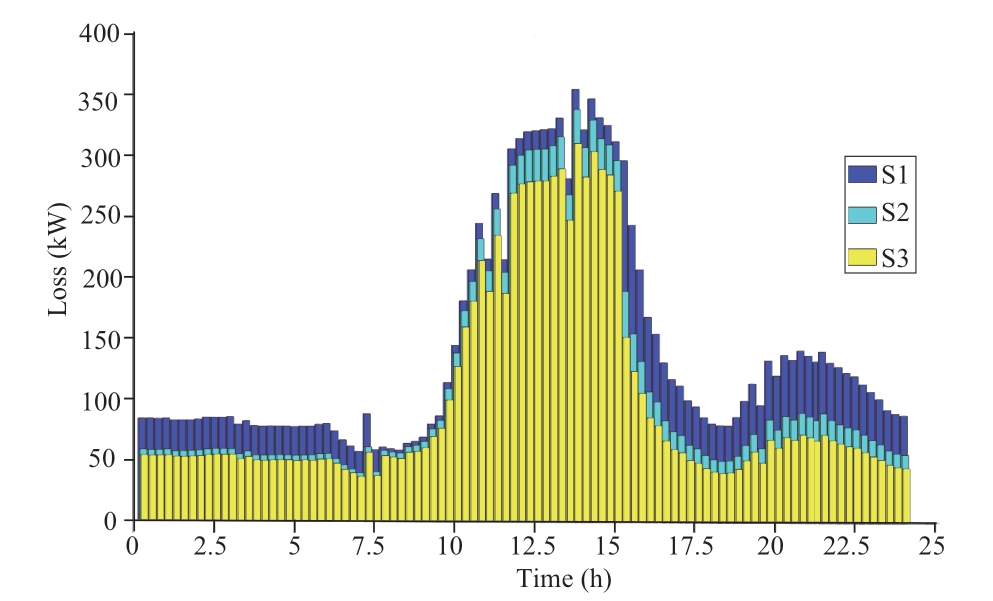
Fig.7 Network loss time series
According to Table 5 and Fig.7,S3 and S2 reduce network power loss by 30.35 kW and 21.6 kW,respectively,and network loss rates by 1.01% and 0.72%,respectively,compared to S1.The morning and afternoon losses are more significant than the midday losses because the light intensity during these times is low,which results in a larger reactive power regulation space for the inverter.Owing to the large active power output at midday,the regulation capacity of the inverter tends to saturate.This strategy generates 1722 kWh of light rejection,and the light rejection rate was 5.21 per cent,illustrating the need for coordinated active and reactive power regulation in high-permeability situations.
2.2.2 Result analysis
The 18-terminal node with the most severe out-of-limit conditions was chosen to analyze the mechanism of the above results and compare the differences between the two control models.Figure 8 illustrates the average active and reactive powers of the inverter at each node during each control cycle.
Table 4 and Fig.8 demonstrate that the voltage control effect of this study was superior to that of S2.This is because the model in S2 optimizes the droop-control slope of each inverter to minimize the network loss.In actual control,the reactive output of the inverter is jointly determined by the slope and voltage of the inverter,and the voltage is subject to transient fluctuations.Consequently,the reactive output obtained in S2 falls short of what is expected from centralized control.However,the model presented in this work directly optimizes the active and reactive powers of the inverter to minimize network loss as the output reference value and transmits the results along with the control slope to the inverter.The overall optimization entails the base value and short-term output,and it is greater than which in S2.Moreover,the voltage quality is coordinated by reducing the reactive output and active power at noon,as shown in Fig.8.Figure 6 shows that the voltage curve of the proposed model is smoother and less volatile than that of S2.The control cycle exceeded the upper limit between 10:00 and 10:15 a.m.Table 6 lists the local control parameters for the two control methods.
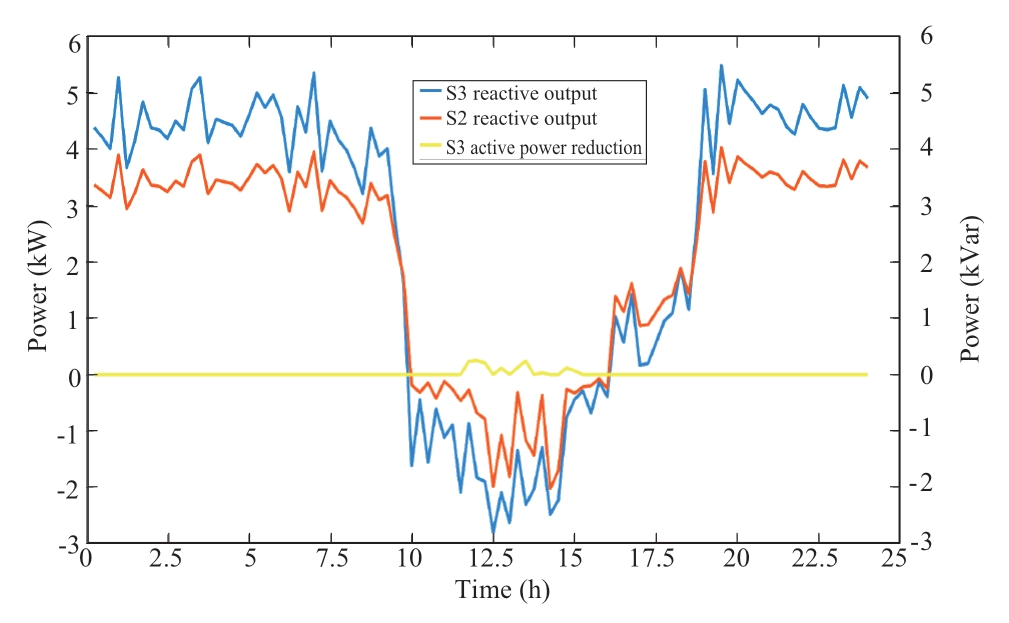
Fig.8 Output of inverter at node 18
Table 6 Short-time control result

Table 6 shows that the cycle fluctuation was large.The proposed model optimization yielded a local control slope 8.15 times than of S2.The feedback regulation capability for voltage fluctuations is enhanced,and the effect on voltage fluctuations is more prominent because the model in S2 optimizes the slope based on the minimum network loss over the 15-minute segment.The demand for regulation is underestimated without considering short-term fluctuations,thereby limiting the regulation ability of the inverter.In the second phase,the model considers the robust optimization of short-term uncertainty.When the voltage is close to the upper threshold,the control strategy becomes more conservative,and a steeper control slope is used to ensure voltage safety.
2.2.3 Fluctuation analysis
Considering that maximum 1-minute short-time fluctuation of PV can reach 40%,the uncertainty parameters were adjusted accordingly,and multiple sets of uncertain datasets were generated in 10% increments for control to analyze the adaptability of this model to short-time fluctuations.The test results indicate that the voltage of each system node was within the acceptable range.The net loss level for each control group is shown in Fig.9.
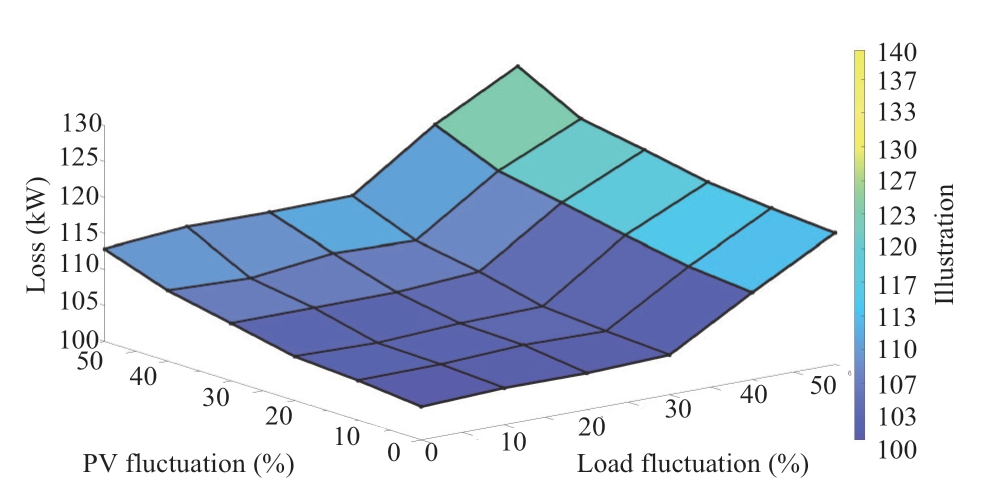
Fig.9 Influence of volatility on loss
As the volatility increases,the net loss of system operation exhibits an upward trend and the impact of uncertainty within 20% is insignificant.Under the same uncertainty level,the load has a more significant impact than the PV because the active control of the inverter stabilizes the fluctuation of the PV to some extent.PV had a more significant impact in the absence of active control.Therefore,the prediction capability of PV data should be enhanced,and active control should be implemented to ensure the distribution network operates economically.
2.2.4 PV permeability analysis
This study examines the PV penetration rate of the system(0%-60%)under the assumption that the PV access position remains unchanged.Figure 10 shows the calculation results for each penetration rate scenario.
Following an increase in PV permeability,the power loss decreased and then increased,accompanied by an increase in light rejection,with a minimum network loss inflection point between 20% and 30% of the penetration rate.Once the penetration rate surpassed 30%,the continuous increase in the PV output increased the reverse power flow,increasing the system loss.
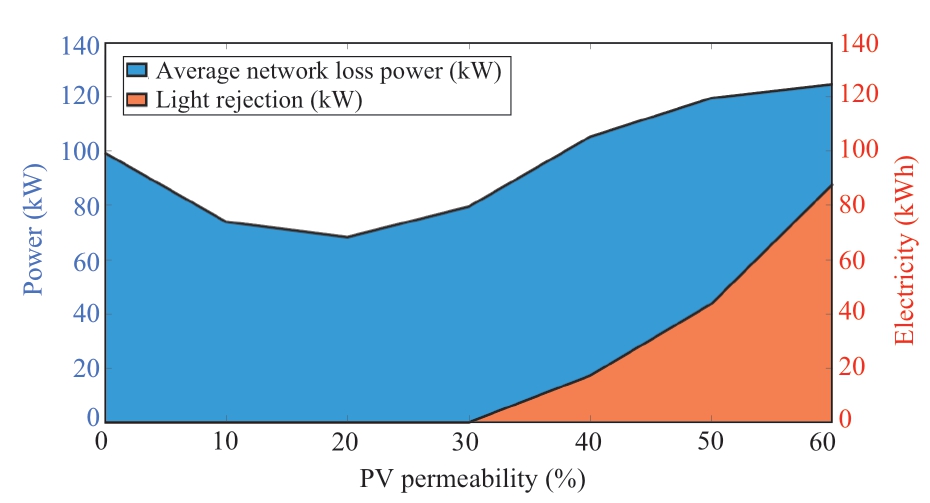
Fig.10 Influence of permeability
2.2.5 Inverter capacity analysis
First,the present work analyzes the variance in the effect of reactive capacity on the control results of various inverters.For instance,we selected the data between 10:00 a.m.and 10:15 a.m.Figure 11 illustrates the reactive output status of each inverter.
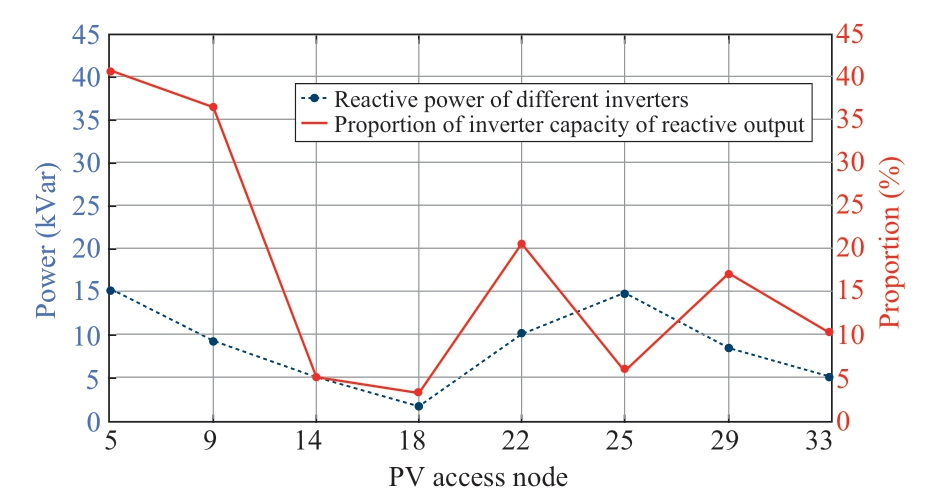
Fig.11 Reactive power state between inverters
Figure 11 illustrates that the capacity proportion of the reactivity between various inverters exhibits a differential distribution,with the majority falling below 20% of the rated capacity.At this point,the remaining capacity of each inverter accounts for 41.61%,and there is still some space available.The Node 5 inverter is the most considerable proportion of reactive power regulation because the reactance value of Node 5 is low,and its voltage is insensitive to reactive power regulation.Consequently,the inverter capacity of each PV system should be configured differently based on the line parameters and adjustment requirements to maximize the efficiency of equipment utilization.The influence of the total inverter capacity of the system on the control results was further analyzed.If the illumination intensity and the PV array size remain unchanged,the capacity of each inverter increases proportionally.The simulation results are depicted in Fig.12.
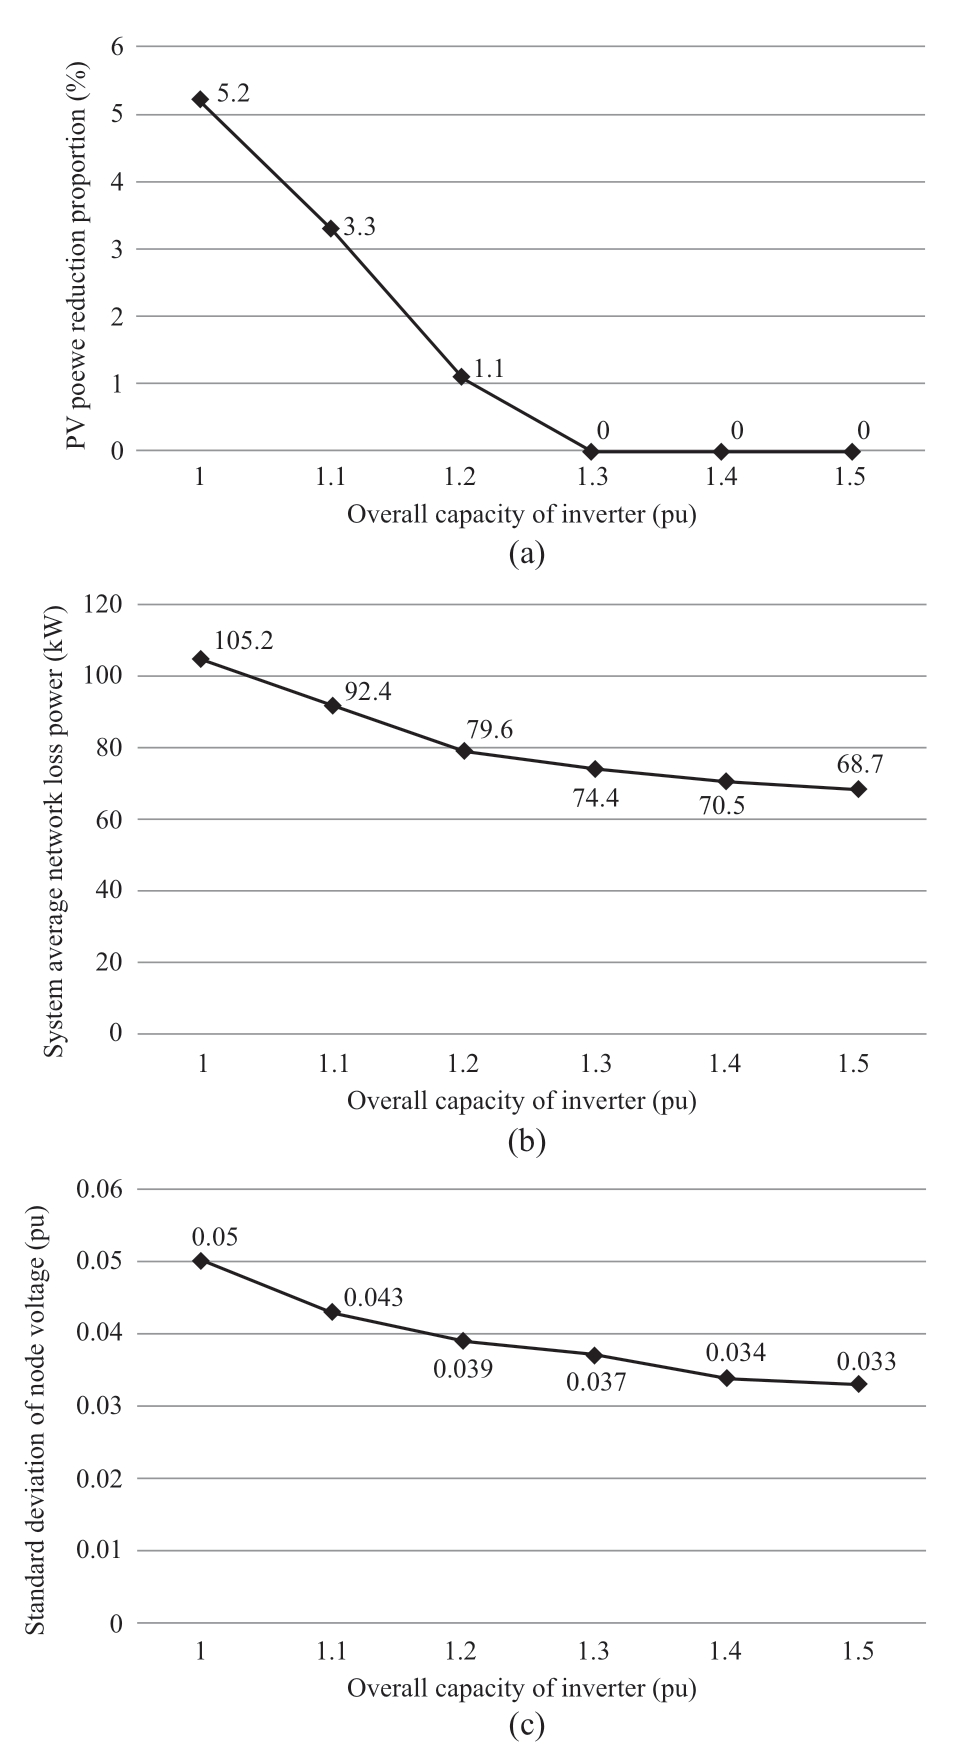
Fig.12 Influence of the overall capacity
As the overall capacity of the system inverter increases,the network loss and voltage deviation indicators gradually improve,accompanied by a gradual decrease in the rate of light rejection.The light rejection rate becomes zero when the inverter capacity reaches 1.3 times of the initial configuration.Therefore,when configuring the PV inverter capacity of the distribution network,the system should consider the differences between the inverters and overall capacity.
2.2.6 Chance constrained analysis
To analyze the impact of the voltage fluctuation confidence interval on the network loss,a 95% to 100%confidence probability simulation was performed.Figure 13 shows the expected network loss values for various confidence probabilities.By appropriately relaxing the risk probability of voltage fluctuation during the optimization process,it was discovered that a smaller network loss value can be obtained within a specific range;however,the minimum value of the system network loss does not appear at the time of the lowest voltage confidence level.The optimal confidence level in this study was 97%.At this point,the net loss is 91.93 kW,which is 12.5% less than the robust optimization loss.
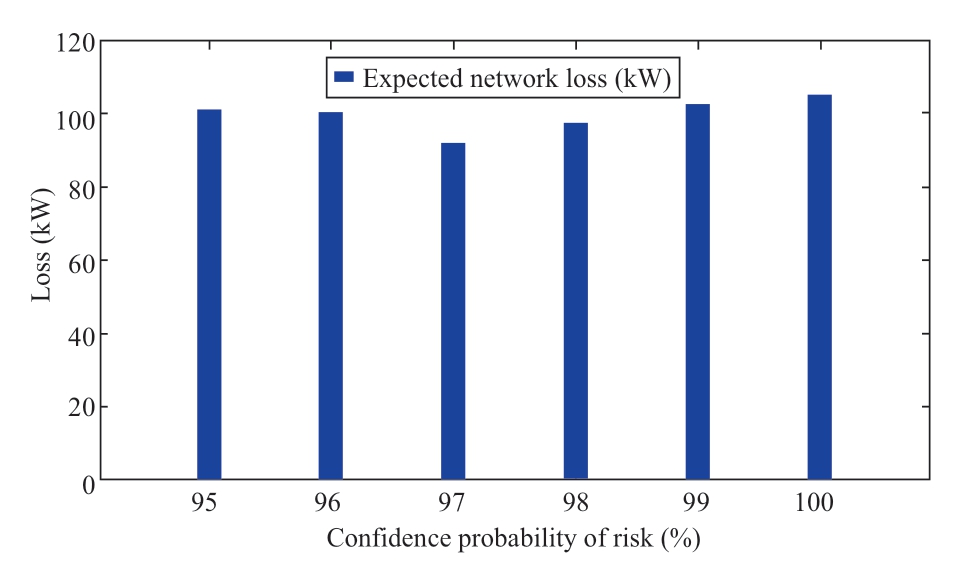
Fig.13 Expected loss under different confidence levels
3 Conclusion
A PV-centralized local coordinated voltage control method based on chance-constrained programming is proposed to realize the flexibility and economical consumption of distributed generation.The conclusions drawn from the case study are as follows:
1)In this study,the model utilized active power reduction,reactive power reduction,and droop control to maintain the overall voltage level and effectively reduce network loss.Additionally,droop control can accommodate the regulation of short-term fluctuations.
2)A short-term fluctuation of less than 20% has no discernible effect on the network loss of the system;however,a fluctuation of greater than 20% results in a significant increase in network loss,and the marginal network loss increases as the fluctuation increases.
3)Probability constraints are more adaptable and costeffective than robust optimization.If the risk probability of voltage fluctuations is appropriately mitigated,the expected value of network loss can be decreased within a specific range.
4)The control effect of short-term fluctuations depends on the inverter capacity and influences the system network loss.Therefore,the permeability of the distributed power supply should be planned sensibly,and the inverter capacity should be planned based on branch R/X ratio differentiation.
Acknowledgements
This work was supported by the China National Natural Science Foundation(52177082)China National Key R&D Program(2020YFC0827001)and Science and Technology Project of Jilin Electric Power Co.,Ltd(2020JBGS-03).
Declaration of Competing Interest
We declare that we have no conflict of interest.
References
[1]Li C,Wang J,Ye X,et al.(2012)Development and prospects of new energy in China.Electric Power Science and Engineering,28(4):1-8
[2]Song P,Zhou Y,Yuan J(2021)Peer-to-peer trade and the economy of distributed PV in China.Journal of Cleaner Production,280:124500
[3]Palz W(2012)Photovoltaic solar energy,spearheading Germany’s renewable energy policy:an example to others.EPJ Photovoltaics,3:30901
[4]Liu J,Lu Y(2022)Research on the evaluation of China's photovoltaic policy driving ability under the background of carbon neutrality.Energy,250:123809
[5]Soares J,Canizes B,Vale Z(2021)Rethinking the distribution power network planning and operation for a sustainable smart grid and smooth interaction with electrified transportation.Energies,14(23):7931
[6]Karmakar S,Singh B(2021)Battery energy storage(BES)for mitigation of short-term power fluctuations in large-scale solar PV plant due to cloud movement.IEEE 2020 3rd International Conference on Energy,Power and Environment:Towards Clean Energy Technologies,1-6
[7]Long C,Ochoa L F(2015)Voltage control of PV-rich LV networks:OLTC-fitted transformer and capacitor banks.IEEE Transactions on Power Systems,31(5):4016-4025
[8]Urtasun A,Sanchis P,Marroyo L(2013)Adaptive voltage control of the DC/DC boost stage in PV converters with small input capacitor.IEEE Transactions on Power Electronics,28(11):5038-5048
[9]Behera M P,Ray P K(2021)Reactive power and harmonic compensation in a grid-connected photovoltaic system using fuzzy logic controller.International Journal of Emerging Electric Power Systems,22(2):161-175
[10]Alrushoud A,McEntee C,Lu N(2021)A zonal Volt/Var control mechanism for high PV penetration distribution systems.2021 IEEE Power &Energy Society General Meeting(PESGM),doi:10.1109/PESGM46819.2021.9637841
[11]Yoshida K,Kouchi K,Nakanishi Y,et al.(2008)Centralized control of clustered PV generations for loss minimization and power quality.2008 IEEE Power and Energy Society General Meeting-Conversion and Delivery of Electrical Energy in the 21st Century,doi:10.1109/PES.2008.4596359
[12]Appen J V,Stetz T,Braun M,et al.(2014)Local voltage control strategies for PV storage systems in distribution grids.IEEE Transactions on Smart Grid,5(2):1002-1009
[13]Song X,Yu N,Chen Z,et al.(2014)The research of control strategy based on hierarchical consistency algorithm in active distribution network.Advanced Materials Research,1008-1009:756-761
[14]Gui Y,Bendtsen J D,Stoustrup J(2020)Coordinated control of PV inverters in distribution grid using local and centralized control.IECON 2020 The 46th Annual Conference of the IEEE Industrial Electronics Society,1773-1778,doi:10.1109/IECON43393.2020.9254512
[15]Shadmand M B,Balog R S,Abu-Rub H(2014)Model predictive control of PV sources in a smart DC distribution system:Maximum power point tracking and droop control.IEEE Transactions on Energy Conversion,29(4):913-921
[16]Saeidi M,Niknam T,Aghaei J,et al.(2019)Multi-objective coordination of local and centralized Volt/Var control with optimal switch and distributed generations placement.Journal of Intelligent &Fuzzy Systems,36(6):6605-6617
[17]Yang Z,Li Y,Xiang J(2018)Coordination control strategy for power management of active distribution networks.IEEE Transactions on Smart Grid,10(5):5524-5535
[18]Bidgoli H S,Cutsem T V(2017)Combined local and centralized voltage control in active distribution networks.IEEE Transactions on Power Systems,33(2):1374-1384
[19]Jabr R A(2019)Robust Volt/Var control with photovoltaics.IEEE Transactions on Power Systems,34(3):2401-2408
[20]Kryonidis G C,Kontis E O,Chrysochos A I,et al.(2017).A coordinated droop control strategy for overvoltage mitigation in active distribution networks.IEEE Transactions on Smart Grid,9(5):5260-5270
[21]Cai Y,Tang W,Zhang B,et al.(2019)A two-stage Volt-var control in LV distribution networks with high proportion of residential PVs.Power System Technology,43(4):1271-1280
[22]Rigo-Mariani R,Vai V(2022)An iterative linear Distflow for dynamic optimization in distributed generation planning studies.International Journal of Electrical Power &Energy Systems,138:107936
[23]Li N,Chen L,Low S H(2012)Exact convex relaxation of OPF for radial networks using branch flow model.2012 IEEE Third International Conference on Smart Grid Communications(SmartGridComm),7-12,doi:10.1109/SmartGridComm.2012.6485951
[24]Gan L,Li N,Topcu U,et al.(2014)Exact convex relaxation of optimal power flow in radial networks.IEEE Transactions on Automatic Control,60(1):72-87
[25]Su S,Li Z,Jin X,et al.(2022)Energy management for active distribution network incorporating office buildings based on chance-constrained programming.International Journal of Electrical Power &Energy Systems,2022(134):107360
[26]Liu W,Fu M,Yang M,et al.(2021)A bi-level interval robust optimization model for service restoration in flexible distribution networks.IEEE Transactions on Power Systems,36(3):1843-1855
Received:26 August 2022/Accepted:16 October 2022/Published:25 February 2023
 Wenxia Liu
50300467 @ncepu.edu.cn
Hanshen Li
120192101033 @ncepu.edu.cn
Lu Yu
lufly2007@126.com
2096-5117/© 2023 Global Energy Interconnection Development and Cooperation Organization.Production and hosting by Elsevier B.V.on behalf of KeAi Communications Co.,Ltd.This is an open access article under the CC BY-NC-ND license(http://creativecommons.org/licenses/by-nc-nd/4.0/).
Biographies

Hanshen Li earned his B.S.E.in Electric Power Engineering and Automation from Shanghai Jiao Tong University(SJTU),Shanghai,China,in 2016,his M.E.in Information,Production and Systems Engineering from Waseda University,Tokyo,Japan,in 2017,and his M.E.in Electrical Engineering from SJTU in 2019.Currently,he is pursuing a doctorate in electrical engineering at North China Electric Power University in Beijing,China.His research interests include active distribution planning and operation.

Wenxia Liu obtained her B.S.in Radio Engineering from Nanjing University of Science and Technology,Nanjing,China,in 1990,her M.S.in Power System and Automation from Northeast Electric Power University,Jilin,China,in 1995,and her PhD in Power System and Automation from North China Electric Power University(NCEPU),Beijing,China in 2009.Professor in the School of Electrical and Electronic Engineering at NCEPU.Her research interests include intelligent planning of power systems,risk assessment,power communication systems,and reliability and planning for cyberphysical systems.

Lu Yu is currently the director of the Economic and Technological Research Institute of State Grid Jilin Electric Power Co.,Ltd.with the title of Engineer.He is pursuing a PhD in Electrical Engineering at North China Electric Power University(NCEPU).His research interests include smart grid planning,economic and technical research,etc.
(Editor Yajun Zou)
