0 Introduction
High-impedance faults(HIFs)typically occur when an electric transmission line contacts the surface of a highresistance medium such as cement,grass,and asphalt concrete[1].The HIF is defined as a conductor grounded through a non-metallic conductive medium with a large initial transition resistance,resulting in a weak fault feature[2].With the development of the fault,the resistance gradually decreases and the conductor breaks down.In this process,an arc is often generated,which can easily cause accidental fire.The amplitudes of the fault current under different grounding materials are usually below 70 A,which is only approximately 10% of the normal current[3];thus,traditional over-current protection devices are not capable of detecting this fault.Statistically,single-phase grounding faults account for 80% of the total faults of distribution system faults[4],of which HIFs account for 5%-20% of the total faults[3].As traditional protection devices cannot properly detect HIFs,the occurrence probability is higher than the number of reported records.
Recently,several researchers have extensively studied HIFs.The existing detection methods can be divided into three types:time-domain,frequency-domain,and hybrid methods[5].
The time-domain methods generally extract features for fault diagnosis from the temporal irregularities of the HIF waveforms.Mamishev et al.[6]proposed a method for HIF detection based on fractal geometry.The changing sequence of the root mean square(RMS)values was calculated from the time-varying phase current,and it is detected as a HIF if the number of polarity changes in a two-cycle period exceeds the threshold.However,determining the fractal dimension is a difficult problem.The longer the data,the more accurate the estimation results,but it also requires more computation time.Therefore,Panigrahi et al.[7]introduced a detection method based on mathematical morphology(MM)transform to obtain fault characteristic indicators from the expansion and erosion operators of the residual voltage.The MM method has the advantage of low computational requirement;thus,it provides fast detection speed.However,the measured signals usually contain much noise,and the effect of noise on this method has not been further analyzed.To summarize,although the time-domain method is simple,the time-domain information of the HIFs is relatively weak,which limits the expression ability of its features.
The frequency-domain methods use the high- or lowfrequency components generated in the current or voltage signal after the occurrence of HIF.Lima et al.[8]indicated that the amplitude and phase angle of the second,third,and fifth harmonics of the fault current changed significantly after the occurrence of an HIF.Soheili et al.[9]used fast Fourier transform(FFT)to obtain the phase angle ratios between the third,fifth,and seventh harmonics of the fault current,and set an appropriate threshold.However,this method is less effective when applied for low-current amplitudes.Although the frequency-domain methods can extract certain significant characteristics,it is still difficult to distinguish the HIFs from disturbance events with similar frequency-domain characteristics,such as capacitor switching and transformer energization[5].
The hybrid methods extract information from the time and frequency scales of fault signals.Compared with the previous two types of methods,the information obtained using hybrid methods are more comprehensive and richer,and the features are more expressive.Santos et al.[10]proposed a method based on the detail and approximate wavelet coefficients of the current signal.However,the noise of the high-frequency component can have a strong effect on the detail coefficients,resulting in false detections.Yeh et al.[11]employed wavelet transform(WT)to denoise and decompose the signals.If the polarity of the differences between the phase current and threshold changes in two or more consecutive sliding windows,the HIF is considered to be detected.However,owing to the low amplitude of the HIF current,this method is susceptible to noise.In summary,although WT has several advantages,it cannot guarantee the resolution accuracy of time and frequency information at the same time.Thus,a number of improved techniques have been proposed such as wavelet packet transform(WPT)[12,13],empirical mode decomposition(EMD)[14],S-transform(ST)[15-18],and Hilbert-Huang transform(HHT)[18].Mishra et al.[18]applied ST to extract the fault current and voltage features,and then several statistical indices were calculated from the time-amplitude,timefrequency,and frequency-amplitude matrices,including the maximum,minimum,standard deviation,and RMS of the energy.This method fully exploits the time-frequency information of fault signals and has strong anti-noise ability.Mishra and Rout[19]performed EMD on the current signals to obtain a series of intrinsic mode functions(IMFs),and then used HHT to calculate the differential characteristics of the selected IMFs for fault diagnosis.Although the HHT is an adaptive decomposition method,it still has problems such as frequency band aliasing and the distortion of boundary endpoint decomposition.
With the rapid development of artificial intelligence(AI)technology,intelligent feature extraction methods and classifiers have been widely used in HIF detection.Xiao et al.[5]used the features extracted by a variational prototype encoder to train a decision tree(DT)classifier.The decision-making process of the DT is intuitive,but also sensitive to the balance of various samples.Narasimhulu et al.[20]adopted an ant lion optimizer algorithm to select the optimal feature set to improve the performance of the artificial neural network(ANN)training process.Generally,these types of AI-based methods require a large number of high-quality training samples,while the field data of HIF is usually difficult to obtain;consequently,the expected training effect is difficult to achieve.Therefore,in this study,a novel HIF detection method is proposed,considering the following aspects.
1)Signal decomposition aspect:The performance of frequency localization can be improved and the interference of useless frequency bands can be reduced by taking advantage of the precise band division of the WPT.
2)Feature extraction aspect:The combination of ST and singular value decomposition(SVD)can enhance the fault features and reduce the interference from noise,which effectively improves the accuracy of the fault feature extraction of time-frequency approaches.
3)Detection criteria aspect:A detection method is constructed based on the average singular entropy(ASE),which provides a simple decision process.At the same time,by using this index,the detection time can be significantly reduced and the anti-noise ability can be considerably improved.
The rest of this paper is organized as follows.The principles of the proposed method are described in Section 1.Section 2 presents the distribution network topology and the arc fault model.In Section 3,the effectiveness of the proposed method is verified under various scenarios based on simulated and measured data.Section 4 presents a comparison with other methods to highlight its advantages.Finally,Section 5 concludes this article.
1 Methodology
There are a number of typical characteristics in the current waveforms of HIFs such as asymmetry,nonlinearity,build-up and shoulder,and zero-off phenomenon[16].As mentioned in[8],the non-linearity can result in strong low-order harmonics,especially odd ones,while the build-up and shoulder can result in inter-harmonics.
To analyze the difference between HIFs and non-HIFs,the field and simulated zero-sequence current waveforms are shown in Figs.1(a)and 1(c),respectively.These signals are all collected in a system with a fundamental frequency of 50 Hz.The non-HIF waveforms in Figs.1(a)and 1(c)are both three-phase unbalanced capacitor switching events.The spectral analysis results of the waveforms shown in Figs.1(a)and 1(c)are shown in Figs.1(b)and 1(d),respectively.The comparison of Figs.1(b)and 1(d)indicates that the third and fifth harmonics of the HIFs increase significantly,while those of the non-HIFs change relatively smoothly.As mentioned in[21],the lower the harmonic order is,the more accurate the phase information it contains,and the application of a single frequency is believed to be sufficiently represent the characteristic of most harmonics.Therefore,the fifth harmonic is not considered in this study.
The HIF and non-HIF shown in Fig.1(d)have certain similarities in the amplitude of the third harmonic.Therefore,more distinctive features must be found to amplify the differences.The comparison of Figs.1(b)and 1(d)shows that in addition to the third harmonic,the variation degree of the inter-harmonics of the HIFs near the third harmonic is also more complex than those of the non-HIFs.To summarize,the variation degree of this characteristic frequency band can be considered as a potential fault indicator that must be quantified mathematically.Thereafter,a diagnostic method can be developed to effectively distinguish the differences between HIFs and non-HIFs.
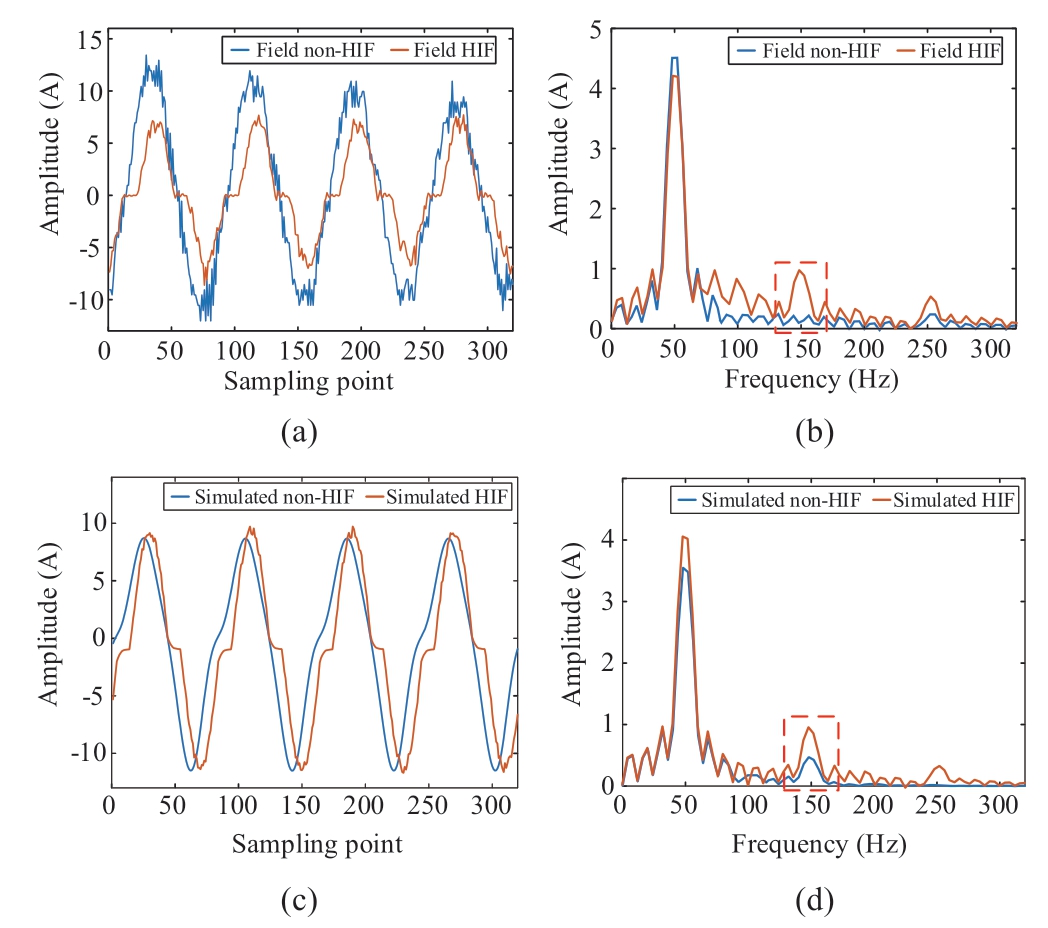
Fig.1 Zero-sequence current and spectra of HIFs and non-HIFs.(a)Field waveforms,(b)spectra of the field waveforms,(c)simulated waveforms,and(d)spectra of the simulated waveforms
1.1 Signal decomposition method
The waveform of HIF contains abundant harmonics,and this feature is often adopted for HIF detection[22].For the purpose of analyzing the differences between HIF and disturbance signals more comprehensively,it is necessary to investigate their differences in the frequency domain.Therefore,a suitable signal decomposition technique needs to be applied to extract the required frequency band.
As a generalized form of WT,WPT can decompose both the low and high frequency parts in each layer of the signal decomposition process.It means that the signal decomposed by WPT is more refined.Through a sequence of low- and high-pass filters,the time-series signal is decomposed into approximate and detail components[13,14].The decomposition algorithm is expressed as

where t denotes the time;k = 1,2,…,2J-j;J= log2N,and N is the sampling point;![]() is the wavelet packet coefficient(WPC),which denotes the ith wavelet packet at layer j;H and G represent the low-frequency and high-frequency filters,respectively.
is the wavelet packet coefficient(WPC),which denotes the ith wavelet packet at layer j;H and G represent the low-frequency and high-frequency filters,respectively.
To extract the information of a certain frequency band,the WPCs obtained can be used for signal reconstruction.The reconstruction algorithm is expressed as

In application,the WPCs related to this frequency band are retained,while those irrelevant to this band are set to zero.Then,the signal waveform of the specified frequency band can be obtained by substituting the WPCs into(2).
1.2 Feature extraction method
Considering the large uncertainty of current amplitude of different signals,the data is normalized in every half cycle to ensure the subsequent feature extraction results of signals can be compared on the same amplitude order.The amplitudes are mapped to the range of -1 to 1,and the normalization process can be presented as
where xirepresents the data of each half-cycle after the fault,and ![]() represents the normalized data.
represents the normalized data.
The HIF will generate a time-varying current signal.In order to characterize the fault more comprehensively and accurately,it is necessary to use the time-frequency methods to investigate complex nonlinear signal[23]after obtaining the signal in a specific frequency band,so as to obtain information in both domains simultaneously.Among the commonly used time-frequency transformation techniques,Fourier transformation(FT)has only frequency-domain analysis,leading to the inability to capture the temporal changes of the signal.
As a further improvement of FT,the short-time Fourier transform(STFT)obtains time-related information by using a fixed window,and uses FT to locate in the frequency domain[8].On the other hand,STFT has a low timefrequency resolution due to its fixed-length window.
WT does not have this limitation,but it is vulnerable to noise and cannot obtain accurate phase information[18,21].
Based on the needs of both STFT and WT,Stockwell et al.[15]proposed ST in 1996.ST is a multi-resolution transform method,which can extract the amplitude,frequency,and phase of signal at any moment.It has the advantages of high time-frequency resolution,strong selfadaptation,and good anti-noise performance[18].These features make it a suitable analysis technique for nonstationary signals in a specific frequency range.The ST process for signal x'(t )can be expressed as

where τ presents the time-shifting factor,f presents the frequency,t is the time,and ω(t-τ,f)is the Gaussian window function.Compared with STFT,ST adopts a movable and scalable Gaussian window,which avoids the selection of window function and is more adaptive.The matrix A∈R m×n obtained by ST is a two-dimensional timefrequency matrix with time-frequency correspondence.The rows of this matrix are frequency values and the columns are sampling points.Thus,it could gain more accurate phase information than WT[18].
The SVD is a method of matrix orthogonalization and decomposition.According to the SVD theory,for any real matrix A,the following equations can be satisfied.
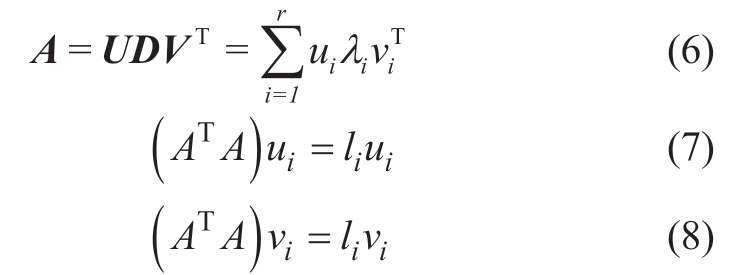
where U∈Rm×m and V∈Rn×n are both orthogonal matrices,and their diagonal elements are respectively calculated from(7)and(8).D is a non-negative matrix with the expression as ![]() where O is the zero matrix,and q=min( m,n).
where O is the zero matrix,and q=min( m,n).![]() is the singular value of A,and they are arranged in decreasing order on the diagonal and decay very fast.The singular values are considered as the representative values of a matrix that can reflect the raw signal's major characteristic information.The more information a single value represents,the greater it is[24].The singular values of noise are generally small.Thus,effective information and noise can be distinguished by setting a threshold on the singular value sequence[24].By this method,the influence of useless information can be further reduced on the basis of accurate frequency band division of WPT.In this study,the mean value of the singular value sequence is set as the threshold,that is,only the singular values which are higher than this threshold in the diagonal matrix are retained.
is the singular value of A,and they are arranged in decreasing order on the diagonal and decay very fast.The singular values are considered as the representative values of a matrix that can reflect the raw signal's major characteristic information.The more information a single value represents,the greater it is[24].The singular values of noise are generally small.Thus,effective information and noise can be distinguished by setting a threshold on the singular value sequence[24].By this method,the influence of useless information can be further reduced on the basis of accurate frequency band division of WPT.In this study,the mean value of the singular value sequence is set as the threshold,that is,only the singular values which are higher than this threshold in the diagonal matrix are retained.
1.3 Detection criterion
In this study,the variation degree of the characteristic frequency band is considered as the fault detection indicator,and the singular entropy(SE)is employed as the quantitative indicator to better describe this feature.The SE is an index for evaluating signal complexity[25],which can be used to identify signals with different characteristic patterns.It is expressed as

where m denotes the number of singular values that are retained.If the value of H is large,it indicates that the original signal is more unpredictable and random.Takethe K-cycle data after fault,and then calculate SE in each half cycle.Finally,the ASE is calculated as the fault detection criterion,which is denoted as SEm and is defined as
where Δpi denotes the SE increment of the ith order.If SEm is larger than the set threshold ε,it is reasonable to assume that HIF occurs;if not,it is considered as a disturbance event.
1.4 Diagnosis process
Under normal conditions,the zero-sequence current of each feeder is very small,approaching zero.If the zerosequence current of the feeder increases significantly,the changed waveform will be recorded by the fault recording device[26],and then the zero-sequence current waveform with the maximum amplitude of all feeders is selected as the detection object of this study.Figure 2 illustrates the flowchart of the constructed HIF detection scheme,and its specific steps are described as follows:

Fig.2 Flow chart of proposed HIF detection method
Step 1:After the fault occurs,the zero-sequence current of K cycles is decomposed by WPT,and then the frequency band containing the third harmonic is obtained.
Step 2:The WPCs in the characteristic frequency band are reconstructed,afterwards,the data is normalized and ST is implemented in each half cycle.
Step 3:The time-frequency matrix is denoised by SVD and the mean value of SEs is calculated according to(10).
Step 4:If SEm is larger than ε,it can be considered that the HIF has occurred;otherwise,it is judged as a disturbance event.
2 Simulation
An HIF occurs mostly in medium voltage distribution networks with weak information[26].They are not only susceptible to the factors such as weather,grounding surfaces,and network topology[14],but can also be confused with certain grid operation events or faults producing characteristics similar to HIFs[27].A medium voltage distribution system was established using the EMTDC/PSCAD software.The HIF and non-HIF events occurring at different locations and with different parameters were considered.According to the analysis in[27],the zerosequence current has the advantage of not being affected by distributed generators(DGs).Therefore,based on the above advantages,in this study,a zero-sequence current was adopted as analysis signal.
Note that based on the recent available technologies for acquiring and treating electrical signals,the identification of HIFs by itself is not the most difficult task;the reduction of the false positive rate is significantly more difficult.There are several fault or operational over-voltage events in the distribution system,that have very similar characteristics to those of HIFs such as waveforms and harmonic components.To distinguish them and reduce the false positive rate of the HIF detection,four types of disturbance events in distribution network were considered in this study,including low-impedance fault(LIF),single-phase metallic grounding fault(SGF),capacitor switching(CS),and lateral branch switching(LBS).
2.1 HIF modeling
Several researchers have extensively studied arc modeling and introduced a wide variety of models;however,a number of these models are based on improvements for specific situations and exhibit unnecessary complexity.Classic black-box arc models were proposed by Cassie and Mayr[28].However,to simplify the formulas,both models contain a number of unreasonable and unrealistic assumptions and omissions.In addition,their application has certain limitations.In this study,considering the simplicity of modeling and its acceptable accuracy,the Emanuel model[29]was used as the HIF model,as shown in Fig.3.The positive and negative half-cycle current circuits were formed by the direct current(DC)sources Vp,Vn,diodes Dp,Dn,and resistors Rp,Rn,respectively[3].
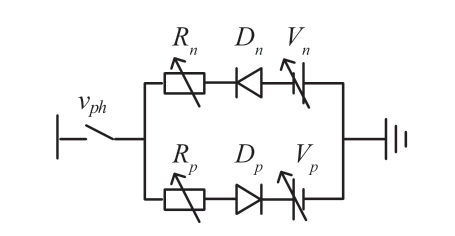
Fig.3 HIF model
Considering that the arc voltage and resistance fluctuate randomly in a realistic situation,the parameters Vp,Vn,Rp and Rn were all set to vary randomly with time,to allow the simulation of different grounding surfaces.
2.2 Radial distribution network
A 10 kV radial distribution network with a grid frequency of 50 Hz was established in PSCAD.The topology is shown in Fig.4,where r and L are the equivalent zero-sequence resistance and inductance of the neutral,respectively.The system was simulated to operate with three types of neutral,including the isolated neutral(IN),resonant neutral(RN),and low-resistor grounded neutral(LN).The line parameters are listed in Table 1,and the different fault points were set as F1-F20.The zerosequence current transformers(CTs)were installed at the head of each feeder,that is,at the substation.
Table 1 Line parameters
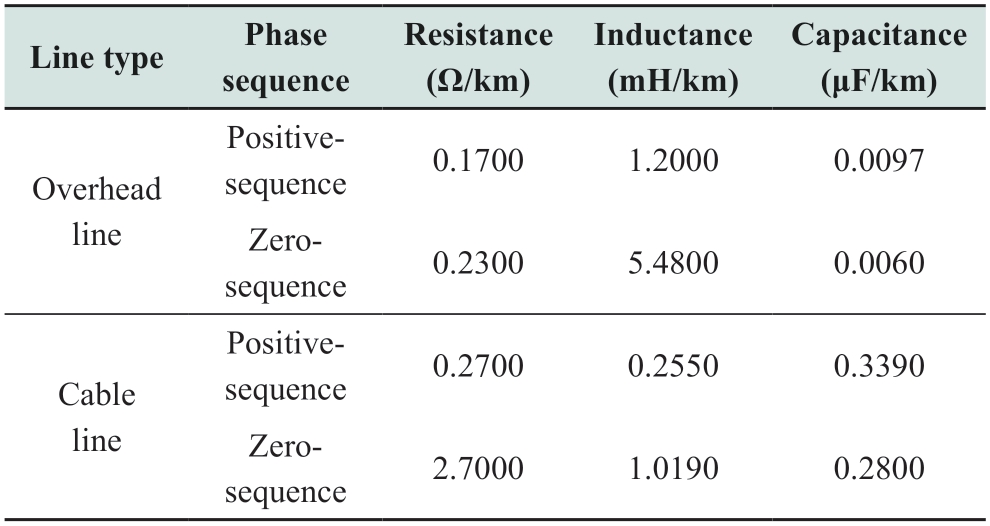
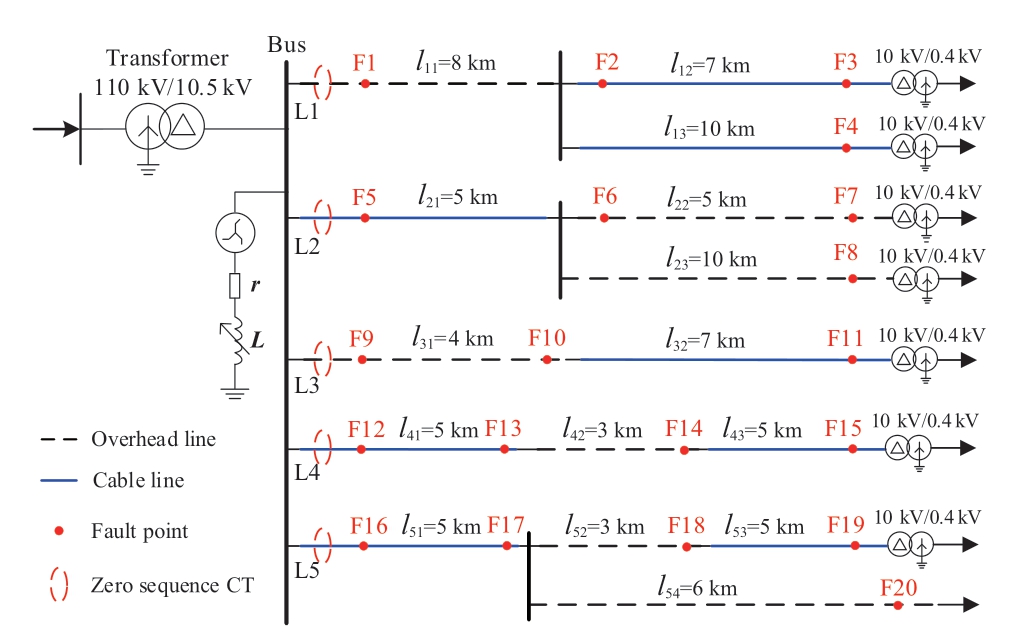
Fig.4 Topology of simulated 10 kV distribution network
When a disturbance event occurs,the harmonic components of the zero-sequence current only change transiently,and then decay rapidly to a stable state[23].The arc generated by the continuous contact between the HIF and different grounding surfaces sustains the harmonic component in the current for a long time,usually surpassing 150 ms[16].In practice,there are several factors that can affect the HIF current,particularly the ground material and humidity.Therefore,the study of HIFs under different grounding conditions is necessary to ensure the reliability of the detection method.
The sampling rate was 4 kHz(80 points per cycle),and the recorded signals are shown in Fig.5.Figures 5(a)-5(d)show the zero-sequence currents of HIFs for different neutrals and grounding surfaces.As can be seen in Fig.5,the most noticeable feature of HIFs is the distortion of the current waveform.The comparison of Figs.5(a)and 5(b)shows that under the same neutral,the zero-off phenomenon of current in wet cement is more noticeable than that in dry cement.This result indicates that the grounding materials and humidity have a significant effect on the waveform.Similarly,the comparison of Figs.5(b)and 5(c)indicates that under the same wet grounding surfaces,the current amplitude further decreases and the distortion is more noticeable with the increase in the transformer neutral grounding impedance.For the convenience of the subsequent analysis,these four types of HIFs are denoted as H1-H4,respectively.The related parameters are listed in Table 2.To obtain sufficient HIF samples,the model parameters were varied in the range of ±10% of the set center values.Figures 5(e)-5(h)show the representative current waveforms of the disturbance events.It can be observed that they have similarities with the HIFs.For example,their steady-state waveform shapes are similar to that of H1,primarily because the waveform distortion of H1 is slight.In addition,their amplitudes are difficult to distinguish.This indicates that it is difficult to obtain features that can accurately identify HIFs and disturbances based only on the time domain.
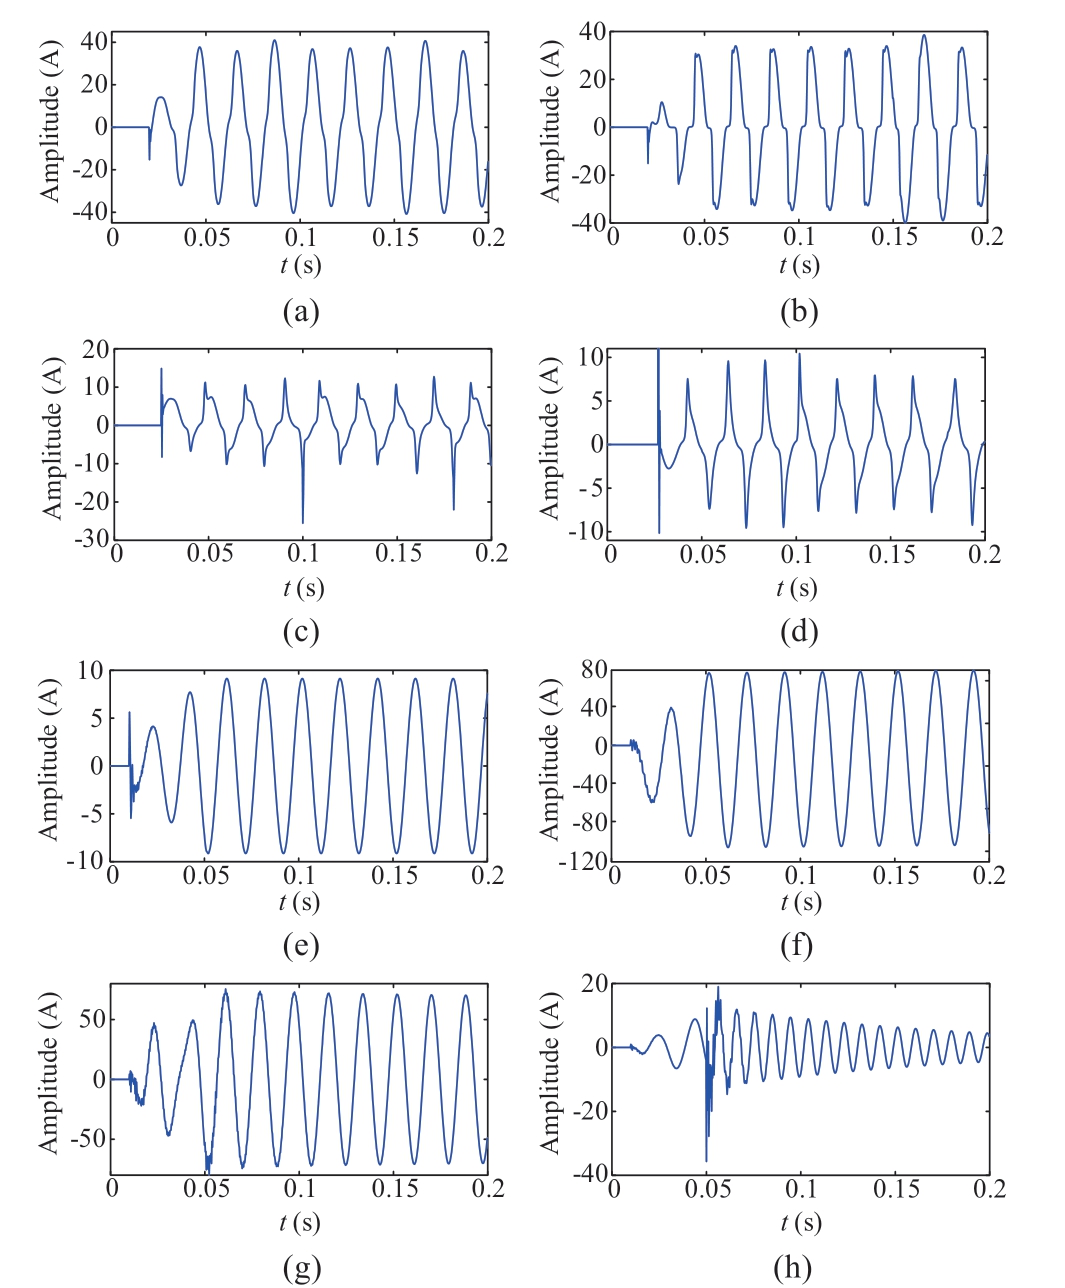
Fig.5 Simulation current waveforms:(a)H1,(b)H2,(c)H3,(d)H4,(e)LIF,(f)SGF,(g)CS,and(h)LBS
Table 2 Fault model parameters

Subsequently,a spectral analysis was performed on the waveforms shown in Fig.5;the results are shown in Fig.6.The third harmonic amplitudes of both CS and LBS shown in Fig.6(b)are remarkably high,even close to that of H4.The spectrum of SGF shows regular attenuation,and its third harmonic amplitude even exceeds that of H2 and H3.This indicates that if only the amplitude of the third harmonic is considered,the reliability of the detection algorithm cannot be guaranteed.Furthermore,the comparison of Figs.6(a)and 6(b)indicates that the variations of the characteristic frequency band of the HIFs are more complex and random than those of the disturbances,which verifies the validity of this fault feature.
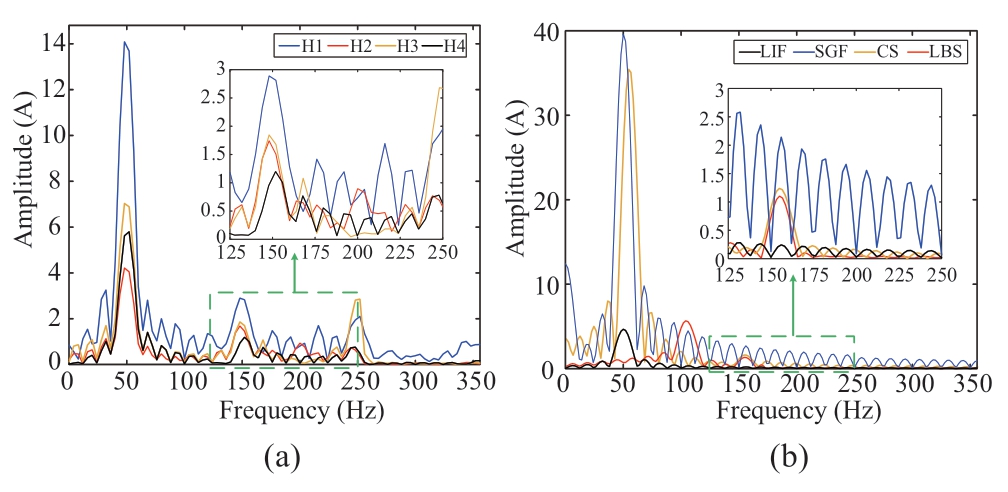
Fig.6 Spectra of different signals:(a)HIFs and(b)disturbances
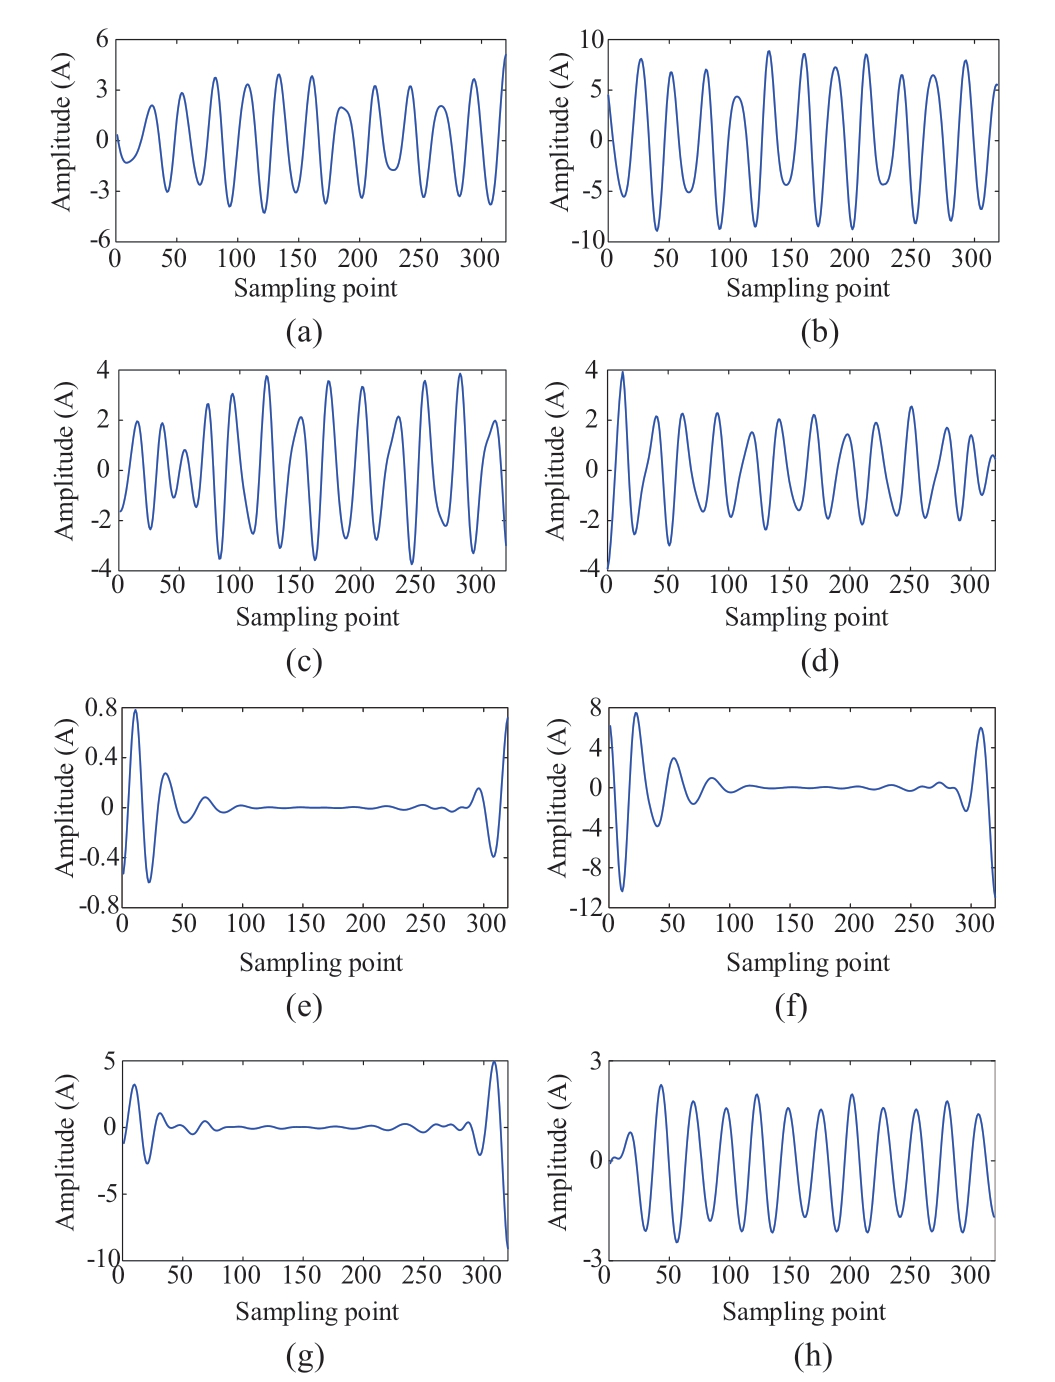
Fig.7 Reconstructed waveforms:(a)H1,(b)H2,(c)H3,(d)H4,(e)LIF,(f)SGF,(g)CS,and(h)LBS
Figure 7 shows the reconstructed waveforms of the different signals mentioned above.It can be seen that they have significantly different trends.Thus,it is possible to recognize these signals as long as the effective information is extracted and selected reasonably.Although all waveforms have noticeable fluctuations at the beginning,there are persistent large fluctuations in the HIFs and LBS,while the fluctuations in other signals decay shortly.However,the HIFs vary more stochastically than LBS,which is due to the different variation degree of the characteristic frequency band.After obtaining the reconstructed signals,an ST was implemented on them in every half cycle.That is,the window length of the ST was half-cycle,and the window shifted every half cycle with the new samples.
3 Test results and analysis
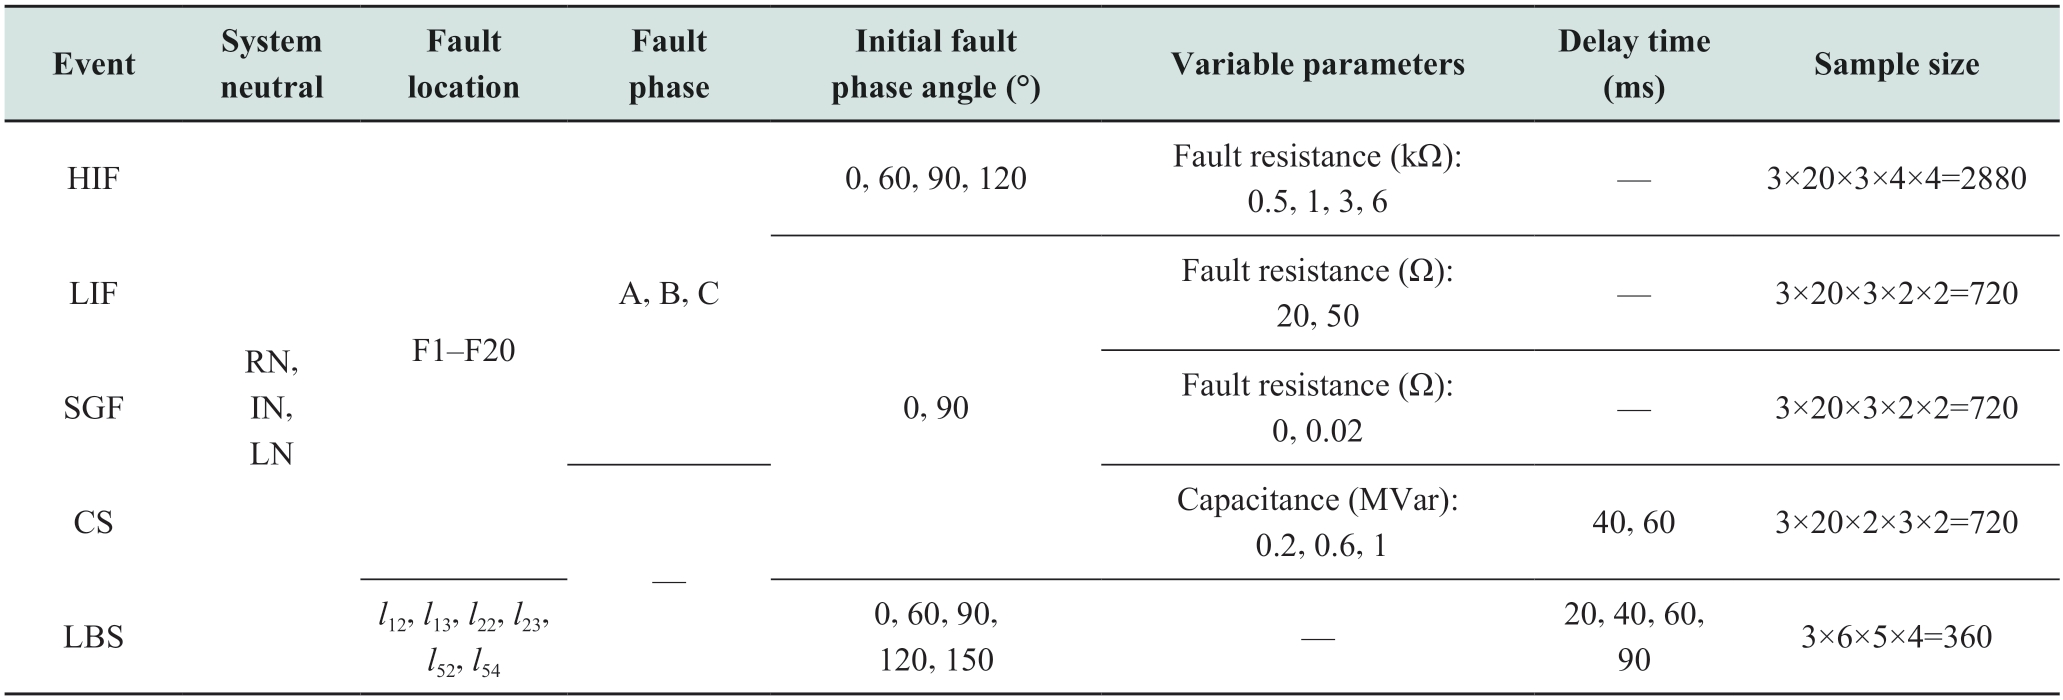
In a distribution network,the transient and steady-state process of fault waveforms are affected by several factors,including the fault location,initial fault phase angle,fault model parameters,and system neutral.In addition,to comply with the engineering practice,asynchronous closing was also added to the experiments.In this study,the three-phase asynchronous closing means that phase A was connected to the circuit first,while phases B and C were connected to the circuit simultaneously following the same time delay.Considering the above factors,the distributions of HIFs and disturbances shown in Fig.5 are listed in Table 3.Finally,all simulation samples were randomly divided into sample 1 and 2 in a ratio of 1:1.The HIF decision threshold was determined using sample 1,after that,the effectiveness of the detection was tested using sample 2.
In addition,140 groups of real overvoltage event samples were obtained from certain regions of Fujian Province,China,from 2013 to 2021.These field samples included 70 groups of HIFs and 70 groups of non-HIFs,which was denoted as sample 3.Among them,most of the HIFs occurred on overhead lines,and the main causes of discharge included floating objects hanging on the lines,insulation damage of wires or fittings caused by external objects,insufficient safety distance,etc.The non-HIFs mostly included overvoltage generated by switching of motors or transformers,saturation resonance of potential transformers,unloaded lines being cut off when a singlephase metallic grounding fault occurred,etc.These waveforms were recorded by a fault recording device,and then the causes of the fault were confirmed by professionals with high credibility.
The typical waveforms of field measured signals are shown in Fig.8.A HIF caused by contact with dry cement after an insulation damage of the line is shown in Fig.8(a),a HIF caused by contact with dry soil after line breaking isshown in Fig.8(b),an unbalanced CS caused by the singlephase insulation aging of a capacitor is shown in Fig.8(c),and an SGF event caused by a broken line falling on wet ground is shown in Fig.8(d).It can be observed that the field waveforms have severe distortions,which is due to the harsh outdoor environment and the noise interference of the equipment.Moreover,the current amplitudes of HIFs in Figs.8(a)and 8(b)are extremely high(over 100 A)at certain instants,which may result in significant damage to the equipment.The specific distributions of the above three sample sets are listed in Table 4.
Table 4 Numbers of different sample sets
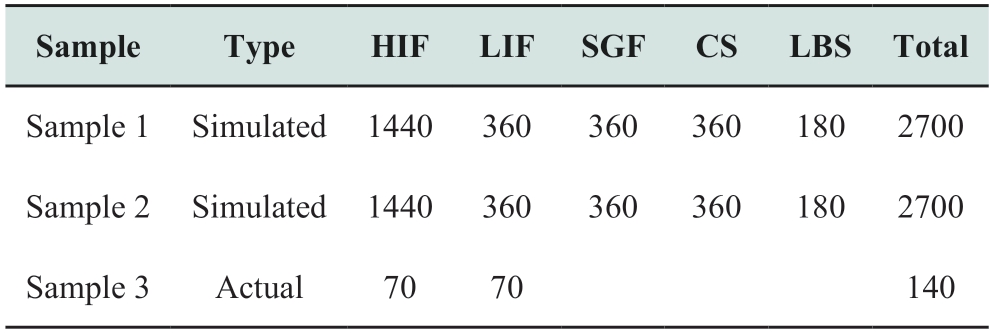
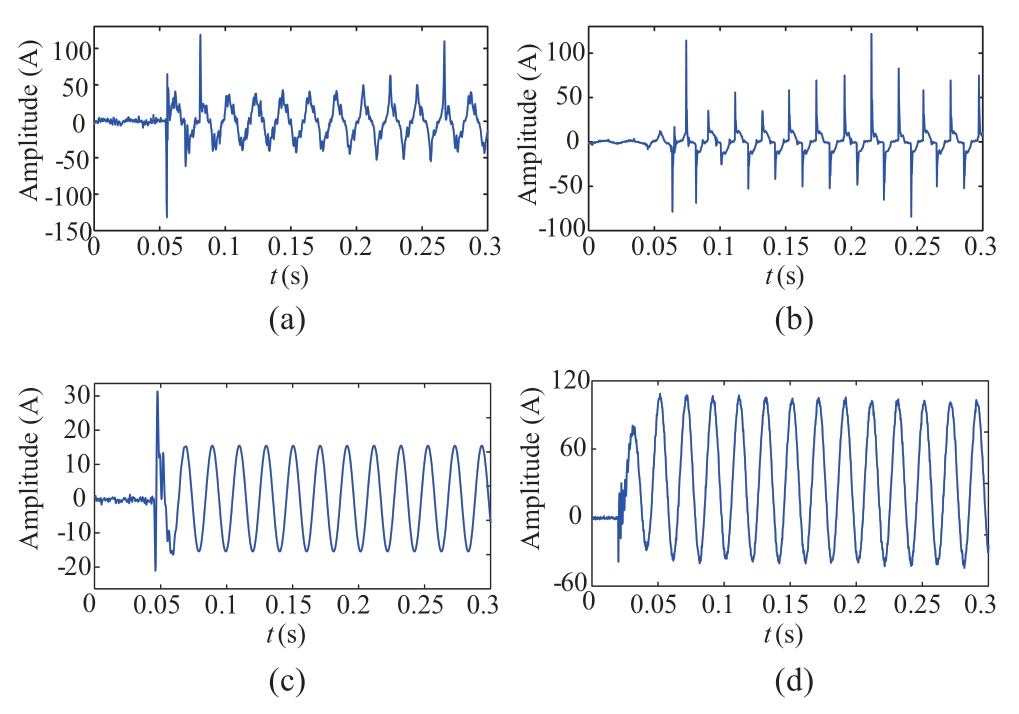
Fig.8 Field signals.(a)HIF:dry cement,(b)HIF:dry soil,(c)unbalanced CS,and(d)SGF
Table 3 Distribution of simulation samples
3.1 Determination of threshold
To obtain an optimal threshold,the ASE values of different signals were calculated using sample 1;the distribution of results is shown in Fig.9.As can be seen in Fig.9,the mean values of SEm of the HIFs are higher than 0.7,while those of the disturbances are all below 0.6.After a number of experiments,the results show that the proposedmethod could obtain the highest accuracy of 98.56%when the threshold value was set to 0.7.Therefore,a fixed threshold of 0.7 was set in this study.Then,the effectiveness of this threshold in different situations was analyzed.
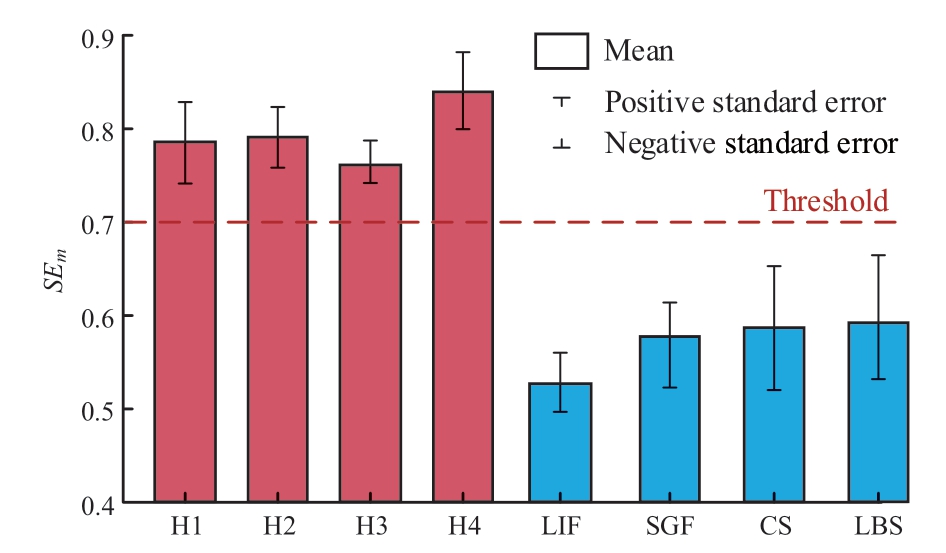
Fig.9 SEm of different signals
3.2 Performance of SVD denoising
According to the analysis in Section 1,the signals can be denoised by selecting appropriate singular values.To analyze the denoising effect,E is defined as the ratio of the sum of singular values after denoising and those before denoising as

where k and rare the numbers of singular values after and before denoising,respectively.The data distribution can be illustrated using a box plot[30].Figure 10 shows the box plot of different signals in sample 2.As can be seen in Fig.10,the E values of all signals are above 92%;thus,most information of the original signal could be retained by using the mean value as the threshold of SVD denoising.
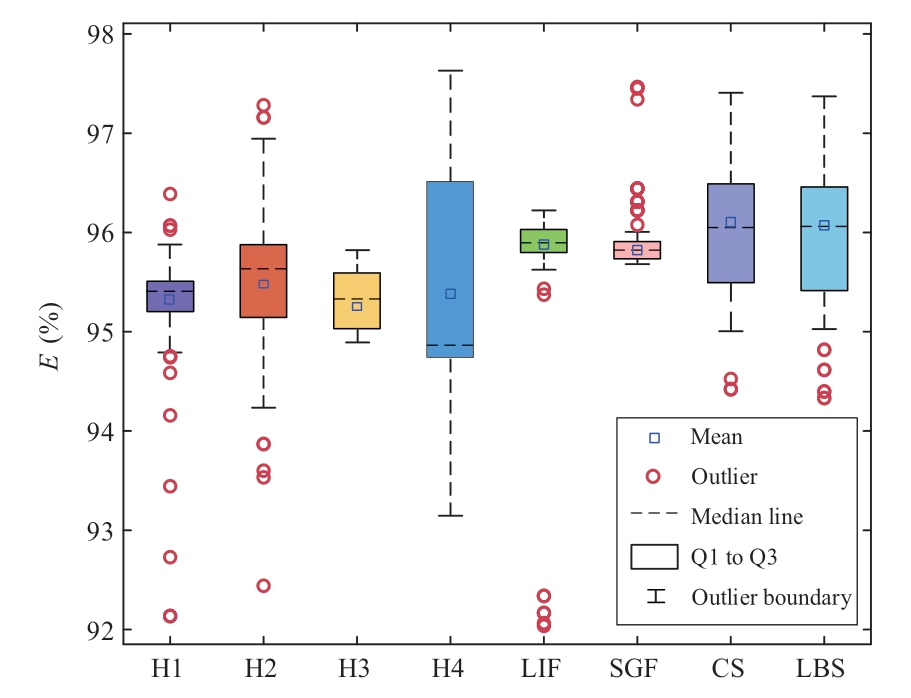
Fig.10 Ratio Eof different signals
3.3 Performance of different mother wavelets
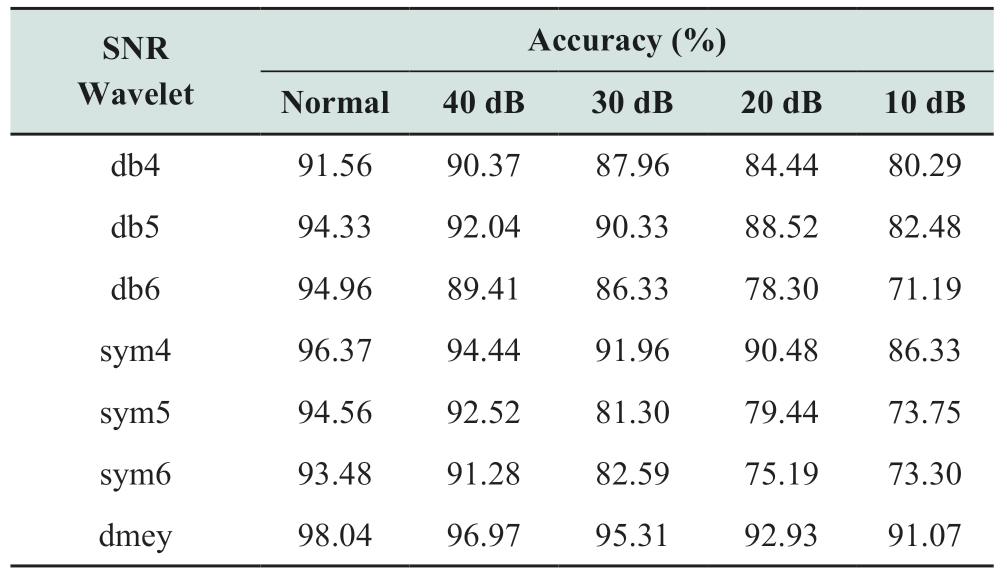
The effectiveness of WPT depends on the mother wavelet.The commonly used wavelet families include Haar[31],Daubechies(dbs)[32],Symlets(syms)[33],and DMeyer(dmey)[34].The Haar is the most basic wavelet and is non-continuous in the time domain;the dbs is smoother,with better regularity and lower degree of symmetry;the syms is similar to the dbs,but has better symmetry;and the dmey is a discrete form of the continuous Meyer without tight support,but with fast convergence[34].By comparison,it was found that the zero-sequence current of the HIF is similar to the wavelet functions of db4,db5,db6,sym4,sym5,sym6,and dmey.
As described in[10],the noise in the power system has a normal probability distribution and it exists in all recorded signals.The signal-to-noise ratio(SNR)measures the ratio of the effective value of the signal to that of the noise[16].A smaller SNR value indicates higher noise in the signal.The WPT was performed with seven mother wavelet functions mentioned above.The anti-noise ability of the mother wavelets was simultaneously analyzed by adding a different noise to sample 2.The detection accuracies are shown in Table 5.As can be observed,the accuracy of the proposed algorithm is 98.04% for sample 2,and the experimental results indicate that the proposed method has a few false decisions in identifying the asynchronous closing events.The main reason for false decisions is that the circuit connection of phase B and phase C results in a more intensive transient process than that of phase A.The violent random oscillations increase the inter-harmonic content in the waveform,resulting in an increase in the variation complexity of the characteristic frequency band.As can be seen in Table 5,with the increase in the noise content,the accuracy decreases in all cases.In particular,after adding stronger noise with an SNR lower than 30 dB,the accuracy decreases faster.However,the accuracy of the demy wavelet was the highest under different noise conditions.Even under a strong noise condition with an SNR of 10 dB,the accuracy still exceeded 91%,which was significantly higher than those of other wavelets.Therefore,in this study,the dmey wavelet was chosen as the optimal mother.
Table 5 Detection results of different mother wavelets
3.4 Performance of different decomposition layers
In addition to the mother wavelet,a further problem of WPT is the choice of decomposition layer N.According to the Nyquist sampling principle,the sampling frequency is twice the highest frequency of the original signal.Assuming that the value of N is 4,the last layer contains 16 frequency bands[12],and the frequency range of each band is 125 Hz.Therefore,when N is equal to 3,4,and 5,the corresponding characteristic frequency band ranges are 0-250 Hz,125-250 Hz,and 125-187.5 Hz,respectively.If the band range is wide,interference from useless frequencies may be introduced,while if the range is narrow,useful information may be lost.Thus,considering that the number of decomposition layers of WPT might affect the proposed algorithm,the validity of the proposed method was tested under different noise conditions,similarly to the case of mother wavelets.The specific results are shown in Table 6.
Table 6 Comparison of different decomposition layers
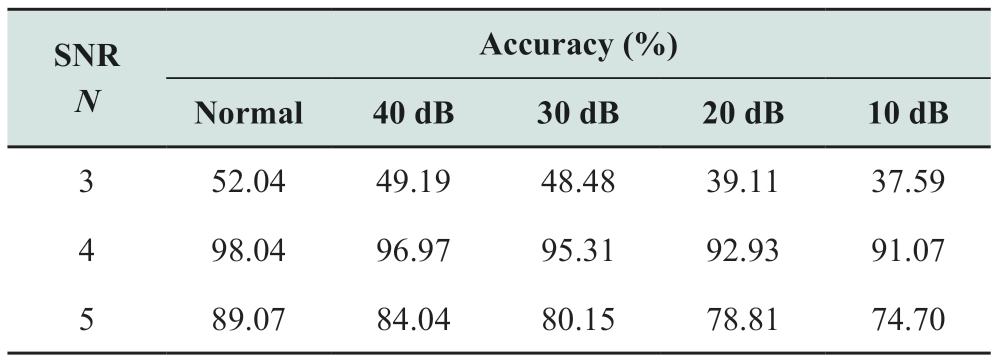
As can be observed in Table 6,the proposed method has a poor accuracy when N is equal to 3.This is primarily because the characteristic frequency band in this case contains the fundamental frequency component with a large amplitude;thus,the variation feature of the third harmonic and inter-harmonics cannot be expressed distinctively.When N is equal to 4,the proposed method can achieve a satisfactory detection accuracy under different noise conditions.Compared with N = 4,when N is 5,the detection accuracies at different noise conditions all decreased by at least 8.97%.In general,the accuracy of N = 4 is significantly higher than that of N = 3 or 5.Therefore,the best results can be obtained by decomposing the signal into four layers by WPT.
3.5 Performance of different indexes
To compare and verify the quality of the ASE index,samples 2 and 3 were used to analyze the detection effect of the singular entropy(SE)index.Table 7 summarizes the specific results,with the detection accuracy and average detection time as evaluation indexes.Compared with that of ASE,the accuracy of SE decreased by 7.29% and 12.67% for samples 2 and 3,respectively.As the actual data(sample 3)usually contains more noise than the simulation data(sample 2),it can be assumed that the noise has a greater effect on the accuracy of SE than in the case of ASE.In addition,the ASE can significantly improve the detection speed,which is extremely important in enhancing the operation and maintenance level.Therefore,it can be considered that the SE index is effective in certain cases,but the ASE index,calculated based on the SE,can not only achieve better performance,but improve the sensitivity of the SE to noise.
Table 7 Performance of ASE and SE

3.6 Effect of sampling frequency
The sampling frequency of the signal strongly affects the real-time data analysis.If the sampling frequency is low,it can result in problems such as waveform distortion,aliasing and missing,while if it is high,the accuracy of data acquisition increases,but it requires excessive CPU time and memory resources,resulting in high equipment requirements and increased cost.
Except for the sampling frequency,the parameter setting and the sample number of different events were the same as those of sample 2.Based on existing HIF detection methods,a number of commonly used sampling frequencies were considered,including 1 kHz[17],2 kHz[35],3.2 kHz[9],5 kHz[3,18],6.4 kHz[16,27],7.68 kHz[1],and 10 kHz[3].The diagnostic results are shown in Fig.11,where the frequency is denoted by f.The evaluation indexes include the detection accuracy and average detection time.In terms of accuracy,as f increased from 1 kHz to 4 kHz,the accuracy also increased.Then,when f was greater than 4 kHz,the accuracy varied in the range of 97.11%-98.04%.In general,the proposed method can achieve relatively satisfactory accuracy when f is greater than or equal to 4 kHz.In terms of speed,the average execution time constantly increased as the sampling frequency increased.However,considering the execution time of existing detection algorithms[3],they all exceed 2.8 ms and in certain cases even greater than 60 ms.For the proposed method,the average execution time is less than 2.2 ms at different sampling frequencies.
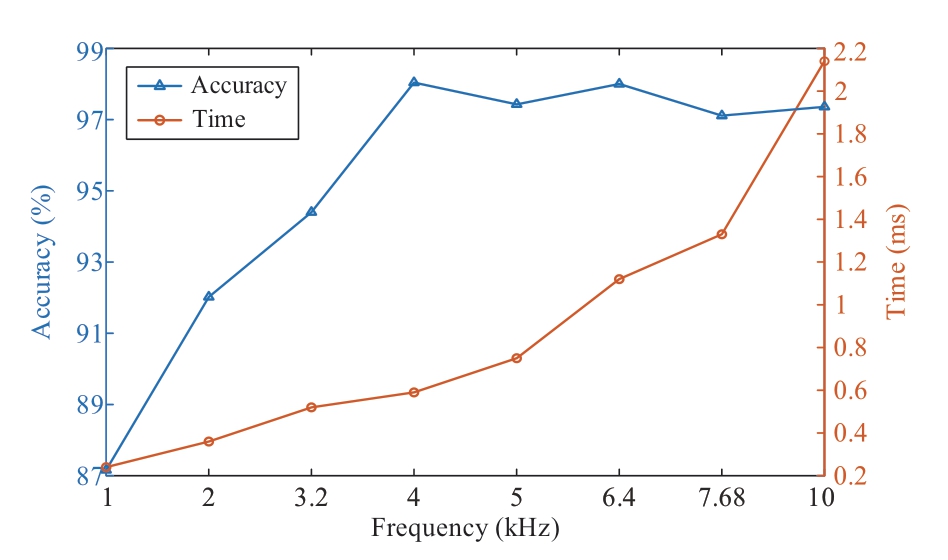
Fig.11 Detection result at different sampling frequencies
In summary,the proposed method can meet the requirements of speed and accuracy at different sampling frequencies(above 1 kHz).Following the comprehensively analysis of the accuracy and speed,the most suitable sampling frequency is 4 kHz,at which the requirement for acquisition device for realistic conditions is also met.
3.7 Effect of window length
Using different lengths of the monitoring window can affect the detection effectiveness of the algorithm.If the window is too wide,it increases the computational cost,while a narrow monitoring window cannot guarantee high detection reliability.Figure 12(a)shows the HIF current waveform collected from the distribution network shown in Fig.4.The sampling rate was 4 kHz and the duration of each cycle was 0.02 s.The total recording time was 0.4 s,which was equivalent to 20 cycles,and the fault inception time was 0.12 s.Using the 4-cycle window length as an example,in Fig.12(a)the five monitoring windows are shown,and their SEm values are shown in Fig.12(b).
The value of K1 is not zero because the system itself contains weak harmonic components,which are amplified after the calculation by the singular entropy formula.The value of K2 is 0.713,which is slightly higher than the threshold.The trigger signal shown in Fig.12(c)was simultaneously set to 1 to realize the fault alarm.This implies that the proposed method can still detect HIF correctly when using 2-cycle data containing transient processes as the analysis object.As can be observed in Fig.12(b),the values of K3,K4,and K5 all exceed the threshold,which indicates that the use of a 4-cycle window is effective.In addition,the values of K3,K4,and K5 are equal,which is based on the fact that the signal is stable after the fault and has little effect on the results[36].Therefore,the HIFs can be successfully detected by the proposed method as long as the fault signal is captured.Specifically,even if the recording device does not record the fault data in time,the identification effect of the proposed method is not affected adversely.Furthermore,the discrimination effect of the proposed method was tested using samples 2 and 3 at different window lengths(L).The results are shown in Table 8,and the evaluation indexes include detection accuracy and average detection time.
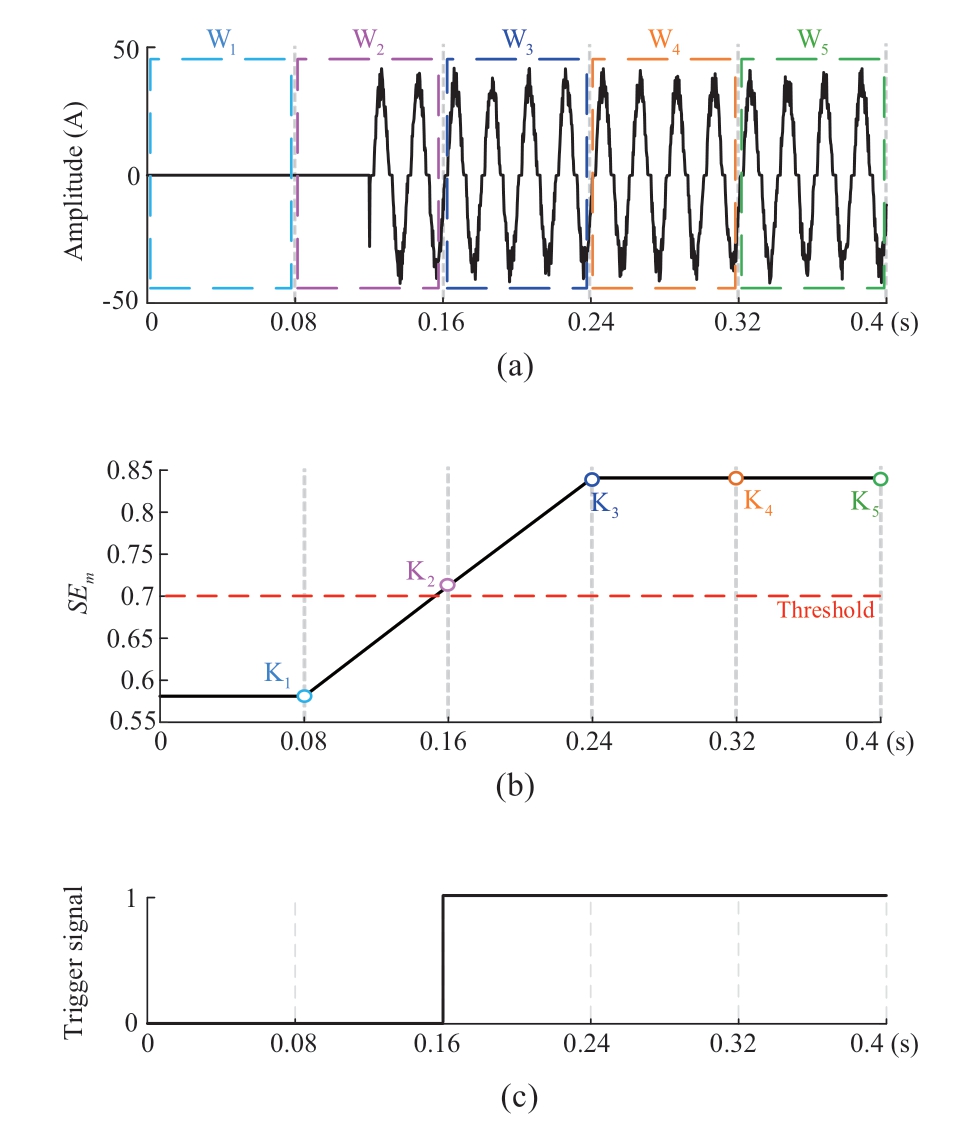
Fig.12 Response of the proposed method:(a)zero-sequence current of HIF,(b) SEm of different sampling moments,and(c)performance of the trigger signal
Table 8 Detection results at different window lengths
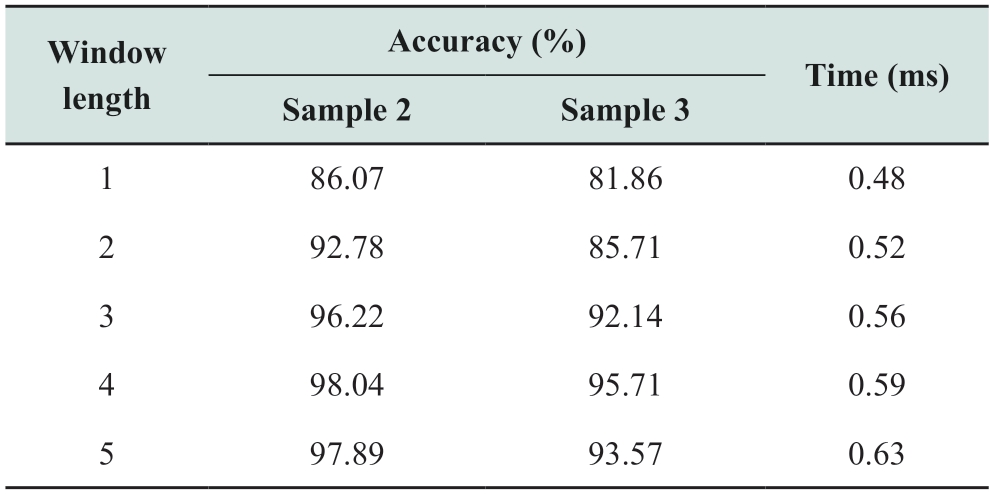
In terms of accuracy,at different L values,the accuracy of sample 2 varied in the range of 86.07%-98.04%,while that of sample 3 varied in the range of 81.86%-95.71%.As L was increased from 1 to 4,the accuracies of both sample 2 and 3 showed an increasing trend.When L was equal to 5,the accuracies of both sample 2 and 3 decreased.Therefore,to achieve the highest accuracy under different test samples,using a 4-cycle window is optimal.While there were more interference factors in the field data,the detection accuracy of sample 3 still exceeded 95%,which verified the effectiveness of the proposed method.In terms of speed,the average detection time increased with the increase inL.However,even the longest detection time(0.63 ms)can still meet the fast detection requirement of HIFs.In conclusion,the proposed method can achieve relatively satisfactory results when the window length is 3-cycle or longer.
3.8 Identification of intermittent HIF
HIFs can be permanent and transient,but there is no distinct boundary between them.It has been mentioned in[5]and[16]that a HIF lasts for at least 8 cycles in each state.As described in Section 3.3,the proposed method can achieve an accuracy of 98.04% for 4-cycle signals(80 ms),in which the diagnostic accuracy of HIFs is 98.47%.Thus,the proposed method can be considered applicable to most permanent and transient HIFs.However,with the expansion of the distribution network,the capacitive current of the system gradually increases.When a single-phase grounding fault occurs,the arc is often difficult to extinguish reliably,which may cause intermittent HIF.An intermittent HIF is a special transient fault with short fault time and high peak current,which can affect the power grid and can result in invalid detection by traditional detection methods.
To verify the identification effect of the proposed method for intermittent HIF,the intermittent conduction of the fault circuit was simulated by a random square-wave generator(RSG)in PSCAD.Figure 13(a)shows the zerosequence waveform of the intermittent HIF collected in the IN system,with random conduction starting at 0.04 s.It can be observed that in a short period of time after extinction and reignition,the zero-sequence current is not exactly zero,but a slight oscillation occurs,introducing severe distortions to the waveform.The length of the sampling window(Wi)was fixed to four cycles,and the displacement step was set to one cycle.The calculated SEm of each Wi is shown in Fig.13(b).As can be seen in Fig.13(b),there is a risk of false decision when the effective waveform length(L)in Wi is only one cycle(W1);when L is two(W2 and W7)and three cycles(W3-W6,and W8-W10),the proposed method can obtain correct discrimination results;when L is four cycles(W11 and W12),the proposed method can not only accurately identify faults,but also obtain larger SEm values than those of the other sampling windows.
Simulation experiments were performed on the system shown in Fig.4.Similar to Fig.13(a),each sample can be divided into 12 segments.The specific settings of the simulation samples are listed in Table 9.The detection accuracy is 92.17%,and the main reason for the false decisions is that the effective length of the waveform in certain test samples is too short(even less than 1 cycle),which limits the accurate extraction of the fault features.However,the experimental results demonstrate that the proposed method is still applicable for identifying intermittent HIFs.
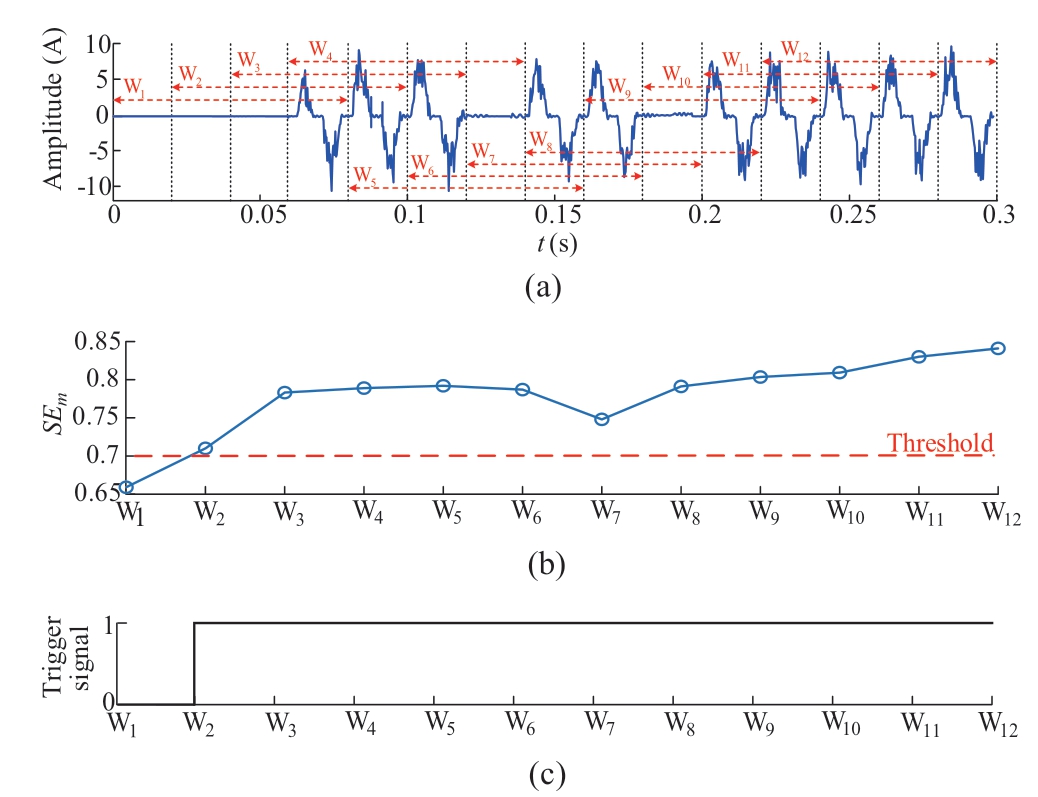
Fig.13 Single fault decision results for intermittent HIFs:(a)zero sequence current waveform,(b)SEm of each Wi,and(c)trigger signal
3.9 Effects of changes in the network structure
As the number of equipment,such as feeders and DGs,increases,the network topology becomes increasingly complex and the operation mode changes frequently,which brings new challenges to the protection of distribution network.To test the effects of changes in the network structure,a 35 kV distribution system was established in PSCAD.The network topology is shown in Fig.14,and the line parameters are the same as those in Table 1.The parameters of DGs and loads are listed in Table 10.The switches in Fig.14 were all in their default state,and the system network structure was varied by changing the state of only one switch at a time:(a)deleting L3(K1 is off),(b)increasing L4(K2 is on),and(c)running in ring network mode(K3 is on).Except for the location and number of fault points,other settings are the same as those in Table 3.The test results are shown in Table 11,and it can be observed that the detection accuracy using the 35 kV simulation system(95.57%)is lower than in the case when the 10 kV simulation system(98.04%)was used.This may be due to the fact that the threshold determined by sample 1 is optimal for the 10 kV system,while its effectiveness decreases slightly for other voltage-level systems.Nevertheless,the test results in Table 11 confirm that the proposed method still has good detection efficiency in the 35 kV system and has a strong adaptability for changes in the system topology.
Table 10 Parameters of the DGs and loads
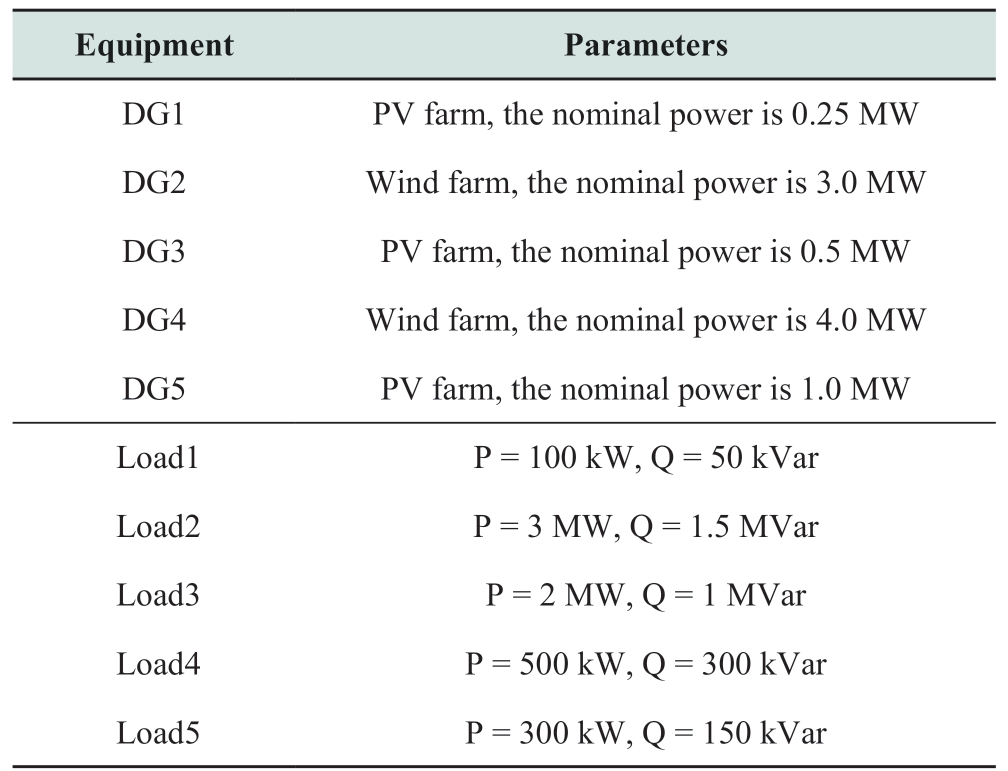
Table 11 Test results for system network structure changes
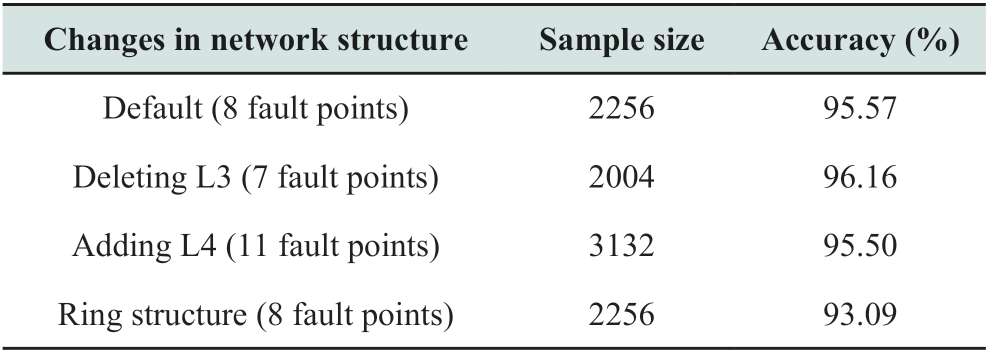
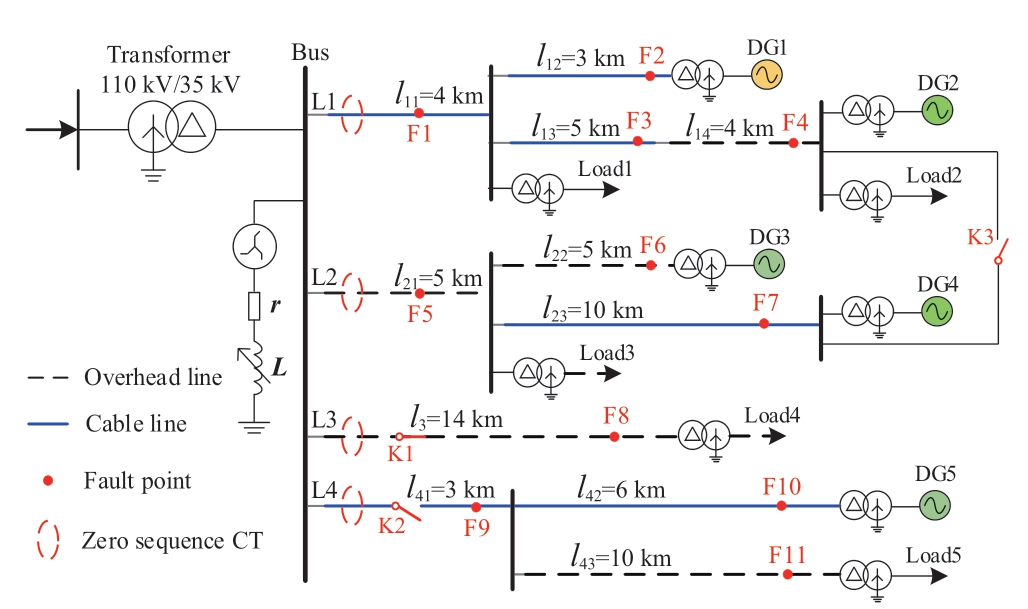
Fig.14 Topology of the simulated 35 kV distribution system
Table 9 Parameters of the HIF model

3.10 Applicability of IEEE system
To further verify the effectiveness of the proposed method,the IEEE-34 Node Feeder is applied as a test system.The system is simulated in PSCAD and the system topology is presented in Fig.15.It is a power system based on an actual grid located in the US,with a nominal feeder voltage of 24.9 kV and a grid frequency of 60 Hz[16].In addition to its facticity,the system includes long and light loads,two on-line regulators,unbalanced loads,and shunt capacitors[16].These configurations make it suitable to be used as a test system for distribution networks.To illustrate the detection results of the proposed method at different fault locations,a total of 12 fault points is set up.The zerosequence CT is installed at the substation with a sampling frequency of 4 kHz.
In Fig.15,the nearest and farthest nodes from the measurement point is 802 and 848,respectively.Taking HIF and asynchronous CS as examples,the zero-sequence current waveforms at node 802 and 848 are shown in Fig.16.It can be seen that the farther away from the measurement point,the smoother the waveform is,in the same time,the more likely to lose the details of the waveform.Hence,the SEm values of the signals mentioned above are calculated to validate the detection efficiency of the suggested approach over larger distances.The results at node 802 and 848 are presented in Fig.17.In this case,the parameters Rp and Rn in the HIF model are set to vary between 130-150 Ω,and the parameters Vpand Vn are set to vary between 3-4 kV.In conclusion,the proposed method is still effective even at a relatively long distance from the measurement point.
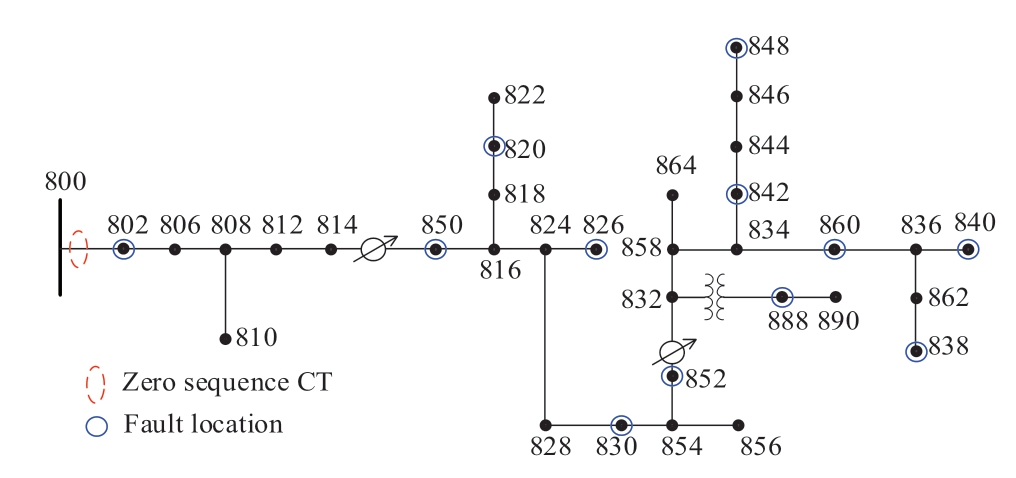
Fig.15 Topology of IEEE-34 Node Feeder
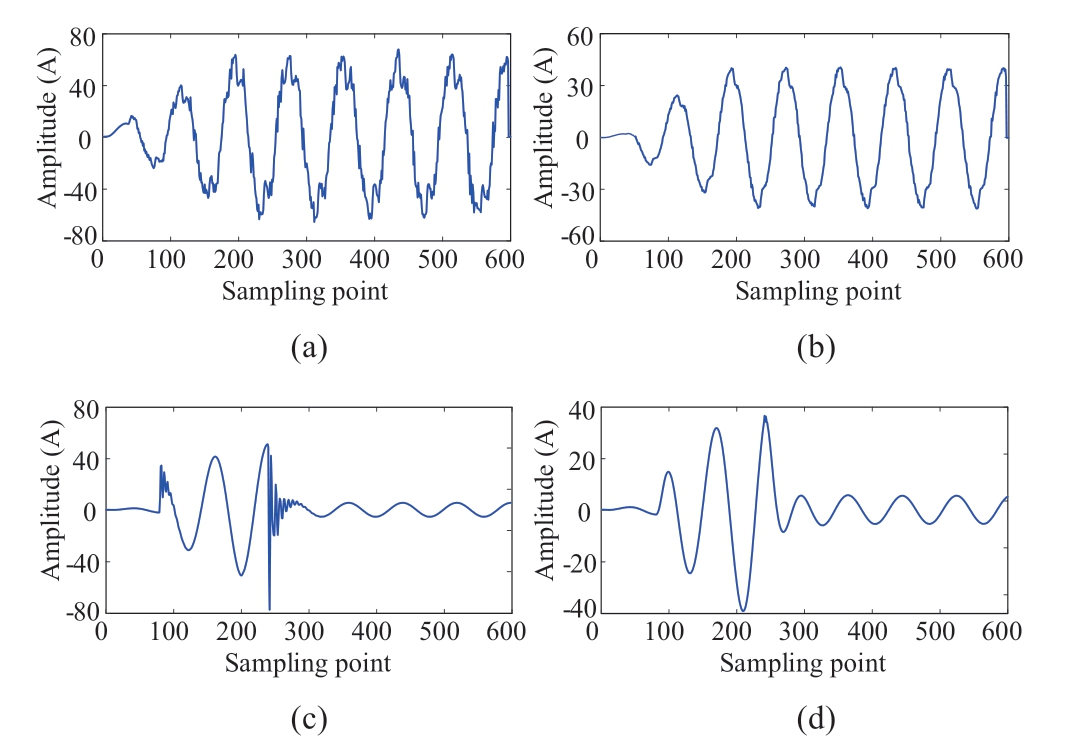
Fig.16 Current signals at different locations:(a)HIF at node 802,(b)HIF at node 848,(c)CS at node 802,and(d)CS at node 848
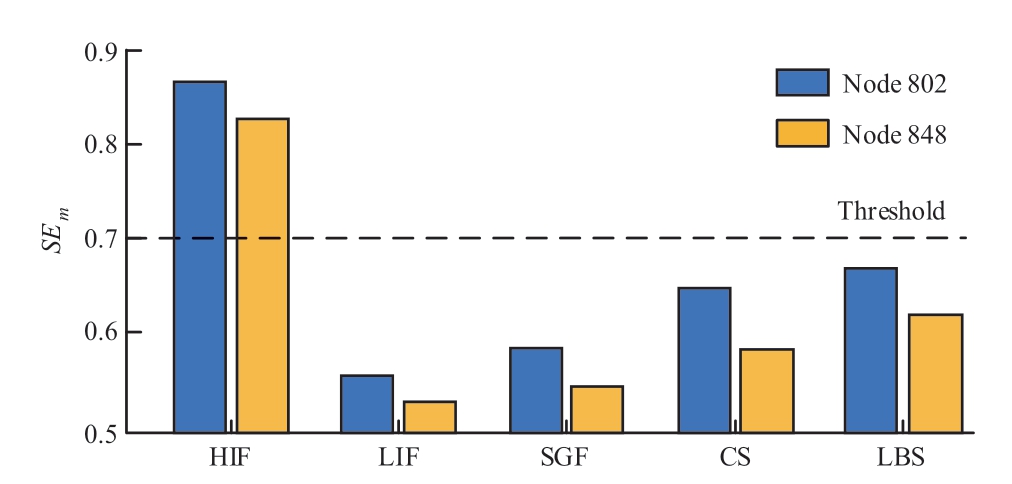
Fig.17 SEmof different current signals at node 802 and 848
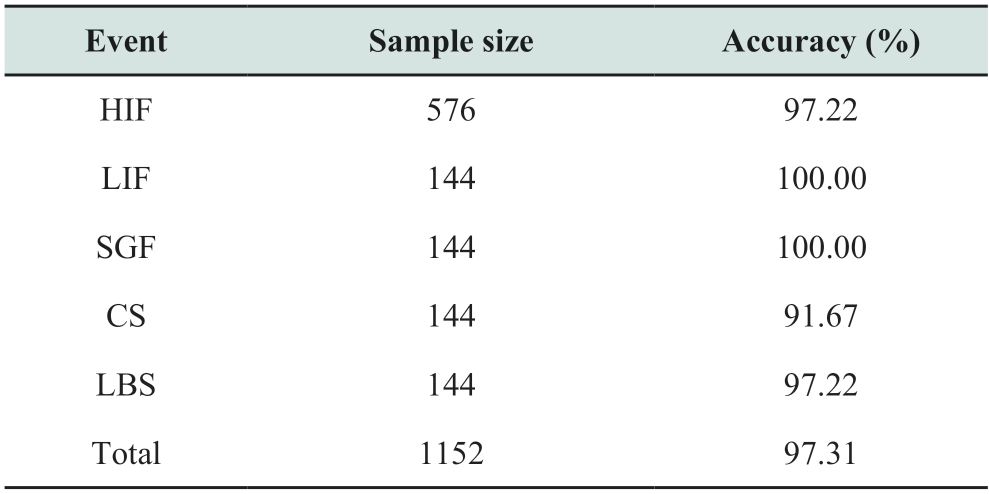
To obtain adequate samples,considering the factors that affect each type of event,the fault location,fault initial angle,and model parameters are changed.The detection results are presented in Table 12 with a total accuracy of 97.31%,which indicates that the proposed algorithm still has good adaptability in the IEEE-34 node feeder.
Table 12 Test results of IEEE-34 node feeder
3.11 Effects of three-phase parameter asymmetry
Most HIF detection methods for distribution networks using zero sequence current as the detection signal are based on the strict three-phase symmetry of the system.However,the power systems often fail to achieve the ideal three-phase symmetric state in engineering practice.There are many causes of the three-phase asymmetry of the distribution network,such as the following events that can generate zero-sequence currents:(a)asymmetric parameters line switching,which is refer to the asymmetric three-phase capacitance due to the uneven line transposition or the installation of single-phase capacitive potential transformers;(b)unbalanced CS;(c)two-phase grounding fault;(d)twopoint grounding fault;(e)single-phase grounding fault.The single-phase grounding fault has been added as one of the disturbance events in the simulated samples in Table 3.Therefore,the other four types of asymmetric events are simulated to further investigate the effects on the proposed method.The simulated samples are obtained by changing the fault location,system neutral,fault phase,fault initial angle,and model parameters in the 10 kV distribution system(in Fig.4).The typical waveforms of the four types of asymmetric events are shown in Fig.18,and the specific test results are listed in Table 13.
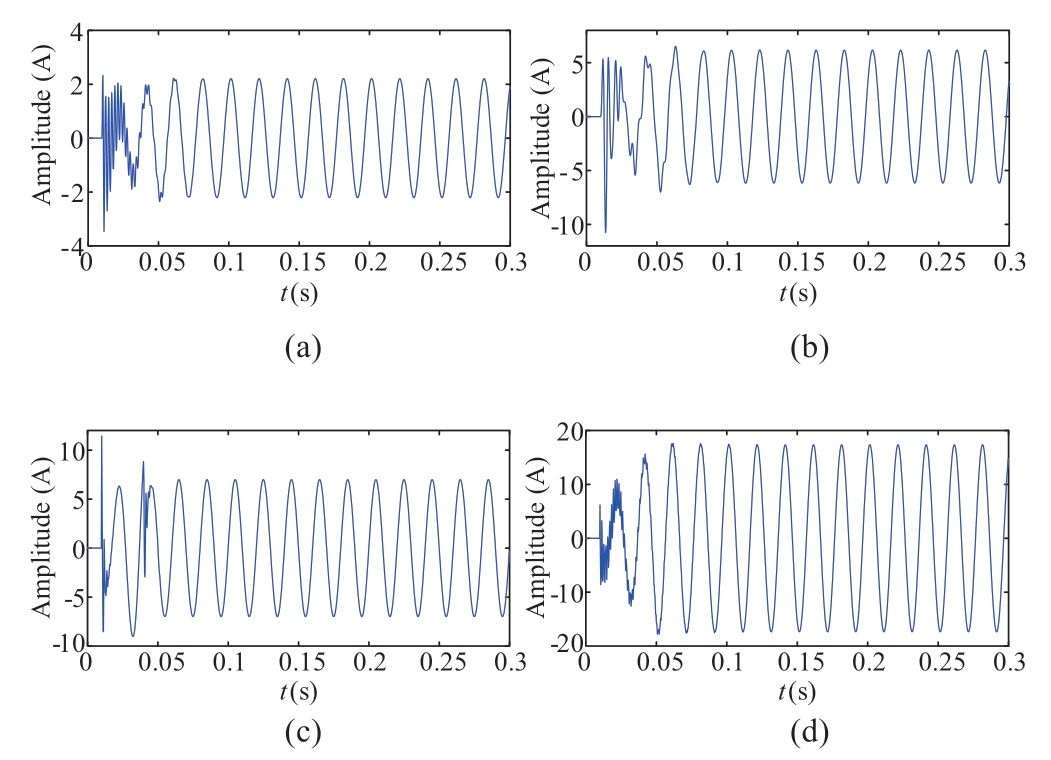
Fig.18 Zero-sequence current of three-phase parameter asymmetric events.(a)Asymmetric line parameters,(b)unbalanced CS,(c)two-phase ground fault,and(d)twopoint ground fault
Table 13 Test results of three-phase parameter asymmetry
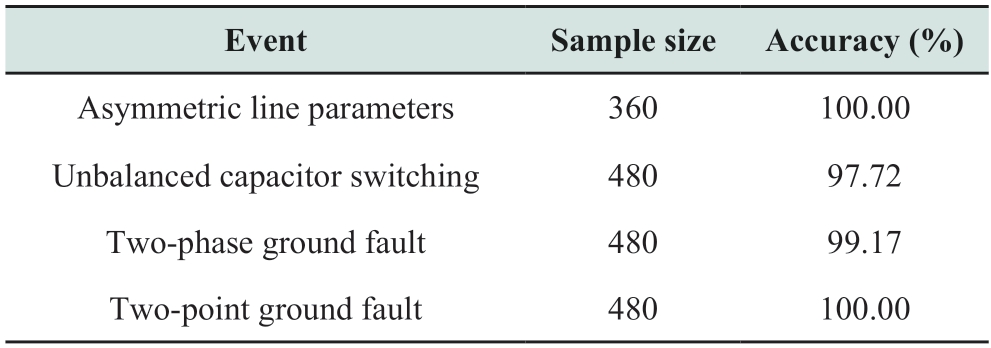
From the test results,there are no misjudgments in asymmetric line parameters and two-point grounding faults.While among the unbalanced CS events,10 samples are misjudged as HIF,corresponding to the samples with a three-phase capacitance of 25/50/100 uF closing at phase angles of 90° and 120° at F2-F4 in the IN system,and the samples with a three-phase capacitance of 20/30/100 uF and 25/50/100 uF closing at a phase angle of 90° at F13-14 in the LN system.The main reasons are the large unbalance degree of capacitance and the reaction between capacitors and induction components of the system,which can lead to the increase of the harmonic component in the waveform.Among the two-phase grounding fault events,4 samples are misjudged as HIF,corresponding to the samples with fault occurrence time of phases A and B of 0.01/0.05 s and 0.01/0.07 s,happening at phase angles of 60° and 90° at F6 in the IN system.The reason may be that there are two drastic oscillations occur in the zero-sequence current in a short time,resulting in the increase of interharmonic content.In summary,the test results in Table 13 indicate that the proposed method has a low misjudgment rate,which verifies its good adaptability for three-phase parameter asymmetry in the system.
4 Comparison with existing methods
The proposed method is compared with the other four threshold detection methods using harmonics as features[8,10,21,37]via sample 2,and summarized in Table 14.In[8],the three-phase currents are collected at a sampling frequency of 15.36 kHz and the STFT is applied to extract the second,third and fifth harmonics,then their amplitudes and phase angles are calculated.The phase angle of the third harmonic is used as the main detection index.If it is below the set threshold and lasts for more than five cycles,it is judged as HIF.If not,it turns to determine whether the amplitudes of the second,third and fifth harmonics meet the conditions,respectively.However,the thresholds of this method needto be changed according to the normal operation of different systems,but no specific formula is given in this paper.In addition,the influence of noise is not considered,which limits its applicability.In[10],the sampling frequency is 15.36 kHz,the DWT is applied to obtain the high and lowfrequency components of the signal,corresponding to the detail and approximate wavelet coefficients,respectively.If the detail coefficient is higher than the threshold and lasts for 150 ms,and the waveform of the approximate coefficient does not indicate the occurrence of sags or swells during this period,the HIF is detected.This method requires at least nine cycles of data and must include the transient process,while the method proposed in this study only requires four cycles of steady-state signal.In[21],the sampling frequency is 15.36 kHz and ST is performed to extract the third harmonic phase angle of phase current,and then its standard deviation is calculated.If it is continuously below the threshold for more than nine cycles,the HIF is judged to be detected.In[37],the sampling frequency is 15.36 kHz,and a linear prediction(LP)method based on the variation of zero-sequence current with time is proposed.The LP technique can model the current signal up to the fifth harmonic,then the energy of the prediction error is used as the detection index.If the index is still above the threshold after five cycles,the HIF is detected.However,this method requires data from one cycle before fault and five cycles after fault,which means that the HIF can be identified only when the transient process is detected.The detection accuracy and average execution time are taken as evaluation indexes,and the specific results are presented in Table 15.It is clear that the detection accuracy of these four methods is descending in the order of[8],[21],[37]and[10].In[8]and[21],the third harmonic is used as the main feature,and their accuracy is both higher than 85%.Compared with[21],the accuracy of[37]is decreased by 3.47%.The accuracy of[10]is reduced to less than 85%.In terms of rapidity,the average execution time of these four methods is descending in the order of[37],[8],[21]and[10].The detection time of[10]is about 55 ms longer than that of the proposed method.This method employs the DWT technique,which needs to analyze whether the waveform of approximate wavelet coefficients is distorted,making the determination process more complex and increasing the computational cost.Five features need to be obtained in[8],but the calculation time of this method is reduced by 7.79 ms compared with[10]due to the simpler judgment process.The detection time of[21]exceeds that of the proposed method by about 35 ms.The calculation time of this method is reduced by 12.2 ms compared with[8]due to the use of faster ST technique and the smaller number of features.The detection speed of[37]is only lower than that of the proposed method,this indicates that the LP method has a better rapidity compared to some traditional decomposition techniques.The calculation time of the proposed method in this paper is only 0.59 ms,which is mainly contributed to the rapidity of the key technologies(WPT and ST).Compared with directly inputting the entire data for calculation,the operations carried out in each halfcycle(including normalization,ST,SVD denoising,and calculation of singular entropy)not only greatly reduces the execution time,but also improves the anti-noise ability.To sum up,the proposed method in this study has the best accuracy and rapidity,which further validates its excellent performance.
Table 14 Comparative results between proposed method and methods in[8,10,21]and[37]
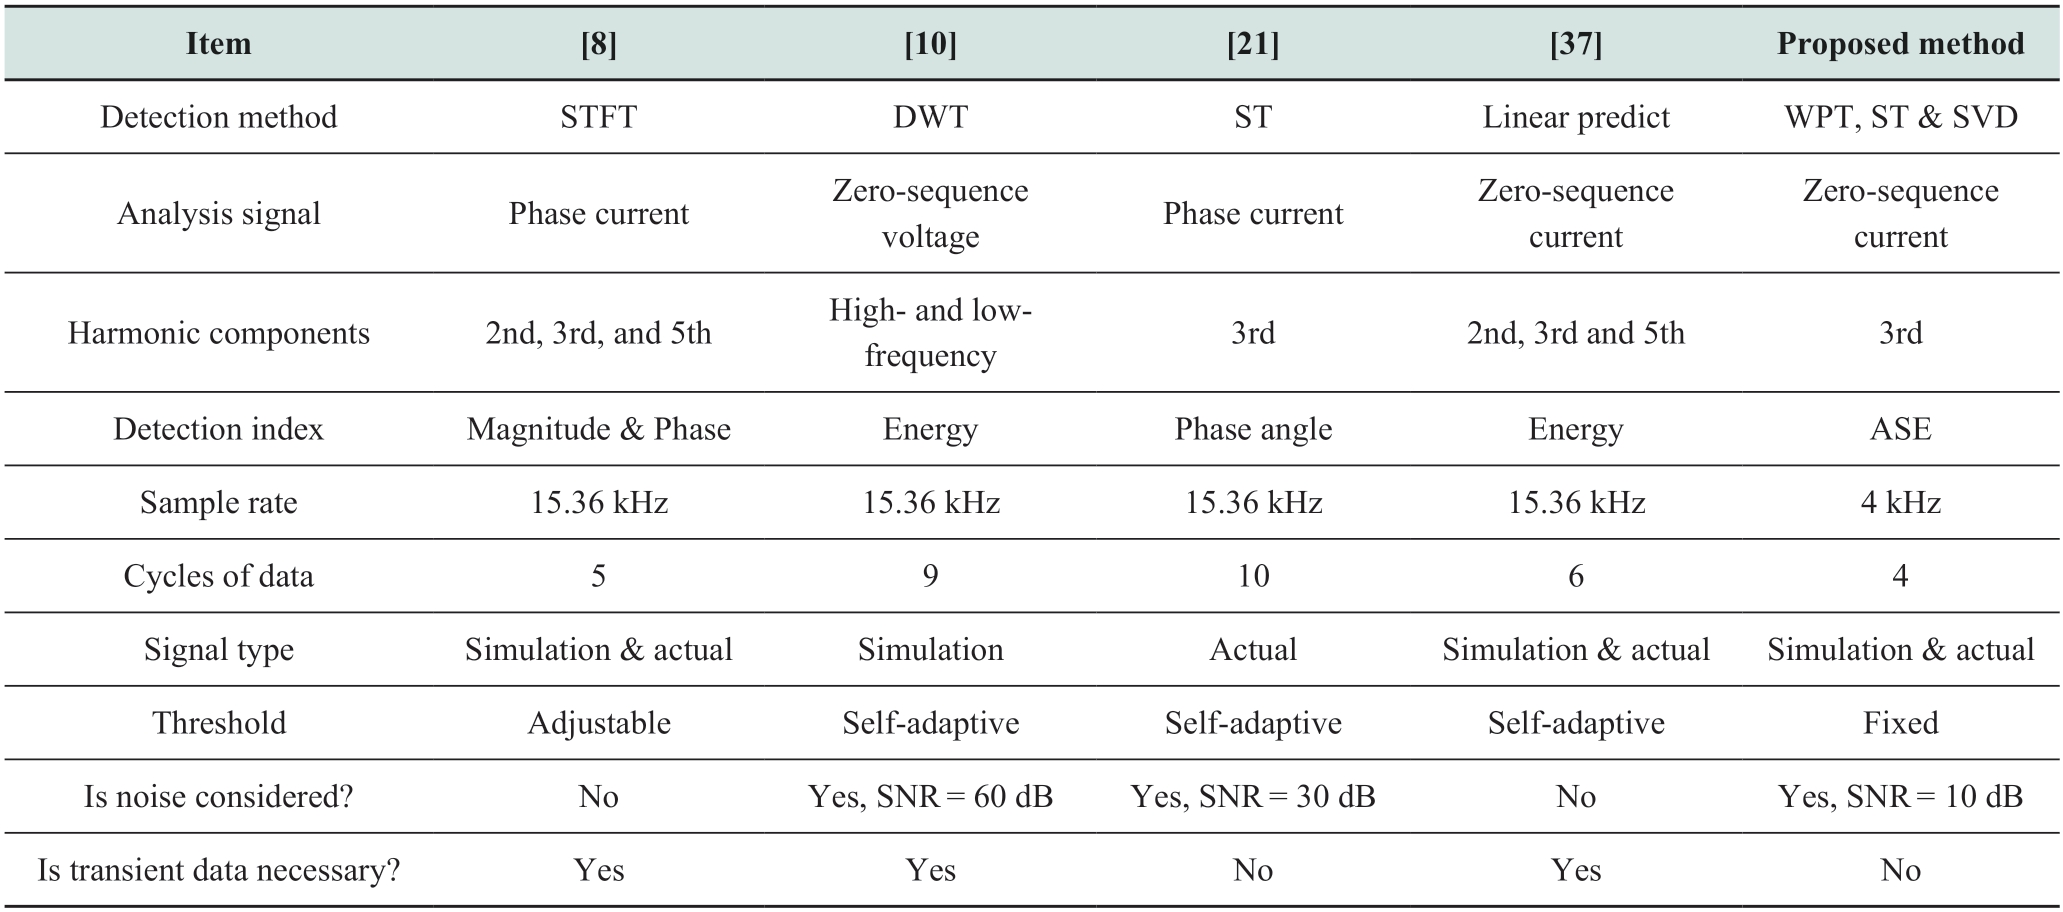
Table 15 Test results of different methods

5 Conclusion
In this study,a classification method for HIFs and disturbances in the medium voltage distribution network is proposed by investigating the time-frequency characteristics of different signals.This method uses WPT to extract the desired frequency band accurately,which better reflects the variation degree of the characteristic frequency band.On the basis of ST,the anti-noise ability and speed of the algorithm are significantly improved by combining the SVD denoising method and ASE index.Through the verification of simulated and measured data under different noise conditions,the detection accuracy of the proposed method is all above 91%,and the average detection time is less than 0.6 ms,which realizes the fast and reliable detection of HIFs.However,as the length of the sampling window reduces,the detection accuracy of the proposed algorithm also decreases.This means that if the fault circuit is disconnected for too long in intermittent HIF,misjudgment may occur.Besides,the set threshold is optimal for the 10 kV system,while its effectiveness may decrease slightly in other voltage-level systems.Therefore,in future research,further improvement of the adaptability to a shorter window size can be considered.
Acknowledgements
This work is financial supported by the Natural Science Foundation of Fujian,China(2021J01633).
Declaration of Competing Interest
We declare that we have no conflict of interest.
References
[1]Mortazavi S H,Moravej Z,Shahrtash S M(2019)A searching based method for locating high impedance arcing fault in distribution networks.IEEE Transactions on Power Delivery,34(2):438-447
[2]Zhang Y,Wang X,Li J(2020)Small-current grounding fault location method based on transient main resonance frequency analysis.Global Energy Interconnection,3(4):324-334
[3]Wang X,Gao J,Wei X,et al.(2019)High impedance fault detection method based on variational mode decomposition and Teager-Kaiser energy operators for distribution network.IEEE Transactions on Smart Grid,10(6):6041-6054
[4]Xie W,Wang X,Fang C(2020)Field experiment using transient energy method to locate a single-phase to ground fault.Global Energy Interconnection,3(6):585-594
[5]Xiao Q M,Guo M F,Chen D Y(2022)High-impedance fault detection method based on one-dimensional variational prototyping-encoder for distribution networks.IEEE System Journal,16(1):966-976
[6]Mamishev A V,Russell B D,Benner C L(1996)Analysis of high impedance faults using fractal techniques.IEEE Transactions on Power System,11(1):435-440
[7]Panigrahi R R,Mishra M,Rajan A,et al.(2018)High impedance fault detection based on mathematical morphology for radial distribution network.Proceedings of 2018 International Conference on Applied Electromagnetics,Signal Processing and Communication(AESPC).Bhubaneswar,India.1-6
[8]Lima É M,Junqueira C M S,Brito N S D,et al.(2018)High impedance fault detection method based on the short-time Fourier transform.IET Generation,Transmission &Distribution,12(11):2577-2584
[9]Soheili A,Sadeh J,Bakhshi R(2018)Modified FFT based high impedance fault detection technique considering distribution non-linear loads:Simulation and experimental data analysis.International Journal of Electrical Power &Energy Systems,94:124-140
[10]Santos W C,Lopes F V,Brito N S D,et al.(2017)Highimpedance fault identification on distribution networks.IEEE Transactions on Power Delivery,32(1):23-32
[11]Yeh H G,Sim S,Bravo R J(2019)Wavelet and denoising techniques for real-time HIF detection in 12-kV distribution circuits.IEEE System Journal,13(4):4365-4373
[12]AsghariGovar S,Pourghasem P,Seyedi H(2019)High impedance fault protection scheme for smart grids based on WPT and ELM considering evolving and cross-country faults.International Journal of Electrical Power &Energy Systems,107:412-421
[13]He H,Cheng S,Zhang Y,et al.(2005)Home network powerline communication signal processing based on wavelet packet analysis.IEEE Transactions on Power Delivery,20(3):1879-1885
[14]Gadanayak D A,Mallick R K(2019)Interharmonics based high impedance fault detection in distribution systems using maximum overlap wavelet packet transform and a modified empirical mode decomposition.International Journal of Electrical Power &Energy Systems,112:282-293
[15]Stockwell R G,Mansinha L,Lowe R P(1996)Localization of the complex spectrum:the S transform.IEEE Transactions on Signal Processing,44(4):998-1001
[16]Lopes G N,Menezes T S,Santos G G,et al.(2022)High impedance fault detection based on harmonic energy variation via S-transform.International Journal of Electrical Power &Energy Systems,136:107681
[17]Biswal M,Ghore S,Malik O P,et al.(2021)Development of time-frequency based approach to detect high impedance fault in an inverter interfaced distribution system.IEEE Transactions on Power Delivery,36(6):3825-3833
[18]Mishra M,Routray P,Rout P K(2016)A universal high impedance fault detection technique for distribution system using S-Transform and pattern recognition.Technology and Economics of Smart Grids and Sustainable Energy,1(1):1-9
[19]Mishra M,Rout P K(2018)Detection and classification of microgrid faults based on HHT and machine learning techniques.IET Generation,Transmission &Distribution,12(2):388-397
[20]Narasimhulu N,Kumar D V A,Kumar M V(2020)LWT based ANN with Ant Lion Optimizer for detection and classification of high impedance faults in distribution system.Journal of Electrical Engineering &Technology,15(4):1631-1650
[21]Lima É M,Brito N S D,Souza B A(2019)High impedance fault detection based on Stockwell transform and third harmonic current phase angle.Electric Power Systems Research,175:105931
[22]Eslami M,Jannati M,Tabatabaei S S(2021)An improved protection strategy based on PCC-SVM algorithm for identification of high impedance arcing fault in smart microgrids in the presence of distributed generation.Measurement,175:109149
[23]Gao J,Wang X H,Wang X W,et al.(2022)A high-impedance fault detection method for distribution systems based on empirical wavelet transform and differential faulty energy.IEEE Transactions on Smart Grid,13(2):900-912
[24]Lei B,Yi P,Xiang J,et al.(2021)A SVD-based signal de-noising method with fitting threshold for EMAT.IEEE Access,9:21123-21131
[25]Miao Y,Zhao M,Lin J(2019)Periodicity-impulsiveness spectrum based on singular value negentropy and its application for identification of optimal frequency band.IEEE Transactions on Industrial Electronics,66(4):3127-3138
[26]Wei M,Shi F,Zhang H,et al.(2020)High impedance arc fault detection based on the harmonic randomness and waveform distortion in the distribution system.IEEE Transactions on Power Delivery,35(2):837-850
[27]Wei M,Liu W,Zhang H,et al.(2021)Distortion-based detection of high impedance fault in distribution systems.IEEE Transactions on Power Delivery,36(3):1603-1618
[28]Khakpour A,Franke S,Gortschakow S,et al.(2016)An improved arc model based on the arc diameter.IEEE Transactions on Power Delivery,31(3):1335-1341
[29]Wang X,Liu W,Liang Z,et al.(2022)Faulty feeder detection based on the integrated inner product under high impedance fault for small resistance to ground systems.International Journal of Electrical Power &Energy Systems,140:108078
[30]Ma J,Teng Z,Tang Q,et al.(2021)Measurement error prediction of power metering equipment using improved LOF and kernel SVR.IEEE Transactions on Industrial Electronics,69(9):9575-9585
[31]Haar A(1910)Zur theorie der orthogonalen funktionensysteme,Mathematische Annalen,69(3):331-371
[32]Libal U,Hasiewicz Z(2017)Risk upper bound for a NM-type multiresolution classification scheme of random signals by Daubechies wavelets.Engineering Applications of Artificial Intelligence,62:109-123
[33]Shoaib M,Shamseldin A Y,Melville B W(2014)Comparative study of different wavelet based neural network models for rainfall-runoff modeling.Journal of Hydrology,515:47-58
[34]Liu H,Wu H,Li Y(2020)Multi-step wind speed forecasting model based on wavelet matching analysis and hybrid optimization framework.Sustainable Energy Technologies and Assessments,40:100745
[35]Cui Q,El-Arroudi K,Weng Y(2019)A feature selection method for high impedance fault detection.IEEE Transactions on Power Delivery,34(3):1203-1215
[36]Li J,Li Y,Wang Y(2022)Single-phase-to-ground fault protection based on zero-sequence current ratio coefficient for low-resistance grounding distribution network.Global Energy Interconnection,4(6):564-575
[37]Grimaldi R B G,Chagas T S A,Montalvão J,et al.(2021)High impedance fault detection based on linear prediction.Electric Power Systems Research,190:106846

Scan for more details
Received:15 June 2022/Accepted:30 August 2022/Published:25 Feburary 2023
 Wei Gao
gaowei0203@fzu.edu.cn
Xiaofeng Zeng
zxf19981203@163.com
Gengjie Yang
ygj23802@126.com
2096-5117/© 2023 Global Energy Interconnection Development and Cooperation Organization.Production and hosting by Elsevier B.V.on behalf of KeAi Communications Co.,Ltd.This is an open access article under the CC BY-NC-ND license(http://creativecommons.org/licenses/by-nc-nd/4.0/).
Biographies

Xiaofeng Zeng received the B.S.degree at Fujian Agriculture and Forestry University,Fuzhou,China,in 2020.She is working towards the M.S.degree at Fuzhou University,Fuzhou,China.Her research interests include diagnosis and modeling of high impedance fault in the distribution system.

Wei Gao received the B.S.and M.S.degrees at Fuzhou University,China,in 2005 and 2008,respectively,and Ph.D.degree at National Taiwan University of Science and Technology,Taiwan,in 2021.He is currently an Associate Professor in Fuzhou University.His research area mainly focuses on generation technology of photovoltaic and faults diagnosis of power equipment.

Gengjie Yang received the B.S.and M.S.degrees at Fuzhou University,Fuzhou,China,in 1985 and 1988,respectively.He is a Professor in Fuzhou University.His research interests include power system analysis and control.
(Editor Yajun Zou)
