0 Introduction
As the installed capacity of China’s power industry and power generation continue to rise,cross-linked polyethylene(XLPE)power cables with good electrical properties are being widely used in power transmission and distribution grids.The deterioration of power cables owing to a combination of factors leads to a reduction in insulation performance and a shortening of the cable’s service life.Therefore,the healthy operation of power cables is of great importance for ensuring the reliability of electrical equipment and even the entire power grid[1-4].
The presence of insulation defects in cables over a long period of time is a potential hazard for the safe and stable operation of the power grid.The diagnosis of aging cables thus has become a key issue for power grid operating units to consider.Cable insulation aging is a phenomenon of insulation deterioration caused by the combined impact of electrical,chemical,and mechanical effects[5-7].At present,microscopic and online inspection is the most intuitive and effective way to determine the state of cable insulation.Scholars around the world use scanning electron microscopy(SEM)[8],infrared spectroscopy(IR)[9],transmission electron microscopy(TEM)[10],and X-ray diffraction analysis(XRD)[11]to characterize the microstructure and physicochemical properties of insulation aging cables;however,such methods are mostly used for decommissioned cables and cannot be applied to operating cables.
A number of researchers have investigated the online monitoring of cable insulation defects.In[12],the DC component method was used to detect the DC component of the leakage current between the core and shield of the cable under the action of AC in order to determine the state of the cable insulation.The drawback of this method is that the DC component is very small,and the shield of the cable and the earth between the small interference of stray currents will cause a large error.In[13],the DC superposition method was used to measure the cable insulation resistance,and a criterion was proposed.However,in the DC superposition method,the DC voltage must be superimposed on the cable core,and different superimposition methods are required for different grounding networks;therefore,this method is not widely used in China.In[14-16],the dielectric loss angle tangent method was used to detect the dielectric loss tangent value of the cable online and determine overall defects of the insulation layer of the cable including degradation due to moisture and aging.However,this method can only detect centralized defects in the cable,and the dielectric loss fluctuations caused by local insulation defects account for a small proportion of the total loss,resulting in no significant change in the dielectric loss tangent value.The partial discharge method is a more widely used cable aging detection method.In[17-19],the partial discharge method was used to detect the partial discharge phenomenon of cables in operation to determine the cable insulation condition;however,this method has certain limitations,and its results are easily affected by electromagnetic interference.
The methods proposed in the above studies have their own advantages,but they all have certain limitations and cannot effectively diagnose insulation defects.There is a correlation between harmonics and cable defects,and the harmonic method can be used to detect specific types of cable insulation defects more efficiently.Therefore,this paper proposes a method for identifying power cable insulation defects based on deep learning.First,the principle of the harmonic method for diagnosing cable insulation defects is introduced.Second,a cable insulation layer containing bubbles,protuberances,and water dendrite defects is simulated using ANSYS.A database of cable insulation defects is constructed,and finally,the deep learning algorithm,long short-term memory(LSTM),is used to accurately diagnose and identify cable insulation defects.
1 Principle of detection of cable insulation defects
When an alternating current(AC)passes through the cable core,the core around the alternating magnetic field and the internal energized cable can be seen as a multiturn current loop,and this vortex around the magnetic flux of the central axis of the current distribution is called eddy current.As shown in Fig.1,an AC current flows through a conductor,which produces a magnetic beam φa,φb,φc,...,φn,and the magnetic beam changes to produce eddy currentsIa1,Ib1,Ic1,...,In1 and Ia2,Ib2,Ic2,...,In2,so that the internal state of the cable can be determined by the eddy currents.Current I is the current synthesized by each AC current.The eddy currents Ia1,Ib1,Ic1,...,In1 and Ia2,Ib2,Ic2,...,In2are each composed of a group of electrons flowing in the opposite direction to the current above.
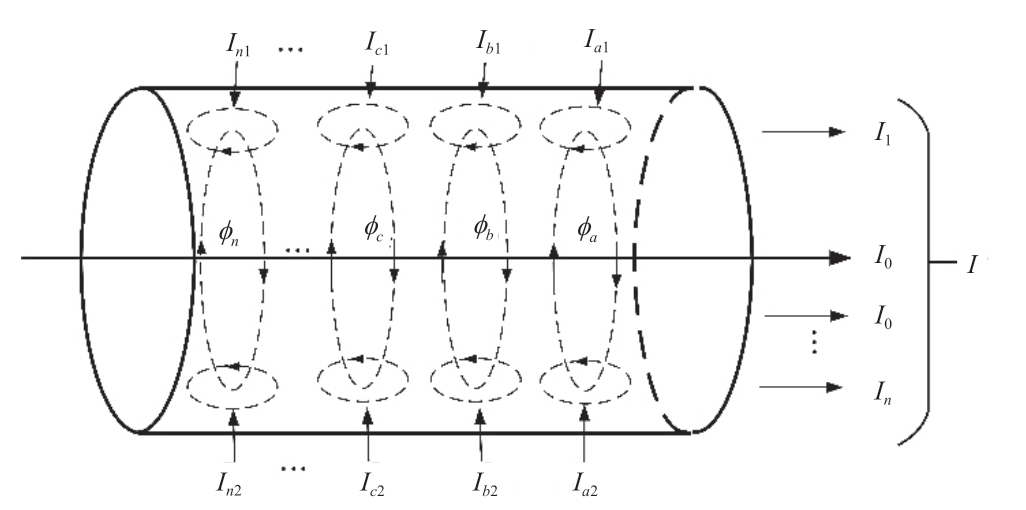
Fig.1 Schematic diagram of eddy current in cable
The insulation materials of the various layers of the cable differ.When the forces to which the insulation materials are subjected exceed their limit values,irreversible damage occurs,which leads to deterioration of cable insulation,corresponding changes in the magnetic field,and consequent distortion of the current,which means that cable stress aging defects are the main reason for the appearance of high harmonics[20].According to the skin effect,the current generated by the leakage flux in the insulator is concentrated in the surface layer of the cable with regard to the magnetic energy inside the conductor Wi,expressed by
where Φ0 is the rotating magnetic flux and I0 is the current.
Let the induction coefficient inside the conductor be Li,and the induction coefficient inside conductor Li also impedes the change in current.The current flowing through the cable is inertial owing to the influence of Li which in turn generates inertial Joule loss Ji,at which point the total Joule loss Jt can be expressed as
where Ji0 is the inertial Joule loss at t = 0 and R is the cable resistance.
The root mean square of the velocity of a fast-moving free electron in a cable can be expressed as
where  is the number of free-moving electrons,k is the Boltzmann constant(k = 1.380658),m is the electron mass,and T is the absolute temperature.
When the insulation of the cable is in a good condition,the eddy current is very weak,generally only a few to a few tens of nanoamperes.When a cable has insulation defects,internal stresses change,leading to changes in the dielectric magnetic beam and dielectric vibrations.This results in high harmonics and causes phenomena such as a drop in insulation resistance,an increase in eddy current,and an increase in the dielectric loss tangent.Common insulation defects in cables are shown in Fig.2,including bubbles,water trees,insulation protuberances,and contaminants.
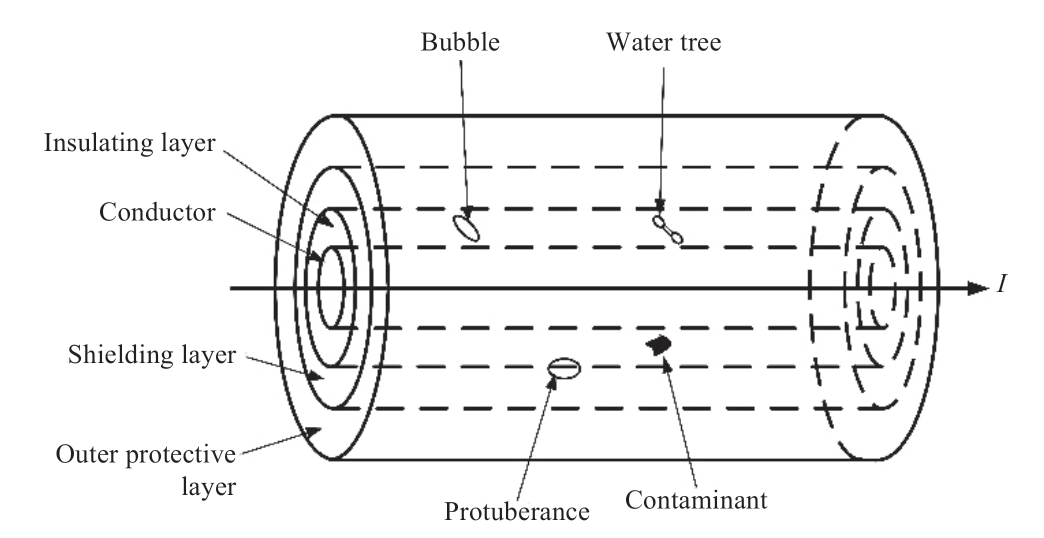
Fig.2 Common defects of cable insulation
When the cable is in operation,an electric field exists within the core conductor,which is capable of forming an electric field through the flow of a current with a fixed conductivity.The strength of this electric field and the density of the magnetic bundle are connected through the permeability μ.Assuming that the cable has cross-sectional current density J,
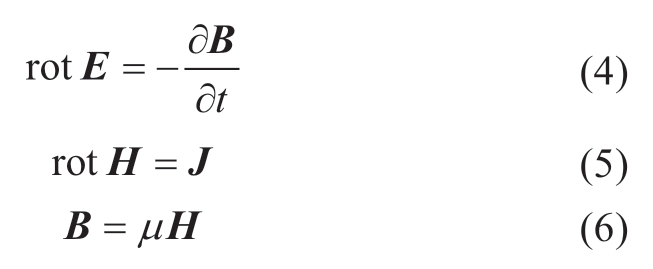
where E is the electric field strength,B is the electromagnetic density,J is the current density,σ is the conductivity,and μ is the magnetic permeability.
As the magnetic flux changes,a rotating current is generated in the conductor,which takes on a vortex shape.The rotating current is given by
The resistance value increases with the number of harmonics owing to the presence of eddy current losses and hysteresis losses in the cable,whereas the flux compression effect produced by eddy currents causes the inductance to decrease with the number of harmonics.In addition,the impedance value of a cable can be influenced by factors such as cable size,cable installation method,and the type of sequence of injected currents.Consequently,different defect types have different impedance characteristics at different harmonic counts,resulting in different magnitudes of harmonic currents for eddy current losses in the cable[21].
Insulation deterioration problems caused by electrical stress during the operation of energized cables generate odd harmonics,whereas those caused by impulse shocks generate even harmonics.The relationship between the deteriorated parts of the cable and harmonics is presented in Table 1[22].When the cable is subjected to external extrusion or air,moisture,ambient temperature,and other factors,aging faults such as bubbles and water trees will appear inside the insulation,and the magnetic flux in the cable will be different from normal;thus,the internal state of the cable can be determined by the eddy currents generated in the cable.
2 XLPE cable insulation defect simulation
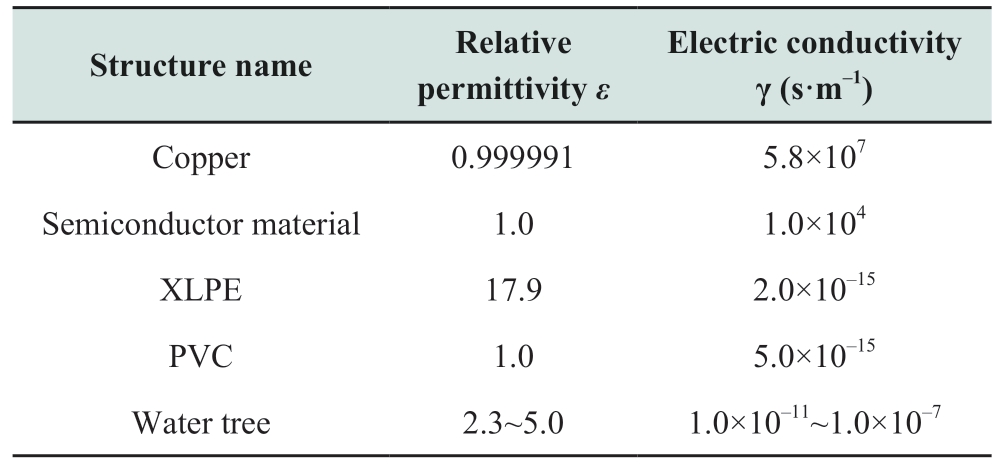
The 10 kV single-core XLPE cable finite element simulation model was built in the Maxwell transient field using ANSYS simulation software with an external excitation circuit.The excitation source was a sinusoidal voltage source with a peak value of 10,000×1.414 V and a voltage source operating frequency of 50 Hz.The structural and material parameters of each layer of the XLPE cables are listed in Tables 2 and 3,respectively.To achieve accurate calculations,the model was solved by manual and automatic dissection of the mesh.Because the excitation source frequency was 50 Hz,the simulation duration could not be too long.The simulation duration was set to 0.05 s and the sampling frequency was 2 kHz.
Table 1 Corresponding relationship between cable stress aging defects and odd and even harmonics

Table 2 Structural parameters of the cable
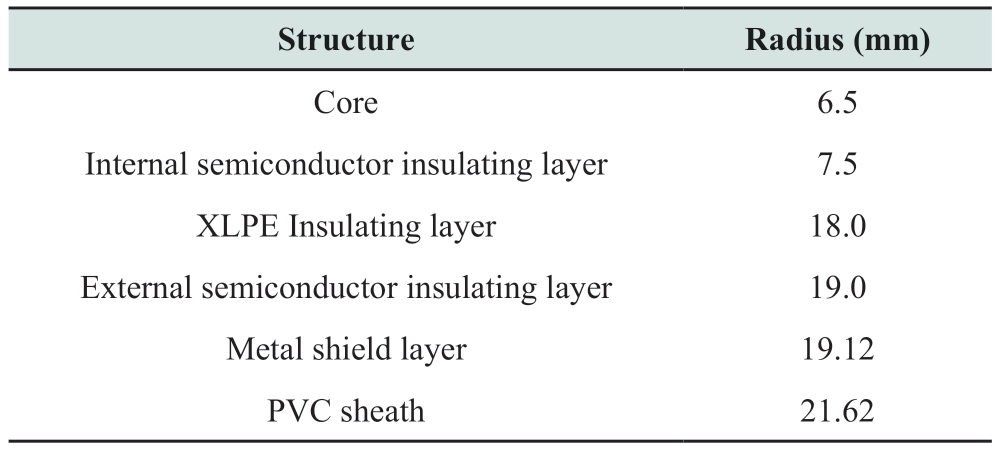
Table 3 Material parameters of each layer of cable
2.1 Simulation of bubble defects
To facilitate the observation of the magnetic field intensity distribution in the XLPE cable insulation layer,an observation line segment was set up in the XLPE cable model in the direction of the bubble radius,as shown in Fig.3,by inserting a bubble with a radius of 1 mm into the XLPE cable electromagnetic simulation.We define x as the distance of the bubble from the cable core and core center point x = 0 mm.Correspondence between the location,size,and number of bubbles and the magnetic field intensity distribution when the cable insulation layer contains bubble defects.
1)Change the position of bubble defects
The relative position of the bubble was changed to the junction of the inner semiconductor insulation and XLPE insulation.We defined d as the lateral distance of the bubble from the inner semiconductor insulation.When the bubble position was 7.5 mm from the inner semiconductor,insulation,d = 0 mm,as shown in Fig.3(a).Variation in magnetic field strength of XLPE cable at different bubble positions is illustrated in Fig.4.

Fig.3 Schematic diagram of bubble defects in the insulating layer of XLPE cable
The magnetic field strength at the junction of the inner semiconductor insulation and XLPE insulation increased steeply(H = 5.92 kA/m)at the relative position of the air bubbles d = 0 mm.The reason for this change is that when the bubble is close to the inner semiconductor insulation of the cable,the magnetic field strength of the inner semiconductor insulation is more strongly affected by the magnetic field change caused by the bubble,and the magnetic field strength distortion is severe.As the bubble moved away from the semiconductor insulation layer of the cable,the magnetic field strength of the inner semiconductor insulation layer was less affected.Local peaks occur because the XLPE insulation is affected by the change in the relative position of the bubbles,which increases the amplitude of the magnetic field strength at the XLPE insulation where the bubbles are located.
As shown in Fig.4,the distance from the bubble to the junction of the inner semiconductor insulation and the XLPE insulation varied gradually from 0 mm to 8 mm.The magnetic field of the cable is influenced by the relative position of the bubble;the closer the bubble is to the inner semiconductor insulation,the more obvious the change in the magnetic field and the greater the local amplitude.When the bubble is far away from the inner semiconductor insulation,the magnetic field strength is less influenced by the position of the bubble and tends to be flat.

Fig.4 Magnetic field intensity with changes in the bubble position
2)Change the radius of bubble defects
The position of the bubble in the XLPE insulation(d =4.0 mm)was fixed and the size of the bubble radius was varied,as shown in Fig 3(b).The larger the radius of a bubble at the same location in the XLPE insulation of a cable,the more obvious the variation in the magnetic field strength of the cable.The relationship between the magnetic field strength distributions of different-sized bubbles at the same location in the cable insulation layer is shown in Fig.5.
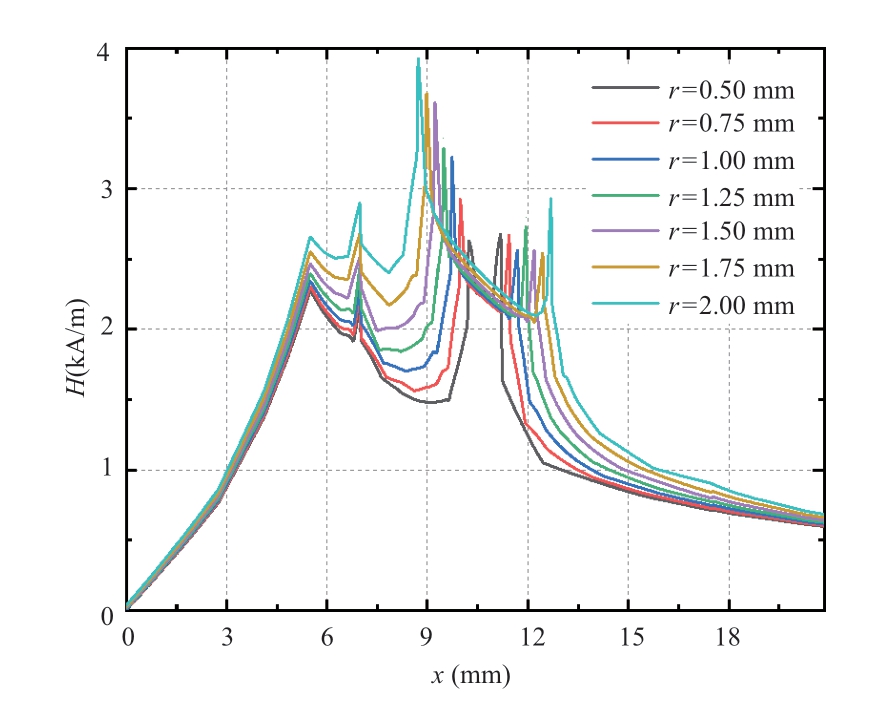
Fig.5 Magnetic field intensity with changes in the bubble radius
3)Change the number of bubble defects
The bubble radius was fixed at 1 mm and the number of bubbles was varied,as shown in Fig.3(c).The first bubble was set at a distance of 9 mm from the core and the radius of the bubble was set to 1 mm.Two and four bubbles of the same size were set in the vicinity of this bubble to compare the magnetic field strength distribution of the XLPE cables with different numbers of bubbles,as shown in Fig.6.
As shown in Fig.6,the distortion of the magnetic field strength increases as the number of bubbles in the XLPE insulation of the cable increases.In the case of a singlebubble defect,the magnetic field strength is less affected because the insulation is slightly damaged.As the number of bubbles increased,the degree of damage to the cable XLPE insulation increased,and the number of magnetic field peaks increased.

Fig.6 Magnetic field intensity with changes in the number of bubbles
The presence of bubble defects in the XLPE insulation of the cable results in a different magnetic flux than normal,which in turn results in a change in the current loss around the central axis of the flux.The current flowing through the cable insulation was distorted by the bubble defects.Fig.7(a)and Fig.7(b)show the trend of the loss current for different bubble sizes and relative positions.
As shown in Fig.7,bubbles at the same position(d =4.0 mm)within the XLPE insulation layer have a greater loss current amplitude and more pronounced loss current fluctuations as the bubble radius increases.For bubbles of the same size(r = 1 mm)within the XLPE insulation layer,the distance between the inner semiconductor insulation and the boundary of the XLPE insulation changes,the greater the loss current amplitude,and the more pronounced the fluctuations as the bubble moves further away from the inner semiconductor layer.
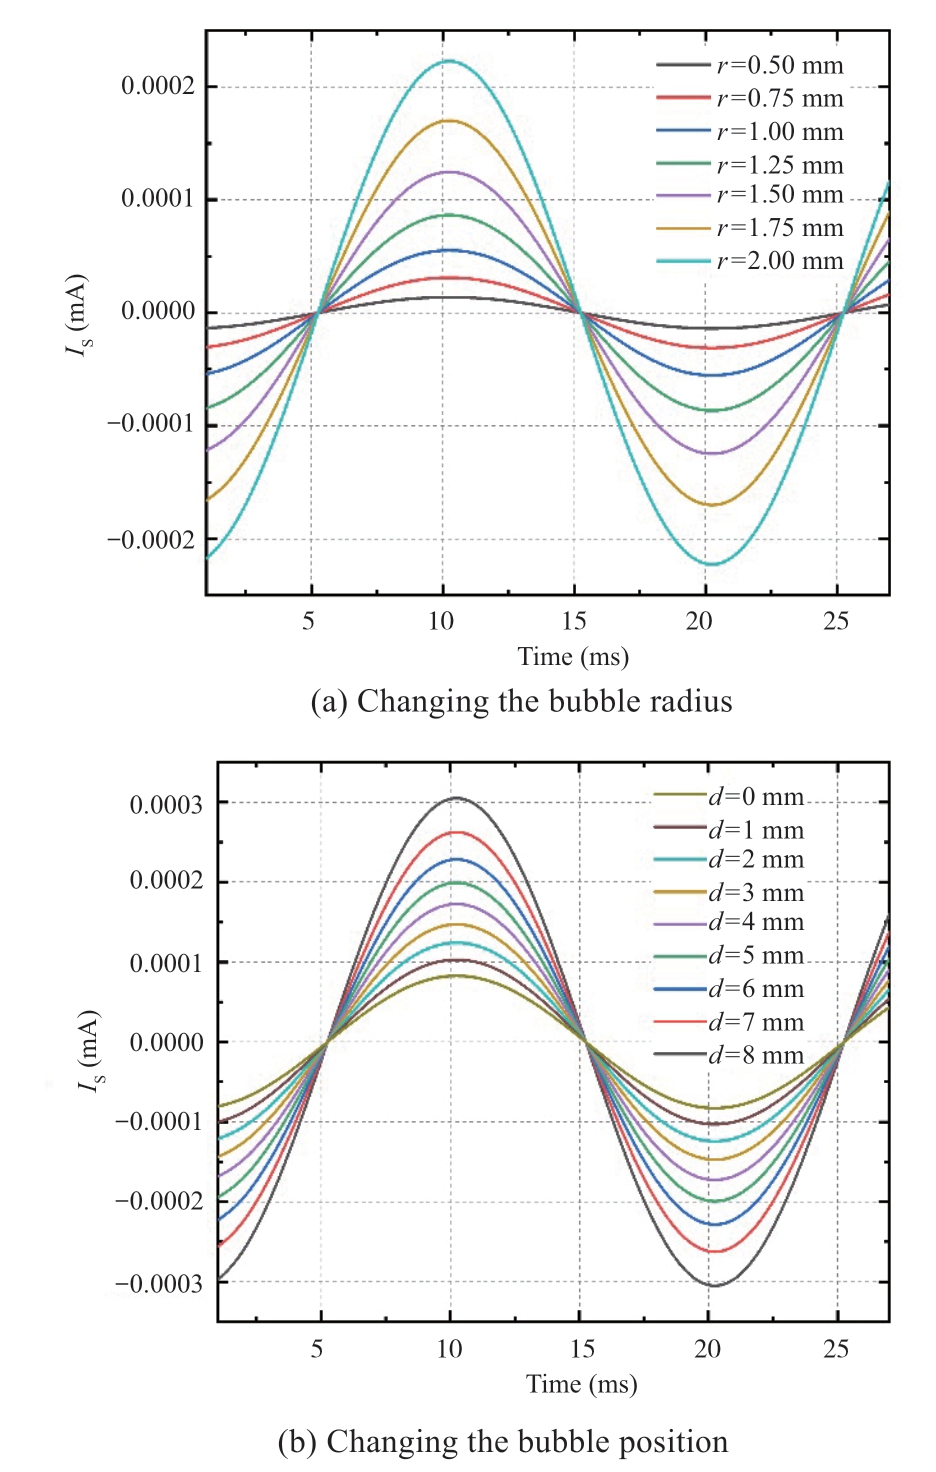
Fig.7 Trend of eddy loss currents as bubbles change
2.2 Simulation of protrusion defects
The protrusion defects are inserted in the cable electromagnetic simulation,r is defined as the longitudinal length of the protrusion,and l is the transverse length of the protrusion defects,as shown in Fig.8.
Correspondence between the size,length,and number of protrusion defects and the magnetic field intensity distribution when the XLPE cable insulation layer contains protrusion defects.
1)Change the size of protrusion defects
The protrusion length was fixed at 2 mm,with the center of the protrusion inside the XLPE insulation(x = 8.0 mm)controlled by changing the size of the XLPE insulation protrusion,as shown in Fig.8(a).The blue protrusion is the initially set protrusion defect,fixing the protrusion length to l = 2 mm and the protrusion size to r = 0.5 mm.Orange protrusion is a protrusion defect with no change in length and only after changing the size.The size of the protrusion increases from 0.5 mm to 1.75 mm with each change of 0.25 mm.The magnetic field intensity distributions for different protrusion sizes are shown in Fig.9.

Fig.8 Schematic diagram of protrusions defects in the insulating layer of XLPE cable
As shown in Fig.9,the magnetic field intensity amplitude at the junction of the inner semiconductor insulation layer and the XLPE insulation(x = 7.5 mm)changes slightly when a protrusion defect appears in the XLPE insulation layer.As the size of the protrusion gradually increases from 0.5 mm to 1.75 mm,the magnetic field intensity at the junction of the inner semiconductor insulation layer and XLPE insulation gradually decreases to a maximum of 1.84 kA/m and a minimum of 1.65 kA/m.It can be seen that the magnetic field intensity of the inner semiconductor insulation layer and the XLPE insulation layer does not vary significantly between different sizes of protrusion defects,and the waveform changes are basically the same.
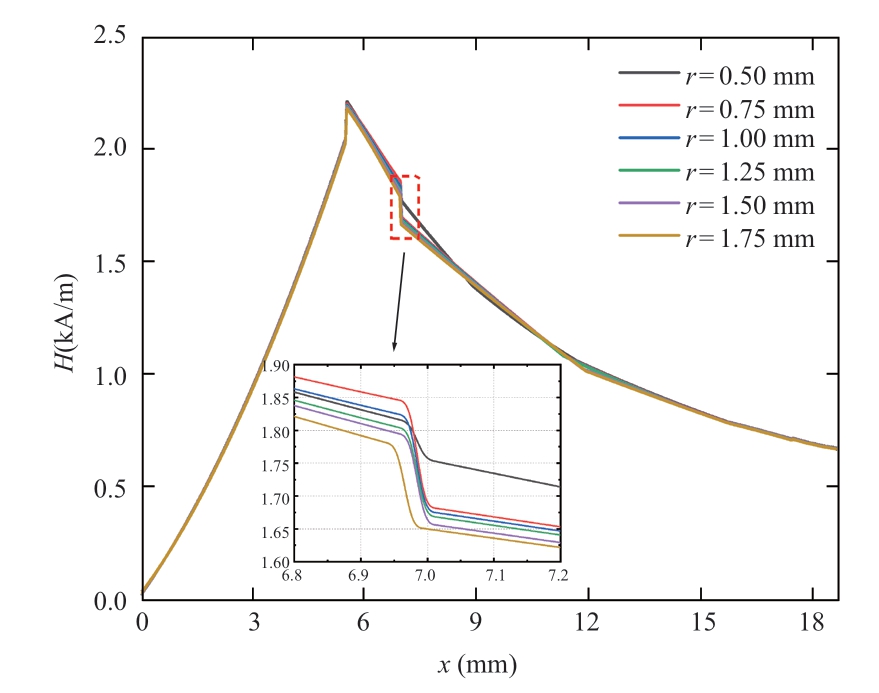
Fig.9 Magnetic field intensity distribution of cable with different protrusion sizes
2)Change the length of protrusion defects
The protrusion size was set to 1.0 mm and the length of the XLPE insulation layer protrusion was changed,as shown in Fig.8(b).The blue protrusion is the initial set protrusion defect,fixing this protrusion size to r = 1.0 mm and the protrusion length to l = 3.0 mm.The orange protrusions were unchanged in size,and only the length of the protrusion defect was changed from 3 mm to 6 mm,with a change of 1.0 mm each time.The magnetic field intensity distributions for different protrusion lengths are shown in Fig.10.
As shown in Fig.10,as the protrusion length gradually increases from 3.0 mm to 6.0 mm,the magnetic field intensity amplitude near the inner semiconductor insulation layer of XLPE cable tends to decrease;however,the magnetic field of the inner semiconductor insulation layer and XLPE insulation layer is less affected by the protrusion length,and the magnetic field intensity changes less.
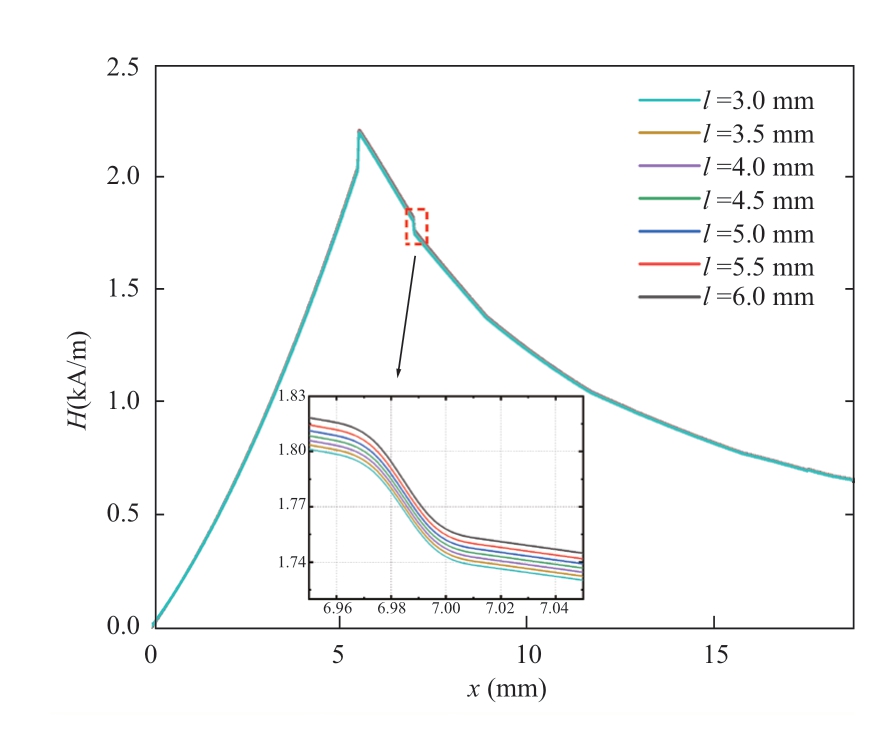
Fig.10 Magnetic field intensity distribution of cable with different protrusions lengths
3)Change the number of protrusion defects
Set the center of the first protrusion in the XLPE insulation layer of the cable to x = 8.0 mm,fix the protrusion size(longitudinal radius)r = 1.25 mm and the protrusion length l = 4.5 mm,and change the number of protrusions in the XLPE insulation layer,as shown in Fig.8(c).Two and four protrusion defects of the same size and length were set near this bubble to compare the magnetic field intensity distribution with different numbers of protrusions,as shown in Fig.11.
As can be seen from Fig.11,when the number of protrusions is small,the damage to the inner semiconductor insulation and XLPE insulation is weak;therefore,their magnetic field strength is less affected.The magnetic field strength H= 2.19 kA/m at the semiconductor insulation layer(x = 5.49 mm)and H = 1.74 kA/m at the XLPE insulation layer(x = 7.6 mm)inside the XLPE cable when the XLPE insulation layer contains one protrusion defect.When the number of bubbles gradually increased,the damage to the semiconductor insulation layer and XLPE insulation layer inside the XLPE cable deepened,and the fluctuation in the magnetic field distribution of the cable became obvious.The magnetic field strength H = 2.25 kA/m for the semiconductor insulation(x = 5.49 mm)and H =1.81 kA/m for the XLPE insulation(x = 7.6 mm)inside the XLPE cable when the XLPE insulation contains five protruding defects.
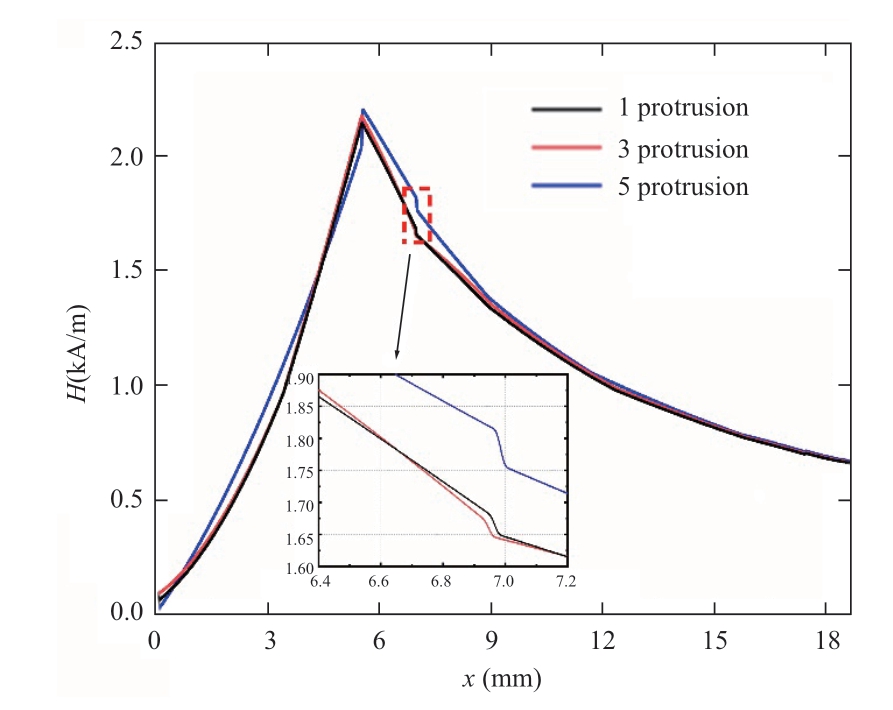
Fig.11 Magnetic field intensity distribution of cable with the change of the number of protrusions
The presence of a protrusion defect in the XLPE insulation results in a different magnetic flux in the cable compared to the normal,which in turn leads to a change in the loss current around the central axis of the flux.The loss current flowing through the cable insulation layer is distorted by the protrusion defect.Fig.12(a)and Fig.12(b)show the trend of eddy loss current for different protrusion sizes and lengths,respectively.

Fig.12 Trend of eddy loss currents as the protrusion state changes
2.3 Simulation of water tree defects
The growth process of a water tree can be divided into three stages:the initial,development,and subsequent stages.In practical application scenarios,an ideal dielectric does not exist and is subject to an electric field that consumes energy,including conductivity losses caused by the conductivity and energy loss of the dielectric,as shown in Fig.13.
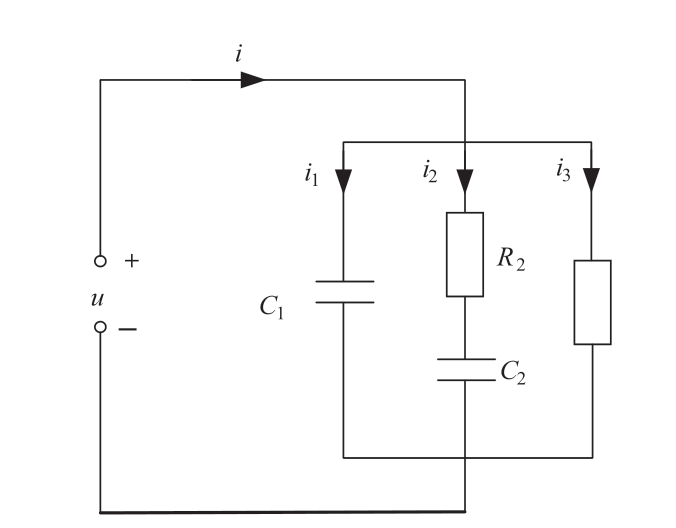
Fig.13 Dielectric equivalent circuit diagram
The pure capacitive current i1 reaches its peak within a short charging period of time at the moment the AC voltage is applied and decays rapidly to 0.The absorption current i2 characterizes the lossy polarization process of the dielectric and decreases slowly with increasing pressurization time,whereas the conductive current i3 can be present for a long time.The absorption current i2 can also be decomposed into active and reactive components.A vector diagram of the dielectric at AC voltage is shown in Fig.14.

Fig.14 Vector diagram of a dielectric at AC voltage
Considering the nonlinear nature of the water branch,the cable model was equated to the circuit shown in Fig.15.

Fig.15 Equivalent circuit diagram for water tree defects
In Fig.15,the water-tree-deteriorated cable is divided into two parts:the normal cable area and the water-treeeroded area.The normal cable area is represented by a capacitor,and the continuously deteriorating water tree is equated to variable resistance.According to the cable water tree equivalent circuit diagram,it can be seen that the nonlinear relationship between current and voltage flowing through the water tree region can be expressed as Equation(9)
where RNL is the water tree resistance,GNL is the water tree conductance,VR is the voltage on both sides of the water tree and k is a constant.
The loss current affected by the water tree defect is still periodic and,after FFT level decomposition,can be seen as a superposition of the fundamental current and each harmonic,which can be expressed as
The relationship between cable conductance and voltage for the water-tree-eroded portion of the cable was deduced from the experimentally obtained data relating the insulation resistance of the water-tree-aged cable to the applied voltage.The relevant data are listed in Table 4.
Table 4 Volt-ampere relationships for cables containing water tree defects

The data are fitted into the following equation
According to calculations based on the cable structure,the linear conductance GL value is 0.34×10⁻¹¹ S and the value of the capacitance Cx on the aging side of the water tree is 50 pF.The resistance value of the water tree is related to the length of the water tree growth and the area it occupies:
where ρx is the resistivity of the water tree branch,taken as ρx = 110 Ω/m,L is the length of the water tree branch growth,and S is the area of insulation occupied by the water tree.
As the deterioration of the water tree deepens and the insulation resistance changes,both the loss current and the harmonic component of the water tree increase,and the nonlinear characteristics of the water tree change.
When a voltag![]() is applied,the resulting loss current is
is applied,the resulting loss current is
Considering that the harmonic component of the loss current is caused by water tree defects,theoretically,the cable insulation intact area will not have an impact on the harmonic content of the loss current.The control water tree accounts for 1/3,1/2,and 7/10 of the XLPE insulation layer,and the harmonic content values of the loss current obtained for each number of times are shown in Fig.16.
Fig.16 shows the percentage of loss current harmonic components of water trees in the XLPE insulation of cables with different growth lengths.Three cases of 1/3,1/2,and 7/10 water trees in the XLPE insulation layer were selected to illustrate the overall trend.As the development of the water tree deepened,the area occupied by the insulation layer and the content of each harmonic increased.The proportion of harmonics in the loss current of water tree branches with different degrees of development was higher for the 2nd and 3rd harmonics.
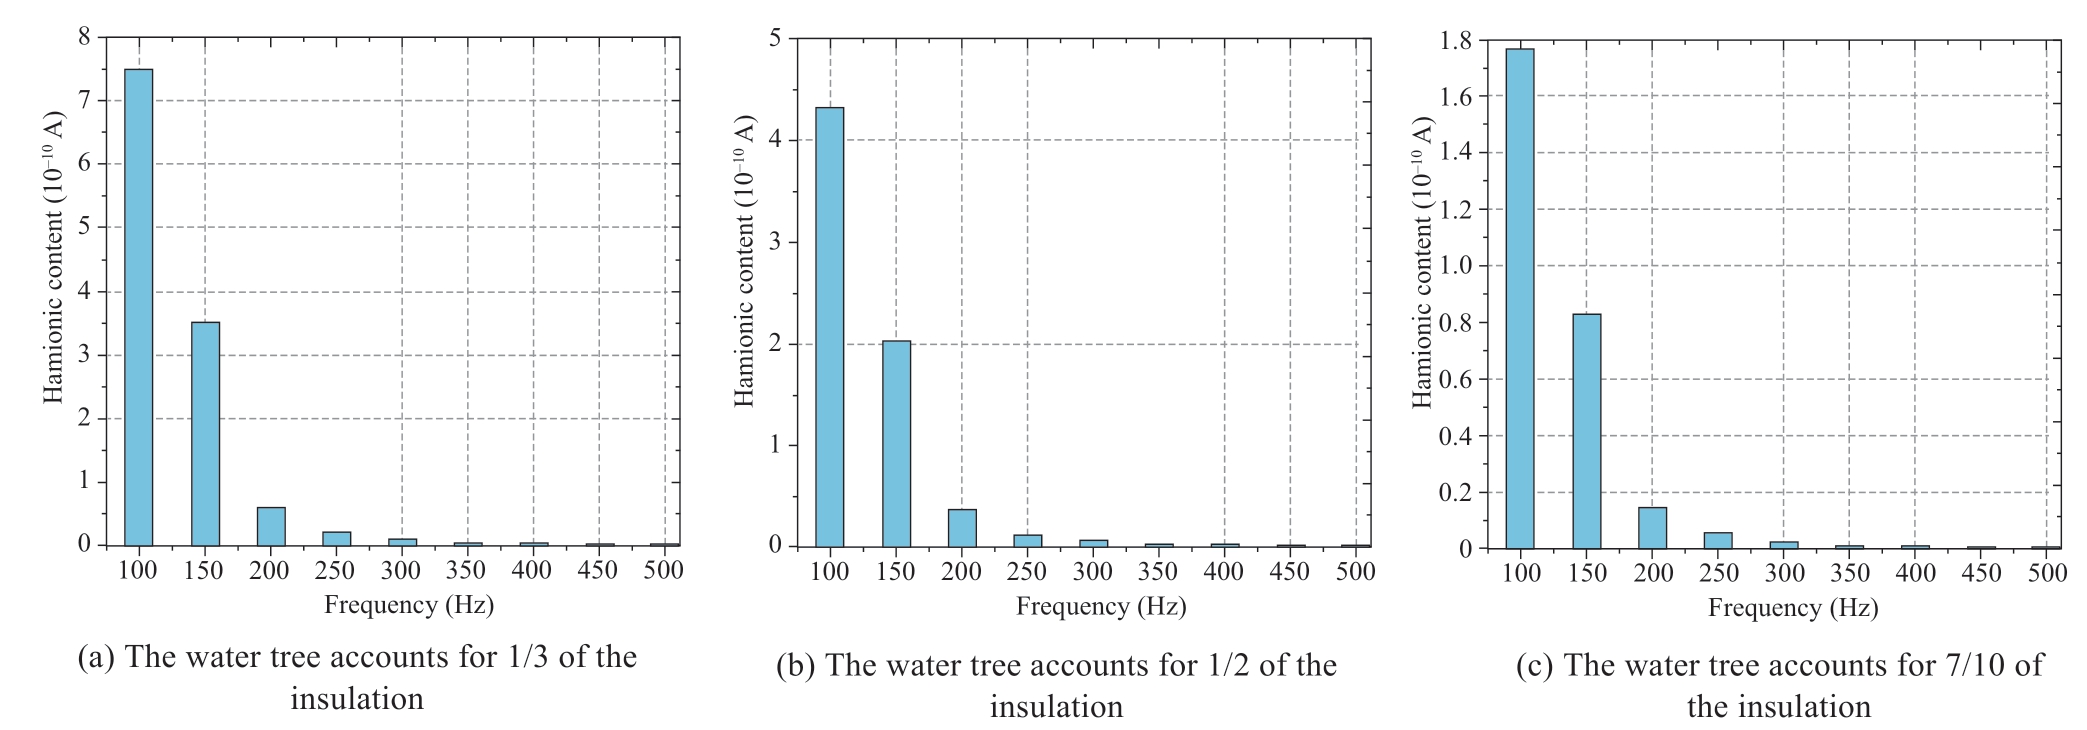
Fig.16 Harmonic components of loss current in different development stages of water tree
2.4 Build a database of cable insulation defects
The loss current in the cable insulation layer was collected,and FFT analysis was performed when the bubble,protrusion,and water tree defects were observed in the cable insulation layer.The defects were set as follows.
Bubble defects:change the relative position,size,and number of bubbles in the insulation layer.
Protrusion defects:change the size,length,and number of protrusions.
Water tree defect:Change the length of the water tree in the insulation layer.
As the position of the bubbles changes,the content of the harmonics changes.The 2nd,3rd,4th,5th,and 6th harmonics increase as the bubble moves away from the inner semiconductive layer,whereas the 7th,8th,9th,and 10th harmonics increase in the opposite direction.As the radius of the bubble changed,the content of each harmonic also changed.The 2nd,3rd,4th,and 5th harmonics decrease as the radius of the bubble increased,while the 6th,7th,8th,9th,and 10th harmonics decreased in the opposite direction.
The harmonic content of the 2nd,3rd,4th,and 5th harmonics decreases with increasing protrusion size,whereas the opposite is true for the 6th,7th,and 9th harmonics.As the length of the bulge changes,the content of each harmonic changes.The 2nd,3rd,4th,5th,9th,and 10th harmonics increase with the length of the protrusion,while the 6th and 7th harmonics increased in the opposite direction.
As the water tree grows,the 2nd and 3rd harmonics become higher,and the content of all harmonics increases.
Based on ANSYS simulation software to build the cable insulation bubble,protrusion,and water tree defect models,we obtained the loss current under different defects of XLPE cables and performed FFT decomposition to obtain the 2nd to 10th loss current harmonics.We used the total harmonic distortion(THD)of the loss current harmonics and the 2nd to 10th loss current harmonics with a total of 10 characteristic quantities as the basic attributes to distinguish between different cable insulation defects.The THD of the current is defined as the percentage of the ratio of the root mean square value of the total harmonic content to the root mean square(RMS)value of the fundamental component,expressed as

where Iharm is the RMS value of the total harmonic current;I1 is the RMS value of the fundamental current;and Ik(k = 2,3,4,...,10)is the RMS value of the k-th harmonic current.
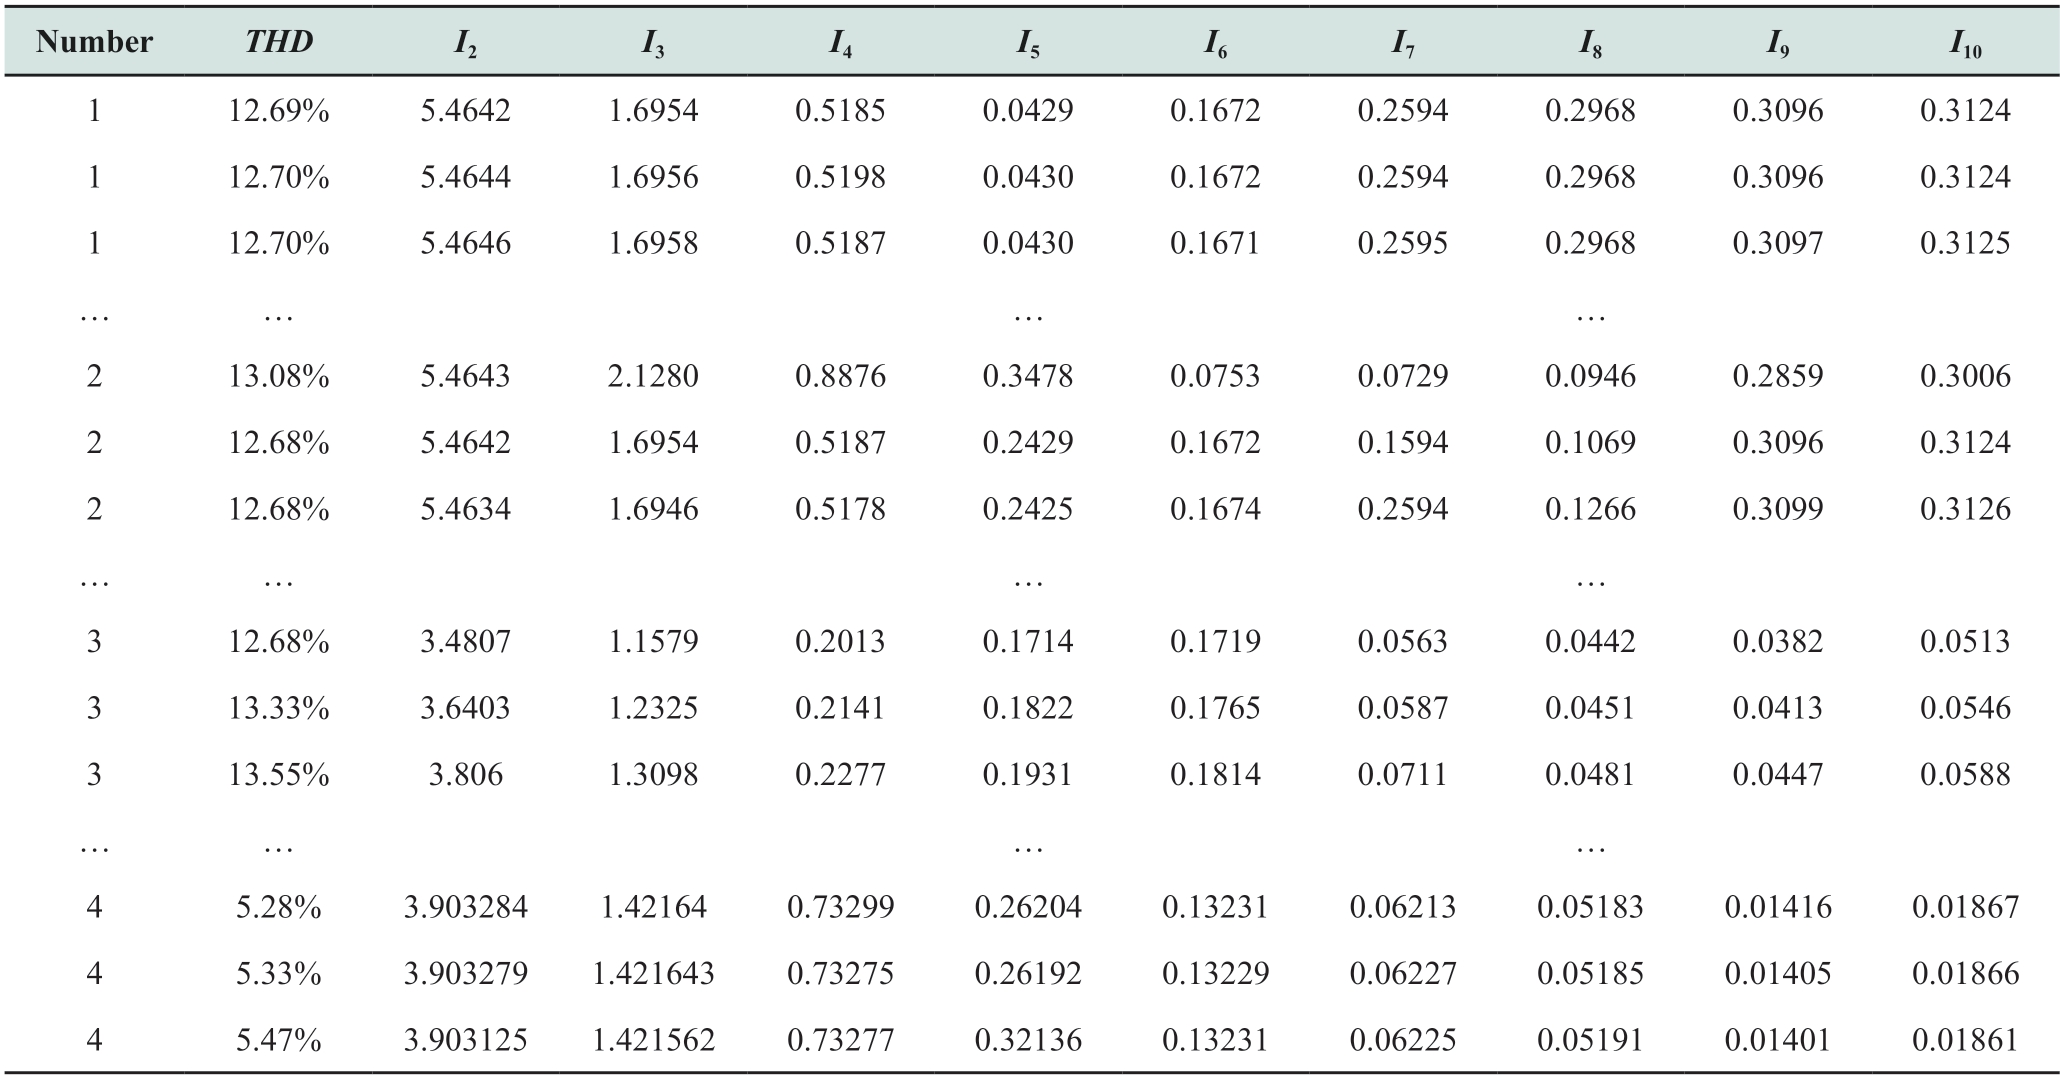
The sample data from the cable insulation defect database are listed in Table 5.Number 1 indicates bubble defects,number 2 indicates protruding defects,number 3 indicates water tree defects,and number 4 indicates no defects.The database contains 360 sets of data,including 120 sets with no defects and 80 sets with bubbles,protrusions,and water tree defects each.
Table 5 Partial sample of cable insulation defect database
3 Identification of cable insulation defects based on LSTM
LSTM is a special type of recurrent neural network(RNN)proposed by Hochreiter and Schmidhuber;it is a modification of the RNN model.LSTM can establish longer-distance temporal dependencies and effectively solve RNN gradient explosion and gradient disappearanceproblems,with the ability to learn long-term dependencies,instead of being acquired by learning or training[23].LSTM has been widely used in many fields and has been continuously improved and promoted[24-26].
The relevant calculation is as follows:
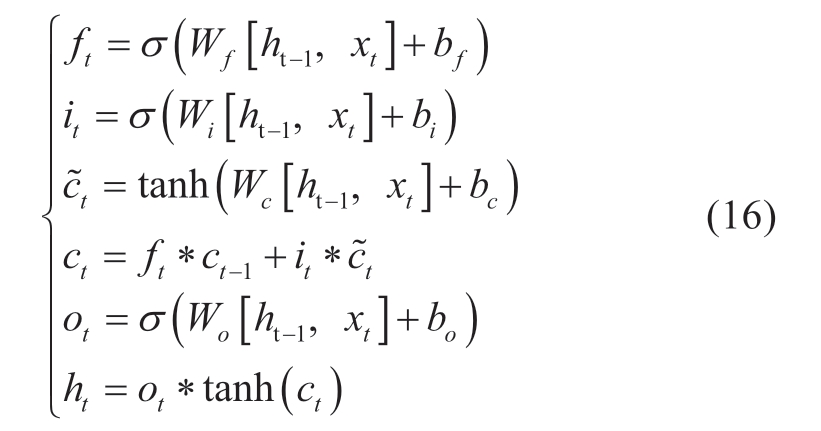
where xt is the input value,ht is the hidden layer state,and ct indicates memory cells.Wf,Wi,Wc,and Wo are the corresponding weights for each gate in each cell,and bf,bi,bc,and bo are the corresponding biases.
The cable insulation defect diagnosis network based on LSTM includes the input,LSTM,fully connected,and Softmax layers.The three gate structures,the forgetting gate,input gate,and output gate,form the basic unit of the LSTM,which is shown in Fig.17.The framework for the diagnosis of cable insulation defects based on the LSTM is shown in Fig.18.
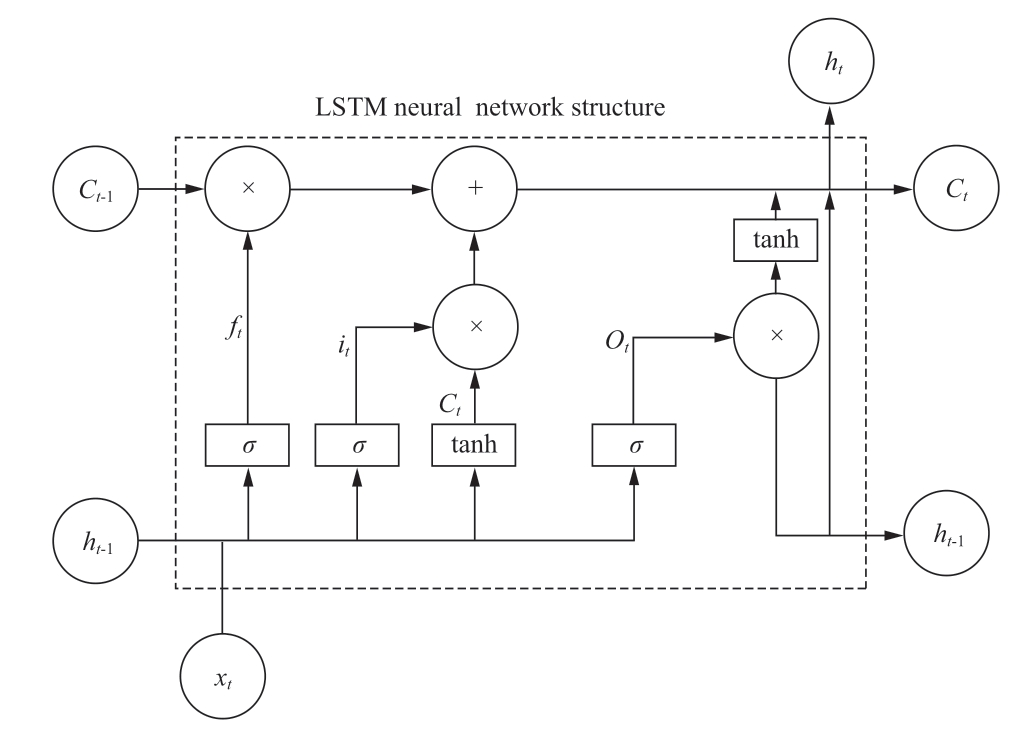
Fig.17 Basic unit structure of LSTM
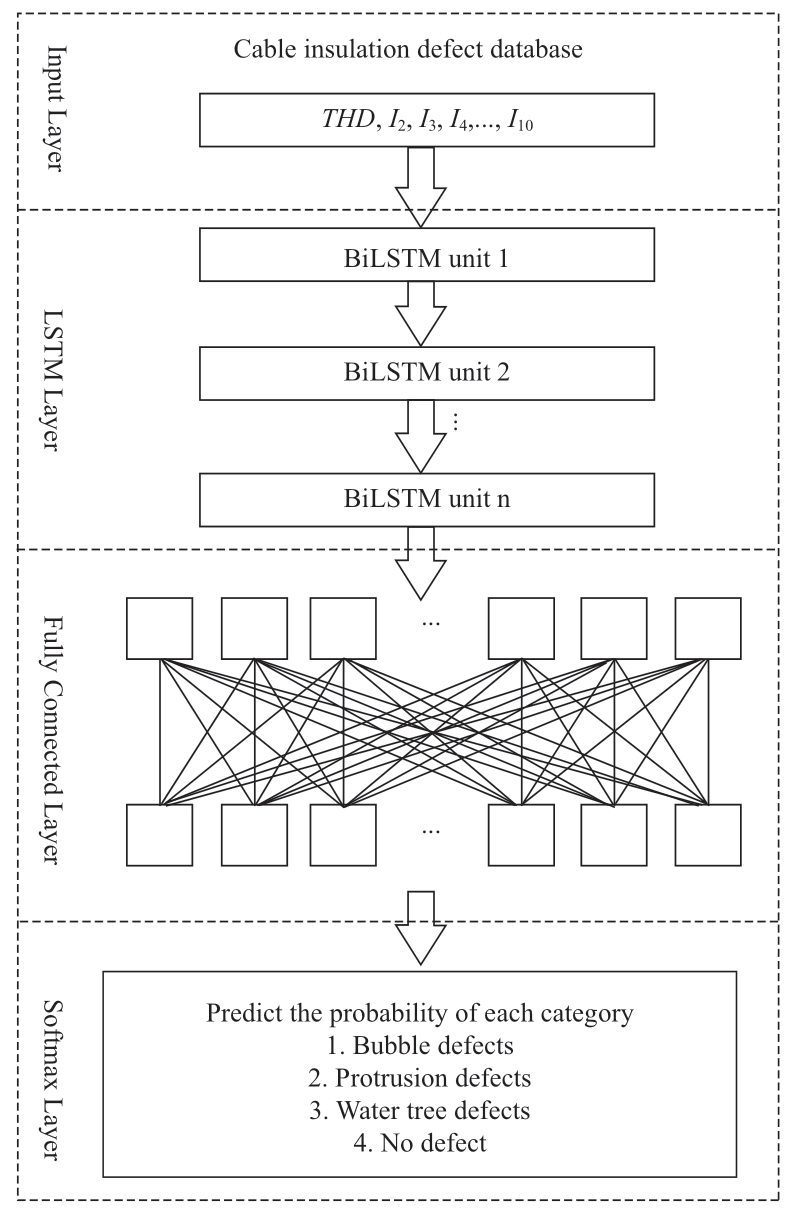
Fig.18 LSTM model diagnostic framework diagram
The flow chart of the cable insulation defect diagnosis based on LSTM is shown in Fig.19.
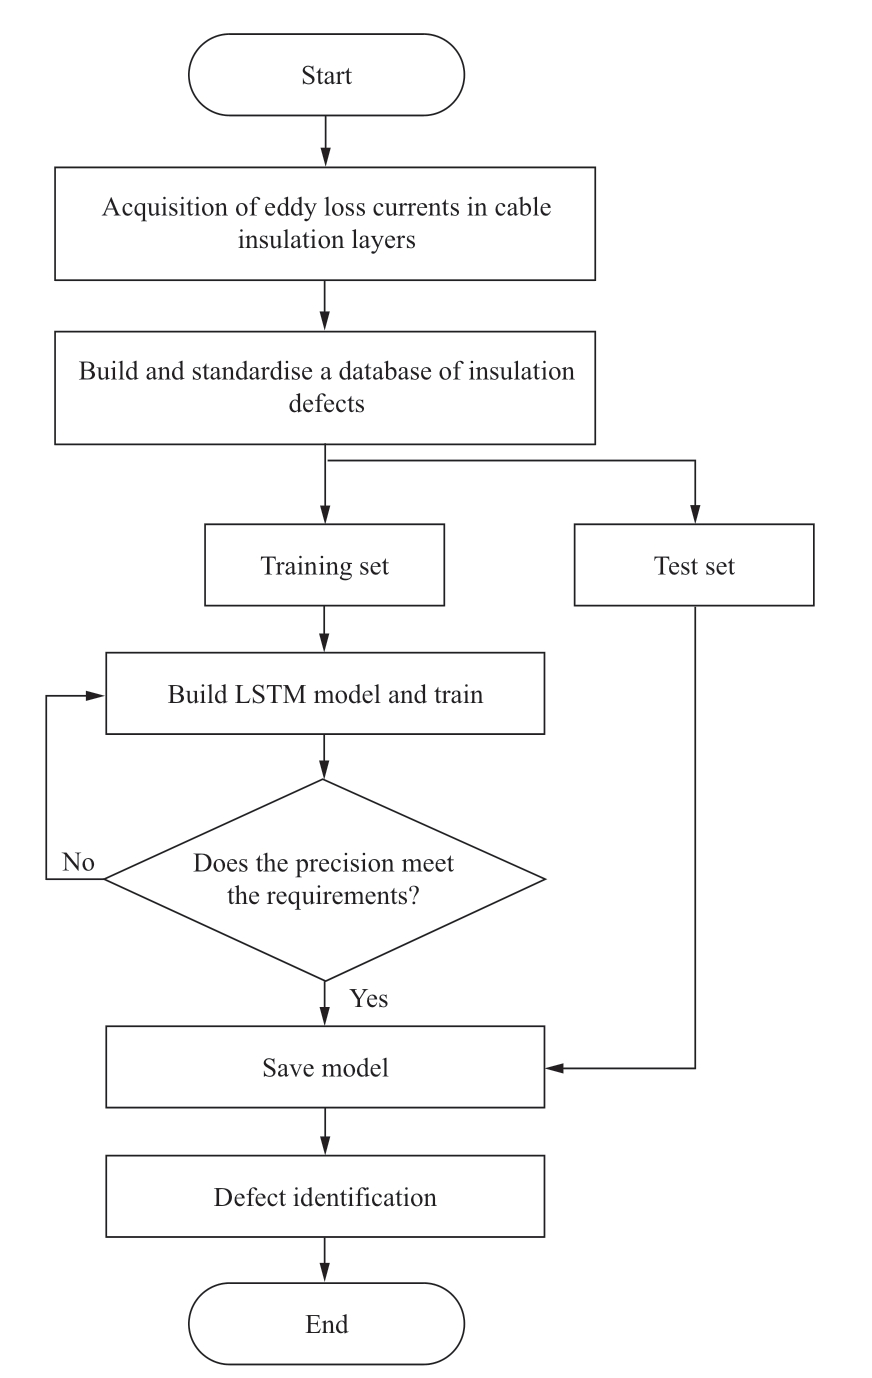
Fig.19 Flow chart of cable insulation defect identification based on LSTM
The specific identification process is divided into the following stages:
1)Data acquisition stage.
In this study,the ANSYS software was used to simulate the cable insulation layer containing bubbles,protrusions,water tree defects,and a cable model without defects in order to obtain the eddy loss currents of the cable insulation layer with different defect types.
2)Data pre-processing stage.
A database of cable insulation defects containing 2nd to 10th harmonic currents and THD was constructed and normalized.The processed database was divided 3:1 into a test set and training set according to the cross-validation method.
3)Model train stage.
The LSTM model was trained using the training set and saved when the model training accuracy reached 92%.
4)Model application stage.
The test set was input into the training-saved model for cable insulation defect diagnosis identification.
LSTM was set to have 100 implicit units with four output nodes,the learning rate was set to 0.001,the maximum number of training rounds was 500,and the GPU was selected as the execution environment of the network.The training accuracy and loss values of the LSTM algorithm are shown in Fig.20.The classification and recognition results of the LSTM algorithm are shown in Fig.21.

Fig.20 Accuracy and loss values the of LSTM algorithm
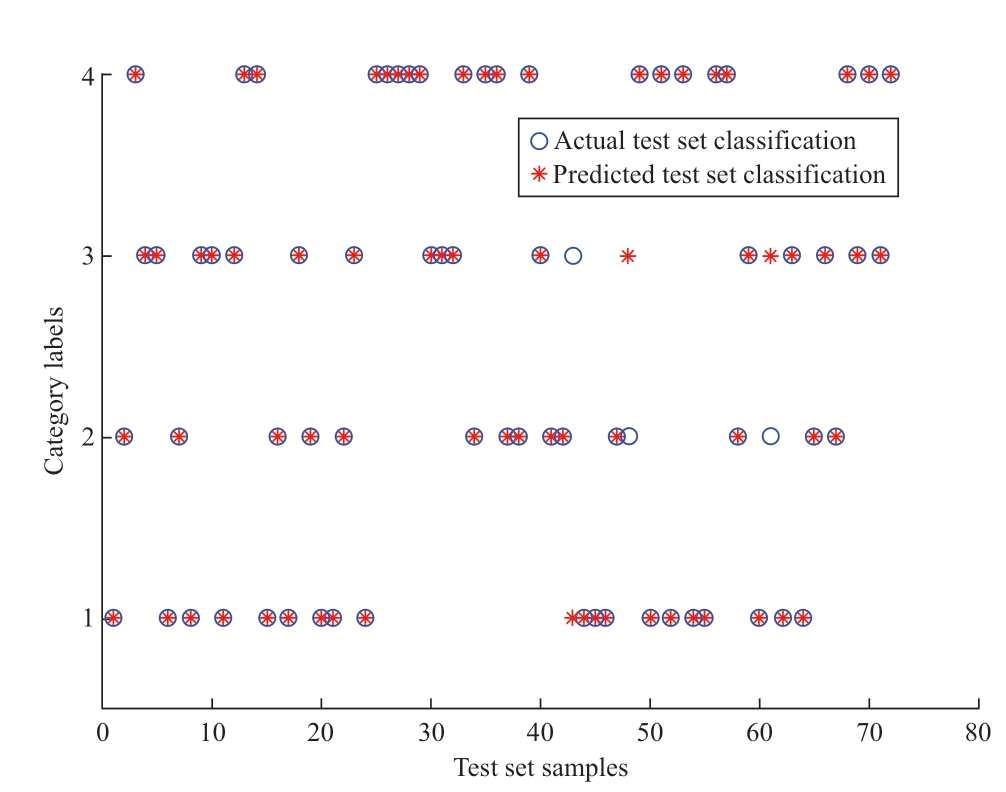
Fig.21 Flow chart of cable insulation defect identification based on LSTM
A comparison of the diagnosis results of decision tree(DT),k-nearest neighbor(KNN),and support vector machine(SVM)algorithms is shown in Table 6.
Table 6 Accuracy comparison of different algorithms
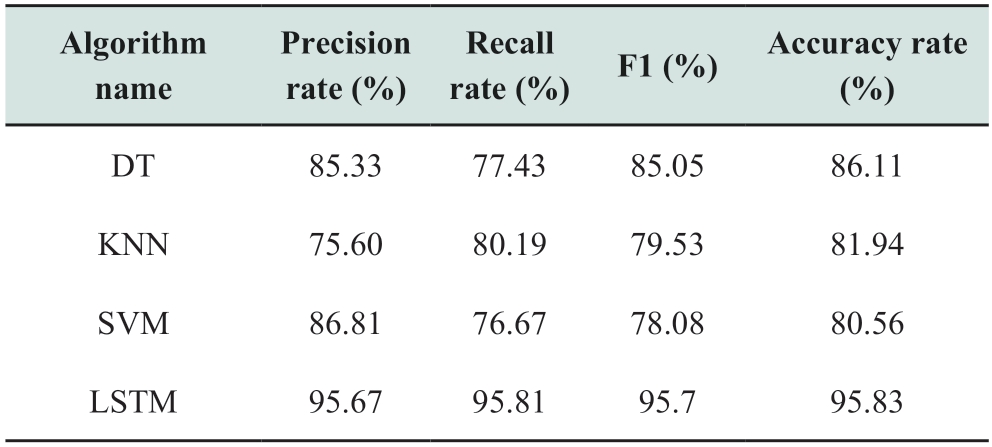
As can be seen from Table 6,the accuracy rate using the LSTM algorithm is as high as 95.83%,and it performs better in terms of four evaluation indices such as precision,recall,F1 value,and accuracy,with higher defect recognition capability.
4 Conclusion
Currently,power-related departments lack fast and effective methods for detecting cable insulation defects.This paper proposes a deep learning-based method to identify XLPE cable insulation defects,introduces the principle of the harmonic method to detect cable insulation defects,and simulates the cable insulation layer containing bubbles,protrusions,and water tree defects.In addition,it analyzes the influence of various types of defects on the magnetic field strength and eddy loss current of the cable insulation layer,constructs 10 characteristic quantities of THD and 2nd to 10th harmonic currents,and establishes a cable insulation defect database.Finally,the deep learning algorithm LSTM is used to accurately identify the types of cable insulation defects,and the accuracy rate reaches 95.83%,which can realize the fast and accurate detection of cable insulation defects.
Acknowledgments
This work was supported by the technology project of the State Grid Shanxi Electric Power Company.The name of the project is “Research and Application of Cable electrification diagnosis Technology based on Harmonic method”(5205C02000GL).
Declaration of Competing Interest
We declare that we have no conflict of interest.
References
[1]Chen C,Cheng C H,X Wang,et al.(2022)Space charge characteristics for XLPE coaxial cable insulation under electrothermal accelerated aging.IEEE Transactions on Dielectrics and Electrical Insulation,29(2):727-736
[2]Wang M H,Lu S D,Liao R M(2022)Fault diagnosis for power cables based on convolutional neural network with chaotic system and discrete wavelet transform.IEEE Transactions on Power Delivery,37(1):582-90
[3]Zhang Z P,Wu Y,Fu C,et al.(2022)Effects of pre-crosslinking on space charge and breakdown characteristics of XLPE cable insulation.Energies,15(7)
[4]Su J G,Du B X,Li J,et al.(2020)Electrical tree degradation in high-voltage cable insulation:progress and challenges.High Voltage,5(4):353-364
[5]Choudhary M,Shafiq M,Kiitam I,et al.(2022)A review of aging models for electrical insulation in power cables.Energies,15(9)
[6]Pamuk N(2014)Analysis of the insulation deterioration of high voltage cross-linked polyethylene power cables(XLPE)under switching impulses stress.Journal of Optoelectronics and Advanced Materials,16(11-12):1392-1399
[7]Zhang Y Y,Li S T,Gao J,et al.(2020)Ageing assessment of XLPE cable Insulation by residual antioxidant content.IEEE Transactions on Dielectrics and Electrical Insulation,27(6):1795-1802
[8]Boukezzi L,Rondot S,Jbara O,et al.(2022)Effect of isothermal conditions on the charge trapping/detrapping parameters in e-beam irradiated thermally aged XLPE insulation in SEM.Materials,15(5)
[9]Wang S H,Chen P X,Li J Y,et al.(2016)Difference of dielectric properties between AC and DC XLPE cable used insulation materials.Paper presented at the International Conference on Condition Monitoring and Diagnosis(CMD)
[10]Al-Hamid M,Leone M,Schulze S,et al.(2015)A novel characterization method for cable ferrites using a TEMwaveguide test setup.Paper presented at the Joint IEEE International Symposium on Electromagnetic Compatibility(EMC)and EMC Europe,Dresden,Germany
[11]Ding M,He W F,Wang J H,et al.(2022)Performance evaluation of cross-linked polyethylene insulation of operating 110 kV power cables.Polymers,14(11)
[12]Zhu K,Pong P W T(2020)Fault classification of power distribution cables by detecting decaying DC components with magnetic sensing.IEEE Transactions on Instrumentation and Measurement,69(5):2016-2027
[13]Wang Y,Wen X S,Peng N Y,et al.(2003)Study on the grounding in superposing DC current method for the on-line monitoring of XLPE cable.High Voltage Engineering,(07):34-36+51
[14]Asipuela A,Mustafa E,Afia R S A,et al.(2018)Electrical condition monitoring of low voltage nuclear power plant cables:tanδ and capacitance.Paper presented at the 2018 International Conference on Power Generation Systems and Renewable Energy Technologies(PGSRET)
[15]Zhu G,Zhou K,Lu L,et al.(2021)Online monitoring of power cables tangent delta based on low-frequency signal injection method.IEEE Transactions on Instrumentation and Measurement,70:1-8
[16]Pang B,Zhu B,Wei X L,et al.(2016)On-line monitoring method for long distance power cable insulation.IEEE Transactions on Dielectrics and Electrical Insulation,23(1):70-76
[17]Ranachowski Z,Wieczorek K,Ranachowski P,et al.(2022)Monitoring of partial discharges in cable insulation and cable head using acoustic method.Archives of Acoustics,47(2):259-265
[18]Bertini G J,Chy H(2021)Rejuvenation addresses partial discharge in power cables.IEEE Transactions on Dielectrics and Electrical Insulation,28(2):688-696
[19]Hu X,Reid A J,Corr E,et al.(2020)Practical aspects of partial discharge measurement for HVDC cables.Journal of Physics D-Applied Physics,53(29)
[20]Zhao W J,Siew W H,Given M J,et al.(2017)Assessment of HDPE aged under DC voltage combined with AC harmonic stresses of various frequencies.IEEE Transactions on Dielectrics and Electrical Insulation,24(2):1189-1196
[21]Wan Q,Jin X,Yuan X,et al.(2022)Cable insulation defect diagnosis based on harmonic characteristic label.Paper presented at the 2022 IEEE 5th International Electrical and Energy Conference(CIEEC)
[22]Chen C,Hu Y L,Zhao S,et al.(2018)Study on health diagnosis of crosslinked polyethylene cable based on HDS.Journal of Jiamusi University,36(5):773-776
[23]Deng Y,Hao L,Tianshu B,et al.(2022)GCN-LSTM spatiotemporal-network-based method for post-disturbance frequency prediction of power systems.Global Energy Interconnection,5(01):96-107
[24]Fischer T,Krauss C(2018)Deep learning with long short-term memory networks for financial market predictions.European Journal of Operational Research,270(2):654-669.
[25]Liu J,Shahroudy A,Xu D,et al.(2016)Spatio-temporal LSTM with trust gates for 3D human action recognition.Paper presented at the 14th European Conference on Computer Vision(ECCV)
[26]Ordonez F J,Roggen D(2016)Deep convolutional and LSTM recurrent neural networks for multimodal wearable activity recognition.Sensors,16(1)
Received:14 October 2022/Accepted:28 November 2022/Published:25 Feburary 2023
 Xuyang Yan
yanxyncut@163.com
Xiaozhong Zhu
511597555 @qq.com
Xuejun Jin
625697058 @qq.com
Tao Zhou
hq050176@163.com
Haifei Yang
594040998 @qq.om
Qingzhu Wan
wanqz@ncut.edu.cn
2096-5117/© 2023 Global Energy Interconnection Development and Cooperation Organization.Production and hosting by Elsevier B.V.on behalf of KeAi Communications Co.,Ltd.This is an open access article under the CC BY-NC-ND license(http://creativecommons.org/licenses/by-nc-nd/4.0/).
Biographies

Tao Zhou ,senior engineer,is currently working in State Grid Shanxi Electric Power Company.His research interests are mainly in substation equipment operation and maintenance management,distribution equipment operation and maintenance management.

Xiaozhong Zhu, senior engineer,is currently working in State Grid Shanxi Electric Power Company.His research interests are mainly in power systems and fault diagnosis.

Haifei Yang, senior engineer,is currently working in State Grid Shanxi Electric Power Company.His research interests are mainly in power systems and fault diagnosis.

Xuyang Yan is a graduate student at North China University of Technology.His research interests include cable fault diagnosis,and big data analysis.

Xuejun Jin is a graduate student at North China University of Technology.Her research interests include cable fault diagnosis and smart grid.

Qingzhu Wan received Ph.D.degree at Tsinghua University.His research interests include cable fault diagnosis,big data analysis,and smart grids.
(Editor Yanbo Wang)
