0 Introduction
Anthropogenic heat emission is one of the most important energy sources of the urban underlying surface [1].Studies have shown that in large cities with concentrated population, such as London [2], Tokyo [3], Toulouse [4],Beijing [5-7], Shanghai [8], Hangzhou [9], Nanjing [10],Guangzhou [11], and several other cities, have significant anthropogenic heat.With the growth of population,industry, and economy, the anthropogenic heat emissions have increased annually.Anthropogenic heat flux from human emissions can reach approximately 70 W·m-2 [12].At the peak of human activity, anthropogenic heat flux canreach up to 100 W·m-2 [13].
According to source, anthropogenic heat emission can be divided into industrial discharge sources, transportation emissions sources, and resident emissions sources [13-14].Early studies directly added anthropogenic heat emission items to the surface energy balance equation of numerical models [15-18].Masson et al.(2000) introduced the process of heat exchange between buildings and the atmosphere into the town energy budget (TEB) model [19].The TEB model assumes that the building is a closed structure, and the temperature inside the building walls is fixed.The heat conduction between the building wall and atmosphere can be exchanged through thermal conductivity.This overly simple calculation process ignores electrical systems, such as air conditioning inside the building; changes in energy,such as those due to variation in human activities ; and the effect of shortwave solar radiation inside and outside the window on heat changes.This calculation scheme is likely to overestimate the cooling effect of the building on the atmosphere while underestimating its heating effect on the same.
In buildings within urban areas, the human emissions from residents have the greatest influence, which mainly include air-conditioning systems, home appliances facilities, and indoor activities in the building.However,this part of the energy exchange is more complicated.To better simulate the influence of heat inside and outside a city building on the atmospheric movement, Kikegawa [20]developed the building energy model (BEM) that calculates the energy inside and outside the building,and confirmed the significant impact of this process on the urban microclimate.Salamanca [21]introduced the building energy model BEM (Multilayer Urban Model and Building Energy Model (BEP+BEM) based on the BEP multilayer urban canopy parameterization scheme [22].When this solution is coupled with a medium-scale model,the simulation effect of the model on the city’s atmospheric temperature environment is improved [23]and a stronger urban heat island effect is produced [24].Zheng [25,26]discussed the interaction between the anthropogenic heat emissions and meteorological environment of the building refrigeration and electricity systems and improved the BEM.The study was conducted in Beijing, and the results showed that anthropogenic heat emission of dynamic simulation buildings in the medium-scale model can improve the simulation effect of the meteorological elements of Chinese cities.From this scheme, BEP+BEM can be quantitatively evaluated through human indoor activities.The waste heat discharge of air conditioners on indoor and outdoor exchange forms the basis of an in-depth and detailed discussion of the impact of human activity on atmospheric temperatures.However, current research in this aspect has seldom been conducted in Chinese cities.
Based on the above background, this study chose Jiangsu Province to conduct a numerical study of the impact of indoor and outdoor energy exchange on high-temperature processes.Jiangsu Province is hot in summer, and airconditioning is generally used for cooling in the cites.The study was conducted from July 21 to 27, 2017.The hightemperature weather was considered as the background weather, and the Weather Research and Forecasting (WRF)model with BEP and BEM urban canopy parameterization schemes was used to address the following issues: (1) Does the WRF/BEP/BEM scheme better simulate the hightemperature characteristic in the near-ground temperature?(2) How does the use of air conditioning power systems affect the urban atmospheric temperature in summer? (3) What is the quantitative impact of indoor target temperature on the external atmospheric temperature? It is expected that this study will be helpful for the power utilization planning of power dispatching and management departments.
1 Numerical models and arithmetic cases
1.1 Anthropogenic heat emissions in the WRF model and its urban canopy scheme
WRFV3 is a nonhydrostatically compressible mesoscale weather forecasting model with the Arakawa C grid in the horizontal direction and terrain-tracing mass coordinates in the vertical direction.The model has a reasonable dynamical framework structure, an advanced three-dimensional variation data assimilation system, and a reasonable parameterization scheme, and its horizontal resolution can support a range of variability: from a few meters to several kilometers.
At present, the WRF model parameterization scheme for urban canopy mainly includes the following: (1) The single-layer urban canopy scheme of Kusaka [27]that was introduced in WRF v2.2 in 2002, based on which the WRF model introduces an overall anthropogenic heat emission term into the surface energy balance equation.The surface energy balance scheme of each urban grid is solved by adding the average anthropogenic heat flux term and introducing a daily coefficient of the variation in anthropogenic heat, which allows the user to perform calculations of anthropogenic heat emissions by changing the average flux of urban anthropogenic heat emissions and the daily coefficient of variation in the parameter table.(2)The multilayer urban canopy model (BEP) of Martilli [22]was introduced in WRF v3.1 in 2009.Currently, nointroduction of a heat emission flux term in this scheme exists.(3) [21]The BEP+BEM scheme of Salamanca et al.(2010) was introduced into WRF v3.2 in 2010.This scheme explicitly addresses the indoor and outdoor atmospheric heat transfer.In this scheme, it is assumed that the window glass and wall are different heat conduction materials, and the heat conduction of indoor and outdoor heat to the atmosphere through the roof, wall, and ground is calculated.Indoor and outdoor heat is exchanged through the air conditioning system and natural ventilation equipment (windows).The angle of radiant light and the area of windows determine the entry of solar short and long wave radiations in the external atmosphere as well as the outward transmission of indoor long wave radiation.Additionally, this scheme considers the impact of the human body of indoor residents and the artificial heat generated by household appliances on the indoor and outdoor temperature.
1.2 Numerical cases
In this study, the WRF model was applied with a threedomain nesting (50 × 50, 61 × 61, 82 × 82) with twoway feedback and grid distances of 9 km, 3 km, and 1 km, respectively.The center of the simulated area was 32.06 °N, 118.8 °E, and the MODIS land use data (2010 modified IGBP MODIS LULC (15 arc seconds) data) were used for the land-use-type data.The initial field of the model simulation is based on the 1° × 1° reanalysis data provided by the National Centre for Environmental Prediction(NCEP), which updates the s boundaries data every 6 h.The vertical direction is divided into 52 unequal layers according to the σ-plane, ranging from ground level to 50 hPa aloft,with 17 layers below 1 km.The model uses the Dudhia scheme [28]for shortwave radiation, the RRTM scheme[29]for longwave radiation, and the SWM5 microphysical scheme [30].The station observation data for validation are marked with black triangles in Fig.1.
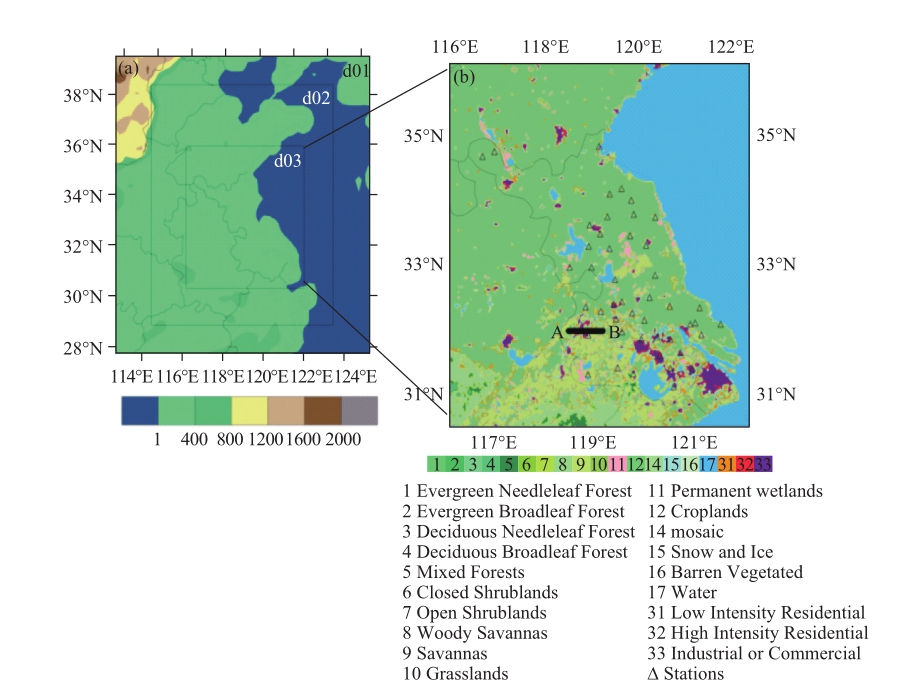
Fig.1 Simulation region and land use type in domain 3
Jiangsu Province experienced long-term hightemperature weather in July 2017 (as shown in Fig.2).Controlled by the subtropical high-pressure system, the weather was extremely hot.From July 3, the temperature in Jiangsu Province began to exceed 30 ℃, and the average observed temperature exceeded 30 ℃, 32 ℃, and 35 ℃ for 27 d, 20 d, and 10 d, respectively.In this study, we chose the hottest period of July 21–27 for simulation studies.
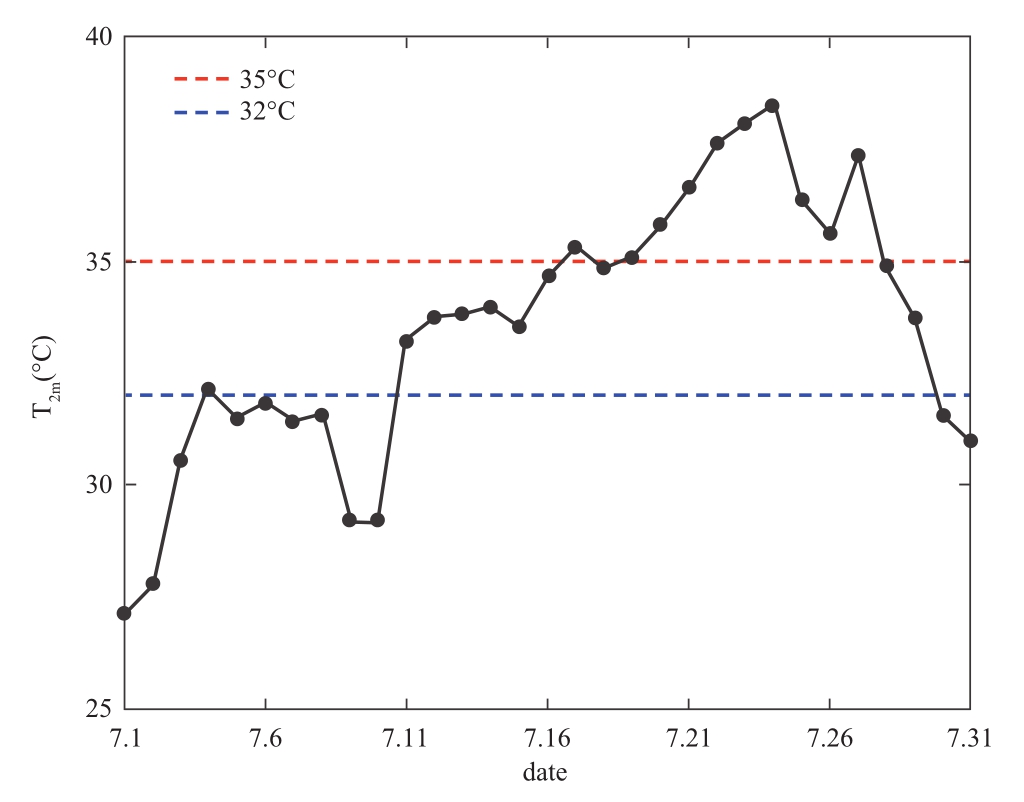
Fig.2 Distribution of 2-m temperature changes in July 2017 in Jiangsu Province
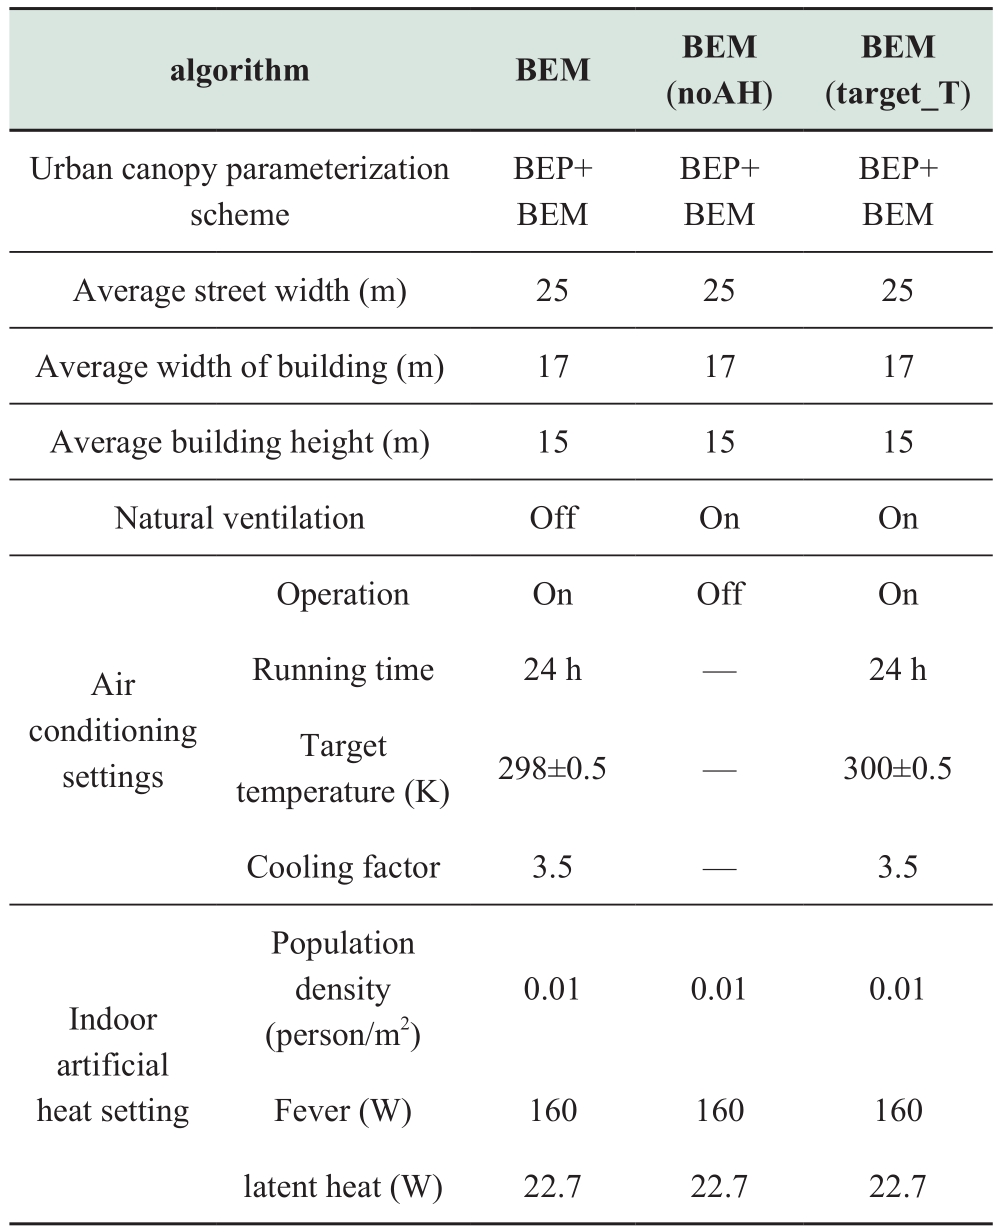
The following cases (1) BEM, (2) BEM (Noah), and(3) BEM (target_t) are designed to simulate the urban atmospheric thermal environment from 08:00 on July 21 to 08:00 on July 27, 2017 (Beijing time, the same below).The BEP+BEM canopy parameterization scheme in the WRF model was used for all three cases.However, in the first case of BEM, the air-conditioning system is on, whereas it is off in the case of BEM (Noah).The natural ventilation system is on in the case of BEM (Noah), and the heat exchange process between the indoor and outdoor of the natural ventilation systems exists.The purpose of comparing case BEM with BEM (Noah) is to investigate whether the air conditioning system is switched on or off and how it affects the urban atmospheric temperature.In both BEM and BEM (target_t) cases, the air-conditioning system is on.The target temperature of the indoor air-conditioning system is set at 25 °C in case of BEM and 27 °C in case of BEM(target_t).The building parameters were set by considering the values of Sun et al.[31]as references, and the details are listed in Table 1.
Table 1 Case configurations
2 Simulation results
2.1 Verification of simulated cases
The observed data of 46 meteorological stations in Jiangsu Province from July 21 to 27, 2017 are used to verify the simulation results.The station locations are shown in Fig 1.The 46 sites are divided into urban and suburban areas according to the type of underlying surface.The urban sites are divided into low- and high-density residential and commercial districts.The simulated 2 m-temperature T2m and 10 m wind speed WS10m are compared with the observed data to evaluate the simulation results.The statistics mainly used in this paper are the consistency index IA of simulated and observed values, root mean square error (RMSE),standard deviation of observed values (SD_O), standard deviation of simulated values (SD_P), and correlation coefficient (COV) are used to describe the relationship between them more accurately.
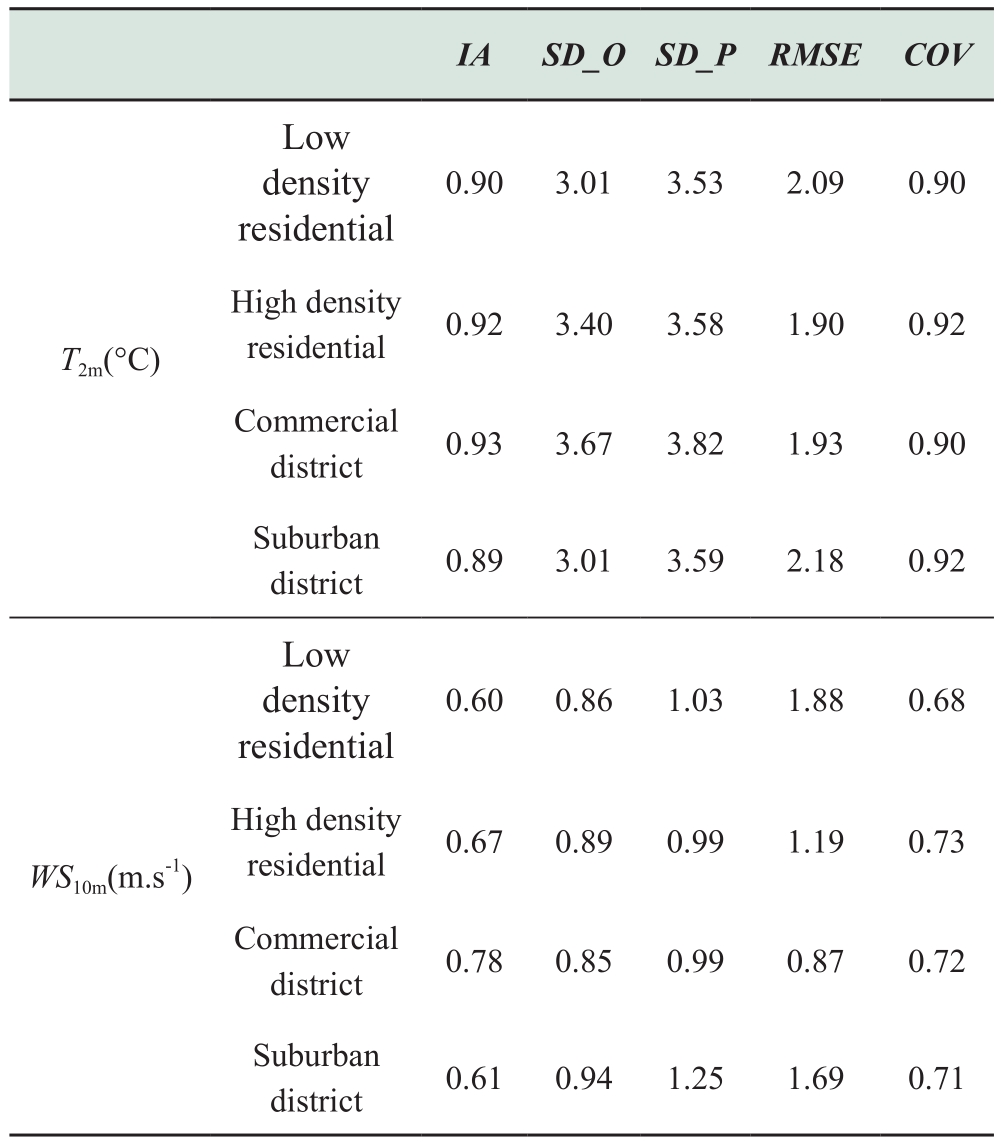
Table 2 indicates that T2m of the low and high density residential areas are simulated better.The RMSEs are 2.09 and 1.90 °C, respectively, and the COVs reach 0.90 and 0.92, respectively.The commercial area COV is 0.90, and the RMSE is 1.93 °C.The overall simulated result is good.The wind speed in this study is also well simulated but slightly overestimated, likely because the resolution of the WRF model is not precise enough, and the parameters of the 3D building in the simulation grid cannot be presented in detail.Because of the limitation in grid resolution, the parameters used cannot be completely consistent with the real building characteristics.The influence of local flow field is difficult to accurately describe because of the presence of buildings, vegetation, and terrain fluctuation,and the drag effect on air flow is eventually weakened;therefore, the simulated WS10m is slightly higher than the observation.
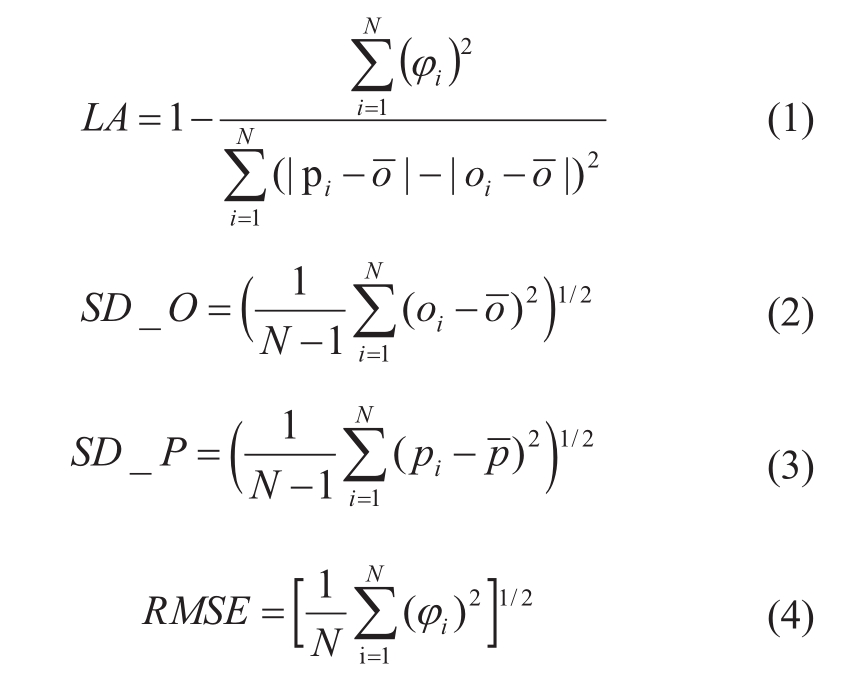
Table 2 Statistical parameters of comparison between observation and simulation
2.2 Impact of the operation of electricity-using system on urban temperature
This section utilizes the set of BEM and BEM (noAH)cases for comparative analysis.The BEM case takes into account the operation of the air conditioning system (i.e.,the exchange of energy between indoor and outdoor areas by the air conditioning system) and the energy consumptionof the air conditioning system itself.In contrast, the BEM(noAH) case is treated with the air conditioning system turned off, and only the exchange of energy between indoor and outdoor areas through natural ventilation (i.e., windows)is considered.
Table 3 presents the average values of the two cases for indoor–outdoor energy exchange in 13 cities in Jiangsu province, where positive values indicate the release of energy from indoor to outdoor areas, and negative values indicate the opposite.It can be found that when the air conditioning system is running, all the energy is positive,i.e., all the heat is released from indoor to outdoor areas,and the largest emission term is the sensible heat flux released by the air conditioning system, which accounts for approximately 73% of the total release.The energy consumption of the air conditioning system itself accounts for approximately 18% of the total release.It can be seen that when the air conditioner is turned on, more than 90%of the heat exchanged between indoor and outdoor areas is from the sensible heat flux released by the air conditioner and the energy consumption of the air conditioning system itself.
Table 3 Average indoor-outdoor energy exchanges simulated by BEM and BEM (noAH)
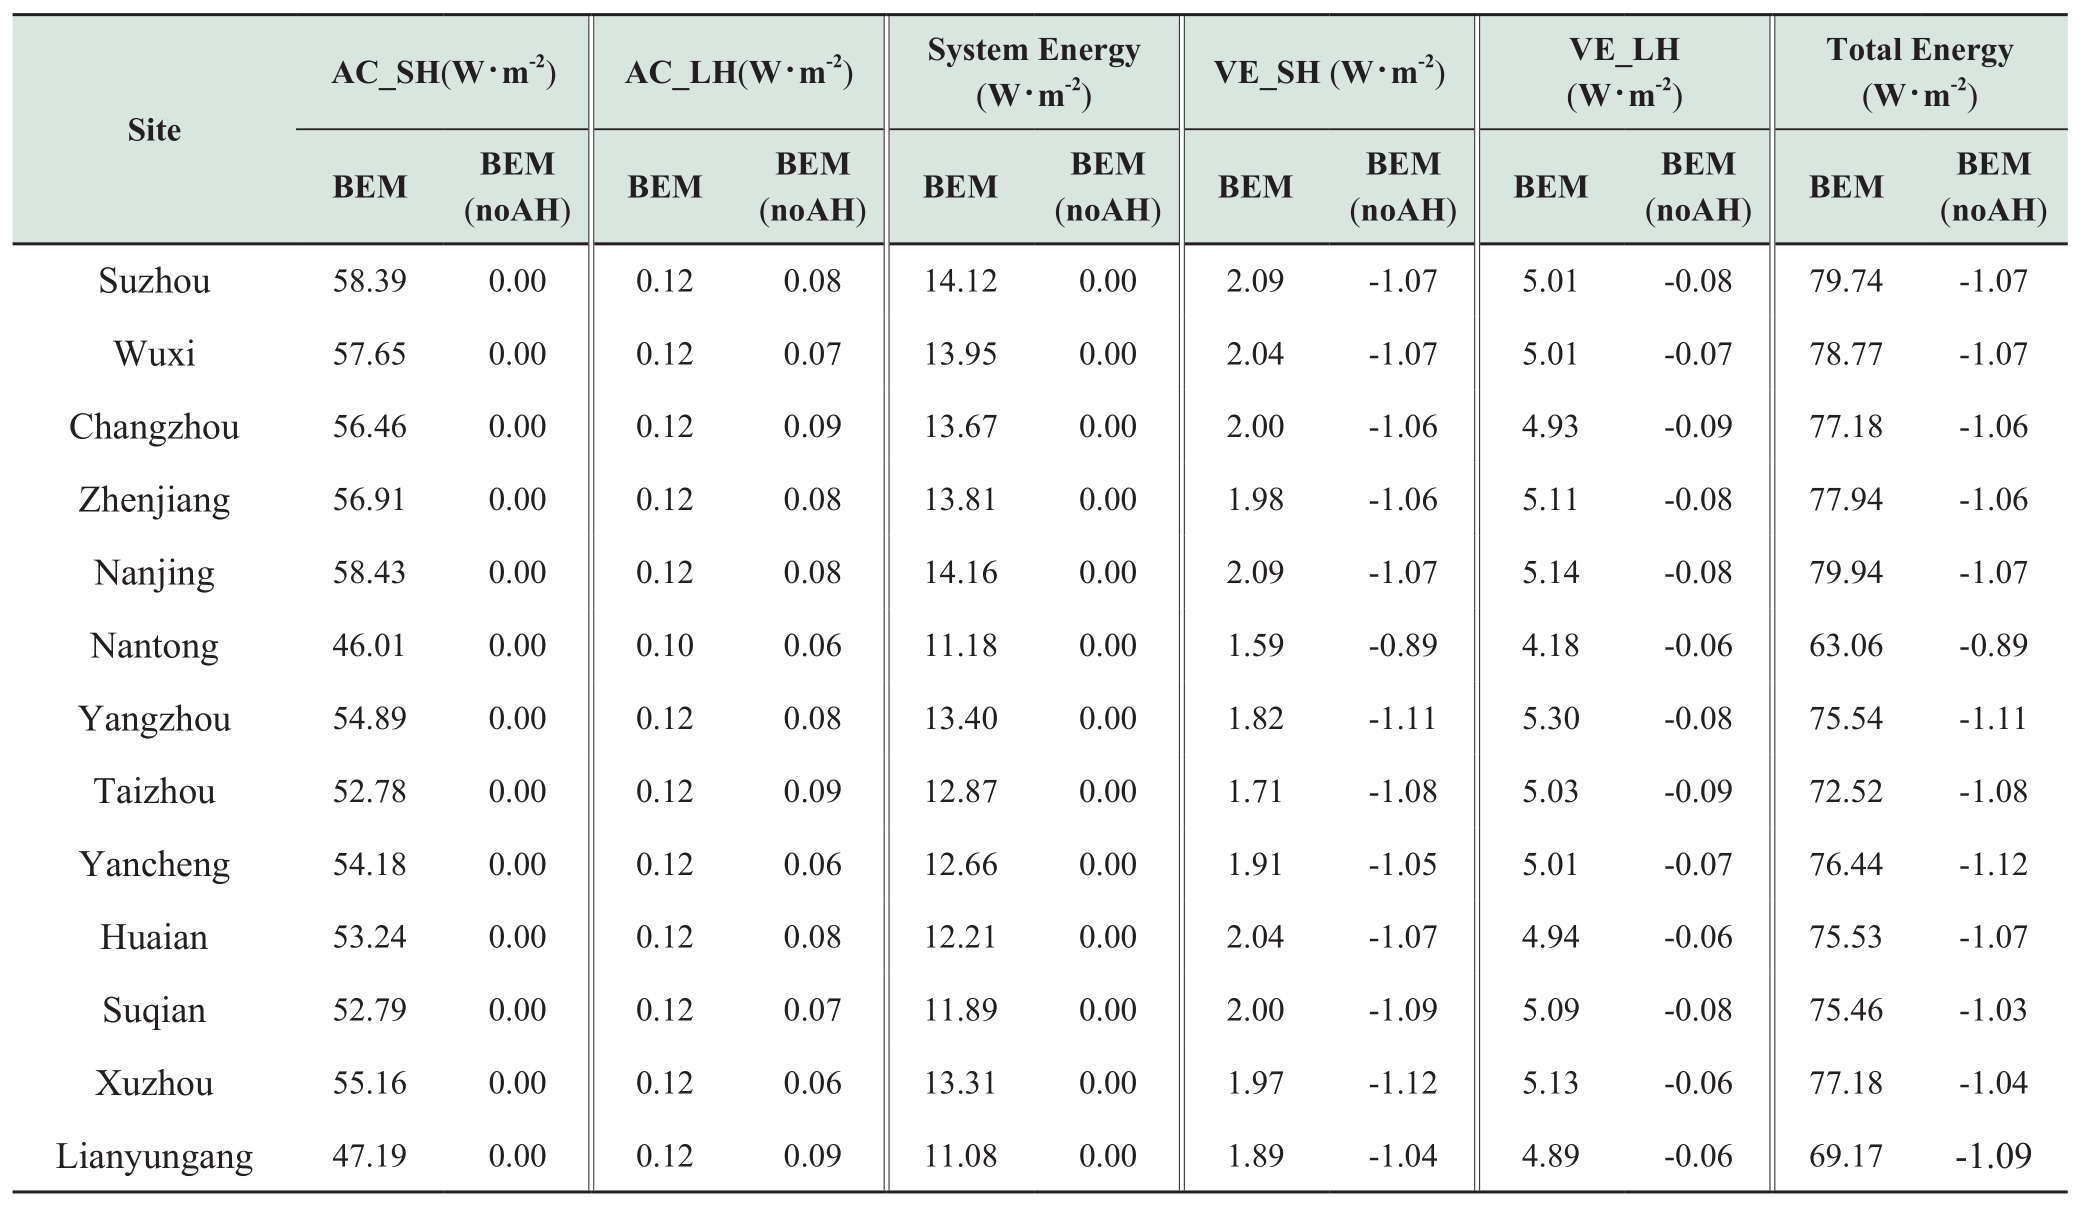
When the air conditioning system is turned off, the two largest emission sources (the sensible heat release from the air conditioning system and energy consumption of the air conditioning system itself) are both zero.The heat transfer between indoor and outdoor is mainly through the natural ventilation equipment, and the sensible and latent heat fluxes released by the ventilation equipment are all negative, indicating that the heat transfer from outdoor to indoor raises the indoor temperature.From the total release of BEM(noAH) case, the average heat gained indoors in the 13 cities is approximately 1 W·m-2.According to Q =cm∆T, where Q is the heat, c is the specific heat capacity of air at constant pressure, and m is the air mass, assuming that all the urban grid points in the model simulation area are all 15 m-high buildings (the building walls are neglected,the interior is air in the standard state, and all buildings are considered to be composed of uniform air blocks),the air volume is determined.Thereafter, the air mass can be calculated according to the air density.The indoor temperature is found to increase by approximately 4.5 ℃when the indoor receives 1 W·m-2 of heat.
The above result is also evident from the daily change curve of indoor temperature in Fig.3 (only the change in indoor temperature in Nanjing is taken as an example; the situation in other cities is similar).When the air conditioner is turned off, the indoor temperature will change with time.The lowest temperature appears at 06:00–07:00, and the highest temperature appears at 16:00–17:00.Comparing the indoor temperature at 08:00 on the two days apart, we find that the indoor temperature at 08:00 on July 24 is approximately 3 °Chigher than that at 08:00 on July 26, which is more consistent with the increase in indoor temperature calculated using the average total emission of -1 W·m-2.However, there is still a gap between this value and the real indoor temperature change mainly because in the BEM case, the ventilation, heat dissipation, and cooling effects of other home appliances other than the air-conditioning electrical system are not considered.Additionally, when the air conditioner is on, the indoor temperature always remains at the target temperature(25 ± 0.5 ℃).
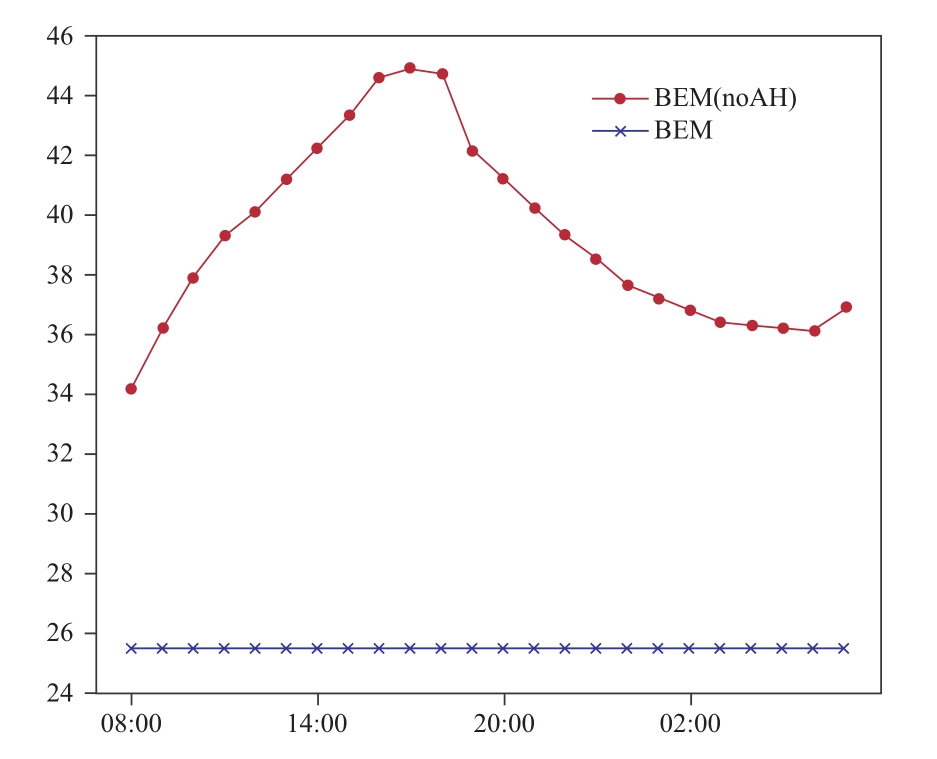
Fig.3 Daily variation of indoor temperature in Nanjing
Fig.4 shows the distribution of the difference between the simulated near-surface T2m at different moments for the two BEM and BEM(noAH) schemes after superimposing the wind field simulated by the BEM case.In the urban area,the temperature difference values simulated for both cases is relatively small during the daytime, generally in the range of 0.3–0.6 °C.At night, however, the temperature deviation becomes significantly larger, and the temperature difference is generally above 0.6 °C in urban areas, especially in densely populated areas, where the highest temperature difference can reach approximately 1.2 °C.
With time, the solar shortwave and net radiations enter their strongest stage from 10:00 to 12:00, when the urban temperature starts to rise and gradually reaches its highest value; the deviation of the near-surface temperature simulated by both cases during this time does not change much for the whole urban area, with an average of 0.3 °C.This is attributed to the larger temperature value being close to the maximum of the day when the solar shortwave radiation reaches its maximum, and the heat emitted by the air conditioning system is small compared to the solar shortwave radiation; therefore, it does not have a very significant impact during the day.From 22:00 to 00:00,the urban temperature is mainly influenced by the role of canopy heat storage and anthropogenic heat emission, and it can be inferred from Fig.4d–f that the indoor and outdoor heat exchange of the air conditioning system generally contributes more than 0.6 ℃ to the urban temperature, and the maximum temperature difference at 22:00–23:00 can reach approximately 1.2 ℃.Meanwhile, the maximum temperature difference gradually decreases primarily because the outdoor temperature gradually decreases from 22:00 to 00:00.Further, the difference between indoor and outdoor temperature further decreases.The latent heat release of the air conditioning system and its own energy consumption decreases.Hence, the total energy release decreases, and its effect on the urban temperature environment declines.
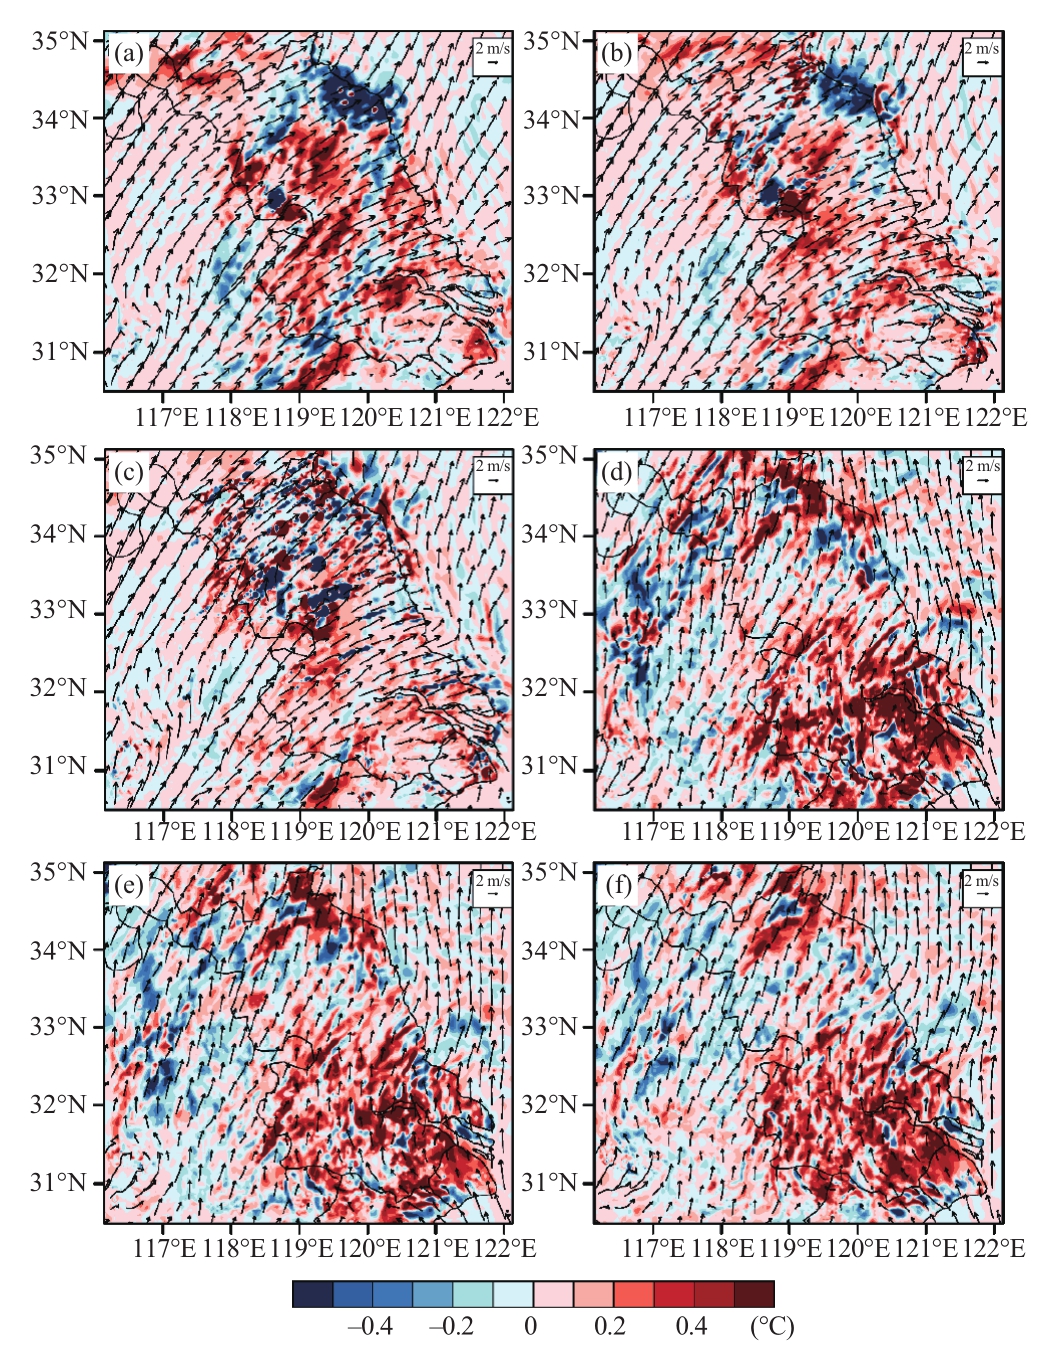
Fig.4 Air temperature differences between BEM and BEM(noAH) simulations superimposed on wind fields simulated by BEM at different time on 24 July(a.10:00, b.11:00, c.12:00, d.22:00, e.23:00, f.24:00 BJ)
During the daytime, the wind field shows a more consistent southwesterly wind owing to the large difference in radiation received by the subsurface.There are multiple circulations generated within the urban area, and the turbulent eddy structure is generated over city, corresponding to the high differential value area within the city.At night, owing to heat island circulation, the easterly winds blowing from thesuburbs cause the high-temperature zone to move to the southwest and the temperature to decrease.
In summary, the heat emitted by the electricity system has an effect on the indoor and outdoor temperatures.The electricity system maintains the indoor temperature at the target temperature, and the excess heat and heat produced by the air conditioner itself are released to the outdoor air.During the daytime, it is not evident whether the electricity system is operating or not with regard to the effect on the urban atmospheric temperature; at night, when the electricity system is operating, the urban temperature will generally increase by more than 0.6 ℃ because of the heat exchange between indoor and outdoor.Moreover, in the densely populated residential area, there is a maximum temperature increase of approximately 1.2 ℃ at 22:00 and 23:00.The maximum impact value will gradually decrease.
2.3 Influence of targeted temperature value of electricity consumption system on urban temperature
In the WRF(BEP+BEM) scheme, the indoor air temperature can be controlled according to the targeted temperature of the air conditioning system.The exchange between the indoor and outdoor sensible heat flux and latent heat flux is closely related to the indoor air temperature,especially when the air conditioning system is operating.The calculated results of the two fluxes are directly determined by the targeted temperature.Comparing the BEM and BEM (target_T) cases, the indoor targeted temperature of the BEM case is 25 ℃, whereas the targeted temperature of the BEM (target_T) case is 27 ℃.
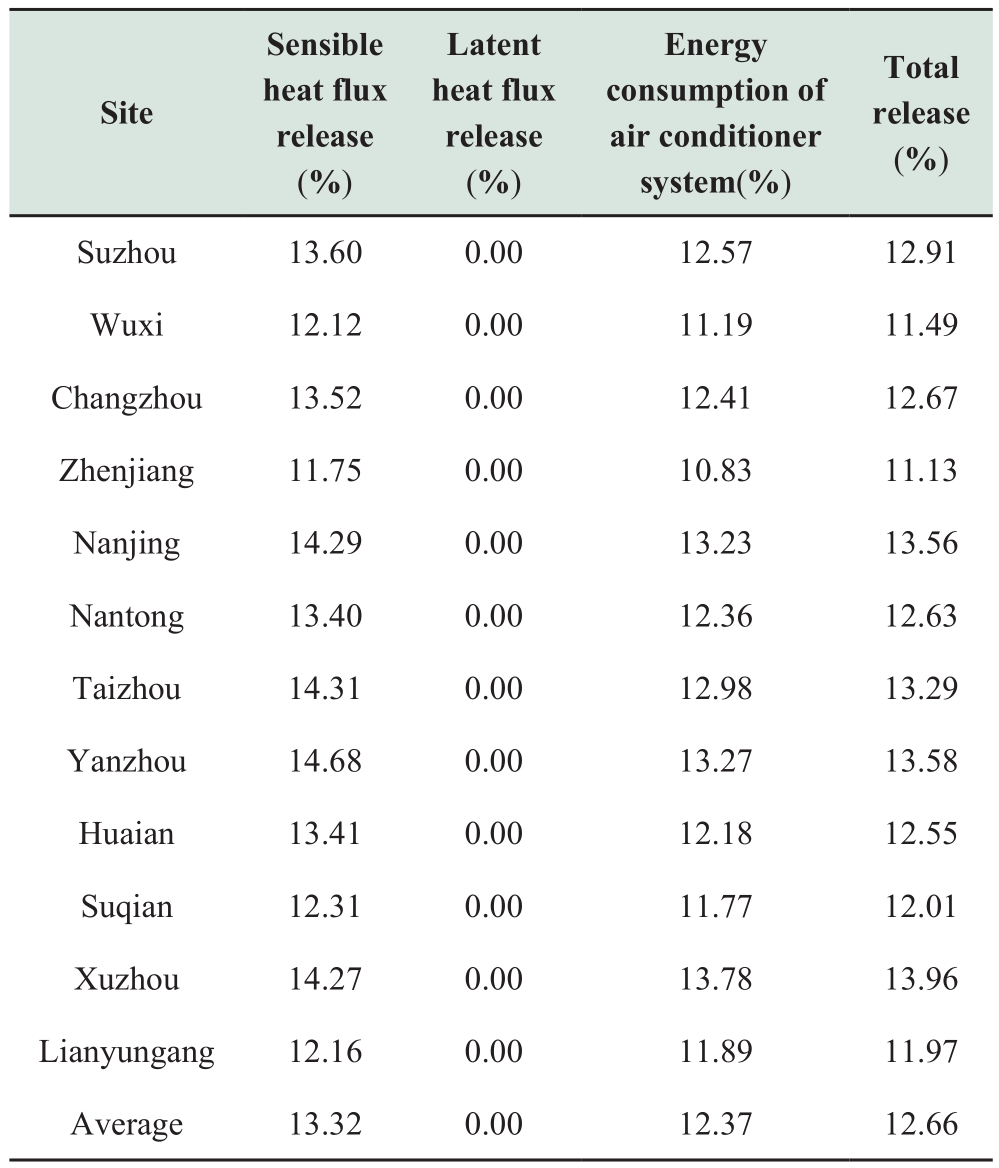
Table 4 presents the influence of the change in the targeted temperature values (from 25 to 27 °C) among 13 cities in Jiangsu Province.Two large emission sources are considered as two variables, the sensible heat flux of the air conditioner and energy consumption of the air conditioning system, whose emission reduction rates after the targeted temperature is changed are both between 11% and 14%.The emission reduction rate of the latent heat flux released by the air conditioners at eight sites is zero because the whole volume of indoor latent heat is generated by people with.Their total volume is approximately 22.7 W of latent heat per person every day in the building energy model(Table 4).Therefore, when there is no change in the number of indoor people (in this experiment, the default value of the model is 1 person/100 m2), the latent heat released by the air conditioning system is not be changed; therefore,the emission reduction rate is zero.The other two variables,the sensible heat fluxes and latent heat fluxes released by ventilation installation, are not listed in Table 3 because the effect on indoor and outdoor heat exchange is much smaller compared to the air conditioning system when the air conditioning system is operating.The total volume of release reflects the change in total volume of released heat.Three types of heat exist: the sensible heat released by the air conditioner, latent heat of the human body, and energy consumption of the air conditioner itself.The average emission reduction rate in the 13 cities is approximately 12.66%.
Table 4 Percentage decrease of energy released by air conditioner simulated by BEM (target_T) compared to that in the BEM case
To study the influence of the power consumption system on the change in outdoor air temperature, a curve in the filling area is used to show the difference between the total release volumes and temperature simulated by the two schemes at different sites (Fig.5).Evidently, the forms of the daily variation curves of the total release volumes simulated by the two schemes in 13 cities are fully consistent; the release volume increases in the forenoon with maximum point at about 15:00, and then decreases with minimum point at about 06:00.The instantaneous total volumes of release simulated by the BEM case at all sites is higher (10 W·m-2) than that of the BEM (target_T)case on average.Corresponding to the temperature curve in the filling area, the difference patterns of the simulated results for air temperature in the near-surface 2 m under thetwo schemes in the 13 cities are similar: the temperature gradually rises in the morning, with a maximum value at 15:00, and then begins to fall to a minimum at 06:00.However, the temperature departure simulated by the two schemes before 11:00 and after 20:00 is very small because the indoor and outdoor temperature departures in the period are close, and the volumes of heat released by the air conditioner is small.Therefore, its effect on urban atmosphere heat increase is small.Another reason is that the average deviation of instantaneous total volumes of release simulated by the two schemes is only 10 W·m-2,and thus, the difference in the simulated urban atmospheric temperature is small.The temperature difference simulated by the two schemes in 13 cities was the largest from 13:00 to 16:00 in one day, especially in the city center, for the sites surrounded by the urban underlying surface.
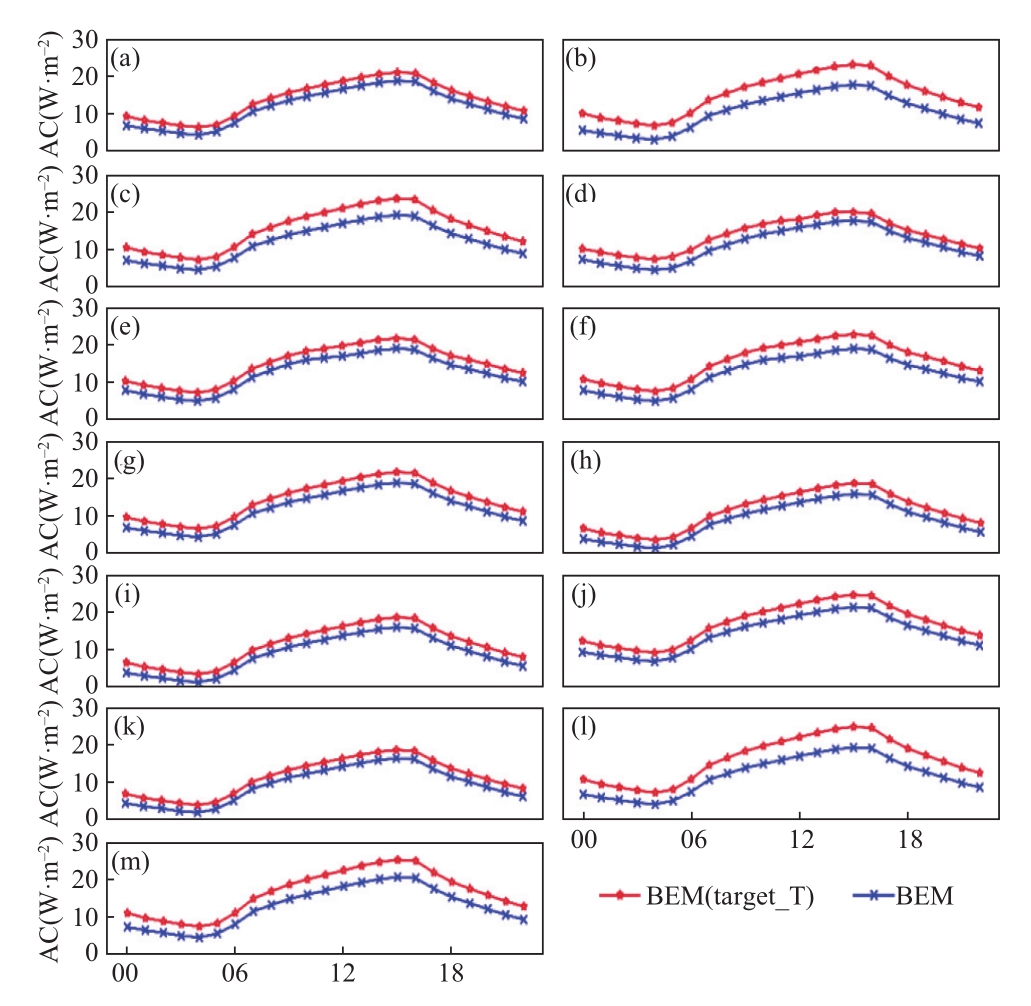
Fig.5 Energy differences simulated by BEM & BEM(target_T) from 24 July to 25 July.(a)Suzhou; (b) Wuxi;(c)Changzhou; (d)Zhenjiang; (e)Nanjing; (f)Nantong;(g)Yangzhou; (h)Taizhou; (i)Yanzhou; (j)Huaian; (k)Suqian;(l)Xuzhou; and (m)Lianyungang
From the abovementioned observations, the total released air conditioner volumes simulated by the BEM case is higher by 10 W·m-2 than that of the BEM (target_T) case in one day.The corresponding deviation in the simulated temperature results changes with time: the temperature does not fall significantly before 11:00 and after 20:00 mainly because the volumes of energy released by the air conditioner system are small in this stage.Furthermore, its effect on heating the urban atmosphere is small, and thus,the temperature difference of the near-surface simulated by the two schemes after the change in the targeted temperature is small; however, the temperature falls significantly from 13:00 to 16:00 with an average temperature of approximately 1 °C.The maximum deviation is influenced by the environment surrounding the site and heat-island circulation.When the whole site is surrounded by urban underlying surfaces, under the effect of circulation, some areas will have a large temperature difference, whereas other areas will have a small temperature difference.
Because the temperature difference is maximal from 13:00 to 16:00, we used the BEM and BEM (target_T)cases to study and compare the influence of different indoor targeted temperatures on the atmospheric temperature environment in the urban area of Jiangsu Province at 14:00,July 25, 2017.Fig.6a presents the difference in energy released from indoor to outdoor areas in the two schemes.Fig.6b and c reflect the spatial distribution of temperature at 14:00 simulated under the BEM and BEM (target_T) cases,respectively.As shown in Fig.6a, in urban areas, owing to the change in the targeted temperature of the indoor air conditioner system (from 25 °C to 27 °C), the total volume of energy exchanged by the air conditioner system generally falls by 12 W·m-2.Particularly, in Fig.6a, the maximum value falls by more than 12 W·m-2.In Fig.6b and Fig.6c,the difference in the total volume of energy released by the two schemes is larger, and the temperature change is correspondingly larger.Further, the maximum change is from 41 °C to 39 °C.
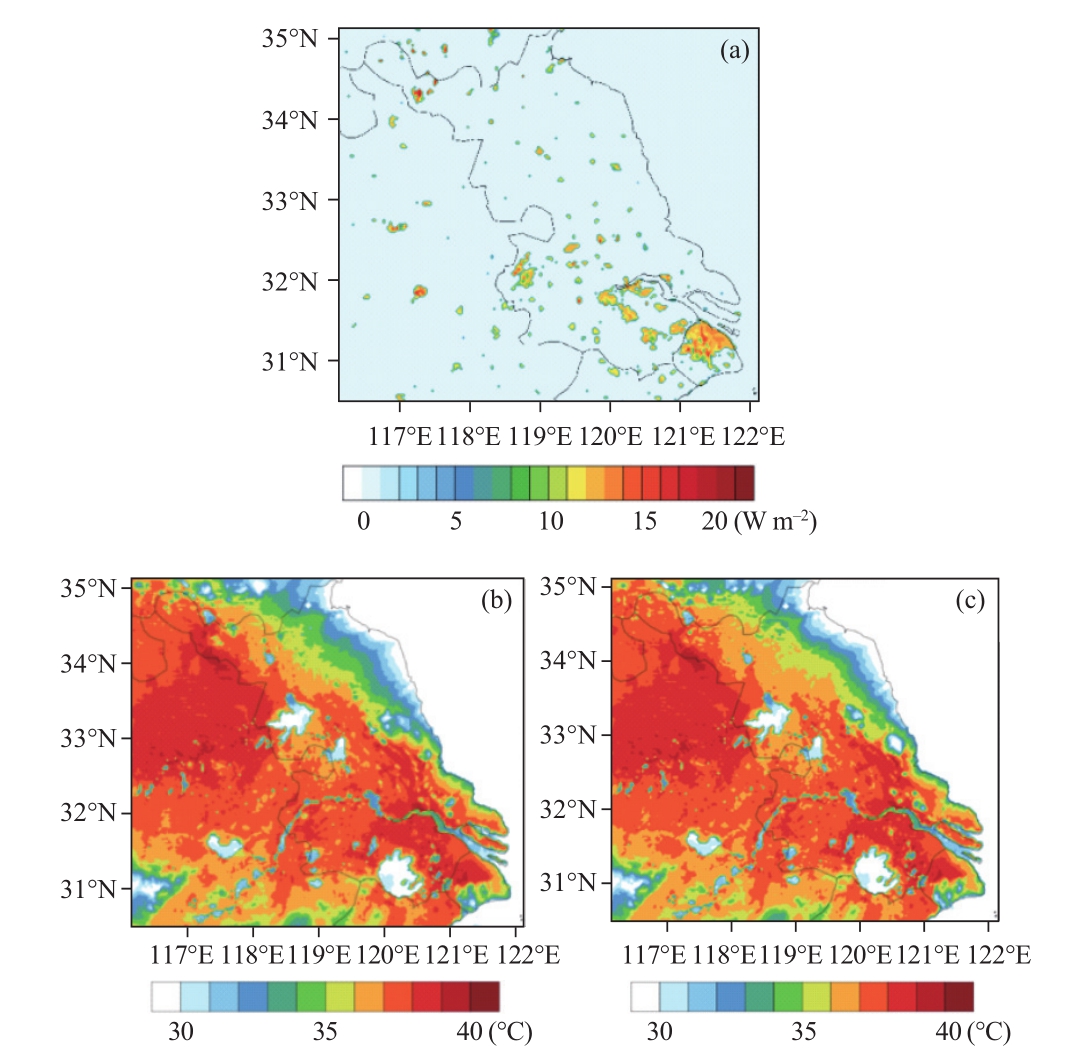
Fig.6 (a) Energy saving and (b, c) air temperature distributions simulated by BEM and BEM (target_T)at 14:00 on 24 July
The change in the targeted temperature of the air conditioner system changes the temperature difference between indoor and outdoor, which changes the volume of heat released by the air conditioner system and influences the outdoor atmospheric temperature.According to this comparative experiment, when the indoor temperature is raised from 25 °C to 27 °C, the average total volume of heat released from the indoor to outdoor will decrease by 12.66%.From the curve per day in 13 cities, the targeted temperature increases by 1.2 °C, and the instantaneous total volume of energy release decreases by 10 W·m-2,and the deviation condition of the outdoor atmospheric temperature changes with time: temperature falls slightly from 08:00 to 11:00 and 0:00.The temperature falls from the maximum value from 13:00 to 16:00 at an average of 0.5 °C.The largest temperature difference is attributed to the surrounding environment: when the building is denser, the fall in temperature is larger.When the building is sparser or close to the Yangtze River, parks, airports, etc., the decrease in air temperature is smaller.
The exchange condition and exact exchanged value between indoor and outdoor heat by the air conditionersystem are closely related to the resolution of the underlying surface data and authenticity of the urban morphology.Because the morphological structures and parameters of all the buildings in every grid in the BEP+BEM scheme are identical, taking account of existence and of the air conditioning system with operating in every building system a certain deviation from the actual urban situation exists.Therefore, the simulation results may also exhibit a deviation in 2-m temperature and energy.
3 Conclusion and discussion
The WRF/BEP/BEM model with three cases is used in this study to study the influence of the indoor electricity system on the outdoor air temperature under high temperature.The main conclusions from the study are as follows:
(1) When the air conditioning electricity system is running, the indoor temperature is stable and constant, and the excess indoor heat and the heat produced by its own operation will be discharged into the urban atmosphere.Urban air temperature is not significantly affected by the operation of the electrical system during the day.However, at night, when the electricity system is running,the temperature in the city will generally increase by more than 0.6 ℃, especially in densely populated areas, and the maximum temperature increase will be approximately 1.2 ℃ from 22:00 to 23:00.
(2) The energy exchanged between indoor and outdoor will be changed because the target temperature of the electrical system is changed.When the indoor temperature is raised from 25 ℃ to 27 ℃, the total energy release of the air conditioning system is reduced by 12.66%.The variation in outdoor air temperature is as follows.From 8:00 to 11:00 and from 20:00 to 8:00 the next day, the temperature does not drop significantly, and the highest temperature drop is from 13:00 to 16:00 at an average of approximately 1 ℃.The maximum temperature deviation is affected by the surrounding environment: the denser the buildings are,the greater the temperature drop.Conversely, the sparser the buildings, or if the site is near the Yangtze River, park,airport, etc., the smaller is the temperature drop.
The city at night heats up because of the use of air conditioning and other electricity systems, and we determine its waste heat emissions in Jiangsu province in the hot summer climate of the city through this study.Therefore, the nighttime urban heat island is significantly enhanced, and the risk of high-temperature disasters is further increased during the high temperature heat wave.In addition, the convergence of urban local circulation is intensified by the enhancement in the heat island at night.
Acknowledgements
This work was supported by Incubation Project of State Grid Jiangsu Electric Power Company “Research and application of key technology of intelligent forecasting and warning for electric power meteorological public service platform” (JF2021045).
Declaration of Competing Interest
We declare that we have no conflict of interest.
References
[1]Voogt J A, Oke T R (2003) Thermal remote sensing of urban climates.Remote Sensing of Environment, 86(3): 370-384
[2]Chemel C, Sokhi R S (2012) Response of London’s urban heat island to a marine air intrusion in an easterly wind regime.Boundary-Layer Meteorology, 144(1): 65-81
[3]Ohashi Y, Genchi Y, Kondo H, et al.(2007) Influence of airconditioning waste heat on air temperature in Tokyo during summer: Numerical experiments using an urban canopy model coupled with a building energy model.Journal of Applied Meteorology and climatology, 46(1): 66-81
[4]Pigeon G, Legain D, Durand P, et al.(2007) Anthropogenic heat release in an old European agglomeration (Toulouse, France).International Journal of Climatology: A Journal of the RoyalMeteorological Society, 27(14): 1969-1981
[5]Yang T, Wang X Q, Zhang W, et al.(2017) The improvement in model simulations of the atmospheric condition in Beijing with consideration of anthropogenic heat.Climatic and Environmental Research (in Chinese), 22(1): 1-9
[6]Wang Y W, Jiang W M, Guo W L, et al.(2008) Numerical study of the urban scale and layout effect on atmospheric environment.Chinese Journal of Geophysics, 51(1): 88-100
[7]Tong H, Liu H Z, Sang J G, et al.(2004) The impact of urban anthropogenic heat on Beijing heat environment.Clim.Environ.Res, 9(3): 409-421
[8]Zhang C, Shu J, Chen S S (2011) Urban anthropogenic heat categorizing and its effects on urban temperature.Resources and Environment in the Yangtze Basin, 20(2): 232-238
[9]Jiang W, Chen Y (2007) The impact of anthropogenic heat on urban boundary layer structure.Chinese Journal Of Atmospheric Sciences-Chinese Edition-, 31(1): 37
[10]He X F, Jiang W M, Chen Y, et al.(2007) Numerical simulation of the impacts of anthropogenic heat on the structure of the urban boundary layer.Chinese Journal of Geophysics, 50(1): 75-83
[11]Wang Z, Wang X (2011) Estimation and sensitivity test of anthropogenic heat flux in Guangzhou.Journal of the Meteorological Sciences, 31(4): 422-430
[12]Lu Y, Wang Q G, Zhai Y R, et al.(2014) Anthropogenic heat emissions in the Yangtze River Delta region.China Environmental Science, 34(2): 295-301
[13]Allen L, Lindberg F, Grimmond C S B (2011) Global to city scale urban anthropogenic heat flux: model and variability.International Journal of Climatology, 31(13): 1990-2005
[14]Sailor D J (2011) A review of methods for estimating anthropogenic heat and moisture emissions in the urban environment.International journal of climatology, 31(2): 189-199
[15]Kimura F, Takahashi S (1991) The effects of land-use and anthropogenic heating on the surface temperature in the Tokyo metropolitan area: A numerical experiment.Atmospheric Environment.Part B.Urban Atmosphere, 25(2): 155-164
[16]Taha H (1999) Modifying a mesoscale meteorological model to better incorporate urban heat storage: A bulk-parameterization approach.Journal of Applied Meteorology, 38(4): 466-473
[17]Brown M J, Williams M D (1998).An urban canopy parameterization formesoscale meteorological models.Proceedings of the AMS Conference on 2nd Urban Environment Symposium.Albuquerque, NM: American Meteorological Society, 2-7
[18]Ashie Y, Ca V T, Asaeda T (1999) Building canopy model for the analysis of urban climate.Journal of Wind Engineering and Industrial Aerodynamics, 81(1-3): 237-248
[19]Masson V (2000) A physically-based scheme for the urban energy budget in atmospheric models.Boundary-Layer Meteorology, 94(3): 357-397
[20]Kikegawa Y, Genchi Y, Yoshikado H, et al.(2003) Development of a numerical simulation system toward comprehensive assessments of urban warming countermeasures including their impacts upon the urban buildings’ energy-demands.Applied Energy, 76(4): 449-466
[21]Salamanca F, Krpo A, Martilli A, et al.(2010) A new building energy model coupled with an urban canopy parameterization for urban climate simulations—part I.formulation, verification,and sensitivity analysis of the model.Theoretical and applied climatology, 99(3): 331-344
[22]Martilli A, Clappier A, Rotach M W (2002) An urban surface exchange parameterisation for mesoscale models.Boundary-Layer Meteorology, 104(2): 261-304
[23]Salamanca F, Martilli A, Tewari M, et al.(2011) A study of the urban boundary layer using different urban parameterizations and high-resolution urban canopy parameters with WRF.Journal of Applied Meteorology and Climatology, 50(5): 1107-1128
[24]Krpo A, Salamanca F, Martilli A, et al.(2010) On the impact of anthropogenic heat fluxes on the urban boundary layer: a twodimensional numerical study.Boundary-Layer Meteorology,136(1): 105-127
[25]Zheng Y, Miao S, Zhang Q, et al.(2015) Improvements of building energy model and anthropogenic heat release from cooling system.Plateau Meteorology, 36(2): 562-574
[26]Yu L Z, Miao S, Bao Y X, et al.(2017) Interaction of anthropogenic heat emission from building cooling system and meteorological environment.Plateau Meteorology, 36(2): 562-574
[27]Kusaka H, Kondo H, Kikegawa Y, et al.(2001) A simple singlelayer urban canopy model for atmospheric models: Comparison with multi-layer and slab models.Boundary-Layer Meteorology,101(3): 329-358
[28]Mlawer E J, Taubman S J, Brown P D, et al.(1997) Radiative transfer for inhomogeneous atmospheres: RRTM, a validated correlated-k model for the longwave.Journal of Geophysical Research: Atmospheres, 102(D14): 16663-16682
[29]Chen F, Dudhia J (2001) Coupling an advanced land surface–hydrology model with the Penn State–NCAR MM5 modeling system.Part I: Model implementation and sensitivity.Monthly Weather Review, 129(4): 569-585
[30]Hong S Y, Dudhia J, Chen S H (2004) A revised approach to ice microphysical processes for the bulk parameterization of clouds and precipitation.Monthly Weather Review, 132(1): 103-120
[31]Sun Y, Zhang N, Miao S, et al.(2021) Urban morphological parameters of the main cities in China and their application in the WRF model.Journal of Advances in Modeling Earth Systems,13(8)
Received: 15 March 2022/ Accepted: 1 August 2022/ Published: 25 December 2022
Weidong Chen
chenweidong@epri.sgcc.com.cn
Kai Liu
437498013 @qq.com
Yuanhan Du
duyuanhan@126.com
Xijuan Wu
619865654 @qq.com
Biographies

Kai Liu (1993-), male, master’s degree,engineer, research interests in energy power big data analytics.

Yuanhan Du (1993-), male, master’s degree,engineer, research interests in new energy power prediction.

Weidong Chen (1989-), male, master’s degree, engineer, research interests in power meteorology and new energy power prediction.

Xijuan Wu (1993-), female, master’s degree,engineer, research interests in substation automation and network security.
(Editor Yanbo Wang)
