0 Introduction
The primary tasks of a transformer used for power grid construction and maintenance involve voltage conversion and reactive power regulation.Power outages can severely affect such systems [1].These power outages can typically be attributed to transformer oil-paper insulation deterioration[2].An oil-paper insulated transformer is regularly maintained by the power grid firm to ensure safe and reliable grid operation.Maintenance based on the insulation status of the transformer can significantly conserve human and material resources [3].Therefore, obtaining a better understanding of the working condition of transformer oilpaper insulation is essential during the development of a maintenance plan.The dielectric response methods are the most widely used methods for the diagnosis and assessmentof the insulation of an aging oil-paper transformer [7].
Some of the common dielectric response diagnosis methods include the recovery voltage method (RVM) and polarization/depolarization current (PDC) method.In [8],the authors investigated the effect of the insulation structure,conductivity, and aging state of oil-paper insulation on the PDC measurement curve.In [9], the authors established the Debye model based on the dielectric response.The RVM characteristic quantity was extracted, and the insulation state was evaluated based on short and long memory networks.
However, previous studies conducted on transformer oil-paper insulation status evaluation faced various drawbacks.Firstly, some of the studies only analyzed the correlation between a few characteristic quantities and the insulation aging state, which increased the difficulty in comprehensively and accurately evaluating the oil-paper insulation state.In [10], only the principal time constant extracted using the RVM method was used to evaluate the aging state of the oil-paper insulation.In [11], the media loss factor was extracted from the PDC measured to evaluate aging, which demonstrated that the media loss factor could reflect the water content and thermal aging degree of the insulating medium; however, a diagnosis based on multiple characteristic values was not performed.
Secondly, several studies have employed the entropy weight approach to estimate the objective weight in transformer assessment based on the extent of index variability [12].However, the entropy weight method cannot consider the transverse effect between indexes.It is strongly dependent on samples, and the weight changes with the change in the modeling sample data.Therefore, the entropy weight method often causes weight distortion.In [13], the authors established a state parameter table containing eight time-domain characteristic quantities.The objective weight was obtained by using the entropy weight technique, and the aging of the transformer oil-paper insulation was diagnosed using both the fusion comprehensive weighing method and evidence theory, implemented in conjunction.However,this approach was found to be strongly dependent on data samples, and it was difficult to accurately estimate the insulation aging status of oil-paper transformers in practical conditions.
Lastly, some studies were focused on the application of the comprehensive evaluation method to determine the insulation state of oil paper.However, the results demonstrated that the weight analysis was incomplete and inaccurate.For example, in [14], the authors employed the analytic hierarchy process combined with the degree of consistency of the judgment matrix constructed by experts.The comprehensive weight ranking of the indicators was obtained by using the weighted average algorithm; however,the results were found to be heavily influenced by the subjectivity of experts.
This study establishes an effective assessment methodology for the state of oil-paper insulation by employing various aging feature amounts based on the combination of objective combination weights and an improved technique for order of preference by similarity to ideal solution (TOPSIS) method [15].It overcomes the drawbacks of existing comprehensive assessment techniques.Nine time-domain feature quantities are selected as evaluation indicators.The subjective and objective weights of each index modified analytic hierarchy process(AHP) are obtained by using the subjective weighting approach and the random forest algorithm-based objective weighting method.We employ the Lagrange multiplier approach to determine the combination weights.This approach helps in accurately identifying the total weight of each indication by overcoming the drawbacks presented by the dependence on subjective weights or the dependence of previous methods for obtaining objective weights on data reliance, thereby increasing the assessment reliability and accuracy.Furthermore, the grey relational analysis method is employed along with the improved TOPSIS method to comprehensively diagnose the oil-paper insulation state.A comparison is drawn between the proximity of the series sets to determine whether the connection is close or not and to evaluate the corresponding insulation state.The data of the evaluation results are extensively analyzed, and a detailed comparison is performed between the transformers with the same insulation grade.The verification example demonstrates that the proposed method can better evaluate the insulation state of oil-paper transformers and presents a novel approach for insulation quality evaluation.
1 Extraction of indicators
The proposed dielectric response equivalent circuit can adequately describe the relaxation aging structure and the internal mechanism of the dielectric response.The oil-paper insulation diagnosis of transformers is typically performed by using an extended Debye equivalent circuit and two time-domain dielectric response techniques[16], i.e., the RVM and PDC.The time domain feature quantity is obtained by analyzing the depolarization current curve and establishing the recovery voltage polarization spectrum.Essentially, the feature quantity is divided into the extended Debye equivalent circuit feature quantity, the RVM feature quantity, and the PDC feature quantity based on the different extraction methods of the feature quantity.
1.1 Extended Debye equivalent circuit
The extended Debye equivalent circuit is widely implemented as a circuit model to represent the relaxation response process of the composite insulating medium.Its equivalent circuit parameters are comprehensively analyzed to establish a close link with the insulation aging system.Figure 1 depicts the equivalent circuit architecture of the expanded Debye model [17].
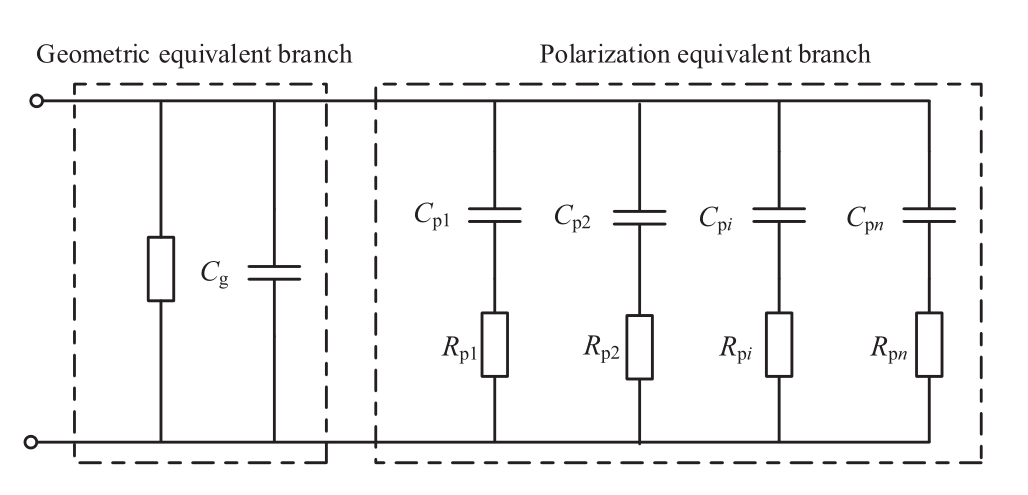
Fig.1 Extended Debye equivalent circuit
The extended Debye equivalent circuit comprises geometric equivalent branches and polarization equivalent branches.The geometric equivalent branch is composed of Rg and Cg in parallel.In the polarization equivalent branch, N series branches of polarization resistance, Rp, and polarization capacitance, Cp, are configured in parallel to reflect the phenomenon of media polarization for different relaxation times.
1.2 Recovery voltage method eigenvalue
The recovery voltage technique is based on the dielectric response theory, which estimates the recovery voltage at both poles of insulating equipment based on the polarization properties of the insulating materials.The procedure used to measure the recovery voltage involves four steps: charging,discharging, open-circuit measurement, and relaxing.Figure 2 depicts a single recovery voltage test curve [18][19].

Fig.2 Measurement curve for recovery voltage
1.3 Polarization/depolarization method
The measurement principle of the PDC method is similar to that of the recovery voltage method.The DC pulse voltage, U0, is applied between the windings of the transformer to be tested, and it is continuously charged.During this process, the insulation system begins to respond to polarization and generates the polarization current, ip.The applied voltage is disconnected after tc seconds, and the transformer is short-circuited and discharged [20].A depolarization response occurs in the internal relaxation mechanism at this time, and the generated depolarization current id is recorded.Figure 3 depicts the PDC measurement curve [21].

Fig.3 Polarization/depolarization current measurement waveform
Three characteristic quantities are observed based on the existing relevant research results:
Quantity of the return voltage test characteristic: The highest value of the recovery voltage, Urmax, indicates the greatest value of the recovery voltage for a single charge during the test.The higher the severity of insulation aging,the greater the value of Urmax.The main time constant of the recovery voltage polarization spectrum, tcdom,reflects the peak value of the recovery voltage polarization spectrum.The charging time corresponds to the voltage,and the smaller the value of tcdom, the more severe the insulation aging.The initial slope of the recovery voltage spectrum line, Sr, represents the rate of change of the recovery voltage at the start of the test.The greater the value of Sr, the more severe the insulation aging.
The eigenvalues of the extended Debye equivalent circuit: In the geometric construction, Rg, which indicates the insulation resistance of the transformer, decreases with the insulation aging.The geometric capacitance, Cg,indicates the energy storage of the insulating material.The higher the aging degree of insulation, the greater the amount of energy stored in the insulating medium, and the greater the value of Cg.The value of the polarization index, PI, decreases with the insulation aging.The value ofthe absorption ratio, K, increases with the increase of the insulation aging.
Quantity of the PDC test: Experiments are used to determine The maximum polarization slope, a, and maximum polarization intercept, b, are determined through experimental analysis.The values of a and b increase with the increase of the insulation aging [22].
2 Combined weight of indicators
The weight indicates the relative importance of each indicator, which refers to the importance of or contribution to a certain aspect.The nine distinctive quantity indicators in the aforementioned index system indicate the aging status of the transformer oil-paper insulation system for varying degrees.The expert score is approximate and dependent owing to the imperfect computation presented by the AHP method.The weight of the index fluctuates when the sample changes, and the objectivity is high.In this study, we construct a combination weighting model which combines subjective and objective analysis.Various time-domain feature quantities are integrated through the AHP method based on the subjectivity of expert experience and the random forest algorithm based on the comparison of index data [23][24].
2.1 Construction of an index evaluation system
The nine indicators, C1-C9, are divided into two levels:the goal layer, A, and the criteria layers, B1-B2.“+”indicates a positive correlation, and “-” indicates a negative correlation.
2.2 Determining the subjective weight using AHP
2.2.1 Determining matrix scale definition
The digits 1-9 and their inverses represent the scale of the judgment matrix in the AHP, and their meaning is as follows.
2.2.2 Hierarchical single sort
The relative weight of each level index must be calculated to ensure its consistency.The expert scoring produces the following judgment matrix for the criterion layer index corresponding to the target layer:
Firstly, the weights of the criteria layer indicators such as B1, B2, and B3 are calculated using the “sum product method,” which is broken down into three stages.
To generate a standard judgment matrix, the first step is to normalize the judgment, as follows:

In the second step, the rows of the obtained standard judgment matrix are added up as follows:
The third step involves normalizing the total of each rowof the standard judgment matrix to calculate the weight of each indication:

The weights of the criteria layer indicators such as B1, B2, and B3 are obtained after following these three steps.The obtained judgment matrix is then subjected to a consistency test, which is similarly separated into three parts.
The first step involves calculating the consistency index,CI.The calculation formula for CI is as follows:
Where n denotes the number of indicators, λmax denotes the maximum eigenvalue of the judgment matrix.The calculation formula for λmax is as follows:
Using the judgement matrix we obtain, λmax= 3.0183 and CI = 0.0092.
The second step involves determining the random consistency index, RI.The standard value of RI can be obtained by querying the table.
Since the judgment matrix of the criterion layer is a third-order matrix corresponding to the target layer, RI=0.52 in this judgment matrix.
The consistency ratio, CR, is calculated in the third phase as follows:
The judgment matrix passes the consistency test if the CR value is less than 0.1.In this case, the consistency test was passed since CR=0.0176, which is less than 0.1.
The relative weight and consistency test results of each indicator can be determined through comparison as follows:
2.2.3 Hierarchical total ordering
The relative weight of the index layer index is multiplied by the weight of the associated criteria layer index to obtain the weight value of the index layer index for the highest layer (total goal), that is, the overall weight.
2.3 Determining the objective weight using the random forest algorithm
The voltage levels of the power grid vary throughout the power system.The per-unit value is used to integrate the scale for easier computation.In this case, we cannot directly analyze and sort the importance of the nine indicators.We select the reference value for each index based on the perunit value concept, divide the original data by the reference value to obtain a unified dimension, and compare the effect of each index on the aging degree of the transformer in the same dimension to obtain the objective weight.
The random forest algorithm employs ensemble learning to combine several trees and can effectively prevent overfitting.Its fundamental element is a decision tree.The specific process of constructing each classifier requires randomly selecting a part of the samples from the original dataset as the sample subspace, and then randomly selecting a new feature subspace from the sample subspace.A decision tree is established in this new space as the classifier.The final decision is obtained by voting.The random forest algorithm is based on two important concepts:
1.The bagging method is used to form the training set of each tree.It involves randomly selecting a part of the samples from the overall sample for training, obtaining the classification results through multiple sampling, and lastly,using the above model mean as the final result.The sample is continuously sampled and then returned, which increasesthe perturbation ability of the sample [25][26].
2.A subset of all the feature samples is randomly selected when splitting each node of the decision tree.The best split from the subset is selected to create the tree.A decision tree is a set of randomly distributed random variables which are all distributed in the same way.The training of the random forest algorithm may be configured in parallel since the training of each decision tree is independent of the others, ensuring the efficiency and scalability of the random forest algorithm.
The individual stages are as follows [27][28]:
Step 1 Random forest performs bootstrap sampling and generates K independent decision trees by extracting K sample data sets.
Step 2 Set k=1, train the decision tree, Tk, set the kth data set as the training input, calculate the kth data set, and calculate the accuracy, Lk, of the kth out-of-bag data set.
Step 3 Rearrange feature, f, in the data set outside the bag and calculate the accuracy, Lfk.
Step 4 Repeat steps 2 and 3 for all the sample datasets,k = 2, 3...K.
Step 5 Calculate the classification accuracy error after rearrangement as follows:
Step 6 Obtain the degree of influence of feature, f, on the accuracy of out-of-bag data as follows:
The variance of ef can be given as:
Step 7 Obtain the importance, fc, of feature, F, as follows:
Step 8 Use Equation 3-10 to obtain the importance, fc, of all the features.
2.4 Combination of empowerment
There are some differences in the transformer insulation state reflected by each characteristic quantity index.The subjective weight obtained using AHP method reflects the subjective preference of the evaluator.The random forest algorithm uses the decision tree and ensemble learning concepts to objectively assign the weight to the index.This study effectively combines the two weighting methods by adopting the combination weighting method to reflect the influence degree of different indicators.This method avoids the drawbacks of excessive subjectivity and possible errors in the algorithm data.It can fully consider the subjective score based on expert experience, and can also modify the weight based on the characteristics of the data itself,ensuring that the weight obtained is more scientific and reasonable.
Combination weights are obtained using the Lagrange multiplier method, as follows:

Here, Wj represents the combined weight, and Wj1and Wj2 represent the subjective and objective weights, respectively.
3 Evaluation method
The AHP-random forest algorithm-grey correlation enhanced TOPSIS approach is employed to quantify the generated comprehensive indicators.The TOPSIS approach is widely utilized as a multi-objective analysis method.In this approach, positive and negative ideal solutions are generated by using preliminary solutions, and the relative distance of each preliminary solution is computed [29][30].The existing solutions are sorted and assessed.However, the standard TOPSIS technique faces the drawback of reflecting only the disparity of the plans and not their resemblance.Therefore, the grey relational analysis (GRA) approach is employed to overcome the limitations of the traditional TOPSIS method since it can handle all the assessment indicators equally [31].The individual stages are presented below.The closeness of sequence sets is referred to and compared to determine whether the link is close or not.The grey correlation coefficient is then used for quantitative characterization.
3.1 Data standardization
We assume N = number of evaluation objects and M =number of evaluation indicators.The sample normalization matrix, Y, is obtained through data normalization.
Data standardization is obtained as follows:
For the positive indicator:

For the backward indicator:

Here, Xij denotes the original data of the indicator,max(Xj) denotes the maximum value of the jth indicator data, min(Xi) denotes the minimum value of the jth indicator data, and Yij denotes the standardized data value.
3.2 Constructing a weighted sample normalization matrix and determining the optimal value
The indicator combination weight, Wj, is multiplied by the sample normalization matrix, Y, to obtain the weighted sample normalization matrix, Z = (Zij)n × m.The maximum value of each indicator is taken as the ideal value.
3.3 Calculating the difference in absolute value between the sample normalized value and the ideal value
The sample standardization matrix value, Yij, is subtracted from the most ideal value, Yi0, and the absolute value, that is, the absolute difference is obtained.
∆ij denotes the absolute difference between Yi0 and Yij,and is expressed as follows:
3.4 Calculating the grey correlation coefficient
The grey correlation coefficient is expressed as follows:
∆min and ∆max represent the minimum and maximum values of all the absolute differences, ∆ij, respectively, ρ denotes the resolution coefficient, 0<ρ<1; generally ρ=0.5.
3.5 Identifying the positive and negative ideal solutions
The grey correlation coefficient is used to generate ideal solutions that are both positive and negative.

3.6 Calculating the Euclidean distance between each assessment item and the ideal solutions, both positive and negative
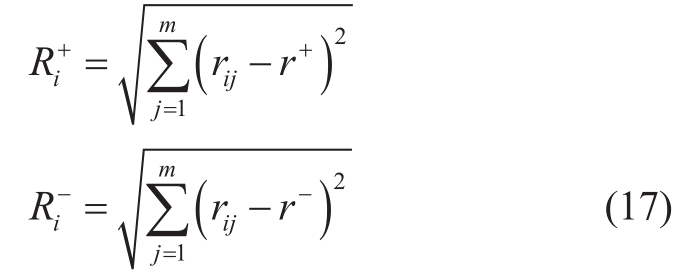
Here, R+i denotes the Euclidean distance from the ith evaluation object to the positive ideal solution and Ridenotes the Euclidean distance from the ith evaluation object to the negative ideal solution.
3.7 Calculating relative closeness (comprehensive score of aging degree)
The relative proximity is calculated as follows:
Ui represents the relative closeness of the ith evaluation object, i.e., the comprehensive score of the transformer aging degree.
The greater the overall score, the greater the degree of aging.
The method used to evaluate the status of an oil-paper transformer is depicted below.
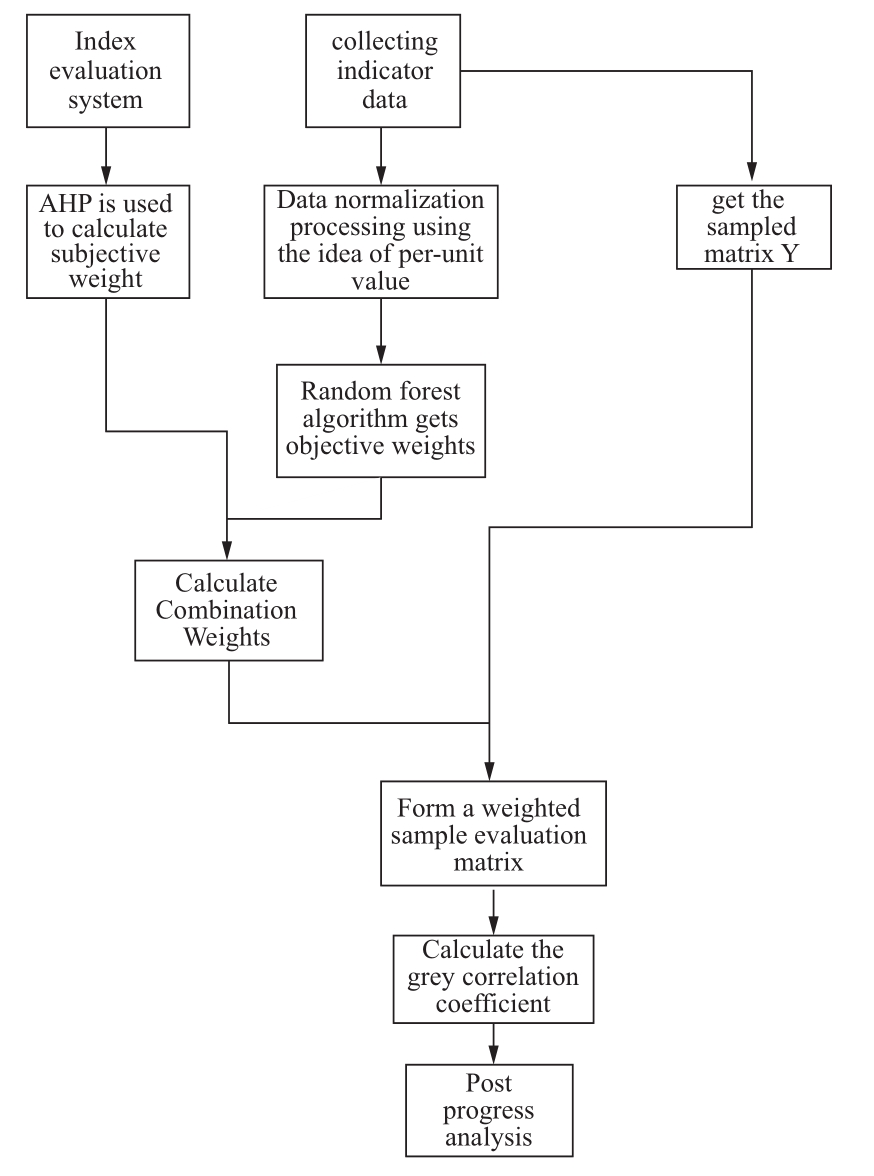
Fig.4 Comprehensive evaluation process of oil-paper transformers
4 Example analysis
The measurement data and the experimental analysis data of more than 70 transformers with different insulation states collected in the past 12 years are used to build a sample database of nine evaluation indexes.We select 10 transformers as data samples for diagnosis.The evaluation process and the corresponding steps of the TOPSIS algorithm are improved by using the AHP-random forest algorithm-grey correlation.The weight of each index is comprehensively analyzed and the 10 are evaluated.We divide the transformer oil-paper insulation state into three states based on the correlation between the furfural content in oil and the transformer operating time in the Preventive Test Regulations for Power Equipment, and the furfural detection content in the regulations.These states aregood insulation state (I), general insulation state (II), and severe aging state (III).The transformer does not require maintenance when the transformer insulation is in state I.When the transformer insulation is in state II, it indicates that it has begun to age and must be monitored.When the transformer insulation is in state III, it indicates that it is at the end of its life, and maintenance must be performed as soon as possible [32][33].
Table 8 depicts the data space composed of 10 transformers and nine characteristic quantities.The left side of the table presents the original data of the transformer,and the right side presents the unit value.The insulation aging condition of the 10 transformers presented in Table 8 is evaluated based on the complete evaluation model of the combined weighted and enhanced grey correlation TOPSIS method.The specific calculation steps are as follows:
Table 1 Evaluation index system of transformer oil-paper insulation aging
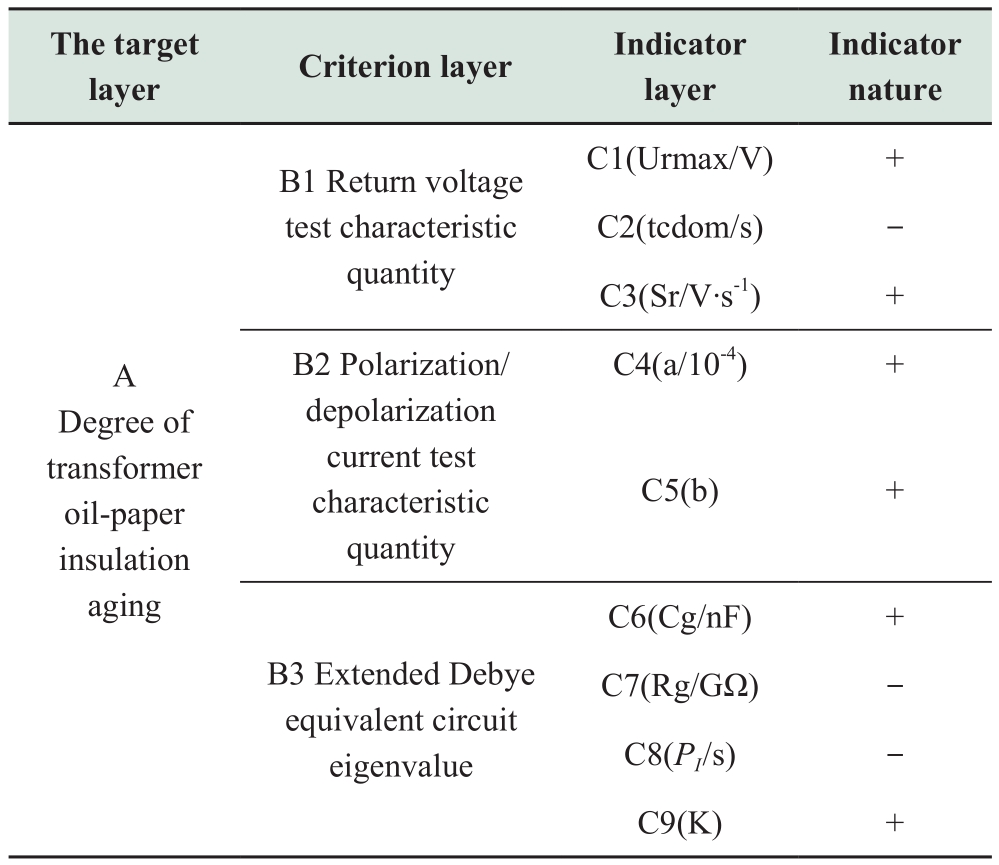
Table 2 Meaning of numbers 1-9
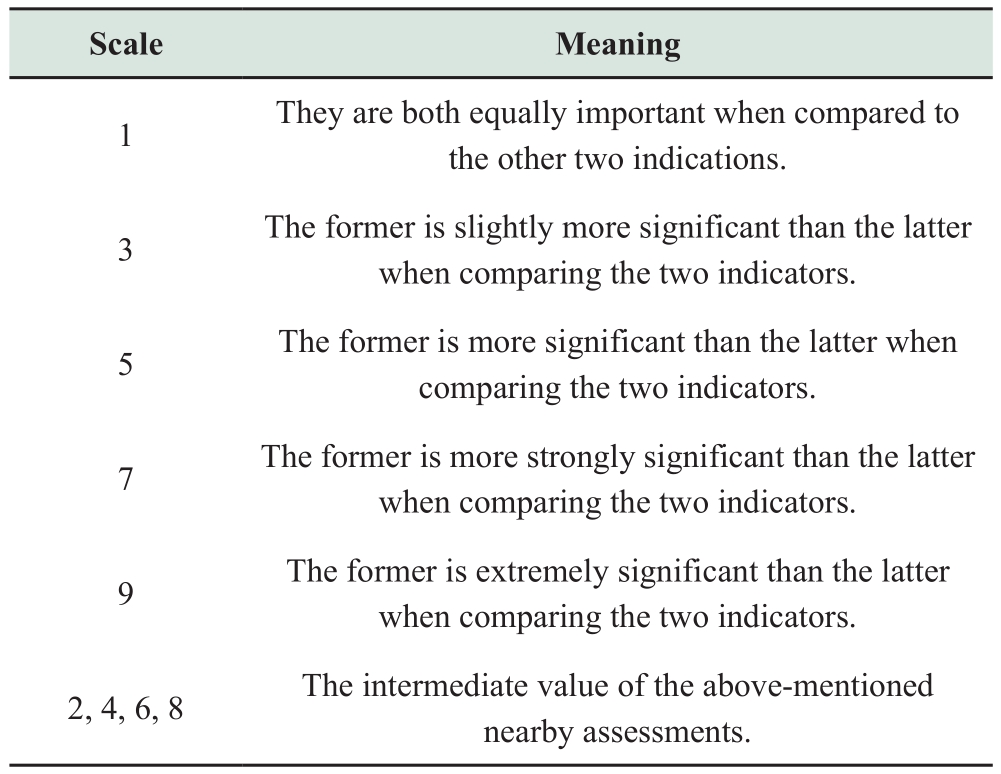
Table 3 Criterion layer index corresponding to target layer judgment matrix

Table 4 Standard value of the random consistency index, RI

Table 5 B1 represents the weight and consistency test results of the judgment matrix for each indicator

Table 6 B2 represents the weight and consistency test results of the judgment matrix for each indicator

Table 7 B3 represents the weight and consistency test results of the judgment matrix for each indicator

(1) Calculating the subjective weight:
① The weights of the criteria level indicators such as B1, B2, and B3 are calculated by using the “sum product method”.
② The consistency test was conducted, and consistency index, CI, was calculated using Equation 4.The random consistency index was obtained as RI=0.52 by looking up the table.The consistency ratio, CR, is calculated using Equation 6.
③ The relative weight of each index table of the index layer is multiplied by the weight of the relevant standard layer to obtain the weight of the largest level (overall goal)of each index of the index layer, as shown in table 9.
(2) Calculating the objective weight:
Based on the concept of standard unit value, the average value of the C1-C9 index, W1= [100 300 18 10 16 80 20 1.7 1.08]of the transformer in good condition is selected as the reference value of the original data in Table 8.This data is divided by the reference value to obtain the right hand side values of Table 8.The logarithmic ratio of C1-C9 in the random forest algorithm is W2= [1 2 1.5 1 3 3 1 2 1 2].The importance sequence diagram of the C1-C9 indicators and importance scores of each indicator are obtained, as shown in Fig.5 and Table 10.The objective weight of each indicator is obtained by normalizing the corresponding score of each indicator (each score is divided by the sum of all score values), as shown in Table 11.
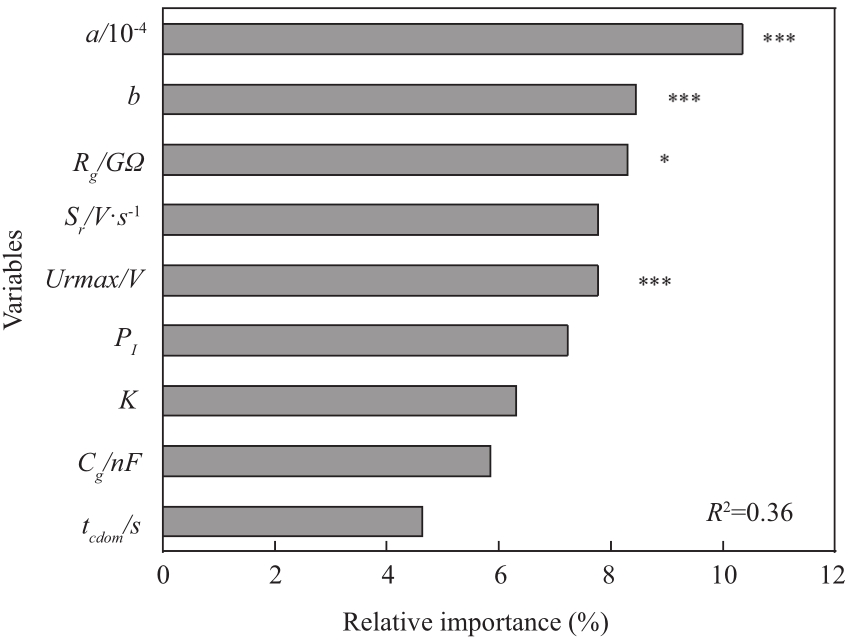
Fig.5 Ranking indicators by importance
(3) Calculating the combination weight:
The combination weight is solved by using Equation 11,and Table 12 presents the results.
(4) The combination weight of each indicator is obtained and is used to generate the weighted sample standardization matrix.
① The sample normalization matrix, Y, is obtained by standardizing the data in Equations 12 and 13.
② The weighted sample normalization matrix.Z is obtained by multiplying the combined weight, Wj, and matrix, Y; the highest value of each index is considered as the ideal value.
(5) Obtaining the Euclidean distance of the positive and negative ideal solutions:
The absolute difference between the standardized matrix value of samples and the optimal value is calculated by using Equation 14.
Equation 15 is then used to calculate the grey correlation coefficient.
The positive and negative ideal solutions of each index are determined by using Equations 16 and Table 13 presents the results.
Equation 17 is used to calculate the Euclidean distance between each evaluation index item and the positive and negative ideal solutions, as shown in Table 14.
Table 8 Raw data of indicators

(6) Finally, the comprehensive score of 10 transformers is calculated.Equation 18 is used to calculate the attachment progress of each transformer.We discover that higher the comprehensive score, higher the aging degree.Table 15 presents the scoring results.
Table 9 Summary of weight results of each indicator layer(AHP method)
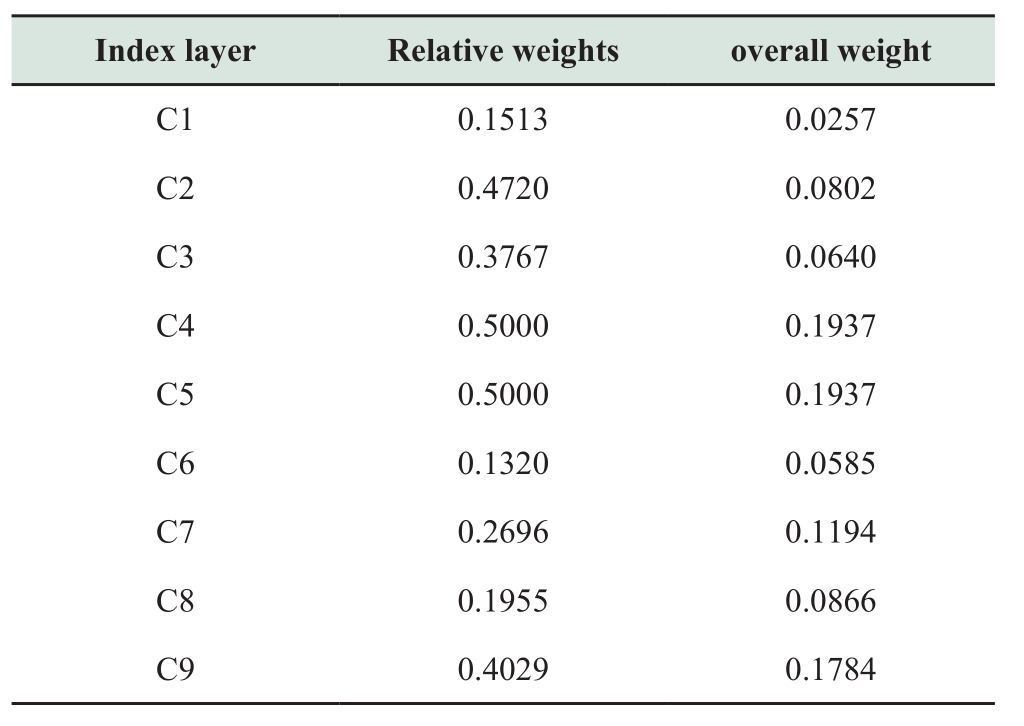
Table 10 Index importance scores obtained using the random forest algorithm
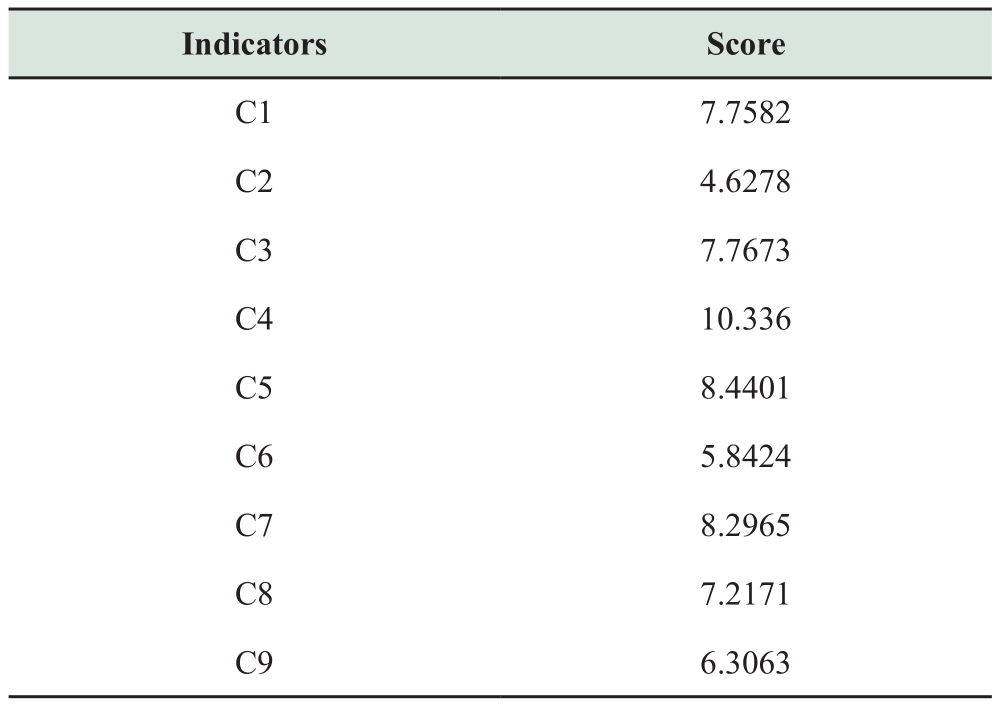
Table 11 Objective weight of each indicator
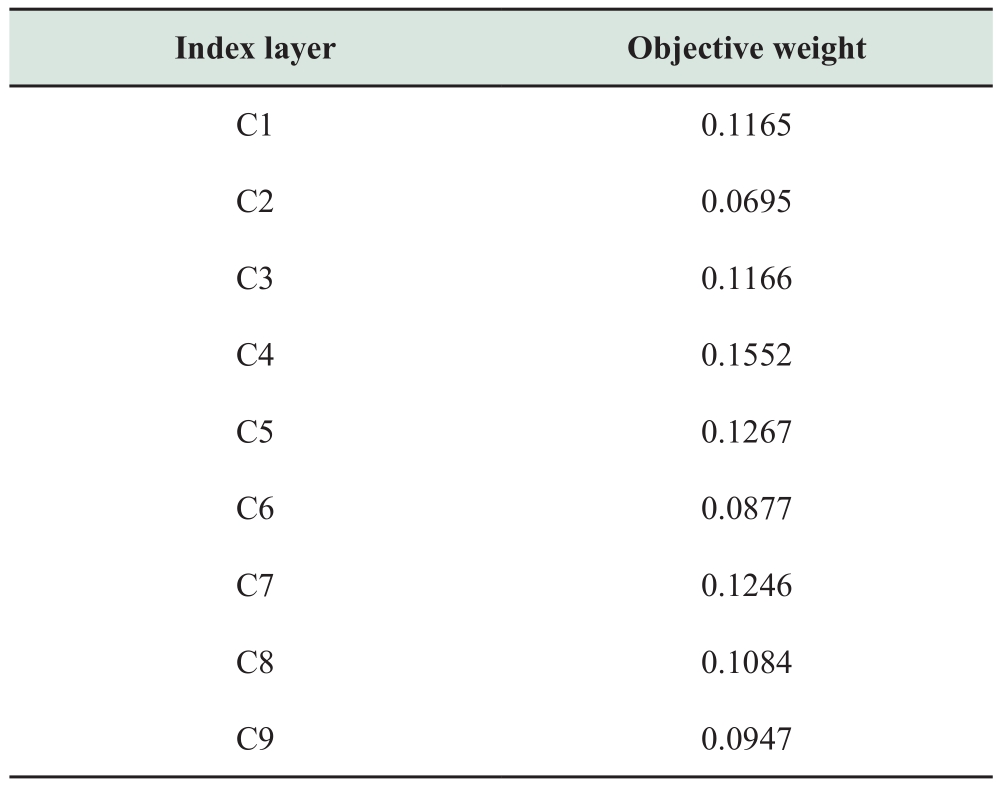
Table 12 Combination weights
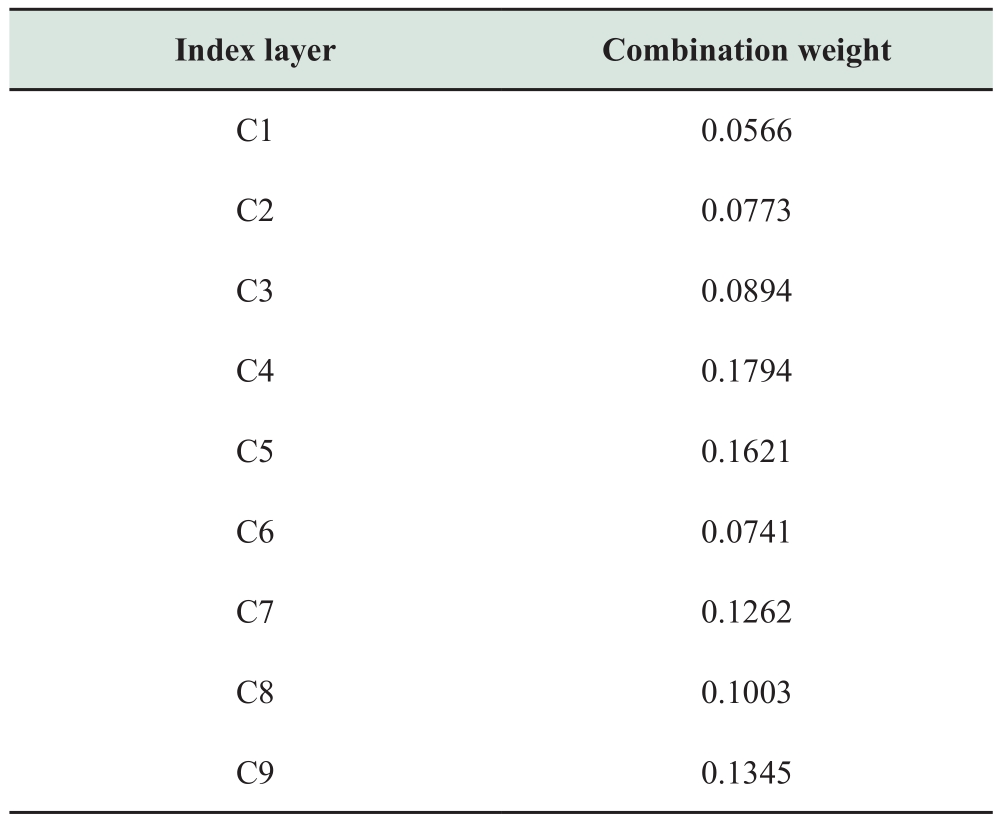
Table 13 Positive and negative ideal solutions
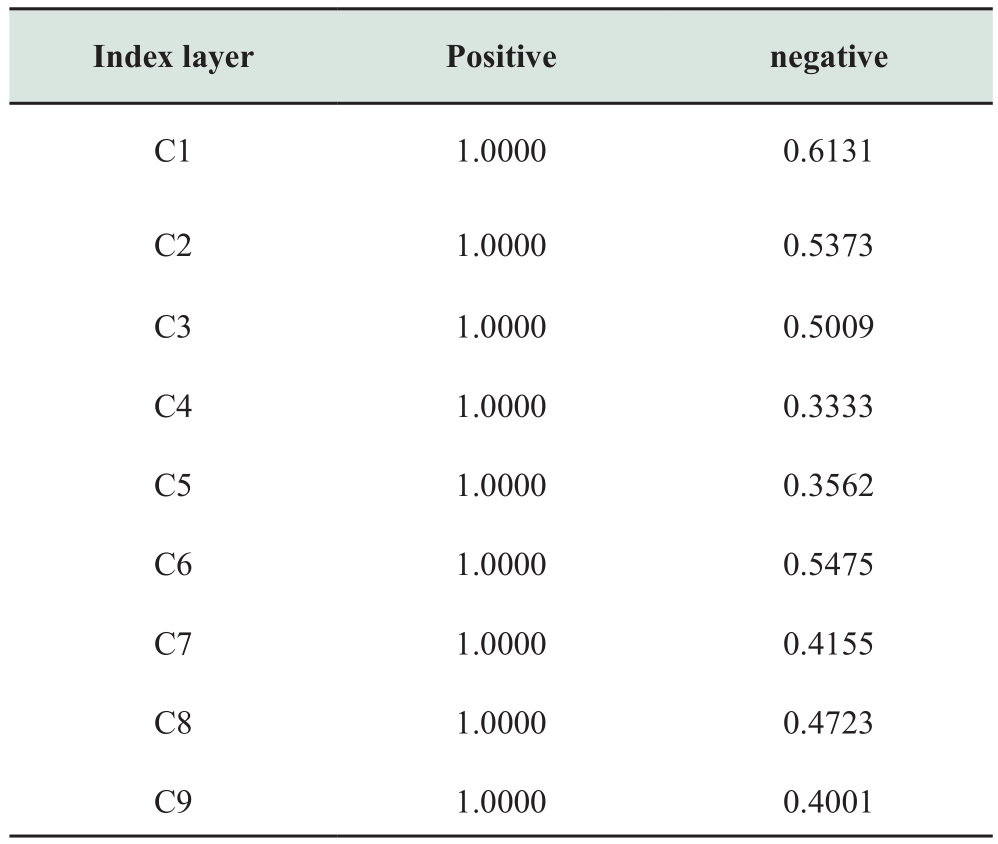
Table 14 Euclidean distances of positive and negative ideal solutions
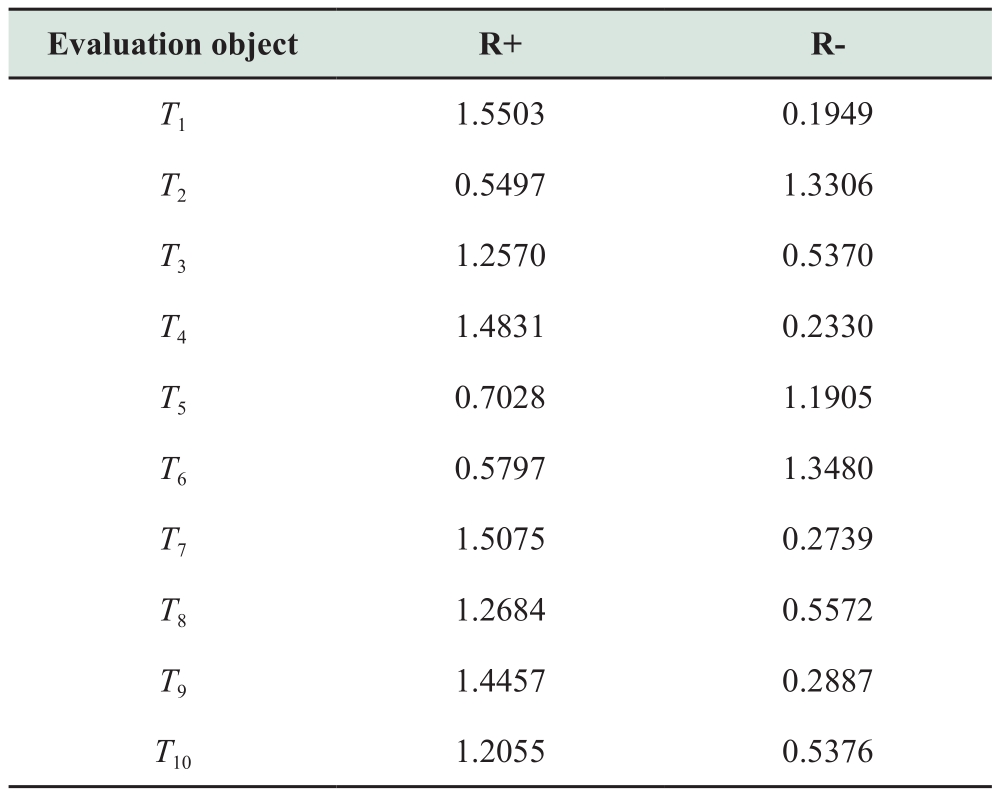
Table 15 Comprehensive evaluation results of the aging degree of each transformer
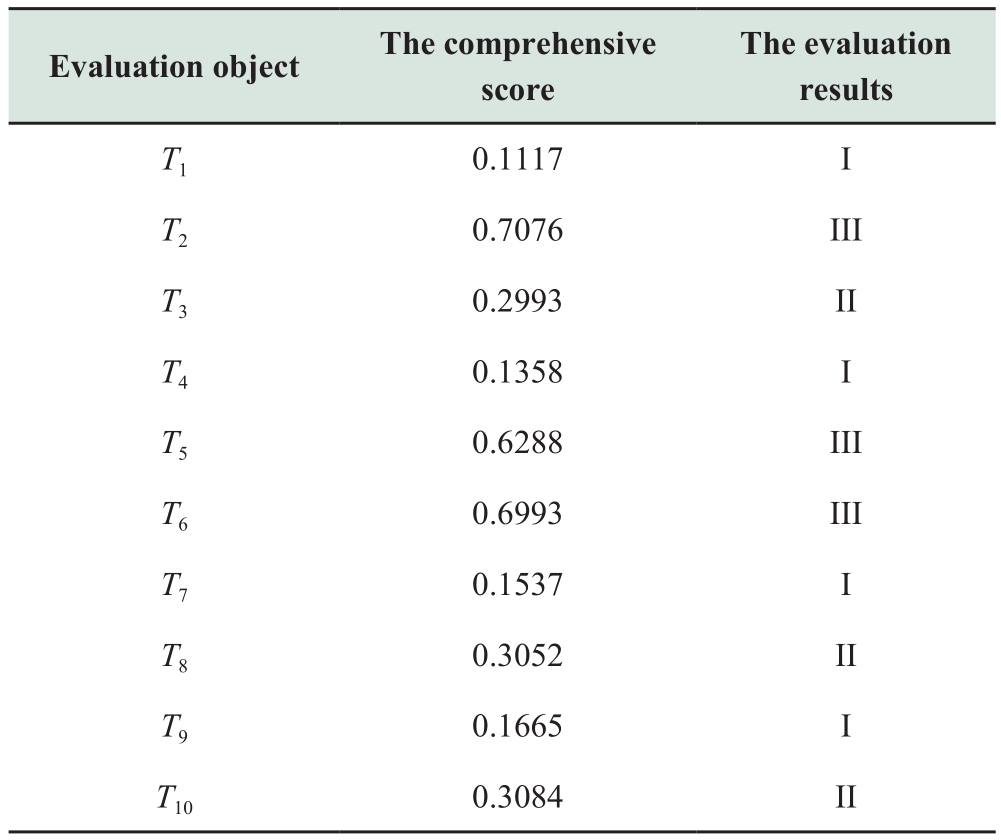
The comprehensive score presented in Table 15 is considered as the outcome of the full assessment of the transformer oil-paper insulation aging.The comprehensive scores of evaluation level I is less than 0.2, evaluation level II is 0.2–0.6, and evaluation level III is more than 0.6.The oil-paper insulation of transformers T1, T4, T7, and T9 is in excellent condition, based on the complete scores.The oil-paper insulation of transformers T3, T8, and T10 is in general condition, and the oil-paper insulation of transformers T2, T5, and T6 is severely aged.Table 4-8 presents the diagnostic findings which were validated using the furfural content detection method and analyzed using the time-domain dielectric response nondestructive testing technique.
Table 16 Evaluation and diagnostic findings of the transformer’s oil-paper insulation state

Table 17 Correlation between operating life and furfural content
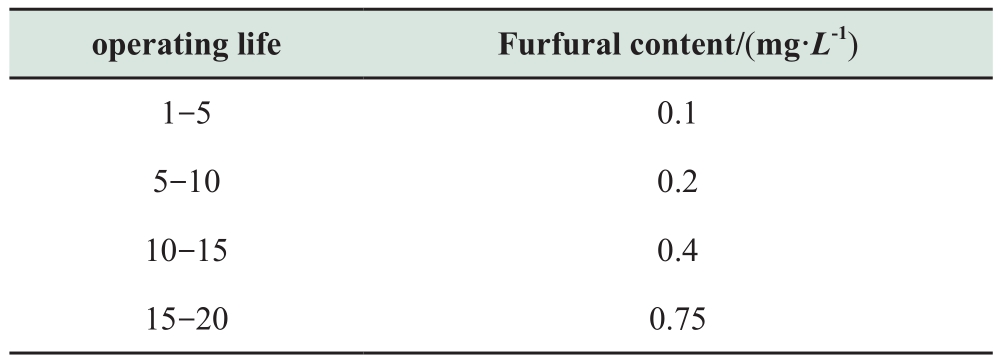
According to the power industry standard DL/T596-1996, the insulation aging is considered to be bad when the furfural content exceeds 4 mg/L and the transformer is in state (III).If the content exceeds table 17, it is generally considered as abnormal aging, which requires tracking detection, and the transformer is in state (II).
The information in Table 17 is compared with the full evaluation findings in Table 16.It is observed that the evaluation results of the 10 transformers are compatible with the results of the furfural content detection and analysis, as well as the real insulation state.Furthermore, there is a large variance in the total scores of the transformers belonging to distinct classes, as shown in Table 9.This comparison reduces the misjudgment of the transformer oil-paper insulation state.Therefore, this assessment approach can be implemented in real-world engineering applications.
In summary, the efficiency and precision of the transformer oil-paper insulation status assessment technique based on the random forest algorithm-combination weighting and grey correlation enhanced TOPSIS method are demonstrated.The viability of employing the indexrelevance value of the random forest algorithm for the transformer data under the unified dimension as the goal weight is also demonstrated.This approach can be employed for the comprehensive diagnosis of oil-pape r insulation using several indicators and different schemes.Furthermore, it presents an effective foundation for future research on the transformer insulation condition as well as maintenance.It can also be used to evaluate multiple indices in other areas.Future works will include more in-depth and extensive analysis in terms of enhancing the evaluation system and dividing the oil-paper insulation state.
5 Conclusion
In this study, we established a comprehensive evaluation model of oil-paper transformers by using the revised TOPSIS approach based on RF-combination weighting and grey correlation.The following conclusions are obtained through experimental analysis:
1) Nine characteristic quantities, which represent the aging of the transformer, are extracted from the polarization spectrum of the recovery voltage, extended Debye model,and PDC curve.An index system is established to evaluate the insulation state of the transformer oil-paper state based on the varying reflection degree of each index for the aging of the transformer.This evaluation strategy presents greater accuracy than the method which uses one or more characteristic quantities to diagnose the state of the transformer.
2) The matrix composed of nine characteristic quantities is normalized to the same dimension by using the per-unit value concept.The objective weight is then obtained by using the random forest algorithm based on the original data.Lastly, the combined weight of each index is obtained by combining the subjective weight obtained by using the improved AHP with the index importance ranking obtained by using the random forest algorithm.This method overcomes the drawbacks of the single weighting method.
3) This paper presents an improved TOPSIS method by introducing the GRA evaluation process.This method overcomes the disadvantage faced by the conventional TOPSIS method, where it can only reflect the gap of the scheme but cannot reflect the similarity of the scheme.A large gap can be observed in the comprehensive scores of the transformers under different insulation states in this evaluation model.This demonstrates that the proposed method can effectively and accurately evaluate the insulation state of the oil-paper transformer under the condition of more complex information.The results of this study present a foundation for future research on the aging state of oil-paper insulation.It can also be used to formulate targeted maintenance strategies for transformers based on the evaluation results.
Acknowledgements
This work was supported by the Natural Science Foundation of the Fujian Province (2021J01109).
Declaration of Competing Interest
We declare that we have no conflict of interest.
References
[1]Fang J, Yang F, Tong R, et al.(2021).Fault diagnosis of electric transformers based on infrared image processing and semisupervised learning.Global Energy Interconnection, 4(06): 596-607
[2]Tran Q T, Davies K, Roose L R, et al.(2020) A review of health assessment techniques for distribution transformers in smart distribution grids.Applied Sciences, 10(22): 1-23
[3]Dong M, Zheng H, Zhang Y, et al.(2019) A novel maintenance decision making model of power transformers based on reliability and economy assessment.IEEE Access, 7: 28778-28790
[4]Mishra D, Haque N, Baral A, et al.(2019) Condition assessment of power transformer insulation using short duration time domain dielectric spectroscopy measurement data.IEEE Transactions on Instrumentation and Measurement, 69(7): 4404-4411
[5]Benhmed K, Mooman A, Younes A, et al.(2018) Feature selection for effective health index diagnoses of power transformers.IEEE Transactions on Power Delivery, 33(6):3223-3226
[6]Prasojo RA, Suwarno, Abu-Siada A (2021) Dealing with data uncertainty for transformer insulation system health index.IEEE Access, 9: 74703-74712
[7]Wang M, Vandermaar A J, Srivastava K D.(2002) Review of condition assessment of power transformers in service.IEEE Electrical Insulation Magazine, 18(6): 12-25
[8]Zhao P R, Chen J R, Zhao W, et al.(2017) Aging state evaluation of oil-paper insulation of transformer based on polizationdepolarizing current method.Insulation materials, China, 50(12):78-82
[9]Gao X H (2020) Analysis and design of transformer insulation evaluation and testing system based on RVM.Fujian Institute of Technology
[10]Peng H D, Dong M, Liu Y, et al.(2012) The recovery voltage method is used to evaluate the aging state of oil-paper insulation of transformer.Power grid and clean energy, China, 28(09):6-12
[11]Li J H, Si W R, Yao X, et al.(2009) Research on polarization/depolarization current technology for aging state assessment of oil-paper insulated transformer.Instrumentation, China, 30(12):2605-2611
[12]Cong H X, Pan H, Hu X F, et al.(2021) Deterioration degreeassessment of multiple sulfides in transformer oil based on the entropy-weight method.IEEE Transactions on Dielectrics and Electrical Insulation, 28(5): 1628-1635
[13]Chen H C, Cai J D (2017) Comprehensive evaluation of transformer oil-paper insulation state based on multi-time domain characteristic parameters.Power automation equipment, China,37(07): 184-190
[14]Wang N, Wang W, Zhang X, et al.(2019) Application of improved analytic hierarchy process in transformer oilpaper insulation condition evaluation.High voltage electric equipment China, 55(12): 187-192
[15]Li S J, Ge Z, Abu-Siada A, et al.(2019) A new technique to estimate the degree of polymerization of insulation paper using multiple aging parameters of transformer oil.IEEE Access, 7:157471-157479
[16]Wang D Y, Zhou L J, Yang Z X, et al.(2019) A new testing method for the dielectric response of oil-immersed transformer.IEEE Transactions on Industrial Electronics, 67(12): 10833-10843
[17]Yu X F, Song Z J, Chen Z X (2016) Study on the time domain dielectric properties of oil-impregnated paper with non-uniform aging based on the modified Debye model.IEEE International Conference on High Voltage Engineering and Application, doi:10.1109/ICHVE.2016.7800922
[18]Wolny S (2015) Aging degree evaluation for paper-oil insulation using the recovery voltage method.IEEE Transactions on Dielectrics and Electrical Insulation, 22(5): 2455-2462
[19]Lin Z Y, Zhang D M, Huang G T, et al.(2019).Research on equivalent circuit of transformer by the method of recovery voltage curve decomposition.Power system protection and control, China, 47(13): 18-23
[20]Saha T K, Purkait P (2004) Investigation of polarization and depolarization current measurements for the assessment of oilpaper insulation of aged transformers.IEEE Transactions on Dielectrics & Electrical Insulation, 11(1): 144-154
[21]Flora S D, Divekar M S, Rajan J S (2017) Factors affecting polarization and depolarization current measurements on insulation of transformers.IEEE Transactions on Dielectrics and Electrical Insulation, 24(1): 619-629
[22]Zhou Y H, Zhang T, Zhang D F, et al.(2016) Using polarization/depolarization current characteristics to estimate oil paper insulation aging condition of the transformer.IEEE International Conference on High Voltage Engineering & Application, doi:10.1109/ICHVE.2016.7800645
[23]Xu Z X, Liao HC (2014) Intuitionistic Fuzzy Analytic Hierarchy Process.IEEE Transactions on Fuzzy Systems, 22(4): 749-761
[24]Tanaka H , Tsukao S, Yamashita D, et al.(2010) Multiple Criteria Assessment of Substation Conditions by Pair-Wise Comparison of Analytic Hierarchy Process.IEEE Transactions on Power Delivery, 25(4):3017-3023
[25]Favieiro G W, Balbinot A (2019) Paraconsistent random forest:an alternative approach for dealing with uncertain data.IEEE Access, 7: 147914-147927
[26]Chen J G, Li K L, Tang G, et al.(2017) A parallel random forest algorithm for big data in a spark cloud computing environment.IEEE Transactions on Parallel & Distributed Systems, 28(4):919-933
[27]Hou J, Li Q M, Meng S M, et al (2019) DPRF: a differential privacy protection random forest.IEEE Access,7: 130707-130720
[28]Zhang K X, Wang J, Zhang W, et al.(2019) Random forest algorithm-based lightweight comprehensive evaluation for wireless user perception.IEEE Access, 7: 173477-173484
[29]Zytoon M A.(2020) A Decision Support Model for Prioritization of Regulated Safety Inspections Using Integrated Delphi, AHP and Double-Hierarchical TOPSIS Approach.IEEE Access,8:83444-83464
[30]Tian G, Zhang H, Zhou M C, et al.(2017) AHP, Gray Correlation, and TOPSIS Combined Approach to Green Performance Evaluation of Design Alternatives.IEEE Transactions on Systems, Man, and Cybernetics: Systems, 48(7):1093-1105
[31]Liu A J, Guo X R, Liu T N, et al.(2019) A GRA-Based Method for Evaluating Medical Service Quality.IEEE Access, 7: 34252-34246
[32]Lin Y D, Wei C, Tao F B, et al.(2019) Aging assessment of oilpaper insulation of power equipment with furfural analysis based on furfural generation and partitioning.IEEE Transactions on Power Delivery, 34(4): 1626 1633
[33]Feng D W, Yang L J, Zhou L W, et al.(2019) Effect of oil–paper–pressboard mass ratio on furfural content in transformer oil.IEEE Transactions on Dielectrics and Electrical Insulation,26(4): 1308-1315
Received: 23 May 2022/ Accepted: 3 August 2022/ Published: 25 December 2022
Fugen Song
sfgalong@163.com
Shichao Tong
XRMJshichao@163.com
Biographies

Fugen Song received the M.E.degree from Fuzhou University, Fuzhou, China,in 2006 and the Ph.D.degree from Fuzhou University, Fuzhou, China, in 2017.He is currently working in the College of Electrical Engineering with the title of associate professor, Fuzhou University, Fuzhou, China.His research interests include the spatial electric field distribution of power system transmission lines and power system voltage regulation technology.

Shichao Tong received the B.E.degree from Wuyi University, Nanping, China, in 2018.He is currently working towards a Master’s degree at the School of Electrical Engineering and Automation, Fuzhou University, Fuzhou,China.His research interests include the reactive power optimization of power system and the insulation aging of transformer.
(Editor Yanbo Wang)
