0 Introduction
Despite the continuous improvement of distributed generation (DG) in distribution networks, the unpredictability of its output leads to a decline in voltage quality and operation economy, thereby limiting DG development [1].Currently,there are two solutions to this problem.One is to increase the adaptability of the logistics network by employing energy storage (ES) to reduce DG’s randomness and peakto-valley difference and improve network flexibility [2,3].The other is implementing active cyber control to optimize the system and take advantage of the capabilities of existing physical networks, i.e., creating a cyber-physical system[4,5].There are two approaches, which target primary and secondary regulation capabilities, and both require increased investment in equipment [6].Due to the source,network, and load, it is essential to coordinate equipment configurations on cyber and physical systems for reliable and cost-effective DG adaptation.
Research on ES optimization planning for active distribution networks can be divided into two scenarios.In the first method, the system adapts ES when the access location and capacity of DG are known, and the regulating ES suppresses the fluctuation of DG.In study [7], the charging and discharging power of the ES was optimized in consideration of market transaction revenue and network loss cost in order to determine the ES’s capacity and rated power.A study [8]demonstrated that the ES configuration could significantly increase the penetration of photovoltaic(PV).In study [9], the configuration and operation of ES wereoptimized with the PV abandonment penalty cost in mind.
Another scenario is the configuration of ES and DG in collaboration.In study [10], the location and capacity of PV, wind power, and ES were jointly optimized with revenue and expense considerations in mind.The final findings demonstrate that the coordinated configuration of ES and DG can significantly improve the operational efficiency of the distribution network.In study [11], the capacity was optimized by PV penetration by minimizing the total income.In the studies above, centralized control was implemented, and centralized regulation increased equipment investment in communication systems; however,this was not factored into the cost, thereby diminishing the model’s validity.
Several researchers have analyzed the positive impact of active regulation on DG and coordinated the planning of DG and a cyber control system.In study [12], the impact of control on DG was examined.The investigation revealed that reactive control influences the PV configuration.Other study [13]developed a theoretical framework for coordinated cyber and physical system planning.Consideration was given to the impact of the controlling fault, and a coordinated DG and cyber system planning method were proposed.
In studies above [7-13]on collaborative planning of DG, ES, and cyber systems, bi-level optimization was predominantly used to emphasize the impact of operation control.However, the uncertainty of DG was not adequately considered.The prediction error was substantial due to differences in prediction conditions and equipment.Ignoring uncertainty compromises the credibility of planning outcomes.Most scheduling models use robust optimization to account for uncertainty [14,15]; It is neither cost-effective nor practical to make PV output fully robust and controllable via the ES device.In large-scale PV power fluctuations, other emergency control measures, such as machine shutdown or load reduction, must be implemented to meet the power balance requirements.
In this study, a coordinated configuration method for cyber and physical systems was developed in order to examine distribution networks with high PV penetration.Specifically, the location and capacity of ES and the location and number of active regulation terminals are variables, and the objective is to achieve comprehensive economic optimization.A model and solution method based on chance-constrained programming were investigated,Considering the unpredictability of predictions.The method provides a flexible and cost-effective strategy for equipment configuration, which is advantageous for enhancing the accommodation capacity.
1 Configuration model based on chanceconstrained
With access to DG, centralized control of DG and ES can accommodate operational constraints and make operations more cost-effective.The objective is to optimize the ES and control equipment to optimize investment and operational economies.DG is configured to operate at maximum active power, while reactive power can be adjusted to maximize economic benefits.In contrast, ES’s active and reactive power can be controlled, and the speed of regulation is quick.ES and DG have different effects on the network, operation economy, and investment cost and are interdependent [16].In addition, the configuration is affected by load, DG uncertainty, and the cost of the equipment.The uncertainty of distributed generation (DG)and load impacts not only the operation state of the system,including voltage and network loss, but also the viability of the planning outcomes.
Consequently, in this section, a bi-level equipment coordinated configuration model based on robust interval control and taking uncertainty into account is developed.The objective of the model’s upper level is to optimize the selection of active control points, ES capacity, and ES power using comprehensive economic optimization.The lower level considers the chance-constrained probability level of voltage control and simulates the operation in a centralized control mode, with the optimal operation economy as its objective.The model's overall structure is depicted in Figure 1.
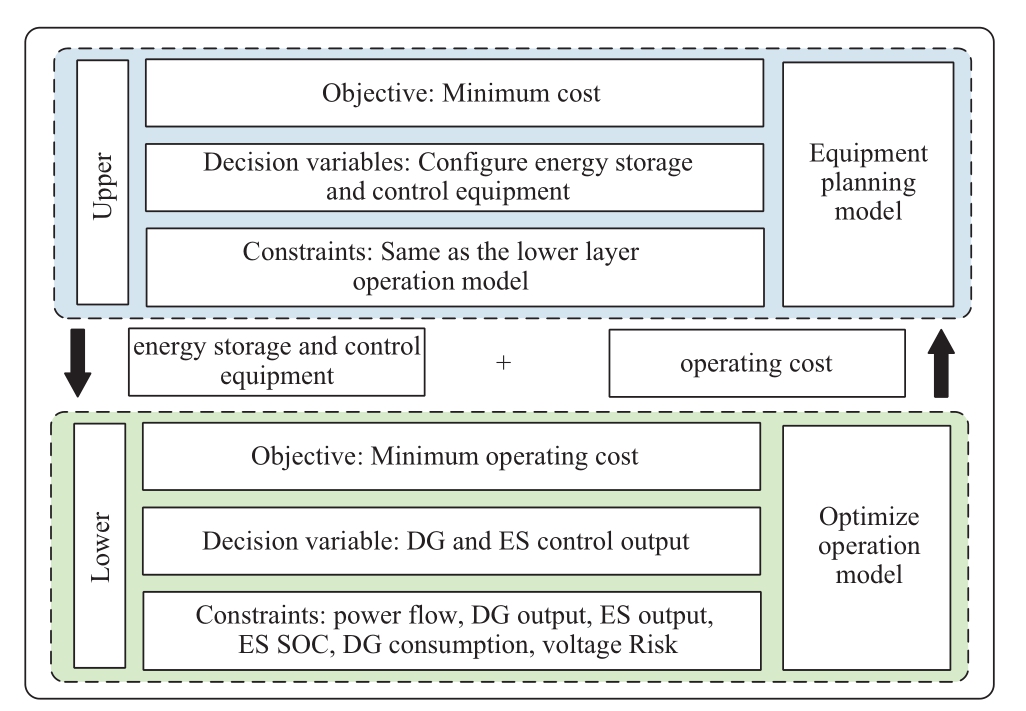
Fig.1 General framework of model
1.1 Equipment planning model
1.1.1 Decision variables
In this model, the control variable is the participation of the node’s distributed resources in control, ES capacity, andES power, as expressed by the matrix in Equation (1).

X is the configuration variable matrix of cyber control and ES, N is the number of distribution network nodes, and X1i represents the control selection (1 representative node i is taken as a controllable node and 0 representative node i as an uncontrollable node), and X2i and X3i are positive real numbers representing the ES capacity and rated power at node i, respectively.The configuration position of ES is all controllable nodes, meaning that the ES capacity and power at uncontrollable nodes are 0, and the control point selection must satisfy Equation (2).
XCDG,i and WDG,i represent whether the i node is the DG control selection point or the DG access point.Under specific load and PV conditions, the objective of the upper optimization is to achieve the optimal comprehensive economy, with the economic cost consisting of fixed and variable costs [17].The fixed costs include the cable cost of the cyber side, the terminal cost of the physical side, and the ES investment cost.The figure shows that variable costs include network loss and ES operation and maintenance.
1.1.2 Objective function
The objective function f1 consists of fixed cost and variable cost, while coefficient coordinates planning and operation.
The fixed costs include cable construction, cyber terminal construction, and ES investment costs.The variable costs include network loss and maintenance costs.Assuming that the communication between the terminal and control center uses a star communication network, the mathematical model is expressed as follows [13]:
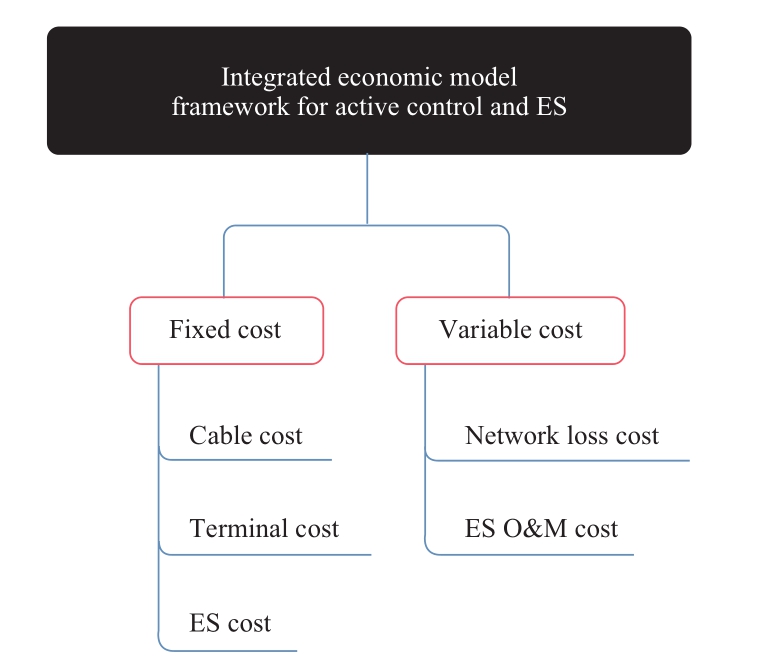
Fig.2 Economic model for control and ES
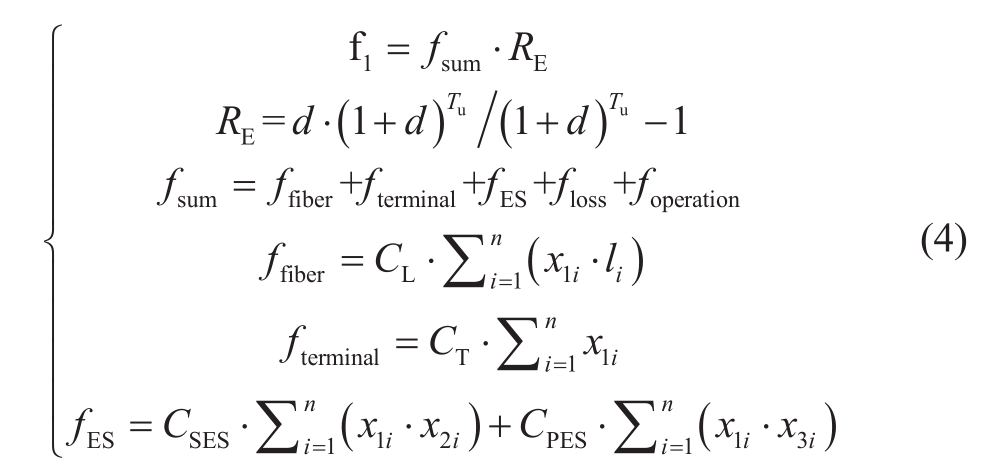
In Equation (4), fup is the equivalent annual cost, fsum is the total cost, RE is the present value to the equivalent annual coefficient, d is the discount rate, Tu is the economic service life, ffiber is the cable configuration cost, fterminal is the control terminal configuration cost, fES is the ES investment cost,floss is the network loss cost, foperation is the ES operation and maintenance cost, CL is the unit length cable configuration cost, li is the distance between the node i and the control center, CT is the single cyber control terminal equipment cost, and CSES and CPES are the ES unit capacity and unit power cost.Parameter’s detail can be found in [13].
1.2 Optimized operation model
1.2.1 Decision variables
The risk of voltage violation is a significant indicator of operational security.Nonetheless, if all node voltages are strictly constrained within the constraint range, the investment economy is poor [18].Chance-constrained programming can improve DG’s operational economy and consumption capability at an acceptable level of risk to achieve a balance between security and economy by using the risk of voltage violation as the constraint and the consumption capability of DG.Consequently, a model of collaborative optimization between DG and ES was developed.According to Equation, its decision space is the operation matrix Y of DG and ES with typical daily data.
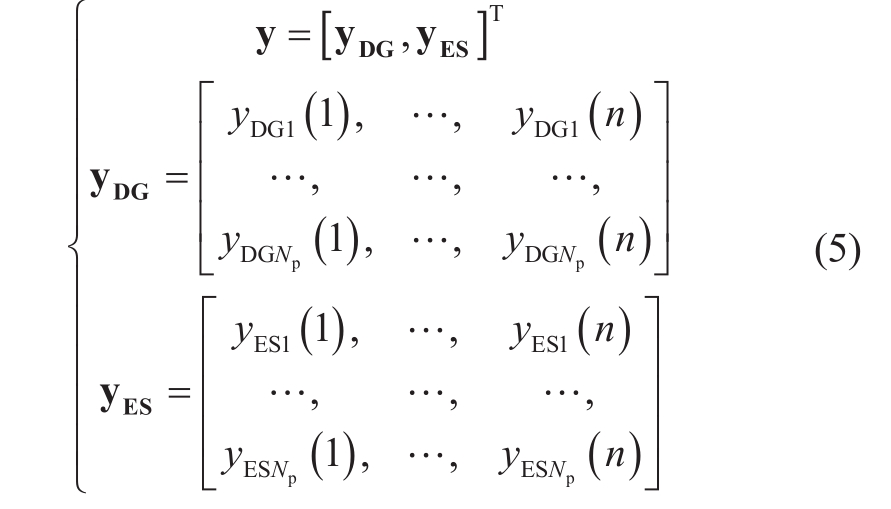
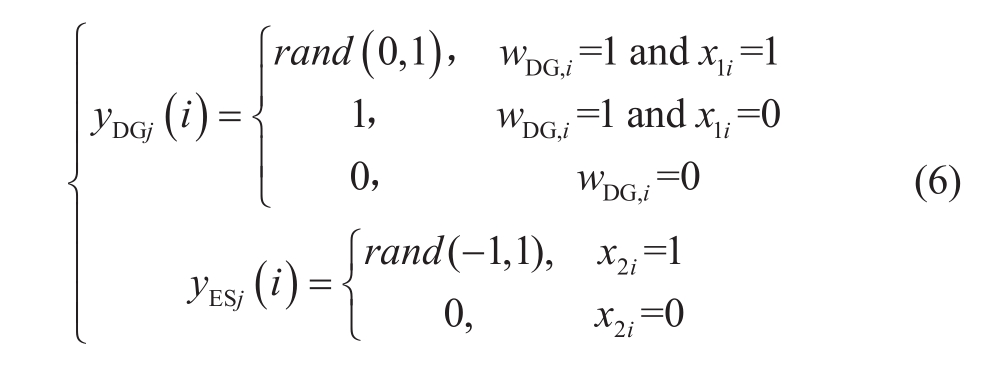
In Equation (5), yDG and yES represent the operation matrices of DG and ES, respectively.Np is the number of scheduling cycles.YDGj(i) represents the output ratio of DG at node i in the scheduling cycle j, as shown in Equation(6).YESj(i) represents the output ratio of ES at node i in the scheduling cycle j, and the value range is [−1,1].It is assumed that DG and ES adopt a constant power factoroperation mode.
1.2.2 Objective function
The objective function f8 consists of loss cost and operation cost.
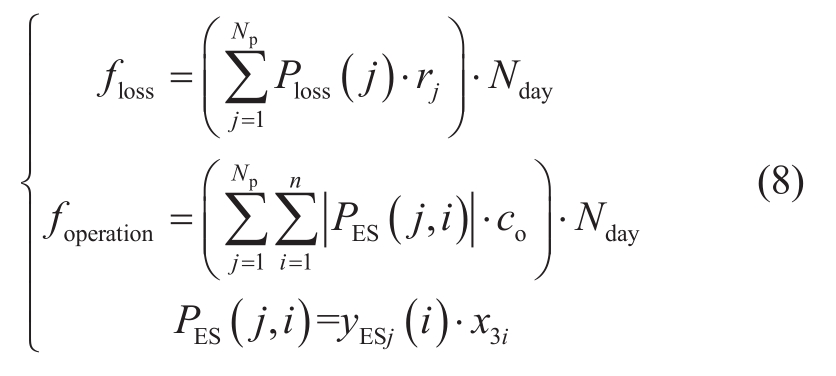
Nday represents the total number of days of simulation days.Np represents the number of scheduling cycles, Ploss (j)represents the net loss in cycle j, and rj represents the cost of scheduling cycle j. co represents the operating cost per unit of ES power, and PES (j,i) represents the ES operating power of the i node during the j scheduling cycle.
1.2.3 Uncertainty modeling
As shown in Equation (9), the uncertainty of DG and load is represented by an envelope model [19].

In Equation (9), P*DG and P*L represent the predictive values of DG output and load, respectively.PDG and PL represent the actual value matrix of DG output and load,respectively.The uncertainty-aware source-load operation data are generated by sampling within the uncertainty range,and α is the uncertainty amplitude.The network loss cost is calculated using an Equation based on the DG and load data.
1.2.4 Constraint condition
(1) Power
The power flow within the different scenarios, considering the uncertainty of the source and load, must satisfy the power balance constraint, which should be verified.

Pi and Qi are the active power and reactive power of node i considering the outputs of DG and ES, respectively.Ui is the voltage of node i. Gij and Bij are the conductance and admittance of branch ij, respectively.δij is the phase difference of branch ij.
(2) DG output
The output ratio of DG should not exceed the value predicted theoretically.Equation (11) displays the output constraint.
(3) ES output
(4) ES SOC

SOCi(t) is the SOC of ES at node i of time t. SOCi,min is the minimum state of charge of ES at node i.Δt is a scheduling cycle time.
(5) DG consumption
The DG penetration is the ratio of DG output to total load power.Considering the availability of high-proportion distributed PV, the penetration estimate for this study was greater than 45 per cent.

ξ is the penetration of DG.PDG(j,i) and P*DG(j,i) are the predicted power and output of DG at the i node in the j scheduling cycle, respectively.A mathematical model of PV active control and ES planning based on chance-constrained programming is presented using the preceding modelling.
(6) Voltage risk
If the network operates at an acceptable risk level, its operational economy will be enhanced compared to robust model.To guarantee the voltage level, a coordinated model of DG and ES based on chance-constrained programming takes voltage violation probability risk as a constraint.Chance-constrained programming permits the planning decision not to meet the constraints to a certain degree.However, the probability of meeting the constraint conditions must not fall below a specified confidence level.The constraint conditions in conventional optimization should remain flexible to reach a reasonable compromise between optimization and constraint satisfaction [20].Regulating DG and ES prevents voltage violations on the network.The risk of voltage violation is depicted by Equation (15).
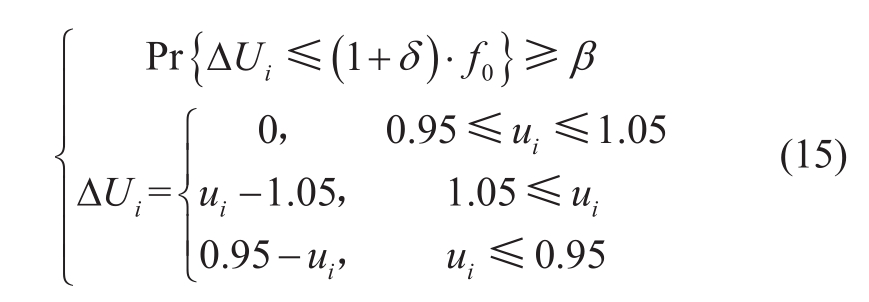
In Equation (15), f0 represents the voltage violation risk without uncertainty, δ is the robust factor, and ΔUi represents the voltage violation risk of node i.The fluctuation’s uncertainty will increase the likelihood of voltage fluctuation.The expected value of f0 can be calculated through sampling without considering risk.After considering the fluctuation’s risk, the voltage risk may be calculated using the simulation probability with the supplied empirical parameters δ and β.Probability is computed utilizing time-series statistics.The lower-level model can be expressed as

2 Resolution algorithm and test case
2.1 Algorithm and procedure
The proposed coordinated configuration model is an example of a nonlinear model that can be solved by differential evolution [21].The planning operation optimization model is implemented by utilizing a two-layer algorithm.The specific solution procedure consists of the following steps:
(1) Initialization: finish initializing the differential evolution algorithm in the optimization space for the upper decision variables.
(2) Lower-level model solution: determine the optimal lower-level decision variables and operation cost.Here,uncertainty modeling and opportunity constraints are considered as operation constraints.
(3) Calculation of the upper model: based on the optimal result of the lower model, calculate the total operation cost while considering the construction cost.
(4) Iteration: selection, generation, and update of the differential evolution algorithm
(5) Comparisons: choose to compare and identify the optimal outcome.The exact procedure is depicted in Figure 3.
2.2 Simulation parameters
The IEEE 33 bus case was analyzed to validate the proposed method.As depicted in Figure 4, the total system load was 3 MW, and PV systems with a rated capacity of 1.75 MW were installed at nodes 18, 22, 25, and 33.The 24 hours in a day were divided into 96 15-minute control cycles.Figure 5 shows that PV and load data are selected from typical sunny days.The uncertainty amplitude parameter is set to 5%.
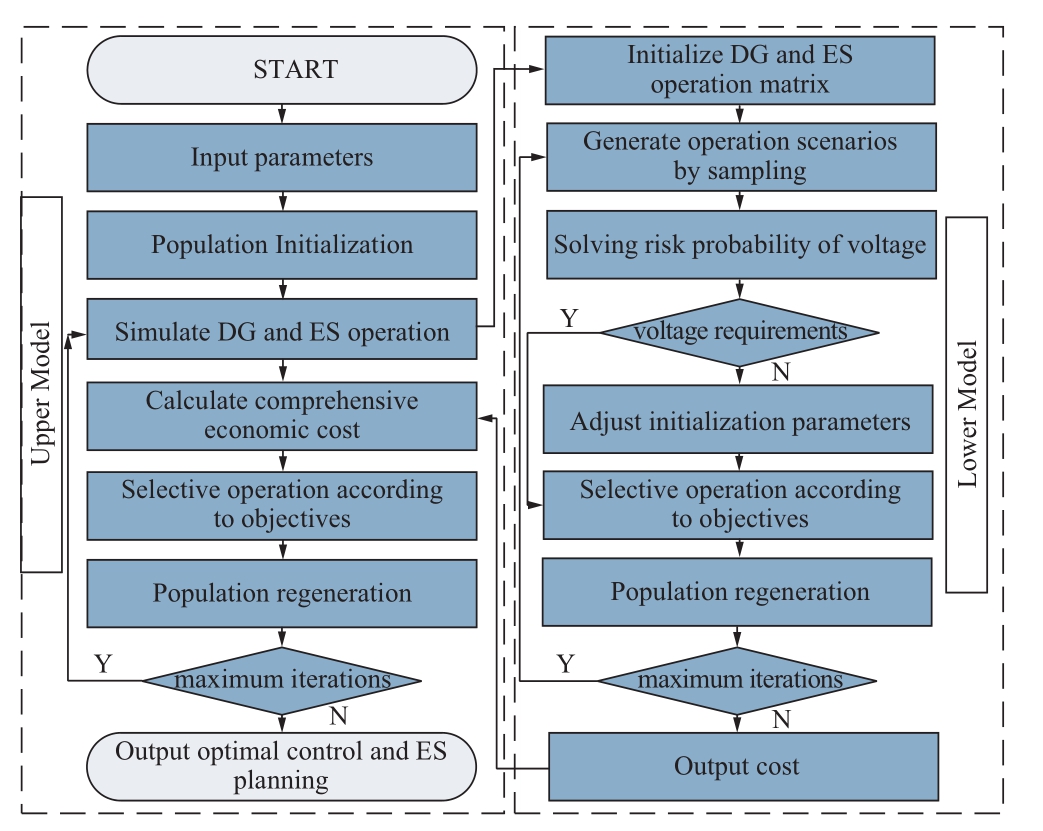
Fig.3 Solution flow chart
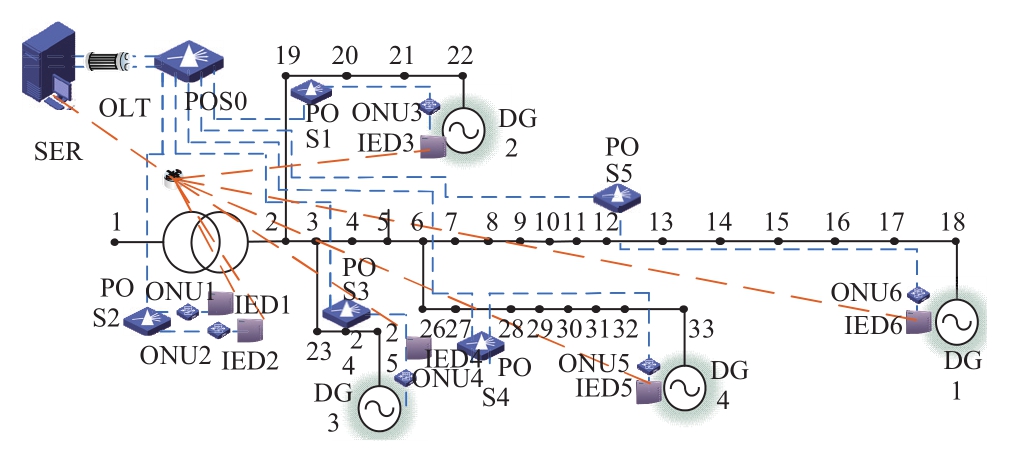
Fig.4 33-node simulation system
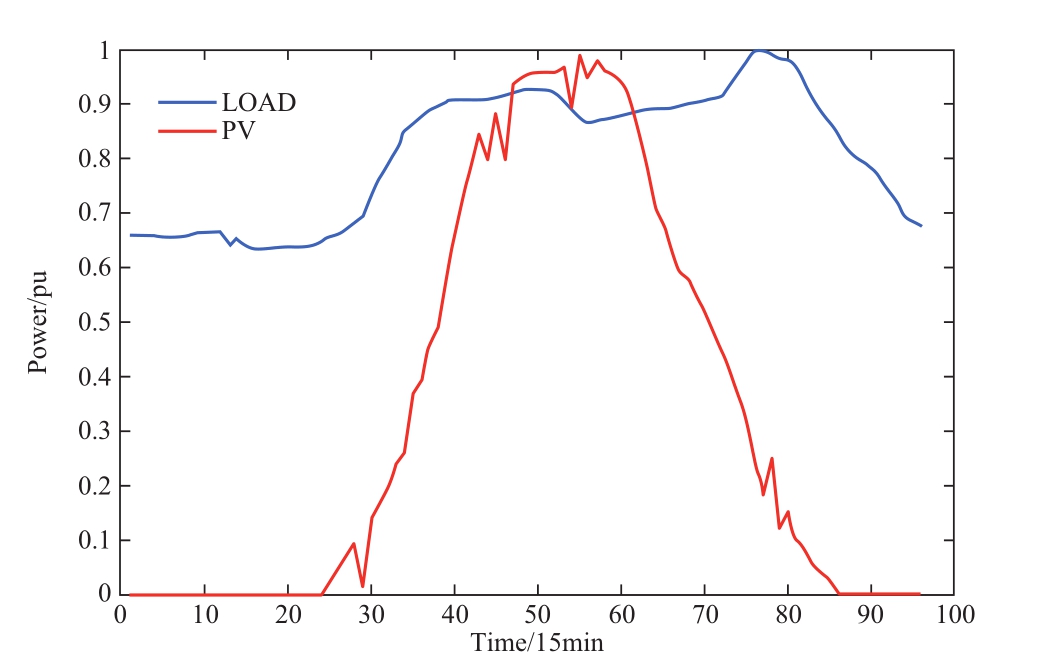
Fig.5 PV and load power curve
Tables 1 and 2 present the distances between the nodes and the control center and the cost parameters.Table 3 displays the differential evolution algorithm’s parameters.
Table 1 Distance (km) between node and control center
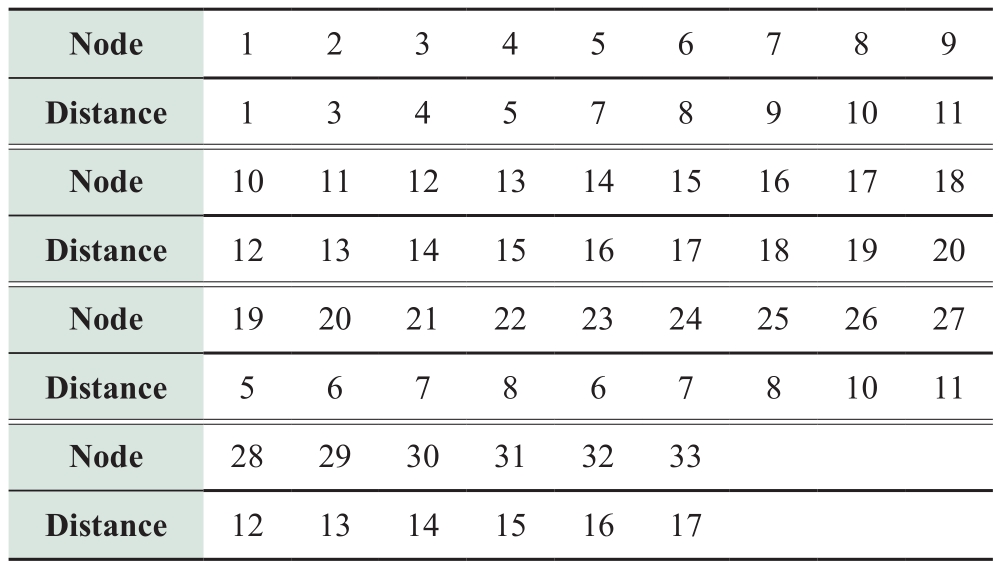
Table 2 Cost parameters of example
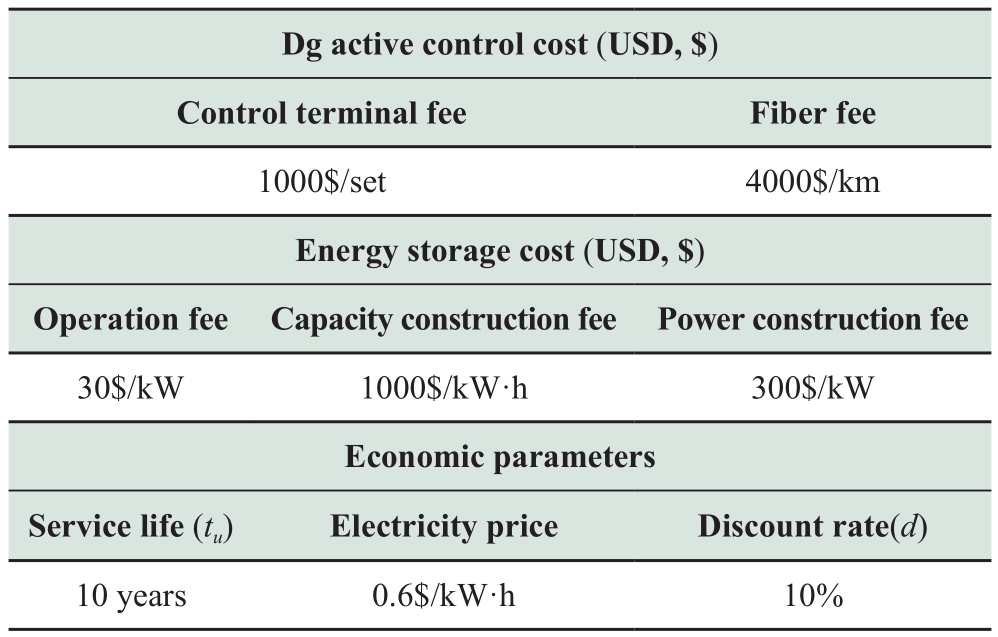
Table 3 Differential evolution parameters

3 Results and analysis
3.1 Case result
First, the confidence interval is set to 100 per cent,and then the model is converted into a robust optimization model [22].The algorithm is utilized 50 times to solve the established model.Results indicate that convergent optimization occurs after 100 iterations.One result show that nodes 18, 22, 25, and 33 must configure cyber control equipment, not the ES.The analysis indicates that the total annual cost is $2,680,200, which includes $35,200 for cyber configuration and $2,645,000 for network loss.The maximum risk of voltage violation is 0.0882, with a mean of 0.0243.This outcome is a consequence of the high investment cost of ES.Therefore, the investment cost of ES cannot be recovered if only the cost of network loss is reduced.Under the premise of satisfying penetration, the risk of voltage violation and network loss can be reduced by dispatching DG.Consequently, the ES system is not configured according to the optimization outcomes.
Based on the comparison and analysis of the indicators before and after the configuration of the cyber control equipment, the network loss cost is $4,900,000, the maximum voltage limit risk is 0.1304, and the average value is 0.0417 when the equipment is not configured.Figure 6 illustrates that the network loss cost is reduced by 46.02 per cent within the optimization scheme, while the voltage violation risk is reduced by 41.72 per cent.Additionally,the penetration can reach 45.69 per cent.Active control can significantly improve the economy by reducing the risk of voltage violation and increasing market share.
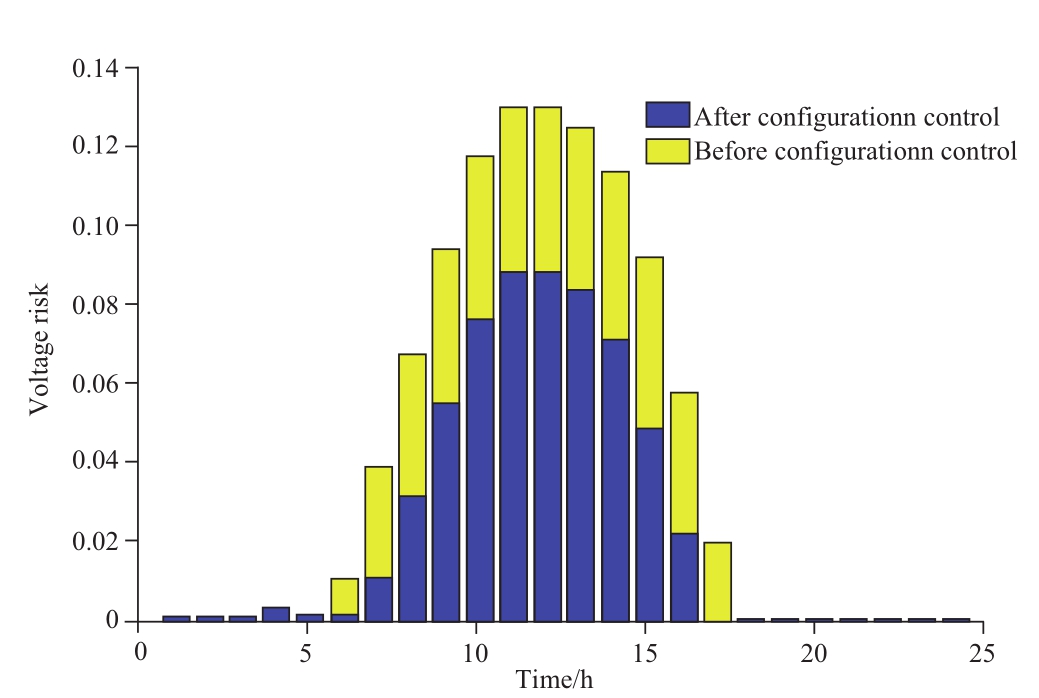
Fig.6 Voltage risk with control configuration
3.2 Risk level analysis
A control group with an acceptable risk level of 0.1 is established to compare the effects of various good risk levels.The current plan is to install cyber control equipment at nodes 18, 22, 25, and 33 and the ES, according to Table 4.Therefore, ES must be configured to mitigate the risk.
Table 4 ES configuration with low risk level

Cyber control and ES have a total annual cost of$5,589,100, comprised of $43,100 for cyber system configuration, $1,883,000 for network loss, and $3,663,000 for ES.Figure 7 displays that the maximum value of voltage violation risk decreased from 0.0882 to 0.0511, a decrease of 42.06%, while the average value decreased from 0.0243 to 0.0173, a decrease of 28.81%.Once the acceptable level of risk has been decreased, the system requires a greater economic investment to reduce risk.
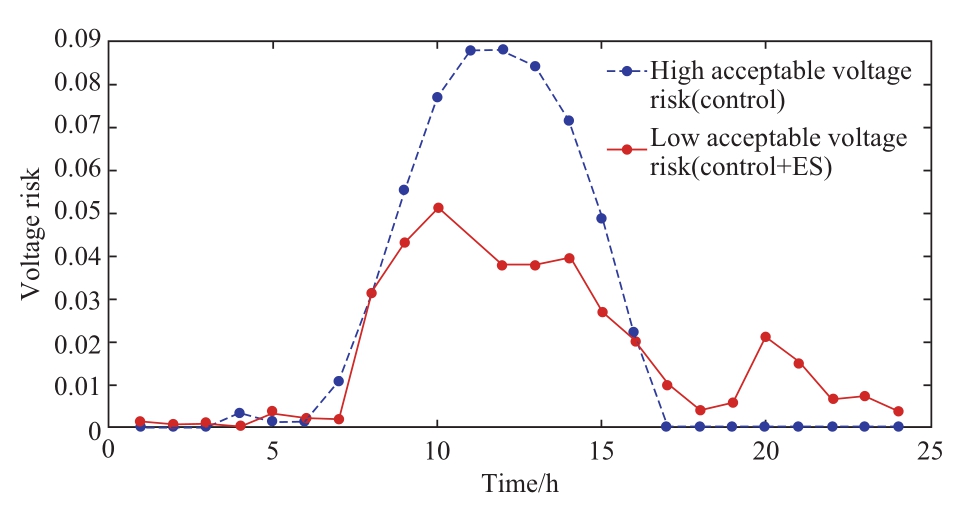
Fig.7 Voltage risks under different risk levels
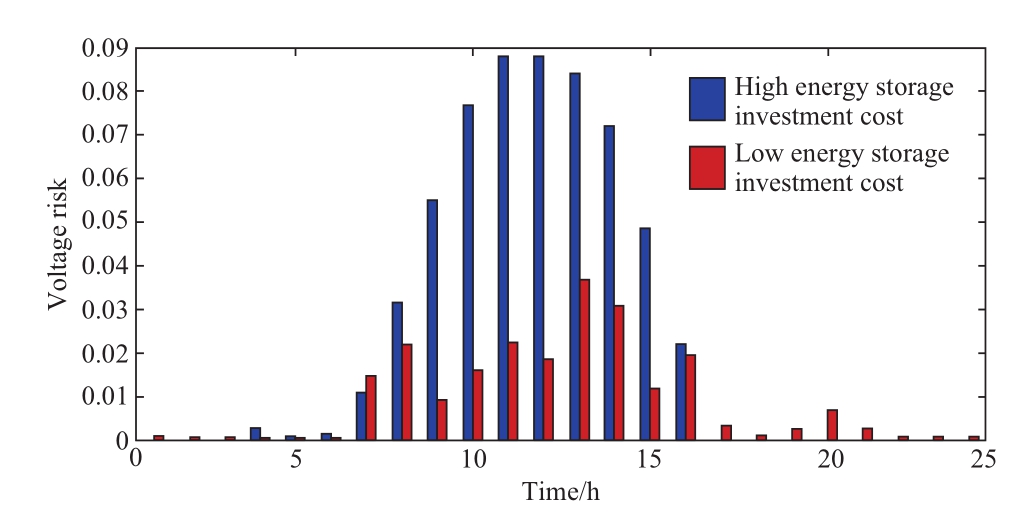
Fig.8 Voltage risks under different ES costs
3.3 ES price analysis
Once the ES investment cost is reduced to $500/kWh,the following cyber control layout and ES configuration optimization outcomes will be realized: For Nodes 18, 22,25, and 33, it is necessary to install cyber control equipment and ES.Table 5 outlines the particular parameters.
Table 5 ES configuration under low ES cost

In this scenario, the total annual investment and operation cost is $3,360,000.The network loss cost is $1,000,000, cyber control equipment costs is $43,100,000,000, and the investment and operation cost of ES is $1,830,000.In contrast to the high ES investment cost scenario, as shown in Table 6, the total investment cost is comparable.However, the allocation of ES reduces the cost of network loss by 58.32%, from $2,645,000 to $1,100,000.Maximum voltage violation risk fell by 64.74 per cent from 0.0882 to 0.0311.As shown in Figure 8, the average risk of voltage violation decreased by 60.74 per cent from 0.0242 to 0.0095.
Table 6 Different ES configuration costs (USD, $)
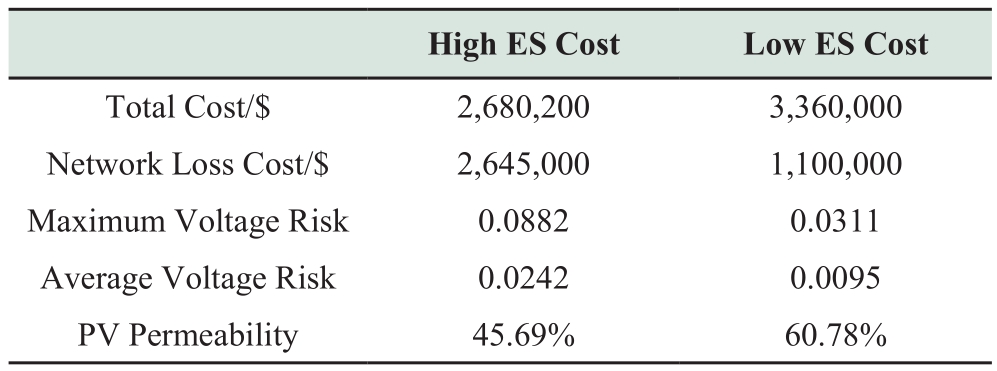
Furthermore, the ES configuration increases PV penetration by 15.09%.The decrease in the cost of ES is advantageous for the ES configuration, as it reduces the risk of network loss and voltage violation and increases penetration.The coordinated arrangement is capable of producing a synergistic effect.
3.4 Chance-constrained probability analysis
A simulation of confidence probability from 80% to 100% under low ES cost parameters was conducted to analyses the impact of the chance-constrained confidence interval on the ES configuration.Figure 9 depicts the system costs under various confidence probabilities.The cost of the configured equipment rises with increasing confidence probability, and there is a clear inflexion point at 91%.Currently, the price is $3.01 million, which is 10.41% less than the cost of the robust configuration ($3.36 million).Therefore, 91% can be selected as the optimal level of confidence.
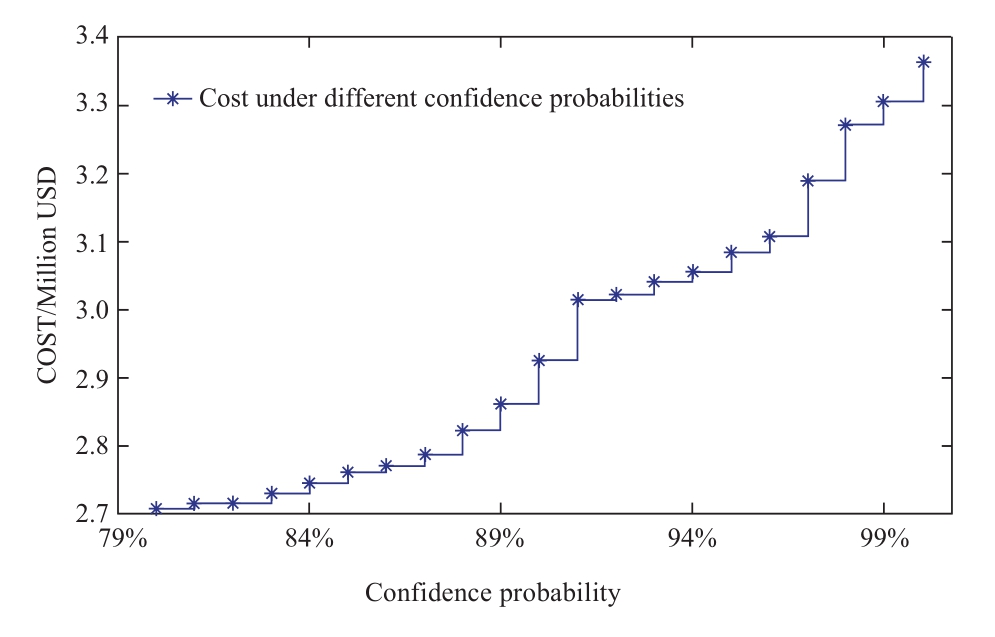
Fig.9 Costs under different chance-constrained probability
On this basis, two confidence levels of 91% and 100%are established, and the relationships between cost and voltage risk are determined based on their respective probabilities.Figure 10 demonstrates that the voltage risk and expense are typically mutually restrictive.A more considerable voltage fluctuation improvement necessitates a larger ES capacity and a higher annual investment cost.Likewise, the greater the confidence level, the greater the likelihood that the voltage risk is less than the expected value.When the investment cost is close to $3 million,increasing the investment cost on voltage risk reduction becomes more apparent.
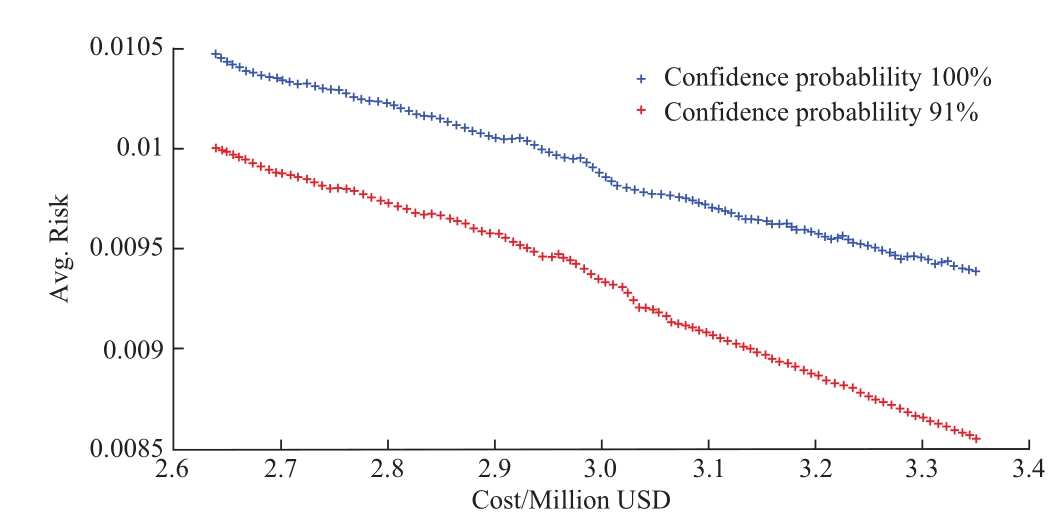
Fig.10 Cost and risk under different confidence probability
4 Conclusions
A coordinated method for configuring equipment based on chance-constrained programming has been proposed.It combines ES and cyber control equipment to enable flexible and cost-effective DG consumption.From the case analysis,the following conclusions can be drawn:
1) The proposed model can achieve a balance between DG's operational safety, economy, and consumption capability, thereby enhancing the economics of Cyber-Physical Systems and ensuring the consumption capability of DG while meeting the voltage risk constraints.
2) Once the acceptable risk level has been lowered, it is imperative to dispatch DG and ES together to reduce the risk of voltage violation, which also increases cost.Contrary to the control method, the current ES offers no economic advantage.With a decrease in ES’s price, DG equipment configuration will favor ES.
3) The flexibility of chance constraints is greater than that of robust optimization, but it increases the risk of voltage fluctuation.There is a reduction in confidence probability when opportunity constraints are present.The total impact of voltage risk should be thoroughly considered based on the investment cost.
As the information system will experience packet loss,future work will consider the impact of the active control process’s information failure uncertainty on the system.
Acknowledgements
This work was supported by the National Key R&D Plan (2017YFB0903100) and State Grid Electric Power Co., Ltd.science and technology project (2021JBGS-03).
Declaration of Competing Interest
We declare that we have no conflict of interest.
References
[1]Demirok E, Sera D, Teodorescu R, et al.(2009) Clustered PV inverters in LV networks: An overview of impacts and comparison of voltage control strategies.2009 IEEE Electrical Power & Energy Conference (EPEC).Montreal, QC, 1-6
[2]Cai G, Kong L, Pan C, et al.(2013) System modeling of wind-PV-ES hybrid power system and its control strategy for gridconnected.Transactions of China Electrotechnical Society,28(09): 196-204
[3]Sheng W, Liu KY, Meng X, et al.(2015) Research and practice on typical modes and optimal allocation method for PV-Wind-ES in Microgrid.Electric Power Systems Research, 120(01): 242-255
[4]Fawzy T, Premm D, Bletterie B, et al.(2011) Active contribution of PV inverters to voltage control-from a smart grid vision to full-scale implementation.E&I Elektrotechnik Und Informationstechnik, 128(04): 110-115
[5]Wachenfeld V.(2008) Inverters supporting electrical grid stability through active and reactive power control.The 23rd European Photovoltaic Solar Energy Conference and Exhibition.Valencia,Spain: 1-5
[6]Fu C, Wang L, Qi D, et al.(2019) Design and experiments of active distribution network CPS simulation platform.Proceedings of The CSEE, 39(24): 7118-7125
[7]Damavandi M G, Marti J R, Krishnamurthy V.(2017) A methodology for optimal distributed storage planning in smart distribution grids.IEEE Transactions on Sustainable Energy,9(02): 729-740
[8]Biswas MM, Azim MS, Saha TK, et al.(2013) Towards Implementation of Smart Grid: An Updated Review on Electrical Energy Storage Systems.Smart Grid and Renewable Energy,4(01):122-132
[9]Zhang Y, Bin C, Liao Q, et al.(2017) Assessing planning performance of electric storage system based on multi-agent operation simulation.2017 International Electrical and Energy Conference (CIEEC 2017).Beijing, China, 156-160
[10]Cai D, Wang Z, Miao S, et al.(2022) Wind-Photovoltaic-Energy Storage System Collaborative Planning Strategy Considering the Morphological Evolution of the Transmission and Distribution Network.Energies, 15(04): 1481-1497
[11]Ye G, Qian X, Yang X, et al.(2020) Planning of PV-ESS System for Distribution Network Considering PV Penetration.2020 IEEE 3rd International Conference on Electronics Technology (ICET).Chengdu, China, 339-343
[12]Zou K, Agalgaonkar AP, Muttaqi KM, et al.(2011) Distribution system planning with incorporating DG reactive capability and system uncertainties.IEEE Transactions on Sustainable Energy,3(01): 112-123
[13]Liu W, Chen Y, Wang L, et al.(2019) An Integrated Planning Approach for Distributed Generation Interconnection in Cyber Physical Active Distribution Systems.IEEE Transactions on Smart Grid, 11(01):541-554
[14]Ding T, Li C, Yang Y, et al.(2016) A two-stage robustoptimization for centralized-optimal dispatch of photovoltaic inverters in active distribution networks.IEEE Transactions on Sustainable Energy, 2016, 8(02): 744-754
[15]Okido S, Takeda A.(2013) Economic and environmental analysis of photovoltaic energy systems via robust optimization.Energy Systems, 4(03): 239-266
[16]Sun Y, Zhao Z, Yang M, et al.(2019) Overview of energy storage in renewable energy power fluctuation mitigation.CSEE Journal of Power and Energy Systems, 6(01): 160-173
[17]Theo W L, Lim J S, Ho W S, et al.(2017) Review of distributed generation (DG) system planning and optimisation techniques:Comparison of numerical and mathematical modelling methods.Renewable and Sustainable Energy Reviews, 67(01): 531-573
[18]Liu W, Li H, Huang Y, et al.(2022) Evaluation Method for Voltage Fluctuation Performance Considering Cyber Soft Failure.CSEE Journal of Power And Energy Systems, 8(01):86-94
[19]Yan P, Xiang C, Zhou W, et al.(2021) Research on the error probability distribution of photovoltaic output prediction based on output fluctuation characteristics and Generalized Gaussian Mixture Model.E3s Web of Conferences.Edp Sciences,02004(01):1-6
[20]Zhang H, Li P (2011) Chance constrained programming for optimal power flow under uncertainty.IEEE Transactions on Power Systems, 26(04): 2417-2424
[21]Cai HR, Chung CY, Wong KP (2008) Application of differential evolution algorithm for transient stability constrained optimal power flow.IEEE Transactions on Power Systems, 23(02): 719-728
[22]Christakou K, Paolone M, Abur A (2017) Voltage control in active distribution networks under uncertainty in the system model: A robust optimization approach.IEEE Transactions on Smart Grid, 9(06): 5631-5642
Received: 18 July 2022/ Accepted: 1 December 2022/ Published: 25 December 2022
Hanshen Li
lhs@ncepu.edu.cn
Wenxia Liu
50300467 @ncepu.edu.cn
Biographies

Hanshen Li obtained his B.S.E.in Electric Power Engineering and Automation from Shanghai Jiao Tong University (SJTU),Shanghai, China, in 2016, his M.E.in Information, Production and Systems Engineering from Waseda University, Tokyo,Japan, in 2017, and his M.E.in Electrical Engineering from SJTU in 2019.Currently, he is pursuing a doctorate in electrical engineering at North China Electric Power University in Beijing, China.His research interests include active distribution planning and operation.

Wenxia Liu obtained her B.S.in Radio Engineering from Nanjing University of Science and Technology, Nanjing, China,in 1990, her M.S.in Power System and Automation from Northeast Electric Power University, Jilin, China, in 1995, and her PhD in Power System and Automation from North China Electric Power University (NCEPU),Beijing, China in 2009.As professor in the School of Electrical and Electronic Engineering at NCEPU, her research interests include intelligent planning of power systems,risk assessment, power communication systems, and reliability and planning for cyber-physical systems.
(Editor Yanbo Wang)
