0 Introduction
The energy crisis and environmental pollution resulting from the excessive use of traditional energy sources are necessitating the development of sustainable, clean,efficient, and renewable energy resources [1].In particular,distributed photovoltaics (PVs) have been rapidly deployed because of related technology development.It is also considered as an essential method for achieving the vision of “emission peak and carbon neutrality” [2].By the endof 2019, the total cumulative global installed PV capacity has exceeded to 635 GW [3].End-use solar PV generation in the United States is expected to increase more than quadruple from 41 billion kWh to 182 billion kWh by 2050[4].By the end of 2020 in Australia, there have been 2.66 million installed rooftop solar power systems in total, and approximately 21% of homes with rooftop PV panels [5].However, the increasing usage of distributed PVs in the power grid could have negative impacts because of the intermittency and uncertainty of PV power generation.Distributed PVs are often installed in customers’ residential premises where utilities do not have direct metering devices owing to high costs and customer privacy issues.As most residential customers do not have energy storage devices,reverse power occurs when the behind-the-meter (BTM)PV generation exceeds the actual load, indicating that the excess power flows from the customer side to the grid.The invisible PV generation, particularly the unauthorized residential PV installation, poses a substantial risk to the security of grid operation and maintenance.Moreover, the time-varying PV generation makes it difficult for utilities to forecast and perform demand-side response management on the actual power demand of customers [6,7].Thus, it is of great significance to develop methods for disaggregating PV generation from the net metering measurements so that utilities can identify and understand the BTM PV generation at the grid edge [8], leading to better power quality control,accurate load forecasting, and full situation awareness in the distribution system.
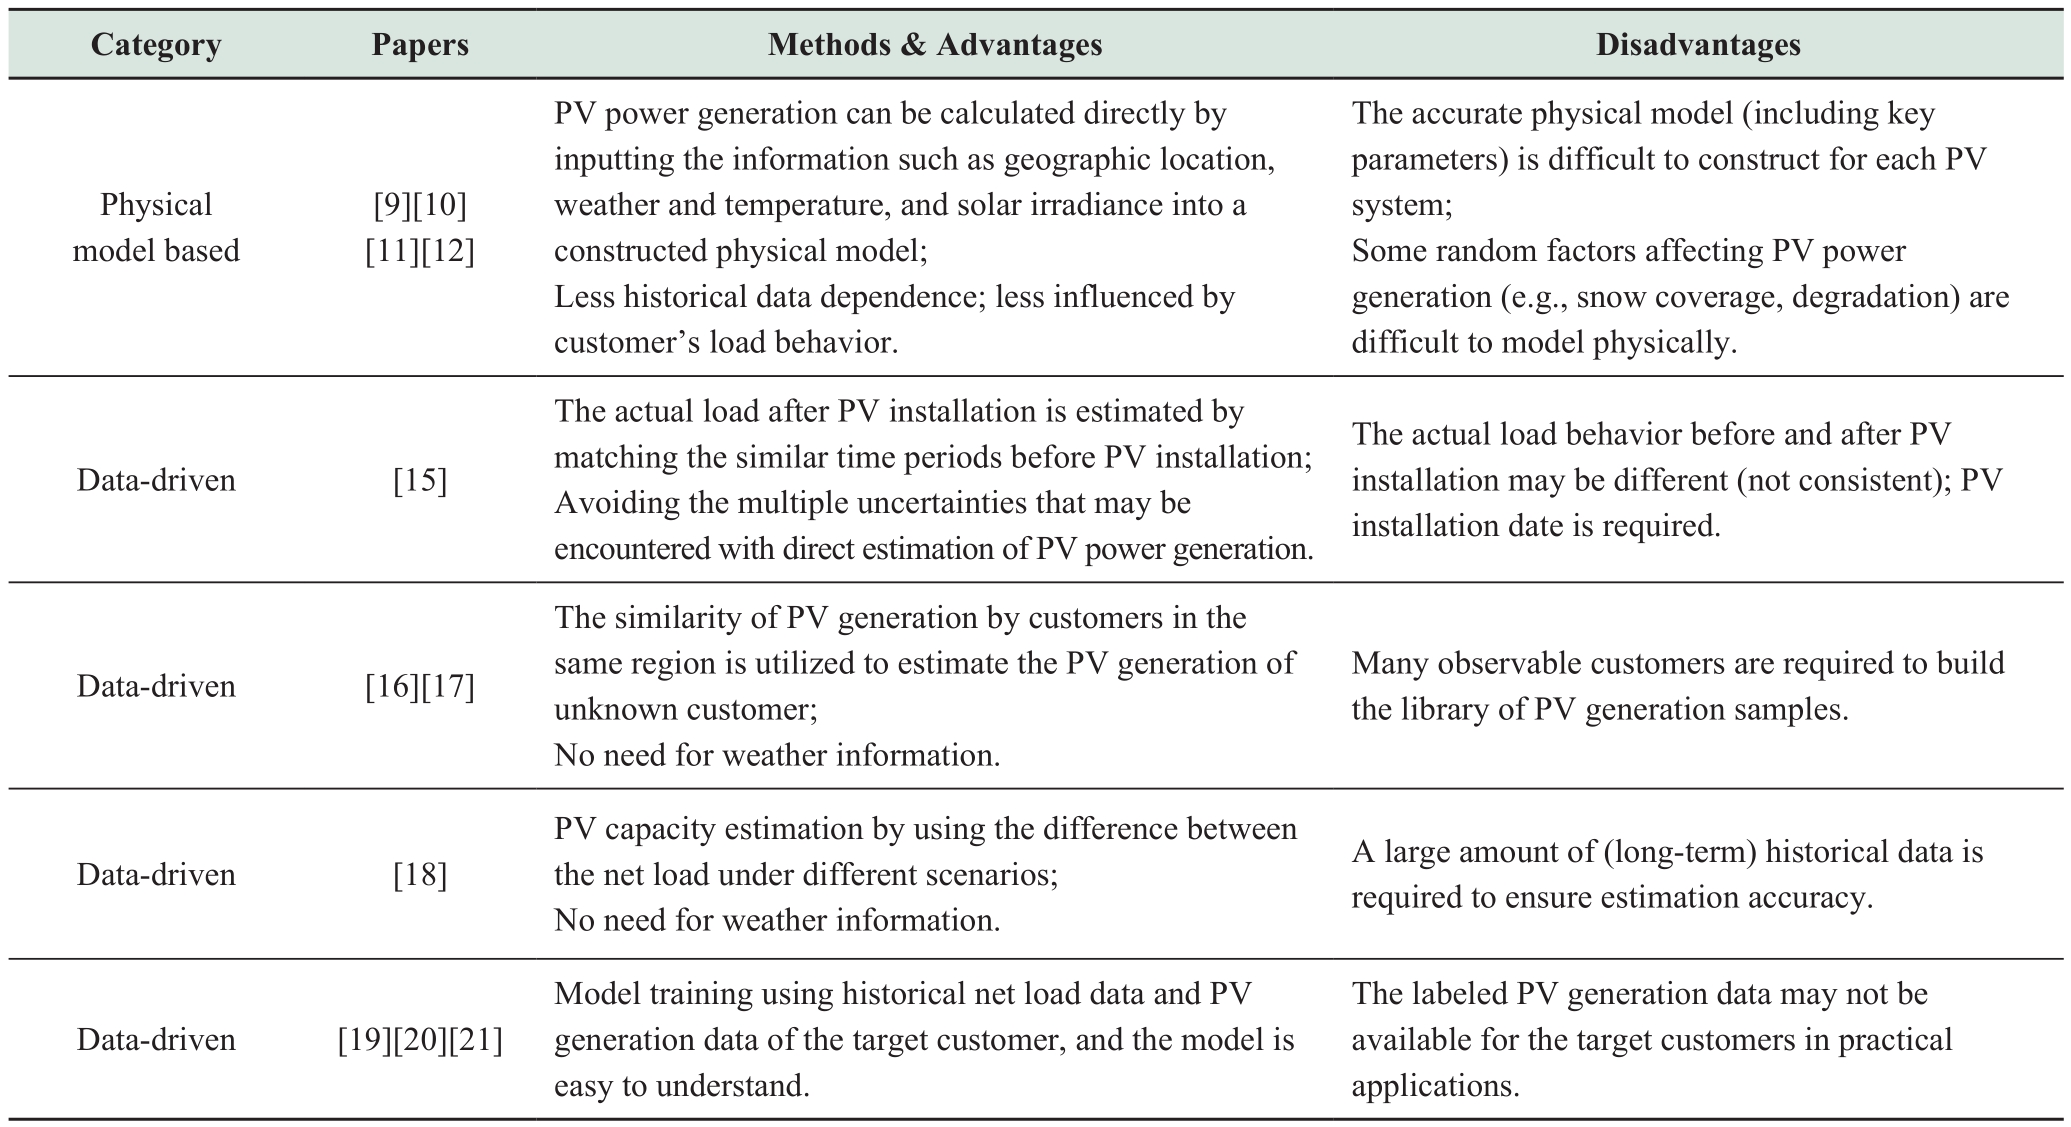
In this situation, researchers have developed physical models to directly estimate the distributed BTM PV generation by combining the known or estimated physical parameters.The model PVWatts [9]developed by the National Renewable Laboratory and PV performance modeling collaborative [10]developed by the Sandia National Laboratory are classical physical models.They estimated the PV generation based on the physical mechanism and solar information, such as solar irradiation,PV arrays size, inverter efficiency, tilt, and orientation.Reference [11]estimated the customer PV generation using the weather and geographic data by combining a PV performance model and a clear sky model.Reference [12]treated the distributed PV in a certain area as a virtual PV power station, and a physical model was constructed using geographical and meteorological information to estimate the total PV capacity and predict the PV generation.In addition, satellite and aerial images were utilized in [13,14]to identify solar PV systems and to estimate their physical parameters, including the size, azimuth, and tilt.However, with the large number of customers, the workload of building a separate physical model for each customer is enormous.Also, it is almost impossible to obtain the large number of structural parameters required by physical modeling approaches, leading to inaccuracies in such approaches and preventing their application for PV generation estimation in practice.
Benefiting from the development of internet of things and communication technology, smart meters can provide the net load metering measurements (i.e., the actual load minus the BTM PV generation), which may be negative when the household PV power generation is higher than the customer load.Based on this, alternative approaches are employed to disaggregate the in-house PV generation based on the data acquired by the smart meter and weather data, instead of the PV physical models.In reference[15], customers have consistent load behaviors before and after the installation of PV system.The customer load was estimated by matching the same weather and activity characteristics during similar time periods before and after the PV system installation.The relationship between the net and actual load was used to estimate the PV generation capacity.Utilities are often unaware of the PV system installation information, making this approach difficult to apply.In reference [16], based on the construction of a candidate sample library of the actual load and PV power generation using cluster analysis, the PV power disaggregation was achieved by obtaining the optimal combination that minimizes the disaggregation residuals through a game learning process.In reference [17], the joint probability density function (PDF) of monthly diurnal and nocturnal actual loads was created first using the data collected from the observable customers (indicating that their PV devices were individually metered, and the utility could observe their PV power profiles) in the community.Then, the PV generation of unknown customers (indicating that their PV devices were not individually metered and the utilities did not have direct access to their PV power profiles) could be estimated as a linearly weighted combination of the PV exemplars from observable customers based on the similarity between PV generation in the same geographical area.Additionally, the actual load of the unknown customer satisfies the established PDF, and the optimal weight vector and the corresponding optimal combination of PV generation exemplars are calculated by solving the maximum likelihood estimation to achieve PV power disaggregation.However, in reference [16]and reference [17], many observable customer data were required to build a sample library.If the number of samples is not sufficiently large, the accuracy will be considerably reduced.
Besides, there are some studies that utilize machinelearning algorithms for BTM PV power disaggregation.In reference [18], a PV power disaggregation method was proposed based on capacity estimation, in which the support vector regression is used for capacity estimation based on the difference between net load power profiles under different weather conditions.Then, the PV power profile was estimated as the standard PV power profile multiplied by the estimated capacity.However, this approach requires long-term observable historical data to extract features and train the model for capacity estimation, and the PV power disaggregation results are completely dependent on the capacity estimation results.Reference [19]introduced an adaptable machine learning framework (including data preprocessing, feature extraction, feature selection, and regression models) to estimate the BTM PV power, and applied several different machine learning algorithms (e.g., decision trees) to the framework.In reference [20], a two-way two-layer long short-term memory deep learning network with improved input form was employed to perform load disaggregation on household load with solar panels, which can monitor the household appliances’ status and the PV generation power in real time.Reference [21]learned the features of appliances and PV panel offline from partially labeled historical data via dictionary learning and then disaggregated their power consumption and generation.Although the machine learning based algorithms like [19,20, 21]are proven to have good disaggregation accuracy in BTM PV power disaggregation, actually they are all supervised methods, in practical scenarios, it is difficult for us to obtain individual real PV generation data from the target customers before we disaggregate it.The advantages and disadvantages of the existing BTM PV power disaggregation methods are summarized in Table 1.
Table 1 The advantages and disadvantages of existing BTM PV power disaggregation methods
To cope with the existing problems, a novel residential PV capacity estimation and power disaggregation method based on net metering load data is proposed.It should be noted that the PV capacity in this study is not the installed PV capacity, but the peak or maximum PV generation power in a period (e.g., month).The main contributions of this paper are summarized as follows.
(1) An unsupervised BTM PV capacity estimation method is proposed, which only uses the net load data.Based on the distribution characteristics of the diurnal and nocturnal net load extremes, the peak generation power over a period is estimated as the PV capacity.
(2) Based on the correlation between nocturnal and diurnal actual loads and the correlation between PV capacity and its actual generation, a PV generation estimation method for unknown customers is established according to the support vector regression (SVR) model with the nocturnal and diurnal net loads and the PV capacity as inputs and the actual PV generation as outputs.According to the multivariate linear fitting theory, a weighted linear combination of the PV generation of the observable customers in the same region is used to fit the estimated PVgeneration for the unknown customer.Then, the PV power disaggregation is achieved by the optimal weighted sum of the PV power profiles of observable customers.
(3) An adaptive check-and-correction strategy is proposed to identify and calibrate the anomalous power disaggregation results.According to the difference between the PV capacity (i.e., the peak generation power) estimates for observable customers and the corresponding ground truth, the discriminant coefficient is defined.Thus, we check and determine whether the power disaggregation results of the unknown customers are reasonable, and we adjust the anomalous results.
The remainder of this paper is organized as follows:Section II provides the overall framework of the proposed method.Section III describes the unsupervised PV capacity estimation method.Section IV presents the specific procedure of the power disaggregation algorithm.Section V describes the experimental dataset and presents an analysis of the testing results.Section VI provides the conclusion of this study.
1 Overall framework
Smart meters measure the customers’ actual electricity consumption.The actual load consumption is measured as positive, while it is measured as negative when there is power back feed into the grid in the case where the electricity generated by residential PV is more than customer inhouse consumption.The net load recorded in the metering point can be expressed as the sum of the actual customer load power and the PV generation power, as shown in equation (1).
whereP is the net load power,Lis the actual load in the house, andGis the PV generation.
Considering that there is no solar radiation at night,the PV system does not generate power, and there is a big difference between the appliance usage of customers at night and during the day.We treat the cases in daytime and nighttime differently for better data analysis.We select 7:00 to 18:00 as the time period for the daytime, and a demonstrative composition of net load data is shown in Fig.1.

Fig.1 Time division and the net load composition
The purpose of this study is to estimate the generation capacity of the residential PV based on the net load data available from customer smart meter and to disaggregate the hourly net load for each customer into the PV power and actual load.The general framework is shown in Fig.2, and the overall process is described as follows.

Fig.2 Overall structure of the proposed power disaggregation method
(1) The unsupervised PV capacity estimation approach using the net load is established based on the distribution characteristics of the net load extremes at night and during the day.The PV generation capacity of the observable customers and unknown customers are estimated using their net load data.As indicated by the gray dotted arrows, the estimated PV capacity of observable customers is used for PV generation estimation model construction and the postprocessing of PV power disaggregation results.
(2) The correlation between the nocturnal and diurnal actual loads of customers and the correlation between the PV capacity of customers and their actual PV generation are analyzed and observed.Based on the measured net load of observable customers and the PV generation and estimated capacity, the SVR model is constructed; it takes the monthly nocturnal and diurnal net loads and the estimated PV capacity as inputs and outputs the monthly PV generation.The SVR model is used to estimate the monthly PV generation of unknown customers based on their net load data and estimated PV capacity.
(3) Based on the multivariate linear fitting theory,the weighted sum of the PV generation of observable customers is used to fit the estimated monthly PVgeneration of unknown customers.The optimal weight vector is obtained by solving the optimization problem.Then, the PV power disaggregation is achieved by linearly superimposing the weight vector with the PV power profiles of the observable customers.
(4) A discrimination coefficient is calculated based on the difference between the estimated PV capacity of observable customers and the actual PV capacity to check and correct the PV power disaggregation results.Then,combined with the estimated PV capacity of unknown customers, the abnormal PV power disaggregation results are identified and adjusted to the normal range.
The main steps in the above process will be further described in the following section.
2 Unsupervised residential PV capacity estimation
The capacity of residential PV systems is positively correlated with the output power [11], and the accurate PV capacity estimation is significant for PV power disaggregation.Almost all occupied households have always-on or stand-by appliances (e.g., refrigerators and storage water heaters) consuming the baseline power.This net metering reduces the original peak PV output power;thus, the absolute value of the net load minimum will be smaller than the true PV capacity.
It is difficult to extract or estimate the baseline power of the appliances in the net load during the day because of the presence of photovoltaic generation and the appliances in normal use.Therefore, we try to leverage the minimum load value at night as the candidate for the baseline power,considering that the customers are resting during that time and only the always-on or stand-by appliances are working.Moreover, when the daily diurnal net load reaches the power minimum at some moment, two conditions are generally met, such as the weather conditions at that time are most conducive to PV generation and the household electricity consumed at that time is the least.We extract the daily nocturnal and diurnal net load minima, as shown in (2).

where Pi(t) is the net load power at moment t of day i,td and tn are the sets of the day time and the night time,respectively, and D is the number of days in the month.
For the residential scenarios in this study, the actual load is smaller than the PV capacity (i.e., peak power generation).In other words, the net load power is negative when the PV power generation reaches its maximum.Therefore, the diurnal net load minimum Pd,min is in the absolute value, as defined in equation (2), which equals to the maximum PV power generation (positive value) minus the actual load power at that time.
Then, each diurnal power minimum is summed with all nocturnal power minima, as shown in Fig.3.We compose the set of preliminary capacity estimatesC(k), as shown in equation (3).
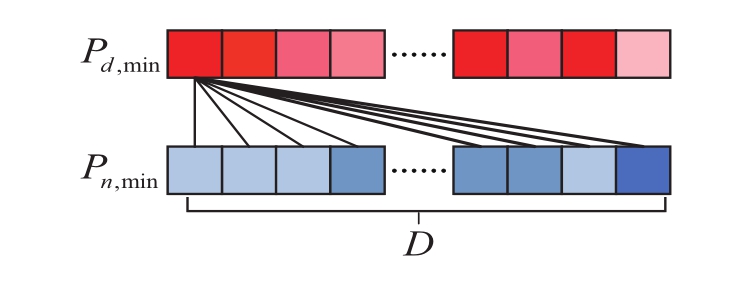
Fig.3 Diagram of power extremum combinations

where k is the index of the set of preliminary capacity estimates.
The sequence of preliminary capacity estimates is sorted by value in ascending order, and the index is updated.Then,the capacity characteristic curve is plotted, as shown in Fig.4.
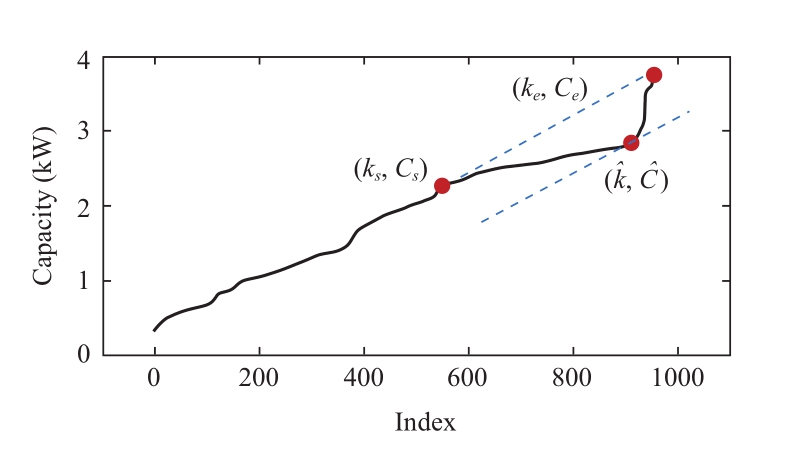
Fig.4 Capacity characteristic curve
The characteristic curve shows an upward trend.In the first stage, the curve change is dominated by the diurnal net load power extremes on different days, making the curve rapidly increasing.In the second stage, the curve climbing is mainly dominated by the nocturnal net load power extremes;thus, the curve changes more gently.In the last stage, the curve tends to steeply rise, this is because in few days, some appliances other than the always-on or stand-by ones would occasionally run for a long time at night, producing some outliers for the baseline power.
Most of the capacity values in the first part of the preliminary capacity estimation sequence do not need to be considered because they may be smaller than the absolute value of the minimum value of the net load for that month(i.e., the maximum value of Pd,min that is smaller than the true capacity value).We take the part of the preliminary capacity estimation sequence that satisfies the conditionof being greater than the maximum value of Pd,minfor that month to form the candidate capacity sequence, as shown in (4).The minimum and maximum values of this sequence and their corresponding indices are marked for further analysis, as shown in equation (5).

The capacity characteristic curve is divided into two segments by point (ks, Cs), as shown in Fig.4.The true PV capacity should be contained in the latter segment.As previously analyzed, the data in the third-stage curve in the latter segment are the outlier data against the true PV capacity.Therefore, we believe that the trend changing point of the curve in the latter segment corresponds to the true PV capacity, and it is taken as the estimated PV capacity.
Combined with the changing characteristics of the curve,we determine the changing point of the trend as follows.For the curve segment corresponding to the candidate capacity sequence (i.e., the latter segment of the curve), a line through its first point (ks, Cs) and last point (ke, Ce) is drawn.Then, the tangent line of this curve segment parallel to the line is found, in which the corresponding tangent point is the changing point of the trend, as shown in Fig.4.The process can be completed by solving equation (6).

where Ck is the estimated PV capacity value.
The pseudo code of the unsupervised PV capacity estimation algorithm is included in the following table (i.e.,Algorithm 1: PV Capacity Estimation).

3 Power disaggregation of residential PV
In this section, based on the analysis of the correlation between the nocturnal and diurnal actual loads of customers and the correlation between the PV capacity of customers and their actual PV generation, we first construct the SVR model for monthly PV power generation estimation.Then, we disaggregate the PV power profiles based on the multivariate linear fitting method.Finally, we correct the disaggregation anomaly results using the estimated PV capacity.
3.1 Data characteristics analysis
The capacity and the output power of PV are positively correlated.The total monthly PV generation can be interpreted as the integration of the PV output power over time.Thus, based on available measurements, the monthly PV generation is also strongly correlated with the PV capacity, as shown in Fig.5.Therefore, we can use the feature of the PV capacity to estimate the monthly PV generation.
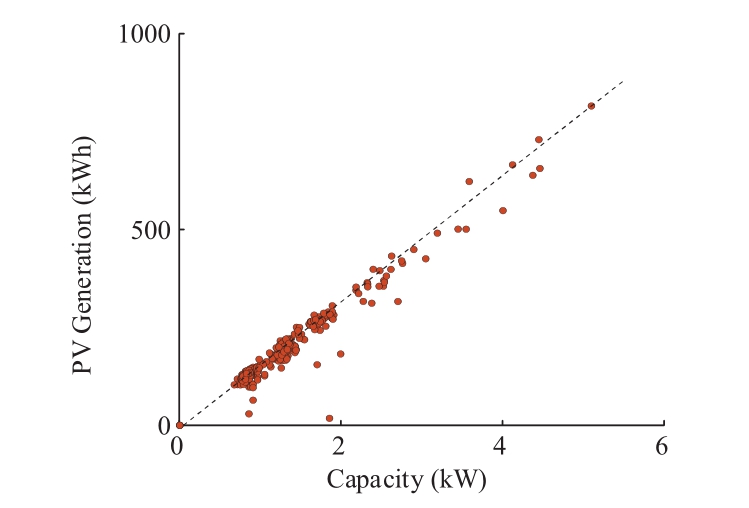
Fig.5 PV capacity and monthly PV generation
Also, a high correlation is observed between the customer monthly nocturnal and the diurnal actual load,as shown in Fig.6.Since there is no PV generation at night, the nocturnal net load can be considered equal to the actual load, leveraging the correlation between the nocturnal actual load and the diurnal actual load.We can estimate the monthly total consumption of the diurnal actual load.Furthermore, since the net load data are completely available, subtracting the estimated diurnal actual load consumption from the diurnal net load under the month gives an estimate of the monthly PV generation.Therefore,there is a correlation between the PV generation and the nocturnal and diurnal net loads.

Fig.6 Monthly nocturnal and diurnal actual load
3.2 PV generation estimation based on the SVR model
With the above analysis of the power data, we constructa SVR model with monthly nocturnal and diurnal net loads and the PV capacity as inputs and the monthly PV generation as outputs.
It should be noted that, since the PV capacity cannot be directly extracted from the net load, the mentioned PV capacity, as one of the SVR inputs, is the estimated PV capacity by the previously proposed method for unknown customers.In this study, the monthly and nocturnal net loads and the monthly PV generation are defined in equations (7)–(9), respectively.
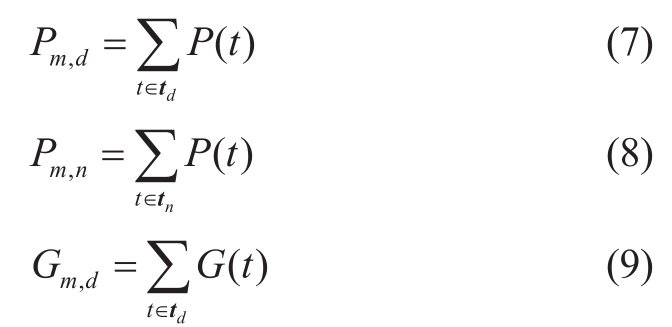
where Pm,d, Pm,n, and Gm,dare the monthly diurnal net load,nocturnal net load, and PV generation, respectively.
We use the net load and the PV generation data of observable customers to construct the SVR model and learn the mapping function f that satisfies equation (10) from the know n data.It should be noted that the estimated PV capacityof the observable customers, which is obtained by the previously proposed method based on the net load,is used for model learning instead of the true PV capacity to ensure that the SVR model is applied to unknown customers.In equation (10),
 and
and  are the monthly diurnal and nocturnal net loads calculated from the net load data of the observable customers using (7) and (8).The
 is the monthly PV generation calculated from the PV generation data of observable customers by equation (9).
where f(⋅,⋅,⋅)represents the SVR model.
In this paper, to construct the SVR model and learn the mapping function f , the calculated![]() of all N observable customers form the training set, in which the input vector xi and the output yi of the model are defined in equation (11), wherei=1,…,N.
of all N observable customers form the training set, in which the input vector xi and the output yi of the model are defined in equation (11), wherei=1,…,N.

Based on the training data, the SVR model for the monthly PV generation estimation is trained by using LIBSVM tools, and the specific principle and implementation process can be found in reference [22].Based on this model, the monthly PV generation Gm,d can be predicted as the output by providing the estimated PV capacity monthly diurnal net load Pm,d, and monthly nocturnal net load Pm,n of any customer as the inputs, which can be calculated based only on the net load data.The radial basis function is chosen as the kernel function due to its strong generalization learning ability.
3.3 PV power disaggregation via multivariate linear fitting
The PV generation outputs are affected by both internal and external factors, where the external factor is mainly the weather.Within the same area, different customers are subjected to highly similar weather inputs, so different PV systems produce similar power profiles.The internal factors are the capacity, tilt, and azimuth, where both the capacity and tilt can stretch the PV power curve on the power axis,and the azimuth has the effect of inclining the profile on the time axis [11].Therefore, different PV systems subjected to the same meteorological input produce highly similar PV power profiles.
Then, we can use linear combinations of known samples to fit the PV power profiles of unknown customers when the samples of PV power profiles of observable customers are sufficient, as shown in equation (12).
where ![]() represents the monthly PV generation vector,Nrepresents the number of PV generation samples from observable customers, and ω=[ω 1 ,...,ω N]T represents the unknown weight vector to be solved.
represents the monthly PV generation vector,Nrepresents the number of PV generation samples from observable customers, and ω=[ω 1 ,...,ω N]T represents the unknown weight vector to be solved. is the monthly PV generation of the i-th PV sample, which is expressed as
where (t )is the PV power value of the i-th PV sample at hour t.
Therefore, we can obtain the monthly PV generation estimates through the linear combination of the observable PV samples.To distinguish from the previous estimates by the SVR model, we denote the former as , and the PV
generation estimates generated by the SVR model as .
.
We can solve the optimal weights, as shown in equation (14),by narrowing the gap between the two estimates.
where represents the norm (L2 norm is used in this study).
Considering the realistic situation where the metered PV generation and the actual load are non-positive and nonnegative, respectively, we add these two constraints to the optimization problem, as shown in equation (15).

where ![]() represents the matrix of the hourly PV generation power of observable customers,
represents the matrix of the hourly PV generation power of observable customers,![]() represents the PV generation power vector ofNPV samples at hourτ,τ=1,...,T,Ph represents the hourly net load power of unknown target customers, and0represents the zero vector.
represents the PV generation power vector ofNPV samples at hourτ,τ=1,...,T,Ph represents the hourly net load power of unknown target customers, and0represents the zero vector.
The optimal weight valuesω∗can be obtained by solving the problem (15) using numerical computational methods.In this study, the problem is solved using the sequential least squares programming method.
Finally, the initial estimation of the PV power profile of unknown customers can be obtained through the linear combination of the solved weight vectorω∗and typical samples, as shown in equation (16).
3.4 Power disaggregation result check and correction
In the optimization problem (15), there is no restriction on the magnitude of the PV power profile.In the case that monthly PV generation  estimated by the SVR model exceeds a certain value, which is much larger than the ground truth, the PV power disaggregation result obtained by (16) is also larger than that of the true value.Therefore,for the preliminary PV disaggregation results obtained by solving the optimization problem in 3.3, we perform postprocessing on some of the estimation results that may have large errors.
We calculate a discrimination coefficient based on the difference between the estimated PV capacity of the observable customers and the true PV capacity, as shown in equation (17).
where  and
and  represent the true and estimated values of the PV capacity of the i-th observable customer,respectively.
For unknown customers, we consider that both the maximum of the PV power profiles obtained by the proposed PV disaggregation approach and the estimated PV capacity obtained by the proposed capacity estimation approach using the net load should satisfy the limits of this correction coefficient, as shown in equation (18).

where represents the estimated PV capacity of the unknown customers.
If the PV power disaggregation results of an unknown customer does not satisfy equation (18), then they are considered to deviate from the true values.In this case,we use the estimated PV capacity to adjust the PV power disaggregation results based on equation (19).

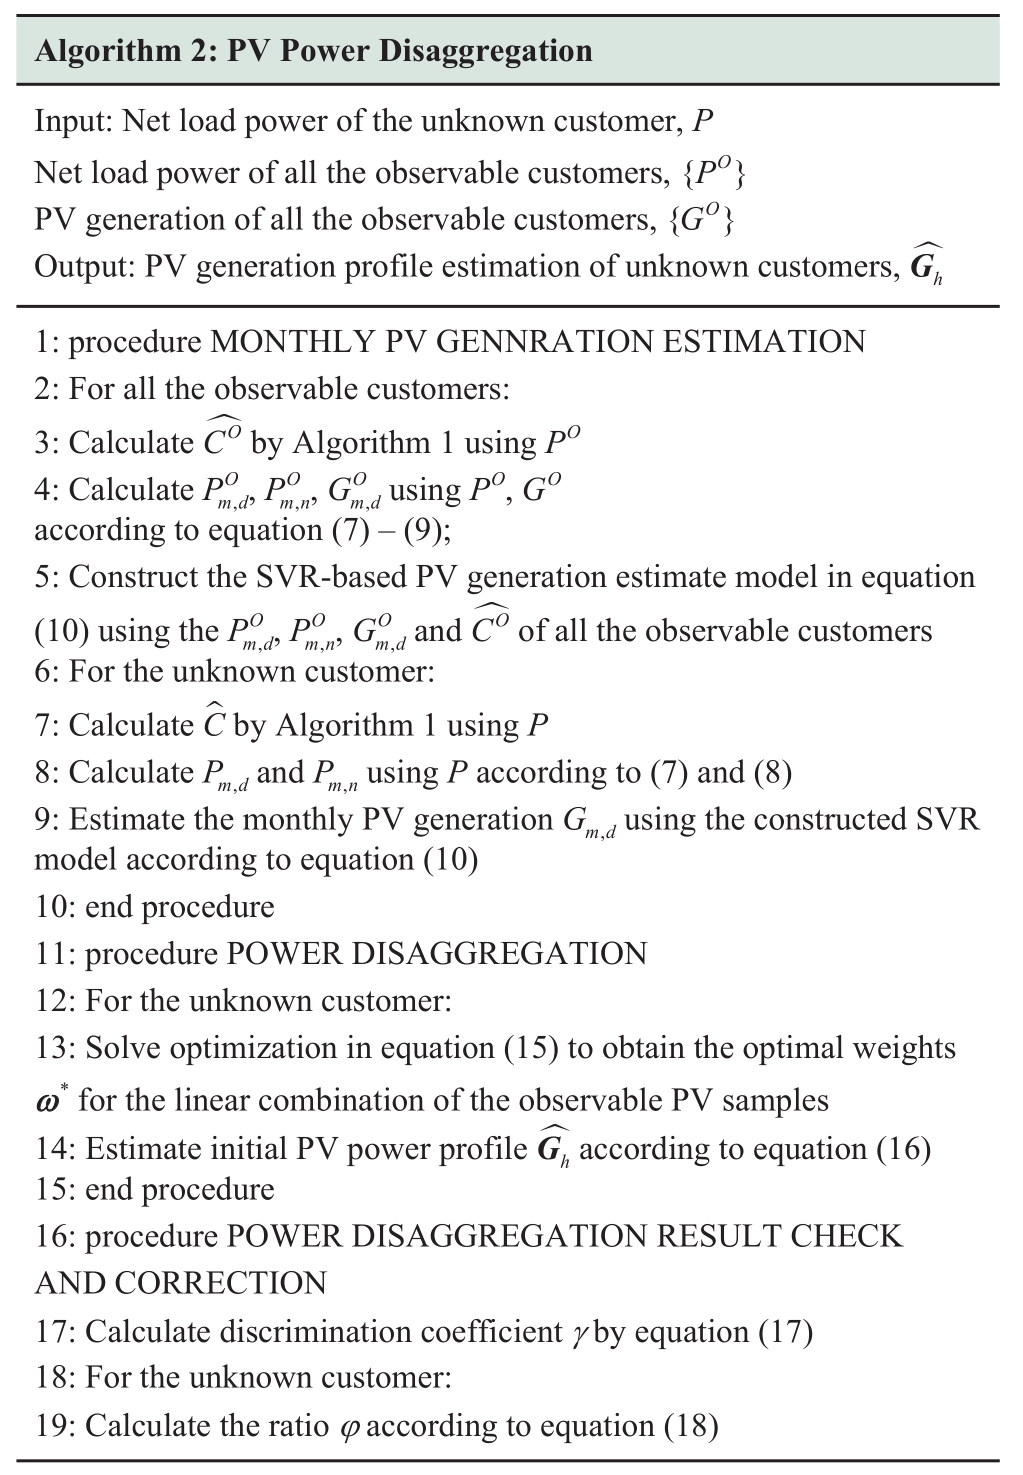
Finally, according to (1), the estimate of the actual load power profile can be obtained by subtracting the estimated PV power profile from the net load profile.The pseudo code of PV power disaggregation is summarized in the table below (i.e., Algorithm 2: PV Power Disaggregation).

4 Experiments and analysis
In this section, we introduce the experiment setting,including the dataset and the performance evaluation metrics.Then, the PV capacity estimation algorithm is tested using a real dataset, and a comparative experiment is performed on the PV power disaggregation algorithm.
4.1 Experiment setting
The PV power disaggregation studies require datasets containing both PV generation and actual load data.To our knowledge, there are three popular public datasets:SunDance [11], Pecan Street [23]and Ausgrid [24].Among them, the SunDance contains BTM net meter data and PV generation data for 100 sites scattered across North America; the Pecan Street contains the actual load data and PV generation data of 73 customers in three different U.S.states; and the Ausgrid provides the actual load data and PV generation data for 300 customers in Sydney, Australia,and its surrounding areas over a three-year period.In this paper, we need to exploit the similarity of PV generation in the same region, while the customers in the SunDance and Pecan Street datasets are geographically dispersed, and the number of customers in the Ausgrid dataset is relatively large, therefore the experiments are implemented on the Ausgrid dataset.In the experiment, 260 of these customers were selected for testing.The time resolution of the data was 1 h.The experiments were conducted on the data in 2013.For the testing of PV power disaggregation, 50 tests were carried out, and 1/3 of the customers were randomly selected as observable customers for each test.The average result of the 50 tests was taken as the result.
All the algorithms in the proposed method and the comparison methods are programmed in Python (version 3.8.8).The libraries of Pandas, scipy, numpy, and sklearn are used to implement different stages of the algorithms.The experiments are implemented on a PC with Windows 10 operating system, Intel Core i7-10700F 2.90GHz CPU and 32 GB RAM.
In this study, the validity and accuracy of the proposed method are evaluated in terms of both PV capacity estimation and power disaggregation.For the PV capacity estimation results, the mean absolute percentage error(MAPEC) [18]is used to measure the performance, as shown in equation (20).

where Ci and  are the real and estimated PV capacity for the i-th customer, respectively.S is the total number of customers involved in PV capacity estimation.A smaller value of MAPEC indicates better performance of the algorithm.
Considering that the PV system does not generate electricity at night, the raw mean absolute percentage error is difficult to accurately evaluate the disaggregation results.Therefore, for the PV power disaggregation results, we use the special mean absolute percentage error (MAPEP) and the root mean square error (RMSE) [17]to measure the deviation between the ground truth and estimated results, as shown in equation (21) and equation (22).
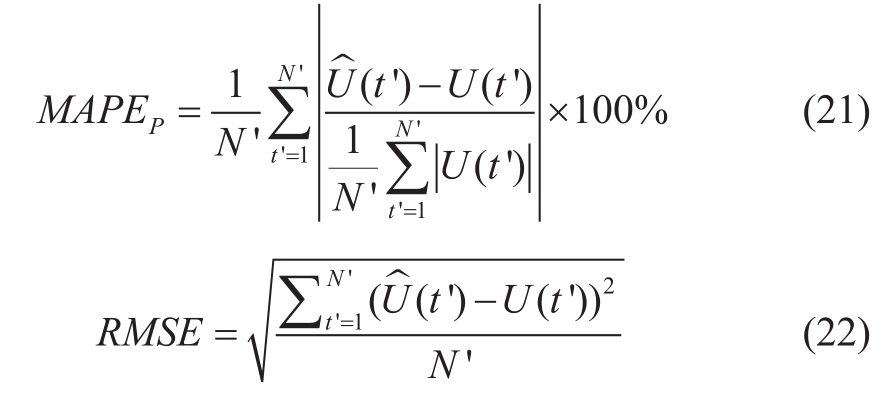
wheret'is the hour when the PV power is non-zero andN'is the number of hours with non-zero PV power for each customer.U can represent the PV power or actual load power of the unknown customer in the test.
4.2 Results and analysis
4.2.1 PV generation capacity estimation
First, we perform the experiment for all customers in January 2013 to obtain the capacity estimation results.Figure 7 shows the PV capacity estimation error distribution of all customers calculated according to equation (20).
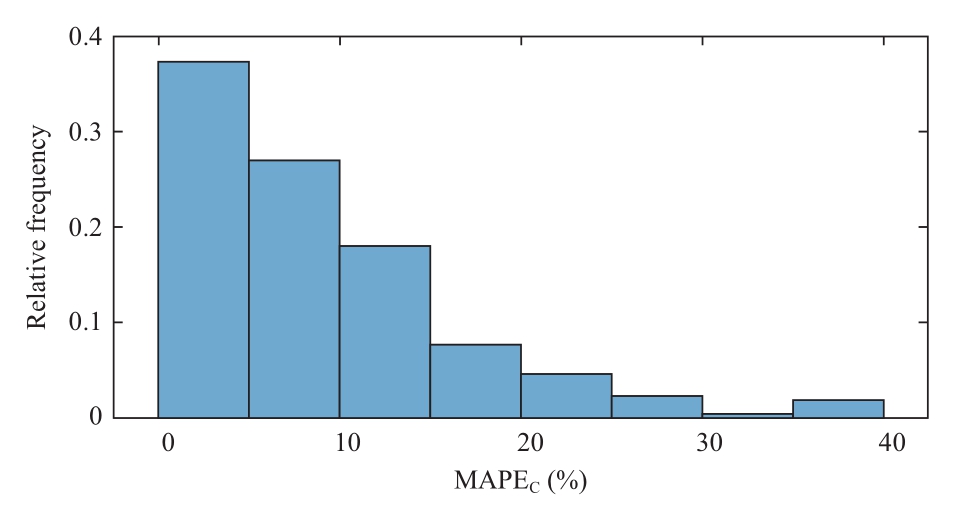
Fig.7 Distribution of PV capacity estimation errors
Table 2 shows the empirical cumulative distribution of PV capacity estimation.The average result for MAPEC of all customers is 9.42%, and the capacity estimationMAPEC results for 80% of these customers are less than 13.36%.These results show the validity and accuracy of the proposed capacity estimation method.
Table 2 Empirical cumulative density function (CDF) of PV capacity estimation

Considering the PV systems face with different weather conditions under different seasons, we perform PV capacity estimation tests with data under different months in 2013.Different time resolutions (30 min and 1 h) are also considered for the tests, and the average MAPEC results for all customers are shown in Table 3.
Table 3 Average results for PV capacity estimation in different months (i.e., different weather conditions)
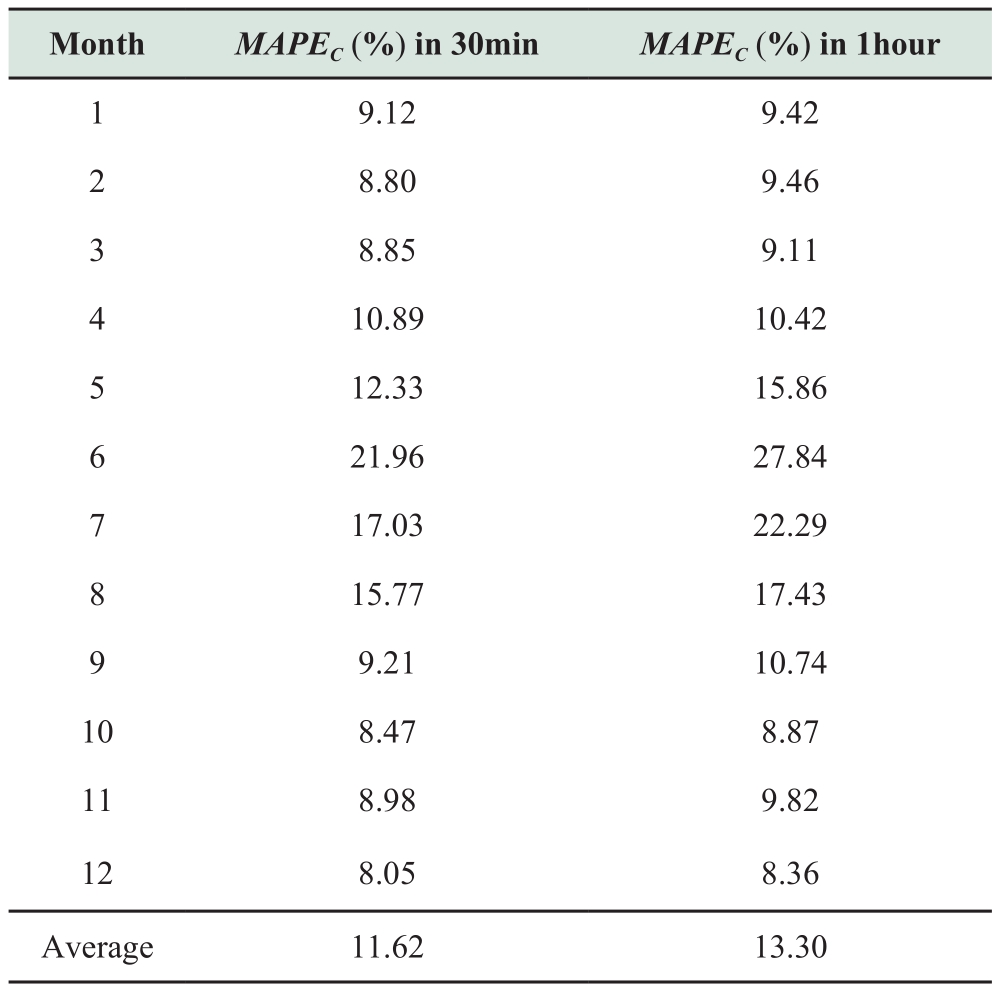
The results in Table 3 show that a smaller temporal resolution leads to more accurate PV capacity estimates.Additionally, the PV capacity estimation results in summer(December, January, and February of Australia) are better than the estimation results in winter under this dataset.This is because winter weather conditions are far more complicated or changeable for PV systems than summer.For example, the existence of snowfall in winter, as a special weather condition, makes the PV generation more unpredictable in snowy days.Both the snow cover and melting under sunny days after snowfall can cause losses in the generation of solar panels.Thus, the PV capacity estimates using the data for that month under winter are worse than those for summer.In practice, for an installed PV panel, its capacity, inclination, and azimuth are fixed.Although there is degradation of the solar panels with time,the degradation in the conversion efficiency of the panels within a few months can be negligible.Therefore, we can use the data of months with good weather conditions to estimate the capacity of solar panels.
4.2.2 PV power disaggregation
In this study, the SVR model for the monthly PV generation estimation is constructed using the estimated PV capacity and the data of observable customers.The PV power disaggregation is implemented using the SVR model and the optimization problem solution.The final PV power disaggregation is achieved by post-processing the anomalous results in combination with the PV capacity estimation results.Figure 8 shows the results of the PV power disaggregation results of the net load for one week using our proposed method, and we can accurately disaggregate the PV power profile from the net load under different weather conditions.With this, we do not need to directly track the actual load profile every hour but uses the estimated PV power profile and the net load to achieve the estimation of the actual load profile.In Fig.9, the actual load has more complex consumption patterns, and we can accurately estimate the actual power based on PV power disaggregation results, instead of a dedicated power tracking model, which may be difficult to construct.

Fig.8 PV power disaggregation result
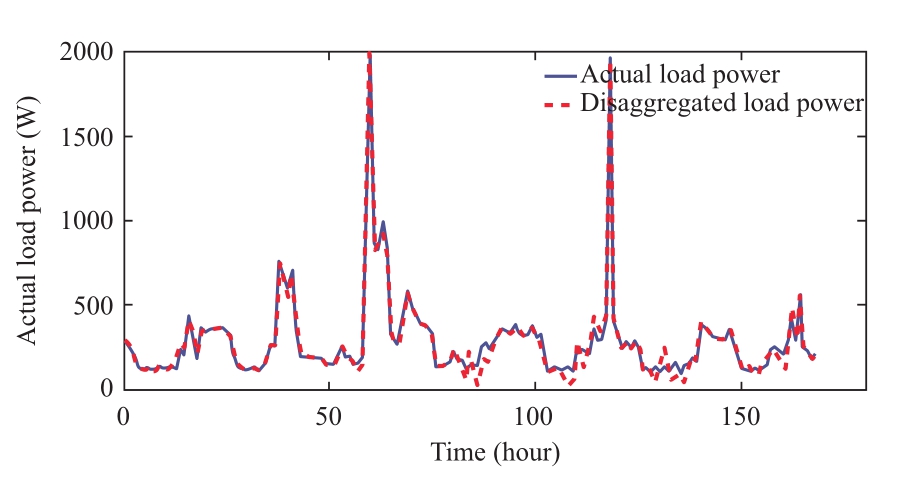
Fig.9 Actual load disaggregation result
Figure 10 presents the performance of the proposed check-and-correction strategy for the preliminary PV power disaggregation results.The results without post-processing are shifted upward compared to that of the ground truth.The post-processing makes the estimated results normal overall,overcoming the interference of anomalous results and increasing the robustness of the proposed PV disaggregation method.

Fig.10 Comparison of the results with or without postprocessing
We select one customer with the mean MAPEP of 10.16% for that month to plot the daily MAPEP of PV power disaggregation results, as shown in Fig.11.The MAPEP values of this customer are around the mean for most days of the month, ranging from 5% to 15%.The days with a higher disaggregation accuracy tend to be the sunny days,while the days with lower MAPEP values correspond to rainy or cloudy weather.
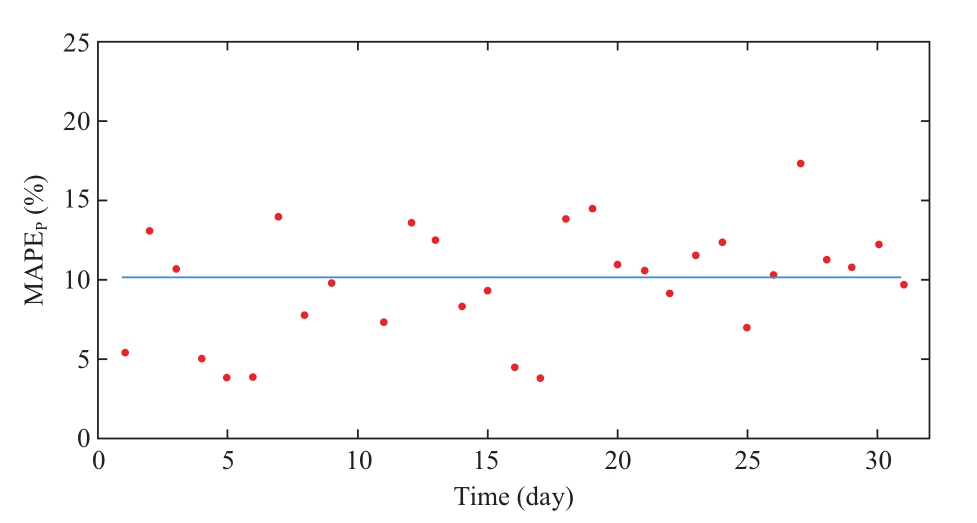
Fig.11 Daily PV power disaggregation results for one customer
4.2.3 Comparison with the state-of-the-art method
The methods proposed in reference [17]and reference[18]are also methods for PV power disaggregation of the net load of unknown customers using the data of partially observable customers, which has been reported to have good disaggregation accuracy.A comparison experiments between reference [17]and reference [18]and the proposed method is performed under the Australian grid dataset.
In reference [17], the Gaussian mixture model (GMM)is used to construct the joint probability density function(PDF) of monthly diurnal and nocturnal actual loads using the data collected from the observable customers in one community.Then, an optimization model is constructed based on the assumption that the PV generation of unknown customers could be estimated as a linearly weighted combination of the PV exemplars from observable customers in the same community.The optimal weight vector and the corresponding optimal combination of PV generation exemplars are calculated by solving the maximum likelihood estimation of the established PDF to achieve the PV power disaggregation.In reference [18],all net load profiles of observable customers are clustered into four classes, corresponding to net load power profiles under different weathers.Then, features are extracted based on the differences between the net load power profiles under different weather conditions, and combining the PV capacity information of observable customers,the support vector regression model is constructed based on the extracted features to estimate the PV capacity for unknown customers.Finally, the PV power disaggregation is achieved using the estimated capacity multiplied by the standard PV power profile, which is the clustering centroid of the PV power profile samples of all observable customers.
We use the metrics described in equation (21) and equation (22) to measure the performance of the proposed method and [17,18].A comparison of the experimental results is shown in Figs.12(a)–(d), and the average results of the test customers are shown in Table 4.
Table 4 Performance comparison of proposed method and other methods
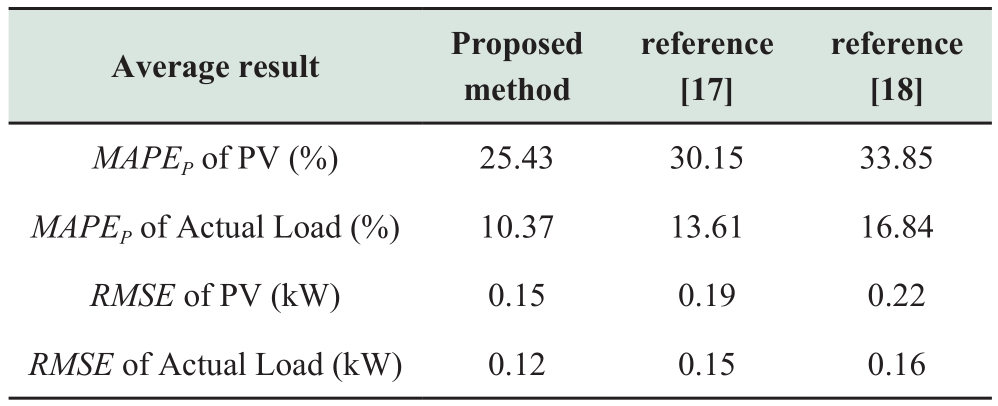
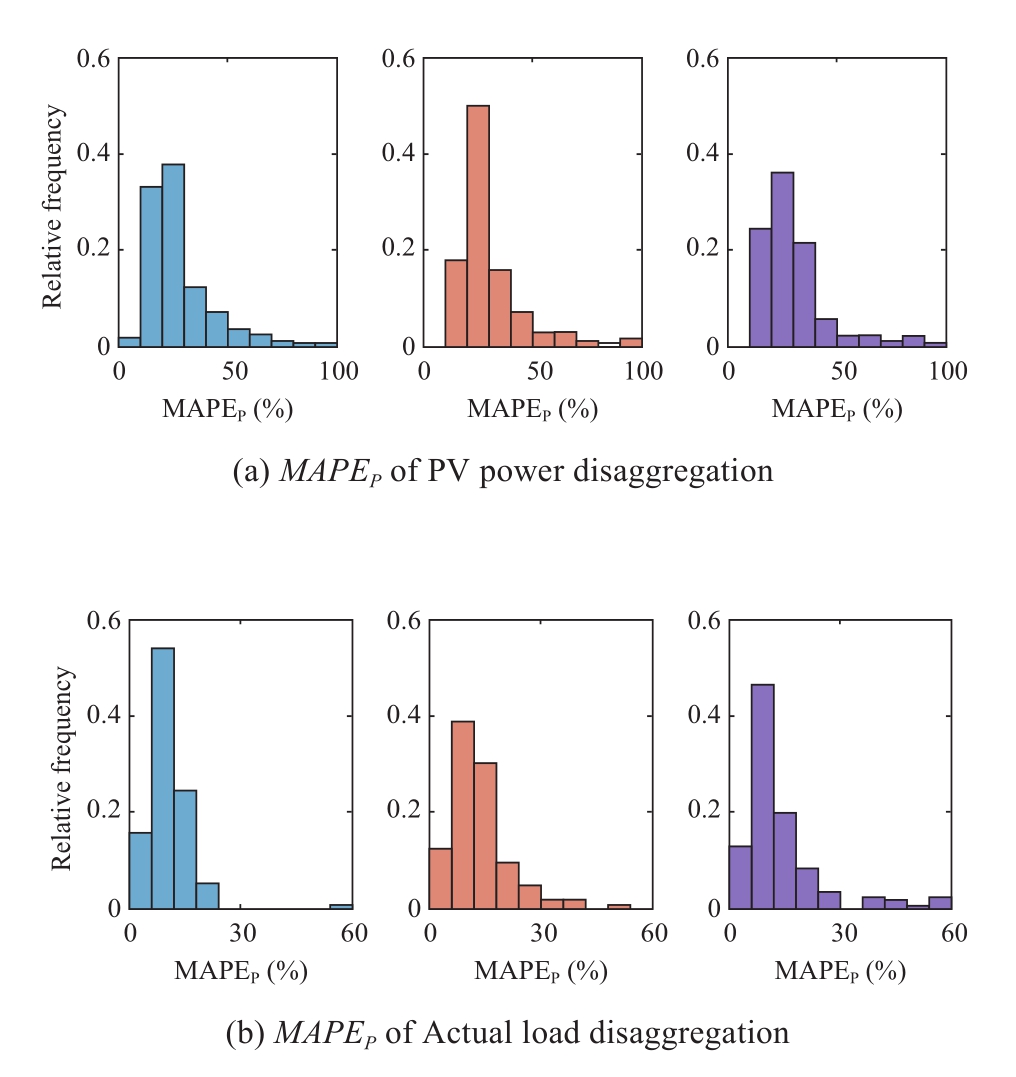

Fig.12 Performance comparison of power disaggregation results(Left: Proposed method, Middle:reference [17], Right: reference [18])
The overall errors in the power disaggregation of the proposed method are less than the algorithms in reference [17]and [18].Compared to reference [17], which delivers better performance against reference [18], we improved the MAPEP for PV generation and actual load by 15.66% and 23.81% and the RMSE by 21.05% and 20.00%, respectively.
The disaggregated PV power profiles from different methods for one typical customer are plotted, as shown in Fig.13, to illustrate the superiority of our method.

Fig.13 Comparison of PV power profile disaggregation results from different methods
In reference [17]and this study, the similarity of PV generation among customers in the same region is leveraged.However, reference [17]requires many samples of the observable customers for constructing the GMM for the monthly diurnal and nocturnal actual loads to make the model more generalizable; otherwise, the GMM learned with small samples will be prone to bias for the actual load estimation.In our method, although the SVR model encounters similar problems in estimating monthly PV generation for customers, we add a capacity-based check and correction step to postprocess the anomalous PV power disaggregation results due to the model underfitting caused by limited samples.To be specific, we believe that when the peak of the disaggregated PV power profiles deviates too much from the PV capacity estimated by the Algorithm 1 above, we use the estimated PV capacity to correct the disaggregation result.In other words, compared with reference [17], the lower bound of the PV power disaggregation accuracy is improved benefiting from the postprocessing step of check and correction.As shown in Fig.13, the disaggregated PV profile (marked light yellow)obtained from reference [17]deviates from the ground truth (overall greater than the ground truth), in contrast, our method shows better performance.
The reference [18]used the multiple SVR-based ensemble model for unknown customers to estimate PV the capacity and then multiplies it by the output power of a standard PV system to achieve the PV power disaggregation for the unknown customer.As shown in Fig.13, due to the constraint imposed by the estimated capacity, the disaggregated power profile by reference [18]are not as significant overall high bias as reference [17].However,compared with reference [17]and our method, reference[18]has a relatively poor ability to track the changing trend of real PV power profile, which is limited by the selected standard power profile.It is not difficult to imagine that the output power of a standard PV system has limited adaptability to different scenarios, and it is difficult to ensure a good fit between the disaggregated PV power profiles and the ground truth.In contrast, the multivariate linear fitting solution used in this study used the known power profiles of multiple observable customers.Thus,it has better adaptability to different scenarios with better fitting, as shown in Fig.13.
5 Conclusion
A study on the residential PV capacity estimation andpower disaggregation is conducted for the customers with only net load data available to cope with the invisibility of the behind-the-meter residential PV.First, an unsupervised PV capacity estimation method is proposed based on the distribution characteristics of the net load extremes at night and day, which can achieve an accurate estimation of the behind-the-meter PV capacity under the net load.Then, based on the correlation between the nocturnal and diurnal actual loads and the correlation between the PV capacity and the actual PV generation, an SVR-based PV generation method is established to use the estimated PV capacity to estimate the PV generation for unknown customers.Considering this, the PV power disaggregation for the unknown customers is implemented by the optimal weighted sum of the PV power profiles of the observable customers in the same region.Finally, a further check-andcorrection strategy is proposed to post-process the PV power disaggregation results, where a designed discrimination coefficient is used to identify the abnormal results and calibrate them based on the estimated PV capacity.
The experimental results on the real measured hourly datasets containing 260 customers from Sydney, Australia show that the proposed PV capacity estimation method exhibited good accuracy, robustness, and low complexity.Meanwhile, compared with the state-of-the-art method,the proposed method has reduced the MAPE of PV power disaggregation over 15% and the RMSE more than 20%.
With the proposed PV capacity estimation and power disaggregation method, the PV power profile and the actual load profile could be extracted from the net load data.The accurate PV power disaggregation results could provide reference for PV power forecasting such that the utility could realize economic and stable operation of the grid with a high penetration of residential PVs.
Theoretically, the unsupervised PV capacity estimation method proposed in this paper assumes that the maximum PV output power is greater than the actual load.In practical engineering, residential scenarios easily meet this requirement, while the rooftop PV capacity of some buildings is often smaller than their actual load, and the PV disaggregation method for such scenarios will be the focus of our future research.
Acknowledgements
This work was jointly supported by the Science and Technology Project of State Grid Corporation of China(No.5400-202112507A-0-5-ZN), and the National Nature Science Foundation for Young Scholars of China (No.52107120).
Declaration of Competing Interest
We declare that we have no conflict of interest.
References
[1]Keirstead J, Jennings M, Sivakumar A (2012) A review of urban energy system models: Approaches, challenges and opportunities.Renewable and Sustainable Energy Reviews, 16(6): 3847-3866
[2]Lai C S, Locatelli G, Pimm A, et al.(2021) A review on longterm electrical power system modeling with energy storage.Journal of Cleaner Production, 280: 124298
[3]Jäger-Waldau A (2020) Snapshot of photovoltaics—February 2020.Energies, 13(4): 930
[4]Center B P (2020) Annual energy outlook 2020.Energy Information Administration 12: 1672-1679
[5]Lin J, Ma J, Zhu J (2021) A privacy-preserving federated learning method for probabilistic community-level behind-the-meter solar generation disaggregation.IEEE Transactions on Smart Grid,13(1): 268-279
[6]Deng R L, Yang Z Y, Chow M Y, et al.(2015) A survey on demand response in smart grids: Mathematical models and approaches.IEEE Transactions on Industrial Informatics, 11(3):570-582
[7]Xue X, Wang S, Yan C, et al.(2015) A fast chiller power demand response control strategy for buildings connected to smart grid.Applied Energy, 137: 77-87
[8]Tabone M, Kiliccote S, Kara E C (2018) Disaggregating solar generation behind individual meters in real time.Proceedings of the 5th Conference on Systems for Built Environments: 43-52,Shenzen, China, 7-8 November 2018
[9]A.P.Dobos (2014) PVWatts version 5 manual, National Renewable Energy Laboratory, Golden, CO, USA, Tech.Rep.NREL/TP-6A20-62641, Sep.2014
[10]Stein J S The photovoltaic performance modeling collaborative(PVPMC).2012 38th IEEE Photovoltaic Specialists Conference.Austin, TX, USA.IEEE, 3048-3052
[11]Chen D, Irwin D (2017) SunDance: black-box behind-the-meter solar disaggregation.e-Energy ’17: Proceedings of the Eighth International Conference on Future Energy Systems: 45-55,Shatin, Hong kong, 16-19 May 2017
[12]Wang Y, Zhang N, Chen Q X, et al.(2018) name="ref13" style="font-size: 1em; text-align: justify; text-indent: 2em; line-height: 1.8em; margin: 0.5em 0em;">[13]Malof J M, Bradbury K, Collins L M, et al.(2016) Automatic detection of solar photovoltaic arrays in high resolution aerial imagery.Applied Energy, 183: 229-240
[14]De Hoog J, Maetschke S, Ilfrich P, et al.(2020) Using satellite and aerial imagery for identification of solar PV: State of the art and research opportunities.e-Energy '20: Proceedings of the Eleventh ACM International Conference on Future Energy Systems: 308-313, Australia, 22-26 June 2020
[15]Stainsby W, et al.(2020) A method to estimate residential PV generation from net-metered load data and system install date.Applied Energy, 267: 114895
[16]Bu F K, Dehghanpour K, Yuan Y X, et al.(2020) A name="ref17" style="font-size: 1em; text-align: justify; text-indent: 2em; line-height: 1.8em; margin: 0.5em 0em;">[17]Bu F K, Dehghanpour K, Yuan Y X, et al.(2021) Disaggregating customer-level behind-the-meter PV generation using smart meter data and solar exemplars.IEEE Transactions on Power Systems, 36(6): 5417-5427
[18]Li K P, et al.(2019) Capacity and output power estimation approach of individual behind-the-meter distributed photovoltaic system for demand response baseline estimation.Applied Energy,253: 113595
[19]Saeedi R, Sadanandan S K, Srivastava A K, et al.(2021) An adaptive machine learning framework for behind-the-meter load/PV disaggregation.IEEE Transactions on Industrial Informatics,17(10): 7060-7069
[20]Sun J X, Wang J N, Yu W X, et al.(2020) Power load disaggregation of households with solar panels based on an improved long short-term memory network.Journal of Electrical Engineering & Technology, 15(5): 2401-2413
[21]Li W T, Yi M, Wang M, et al.(2021) Real-time energy disaggregation at substations with behind-the-meter solar generation.IEEE Transactions on Power Systems, 36(3): 2023-2034
[22]Chang C C, Lin C J (2011) LIBSVM: A library for support vector machines.ACM Transactions on Intelligent Systems and Technology, 2(3): 27
[23]Holcomb, C (2012) Pecan street inc.: A test-bed for NILM.International Workshop on Non-Intrusive Load Monitoring,Pittsburgh, PA, USA, May 2012
[24]Ratnam E L, Weller S R, Kellett C M, et al.(2017) Residential load and rooftop PV generation: An Australian distribution network dataset.International Journal of Sustainable Energy,36(8): 787-806
Received: 13 August 2022/ Accepted: 21 November 2022/ Published: 25
December 2022
Wenpeng Luan
wenpeng.luan@tju.edu.cn
Bo Liu
liubo@tju.edu.cn
Jianmin Tian
tian1024@tju.edu.cn
Yi Gao
13502076821@163.com
Xiaohui Wang
wxh258@126.com
Shuai Luo
shuai-luo@outlook.com
Biographies

Bo Liu is a lecturer with the School of Electrical and Information Engineering, Tianjin University.He is the author of more than 20 articles and more than 20 inventions.His research interests include the non-intrusive power load monitoring and disaggregation, big data analytics and applications, AI in Smart Grid, and ubiquitous power Internet of Things, etc.

Jianmin Tian received his B.S.degree in electrical engineering from Tianjin University in 2021, and he is pursuing his master degree in electrical engineering at Tianjin University.His research interests include non- intrusive load monitoring, the renewable energy integration and smart meter data analytics.

Wenpeng Luan (SM’05) is a professor with the School of Electrical and Information Engineering, Tianjin University.His research interests include smart metering data analytics,distribution system analysis, renewable energy resource integration, and utility advanced applications, etc.

Yi Gao received the Ph.D.degree in College of Electrical Engineering, Tianjin University.He works in State Grid Tianjin Electric Power Company Economy and Technology Research Institute.His research interests include power system planning, clean energy system, electric big data, etc.

Xiaohui Wang received the Ph.D.degree at North China Electric Power University,Beijing, 2012.He is working in China Electric Power Research Institute Co.Ltd., Haidian district, Beijing.His research interests include power big data technology, artificial intelligence, active distributed network, energy internet, etc.

Shuai Luo received the Ph.D.degree in College of Management and Economics,Tianjin University.He currently is a researcher in State Grid Tianjin Electric Power Company Economy and Technology Research Institute.His research interests include deep learning,few-shot learning, and their applications in energy, low-carbon economy, etc.
(Editor Dawei Wang)
