0 Introduction
In 2020,China proposed the “digital new infrastructure”construction plan,which was adopted by the power industry,and the pace of digital construction was accelerated in the fields of energy internet and power Internet of Things.This further improved the level of grid informatization integration and customer service.In September 2020,President Xi Jinping announced at the 75th United Nations General Assembly that China would reach its carbon peak in 2030 and strive to achieve the goal of carbon neutrality by 2060 [1].Consequently,the form of power grids has evolved significantly with the commencement of the electricity sales side and the extensive construction of high-proportion distributed new energy sources [2].This,however,has severely hindered business collaboration and data connectivity in the fields of marketing,distribution,dispatching,and integrated energy,which are crucial for multi-energy optimization and the safe operation of power grids.Furthermore,the distribution business employs independent systems developed based on its own perspectives and requirements.Notably,the distribution business involves dispatching,operation and maintenance(O&M),and marketing services.Thus,it is essential to comprehensively monitor,control,and optimize the configuration of all controllable energy sources in distribution grids.Furthermore,the marketing business entails customer services such as business expansion,installation,metering,and payments.It coordinates with the comprehensive energy business to realize the access to and settlement of distributed new energy.Subsequently,it coordinates with the distribution business to realize distributed new energy dispatching,distribution and electricity maintenance,power outages,emergency repairs,and other services.However,the existing information systems are independent of each other,and the different organizational structures increase the difficulty in solving the problems associated with information system interactions and data consistency maintenance.
The State Grid Corporation of China has performed extensive research on marketing and distribution for several years.This research was primarily focused on the information island phenomenon,which is caused by the separation of businesses.These studies involved implementing measures to realize the marketing and distribution model,develop data sharing schemes and technology,and solve the problems of data inconsistency and inaccuracy caused by the fracture of cross-professional collaborative business processes and non-closed loops.However,the marketing and distribution fields comprise hundreds of systems,and the models cannot be shared owing to the inconsistency and incompleteness of business objects [3].For instance,the structure of the distribution and transformation information tables in distribution and marketing business systems is inconsistent.Different systems adopt different coding systems in terms of the business data.The business attribute suffers from the problem of “the same name is not synonymous,and the synonymy is not the same name;” consequently,it fails to provide an identical and consistent meaning of information across different business fields.Researchers worldwide have proposed special platforms [4] and algorithm models[5-9] primarily focusing on distribution fault diagnoses [10],model optimization [11],distribution topology analyses,marketing and distribution management,and line loss management.Additionally,studies have been conducted on developing an optimization scheme for the high-speed retrieval of cross-professional graph data [12,13].However,these studies focused on graph data model fusion,and collaborative applications remain limited.Conversely,data synchronization is not updated in a timely manner owing to the fragmentation of the distribution business,excessive maintenance,varying caliber,and other problems;this adversely affects the business processing efficiency and service quality.Business processes may also fail to adapt to the increasing number of collaborative marketing and distribution businesses owing to their independent operation.Moreover,there are many differences between the information processing channels and the electronic handover interfaces of data; this increases the difficulty of ensuring process execution.
To address the aforementioned issues,this study systematically analyzes the problem of the uniform sharing and efficient analysis of data in the field of business and distribution.Furthermore,it establishes a unified graph data model and a graph computing framework for the field of business distribution; these effectively overcome the problems of insufficient scalability and low calculation efficiency,along with the insufficient analyses of relational data stored in the power grid topology,distributed new energy prediction,intelligent O&M,and other crossprofessional data analysis scenarios.The main contributions of this study can be summarized as follows:
(1)It presents the “one graph of marketing and distribution” data model construction based on graph theory.An efficient graph data model is built from the perspective of marketing and distribution penetration,along with business collaboration.This approach integrates business processes and data models and also considers future business developments to ensure that the model can flexibly adapt to business changes.
(2)A topology identification and completion algorithm for a marketing and distribution household transformer is proposed based on electricity conservation and the “one graph of marketing and distribution” data.
(3)A marketing and distribution graph computing framework is established.The BSP calculation mode is adopted,and various graph data algorithm models are integrated.This graph computing framework is employed to construct,deploy,and operate the distributed photovoltaic power generation and distribution load forecasting application; further,O&M knowledge graph reasoning is applied for the marketing and distribution equipment in the actual production environment of a provincial company.
1 Theory of marketing and distribution data model construction
The graph database is a database management technology based on graph theory.Conventional relational database management systems are based on a two-dimensional structure.Conversely,the graph database stores data based on “nodes” and “edges” as data definition elements,which enables the distributed storage and processing of massive complex relational data.In the native graph database,the data nodes exhibit the physical feature of “adjacency-free indexing,” owing to which they “point” toward each other.This offers several technical advantages in the application of high-dimensional complex network data structures [14].Currently,graph databases are widely used in social networks,e-commerce,biological gene graphs,smart transportation,and other fields.
Graph computing constitutes an analysis and processing module for graph data,employing various graph algorithms.It was first proposed by Google during the development of the graph computing framework,Pregal [15],for its massive network data.Various large graph database computing technologies have been developed in the industry over the past decade,including Neo4j [16],Tigergraph [17],and Giraph [18].Graph computing technology and relational databases only support the statistical analysis and calculation functions.However,graph computing fully utilizes the distributed characteristics,presents various node parallel and hierarchical parallel computing algorithms,and offers additional features and computing services.
Data connection is the core of integration in the marketing and distribution fields.This field includes a large number of customers and large amounts of equipment,metering,operation,and other data.This correlation is extremely complex and exhibits natural network characteristics.The data of multiple systems in the marketing and distribution fields are integrated by using graph data storage and computing technology,to build a data model of “one graph of marketing and distribution.”This model can naturally express the physical correlation among business entities,which considerably simplifies the use of many associations in the relational databases.Furthermore,the business logic implemented in the form of tables effectively establishes an information link between the marketing and distribution business.It supports integrated topology analyses for power grids,distributed new energy,customers,and data.It also effectively improves the optimization of power grids in the marketing and distribution business,energy consumption,and customer energy services.
2 Marketing and distribution graph data model
2.1 Construction process of marketing and distribution graph data model
The construction of the marketing and distribution graph data model involves physical equipment,electricity customers,distributed new energy,and operation data such as those of transformers,feeders,meter boxes,meters,and photovoltaic power generation systems.The data of these physical devices and their attributes are obtained from the Oracle and MySQL databases of the Marketing Business Application System(MBAS),Power Management System(PMS),Electricity Information Collection System(EIC),Integrated Energy Service Platform(IESP),and Global Information System(GIS)of the power grid company,based on strongly defined two-dimensional data structures that ensure the stability and robustness of the format of the stored data [19].The graph data technology used to construct a data model of “one graph of marketing and distribution” suffers from various drawbacks such as large amounts of data,poor data quality,and data connection problems.Conversely,it offers the advantages of flexible data model expression and efficient data processing,which can fully utilize each system data model to extract the entity and relation definitions,transform the entire graph data model,ensure complete coverage of the graph model information,and establish redundant relations for the same entities in the master data.The specific modeling process can be described as follows:
(1)Determine the business scenario for marketing and distribution data penetration support.This study primarily focused on marketing,distribution data in transformer relations,distributed energy access scheduling,and other businesses.Furthermore,core entity associations are established,and marketing,distribution,and comprehensive energy data are integrated.
(2)Determine the data range based on business scenarios and extract core entities using key data models,which mainly include transformers,lines,stations,geographic information,energy meters,marketing users,comprehensive energy users,power receiving points,grid-connected access points,metering points,and meter boxes.The data model construction involves data systems,which include MBAS,marketing GIS,PMS,distribution GIS,EIC,and IESP.
(3)Use the proposed graph data extraction and transformation tool to transform each system data model into a series of sub-graph models.The fields in the database must be extracted when extracting the database data entities.
(4)Extract the transformer,meter box,and other entities whose marketing and distribution data lack related information; manually sort out the relation using the GIS information of marketing and distribution; and establish the key relation of “transformer-district-meter box-metercollected data.”
(5)Establish the correlations between entities with the same name in the sub-graph for an independent sub-graph model formed using multiple data models.The names of the same entity in different systems may be different.Accordingly,we first sort out the list of entities with the same name and then establish the correlations based on the same entity in the list.Subsequently,we merge the attributes of the entities and complete the preliminary construction of the “one graph of marketing and distribution” data model.Figure 1 presents the topology of the model architecture.

Fig.1 Marketing and distribution graph data model architecture topology
Additionally,the subsequent graph data applications are primarily knowledge graphs; therefore,this study also uses(entity,relation,entity)and(entity,relation,attribute)to store tuples for graph data entities,attributes,and relations.
A data pre-processing process is formulated for both structured and unstructured data based on the data type of the information system.The unstructured data can be defined and mapped,and the same graph data conversion process can be adopted for the structured data.The process includes data pre-processing,knowledge system construction,and entity alignment.Figure 2 depicts the data model construction and fusion process.
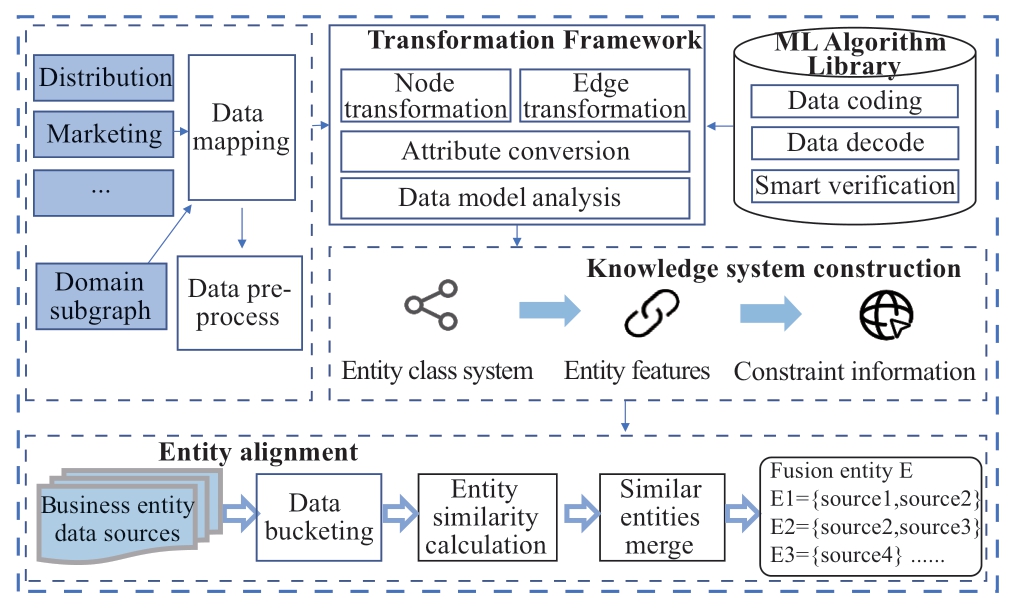
Fig.2 Graph data model construction and fusion process
2.2 Design of marketing and distribution graph data ontology
The marketing and distribution graph data ontology indicates the schema structure of the graph data; specifically,it describes physical concepts,conceptual attributes,and correlations within the scope of the business domain [20],and also defines and constrains the graph entities and relations.
The business entities involved in the marketing and distribution fields include marketing and distribution equipment,along with information such as the users and collected data.Therefore,this study integrates the data model of the marketing and distribution core systems,performs correlation,and extracts seven types of ontologies:transformer,district,meter box,meter,user,time,and collected data; these are depicted in Fig.3.The users include the marketing and integrated energy users.The ontologyrelated concepts,attribute fields,and other data information are primarily extracted from MBAS,EIC,marketing GIS,PMS,distribution GIS,and other systems; objective attributes can also be added based on the business requirements.An ontology for the integration of data distribution is formed by integrating the aforementioned data information with the existing ontology.
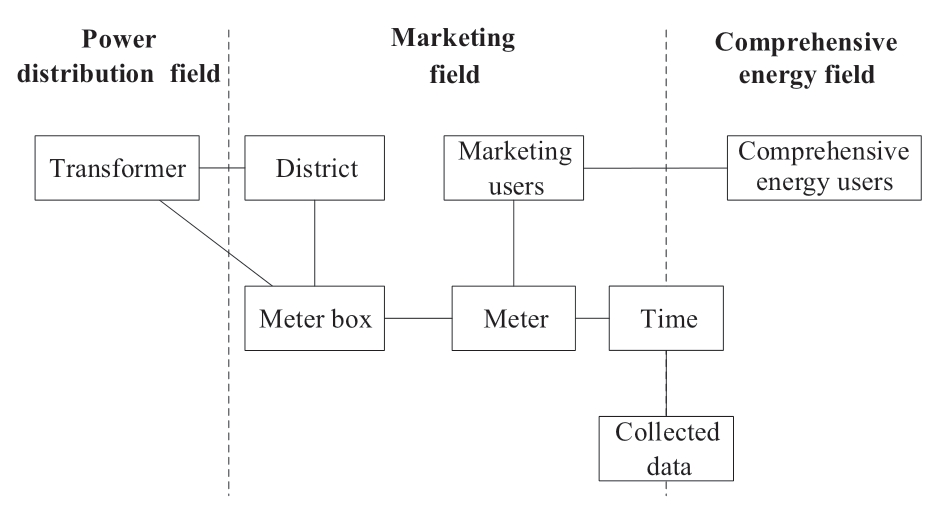
Fig.3 Marketing and distribution graph data connection
The marketing and distribution ontology is designed as
where i is the serial number of the marketing and distribution ontology.Since the number of ontologies has been determined,the value range of i is {1,2,3,4,5,6,7}.Taking the district ontology for example,it can be represented by O1;Pi is the attribute set of Oi of the business distribution ontology,which is obtained by extracting the relational data model entity; Ri is the relational attribute set of the business distribution ontology,which is obtained by analyzing the primary and foreign keys of the relational data model,the relation table access to information.
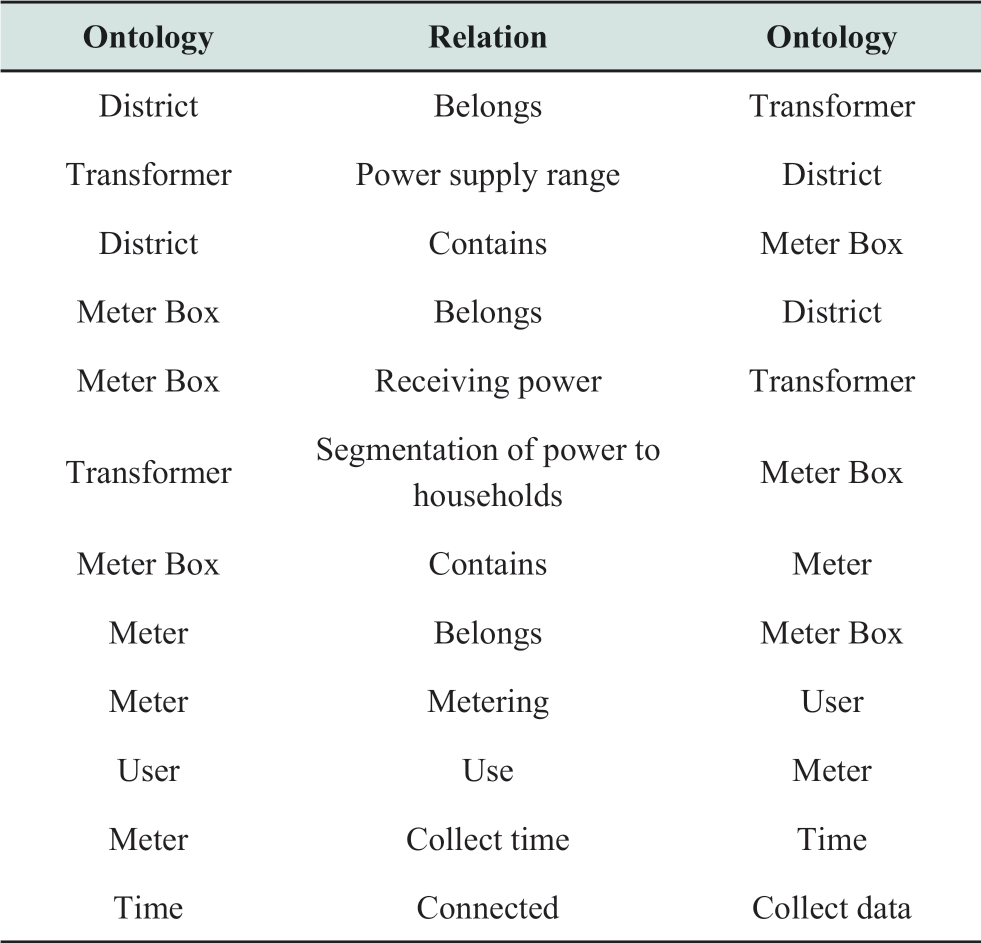
The attribute,Pi0=EID is defined in the ontology as the entity identifier(EID); Pi1=EID is defined as the relation identifier(RID)to ensure the uniqueness of the entities and correlations after the ontology is instantiated,similar to the relational data model.Table 1 presents the correlation between the ontologies of the marketing and distribution graphs.
Table 1 Data ontology relation for marketing and distribution connection
2.3 Construction of marketing and distribution graph entity
The construction process for the marketing and distribution graph entity involves converting the original business data into graph data.The marketing and distribution data are primarily relational; therefore,the corresponding graph is an attribute graph.The relational entity data tables corresponding to the ontology are extracted from the MBAS,marketing GIS,PMS,distribution GIS,EIC,and IESP.Each row in the table represents the information of the entity.Each field value of the row records is extracted and classified,and corresponds to the defined ontology to form an entity in the graph data.The construction of the marketing and distribution graph entity can be expressed as follows:
where Eij is the jth entity of the ith ontology,for example,E11 is the first entity of the district ontology.Pij is the attribute set of the entity Eij,and PVij is the attribute value set of the entity Eij.It should be noted that Pijand PVij have a one-to-one correspondence.
Each entity Eij defines Pij0=EID,which is the entity identification attribute,the value of PVij0 is unique in Eij,Pij1=RID is the entity connection identification.For example,all meter box entities of the meter box ontology O3 include a connection identifier Pij1=DistrictID of the district where belonged,indicating the O2 entity to which they belonged.
A shared correlation can be observed between the main data among the systems during the construction of the marketing and distribution entities,because all the systems are independent.Different properties of an entity may originate from different systems.In this study,we first extract and construct separate entities for the different systems,and subsequently merge the entities with the same EID and attributes.The attribute value of the main data source system is preferentially adopted; otherwise,all the same attributes are retained to prevent information loss,which can be caused via direct merging.
2.4 Construction of marketing and distribution graph relation
A relation refers to the link between entities in the attribute graph and is crucial for association analyses and knowledge reasoning.The marketing and distribution graph data contain two types of relations:those between entities and those between entities and attributes.The correlation between the ontologies is generally inherited directly because the correlation between the entities is relatively simple.For example,in(Meter box,Belongs,District),“Belongs”represents the relation between the meter box ontology and the district ontology,which is expressed as(Meter Box1,Belongs,District1)following its inherited usage in the entity.The correlation between the entity and attribute is mainly obtained by extracting or summarizing the key information of the attribute source business description.The general method is “attribute name + modifier,” such as(User,industry category is,general industry and commerce).The construction of the marketing and distribution graph relationship can be expressed as follows:

where Eij,Emn are entities,Pmn is the attribute of the entity,Rij×mn is the relation between the two entities,and between the entity and the attribute.
2.5 Construction of marketing and distribution graph model
The graph data ontology,entities,and relations required for the interconnection of the marketing and distribution data are established based on the process explained in previous sections.The resulting ontology realizes the definition of the graph data schema,while the entities and relations realize the conversion of original business data to graph data entities and relations,forming(entity,relation,entity)and(entity,relation,attribute),which integrate multiple business system data elements.Triples are stored in a graph database.Furthermore,all the data in marketing,distribution,and integrated energy sources are transformed and stored into the ontology,entity,and relation based on the data structure of each business system associated with the ontology.In this manner,the construction of the marketing and distribution graph model is completed.
where G is graph data triples set,S is the starting entity set,R is relation set,and E is the target attribute set.For example,the marketing and distribution systems have insufficient maintenance of the connection between the meter and transformer due to business segmentation.The user’s meter is only associated with the transformer through the district,and it is impossible to determine which transformer the user belongs to.This study proposes to first improve the power receiving relation between the meter box and the transformer,and then infer the connection relation through the relation between the user and the meter box and the relation between the meter box and the transformer,expressed as “meter entity E4j ‘Belongs to’ ‘power supply range’ of the transformer E1n”.
3 Topology identification algorithm for marketing user and transformer relation
The “one graph of marketing and distribution” data model,as described in the previous section,contains all the transformer relation information at the end of the power grid; it places considerable pressure on distribution network topology analyses with frequent user business processing.Furthermore,the real-time update of the distribution network topology entails high requirements for the transformer relation accuracy.Therefore,it is necessary to comprehensively verify and maintain an accurate relation between the users and transformers in the graph data model built in this study.Accordingly,the correlation between business distribution and household transformers is represented using a graph topology analysis.The abnormal topology of the transformer,abnormal power consumption,and other problems can be determined quickly through integrated marketing and the correlation with users in the distribution network.This,in turn,significantly reduces the difficulty associated with interdisciplinary topology troubleshooting and O&M.Moreover,the load and operation status of a power grid vary at different times based on the operation and physical characteristics of the transformer; consequently,the load on the user side will also change to a certain extent.Here,the transformer and user power supply connections under the same phase are determined,and the change trends of the user-side load and transformer load are closely related.Based on the law of conservation of energy,the total electric quantity of the distribution transformer in the same phase is equal to the sum of the measured electric quantity,variation loss,and line loss of all the users connected to the phase.We propose a topology identification and completion algorithm for marketing and distribution,based on the conservation of transformers and electricity marketing.The steps involved in the specific process are presented below:
(1)The associated lines,stations,and user meters are obtained sequentially from a single distribution transformer node based on the transformer sequence number.We verify whether the user meter address belongs to the distribution transformer range based on the metering point address; nonconforming addresses are eliminated.
(2)According to the law of conservation of energy,the total electric quantity of the transformer is equal to the sum of the electric quantity of the associated users and the line loss.The daily electric quantity of the distribution transformer and that of the users within a certain period are obtained,and a parameterized model of the electric quantity of the distribution transformer users is constructed.
(3)A global optimal solution process for the distribution transformer user electricity parameterization model is developed using the stochastic gradient descent and cosine annealing adjustment methods.
(4)The weighted average loss rate,maximum loss rate,and minimum loss rate are calculated based on the historical loss data of the transformer and line,and the user’s power parameter threshold is defined as “1-loss rate” to determine whether the distribution transformer user is normal.
(5)The model is trained using the transformer data for different time periods,and the optimal training results are obtained.We determine whether the user–transformer correlation is normal based on the user’s electricity parameters.The power consumption addresses of the abnormally distributed transformer users are also obtained.The address information for a batch of users is compared with the unit.If they are identical,the marketing department then determines whether the user is invalid on-site.The diagram data model is maintained,and the next transformer is then obtained for further calculations.If it differs,the transformer with the matching address is determined through a global search,and model training is performed again.
6)This process is halted once the topology information of all the distribution transformer users is determined.
Figure 4 depicts the flow of the topology identification and completion algorithm for marketing and distribution.

Fig.4 Flowchart for topology identification and completion algorithm
Based on the aforementioned algorithm,a relational model is established between the total electricity of the transformer and the electricity of the connected users according to the law of energy conservation,as follows:
where yt is total electricity of the transformer at time t,which is calculated by collecting 24 times a day on the total meter,t is an integer from 1 to 24; n is the number of user meters connected to the transformer in the graph topology,ai is an identifier for meter connecting to the transformer,1:connected,0:unconnected; is electricity of the ith user meter at time t,ξtotal is the sum of the transformer change loss and district line loss which is referred to as the bus loss.
Under the same distribution transformer,the bus loss exhibits a positive correlation with the total electricity of the distribution transformer.Based on the consistency of the load change between the distribution transformer and the connected user meter,the bus loss allocated to each user meter can be determined as follows:
where ξtotal is the sum of the bus loss calculated by n connected meters,the bus loss shared by each meter is related to its metered electricity; bi is the bus loss coefficient of the ith meter.The relational model can be converted by substituting(6)into(5),as follows:
The change in the electricity consumption is minimal as the users of the marketing and distribution grids are mainly residential users;bi can be approximated as a fixed value.Based on(5),ai and bi are considered as metered electricity coefficients.Let ci=ai+bi; consequently,(7)can be simplified as follows:
According to(8),the meter and transformer correlation can be presented as follows:
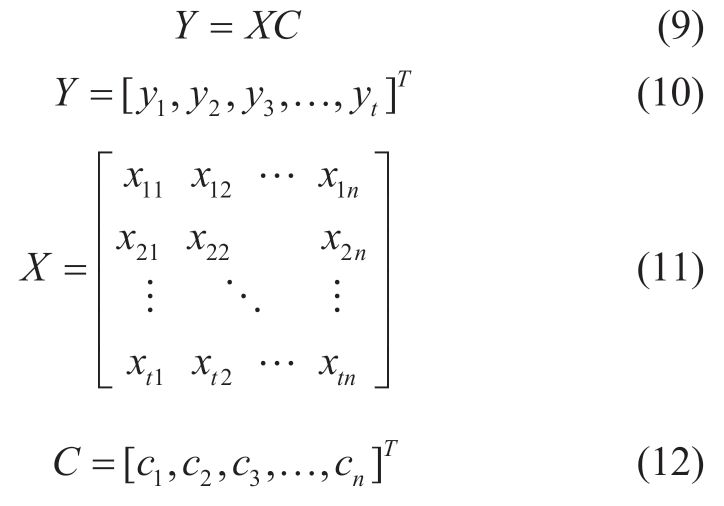
where Y is a vector formed by the total electricity of transformer in T days,C is a vector of metered electricity coefficient corresponding to n meters to be solved,X is the metered electricity matrix of n meters in T days,each row is the metered electricity value of n meters in a certain day,and each column is the metered electricity value of a user in T days.
Thus,the conservation of electricity conforms with the law of conservation of energy.Therefore,the solution process for(9)can be described as follows:
(1)Associate the time node and collected data through“a graph of marketing and distribution,” obtain the 24-point electricity data of the transformer and user’s electricity consumption over one day within a specific time range,input these values in the equation,and initialize the metered electricity coefficient,C,to a vector of all 1s.
(2)The stochastic gradient descent algorithm with hot restart is used for the iterations,the number of iterations in a single round is set to K=1×10⁵,and the number of loop rounds is set to R=3.The loss function,Lloss,of the lth iteration is defined as the sum of the squared errors of the equation system,which can be represented as follows:
where Xt is the metered electricity matrix of n user meters on tth day,Cl is the metered electricity coefficient matrix corresponding to the lth iteration,l∈[1,K].The gradient δ of the loss function with respect to the metered electricity coefficient Cl,the derivation process is shown as follows:
where is the derivative of Xt to Cl.
The metered electricity coefficient vector is updated by current step size and the gradient descent direction,which is calculated as follows:
where ηl is the learning rate of the lth iteration,and its adjustment strategy is combined with the cosine annealing algorithm,the learning rate is adjusted as follows:
where l is the number of iterations,![]() is the max limit of the learning rate adjustment in lth iteration,
is the max limit of the learning rate adjustment in lth iteration,![]() is the min limit of the learning rate adjustment in lth iteration,and Tnow is the number of iterations of the learning rate from the start to the end of each hot restart,Tl is the number of hot restarts.
is the min limit of the learning rate adjustment in lth iteration,and Tnow is the number of iterations of the learning rate from the start to the end of each hot restart,Tl is the number of hot restarts.
The value of C must be confined after each round of looping to avoid the fast convergence of the metered electricity coefficient,which affects the overall solution of C;the criterion rule is expressed as follows:

when cl is negative,it is judged that there may be errors in user meter document,that is,the user meter is not connected to the transformer,when cl is greater than 0.8,it means that the user meter document is normal; when 0≤cl≤0.8,it means that parts of the metered electricity coefficients are locally optimal,the initial parameters need to be adjusted and solved iteratively again.
(3)The sliding time window algorithm is employed to determine whether the transformer’s total electricity corresponds with the metered electricity of the users for the different times.The historical collected data are divided intom time windows,and different starting times are implemented to solve the parametric model of the transformer electricity at different times.The union of all the solutions is determined to obtain the preliminary identification results for the user-transformer relation.
Lastly,the relation between the meter box to which the user meter belongs and the transformer in the “one graph of marketing and distribution” is maintained for missing users based on the results of the user and transformer relations determined using the model.The correlation between the user meter and the current meter box is deleted to avoid incorrect topology information.
The correlation identification scenario between lowvoltage users and transformers in a certain province is verified using this algorithm.There are approximately 3 million low-voltage users and approximately 50000 transformers in the province.The model is trained by obtaining the power consumption data of the low-voltage users over a period of approximately one year.The resulting trained model is capable of identifying 119 abnormally associated users in a certain city area,while 138 are verified on-site,with an accuracy rate of 86%.
4 Marketing and distribution graph computing framework
Graph data in the marketing and distribution business field include the distribution equipment,marketing equipment,marketing users,and time-series collection data items.Consequently,these can reach a scale of billions of graph nodes and tens of billions of edges; the amount of associated data can reach Terabytes and Petabytes.The existing structured data calculation framework based on association tables in various business systems cannot meet the requirements of cross-professional data calculations.The data centers built at power grids adopt a distributed mass storage computing mode on top of the cloud computing architecture.They utilize the large amount of integrated resources to provide support for the storage and computing of network-related data in the integration of the marketing and distribution graph [21].The BSP [22] computing mode is also adopted,which can fully utilize the message communication mechanism [23] and improve the execution efficiency in task computing.Therefore,it can meet the demands of application scenarios with high timeliness requirements [24],such as O&M,topology optimization control,and user power outage services.
Herein,we propose a data storage and graph computing processing framework to meet the data computing requirements of marketing and distribution graphs for the business distribution panorama.This includes business data extraction,graph data storage,graph computation,and a graph application interface.Figure 5 presents the graph computing framework for marketing and distribution.The business data extraction module extracts the relevant scenario data from the original business databases,such as distribution,marketing,and comprehensive energy,or from the data center shared layer.It stores these data in the graph database using the graph data loading and conversion module.The graph data storage layer is a native graph database that directly stores data in a graph structure defined by nodes,edges,and attributes,and also automatically performs graph data segmentation and graph indexing.The graph computing layer provides graph parallelism,hierarchical computing,and associative computing models.It supports features such as message communication,synchronous control,and fault-tolerant management,and also improves the integration of linked data computing and reliability of parallel computing.The graph application service interface provides an interface for graph computing and system operation level command=for the application software corresponding to the business scenario of marketing and distribution.It also provides static,dynamic,and mixed graph layout algorithms; shape rendering; and other visual services for business graph data.
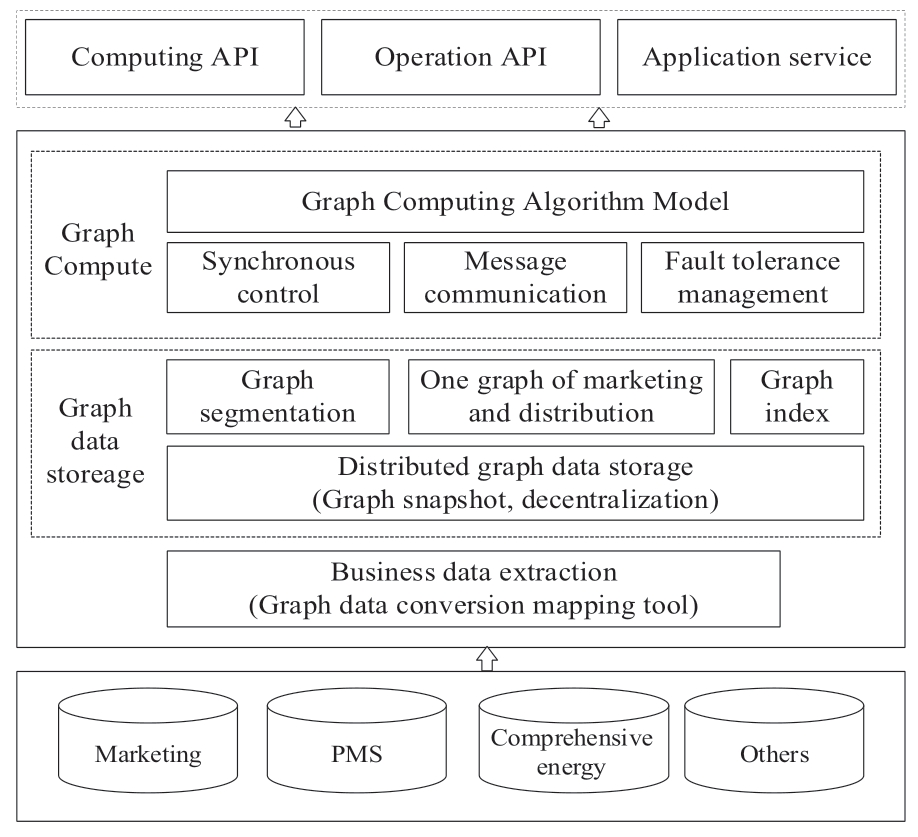
Fig.5 Marketing and distribution graph computing framework
A graph computing task executor of the “microoperation” model is designed to reduce the large amount of resource consumption and decrease the reduction in performance caused by the execution of various tasks such as topology analyses and power flow calculations in the marketing and distribution field.Figure 6 depicts the design process.The graph algorithm application program constructed using the deployment topology analysis and power flow calculation tasks based on the directed acyclic graph strategy is disassembled into a series of graph algorithms.These algorithms are then disassembled into a series of graph operations,which are further disassembled into a series of basic micro-operation units.The distributed task scheduling system can execute each micro-operation unit on the most suitable cluster node,thereby improving the execution efficiency of the entire graph computing task.
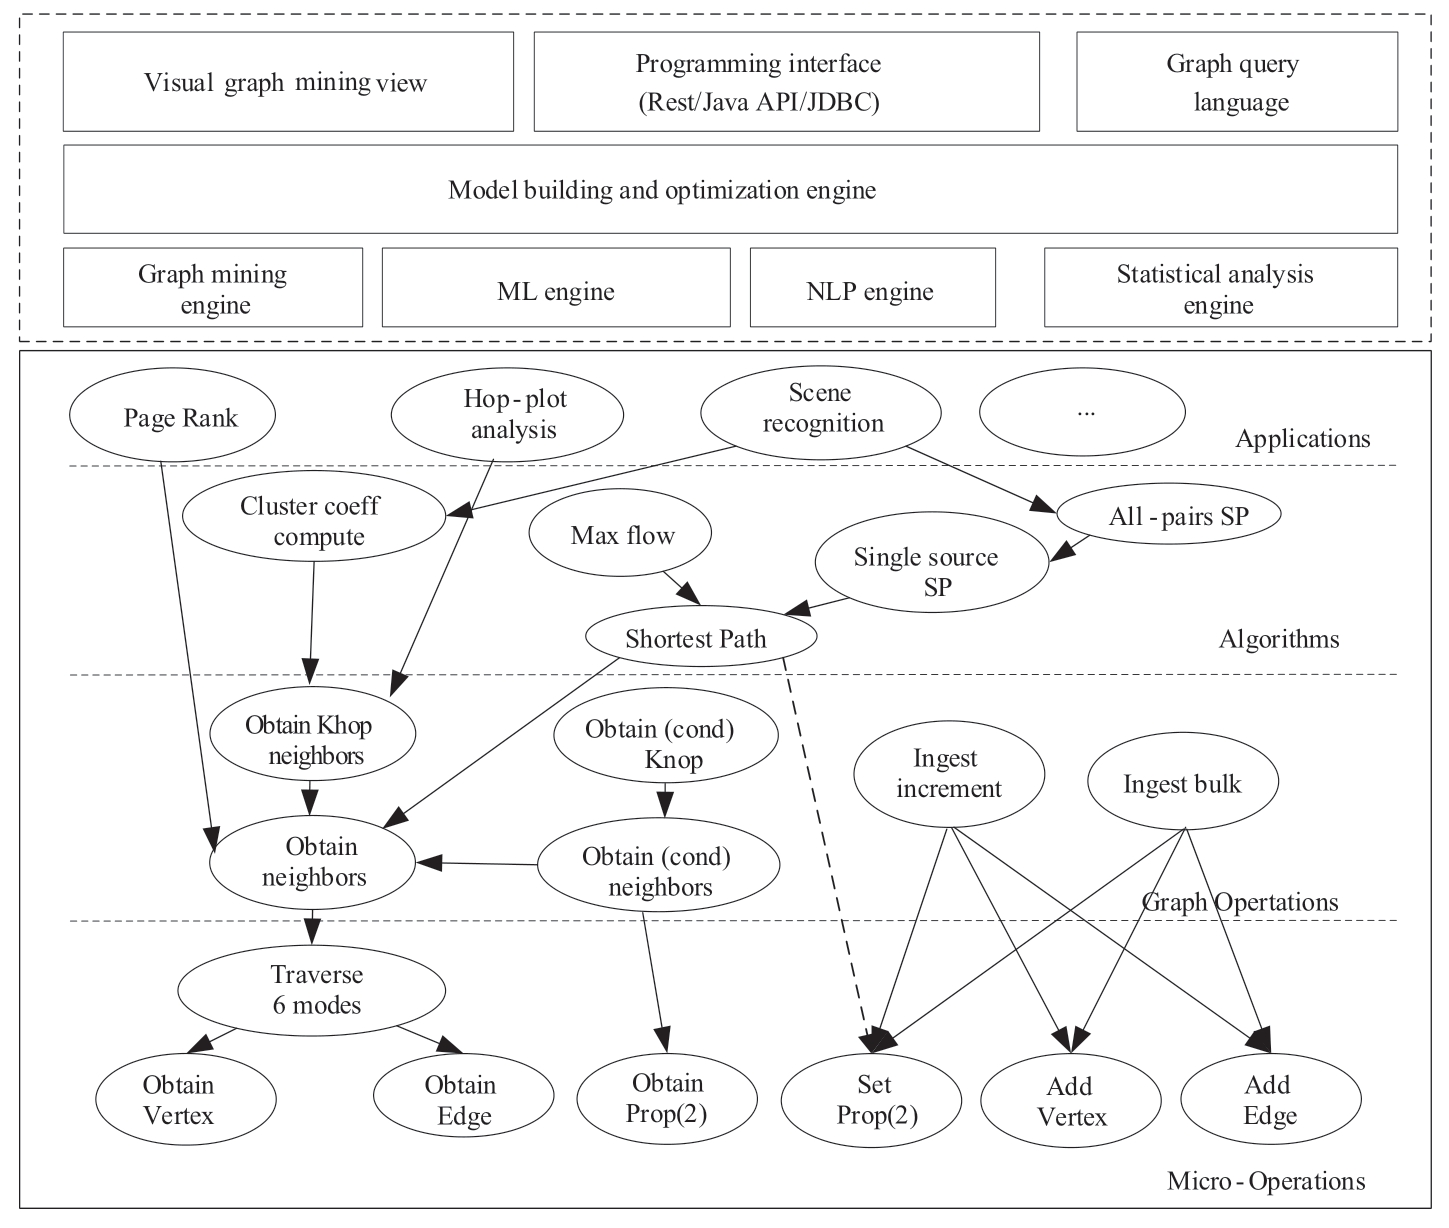
Fig.6 Graph computing task executor based on “micro-operation”
5 Application of marketing and distribution grid based on graph computing
5.1 Distributed photovoltaic power generation and distribution load forecasting
The React and SpringCloud are used to develop the consumption prediction software for marketing and distribution load power generation and to provide the functional modules of the distribution load prediction and distributed photovoltaic power generation forecasting.The software integrates distributed photovoltaic power generation,marketing smart meters,supervisory control and data acquisition,and GIS system data to generate the fusion graph data [25-27].The distribution load forecasting and distributed photovoltaic generation forecasting function modules obtain the relevant data of the smart meter load and distributed photovoltaic generation.Subsequently,they extract the features and call the graph computing framework in-depth learning and graph machine learning algorithms for training,to obtain the distribution load forecasting and distributed generation forecasting models.The two models are combined after business correction to form a comprehensive load and construct the distributed photovoltaic generation forecasting consumption model.
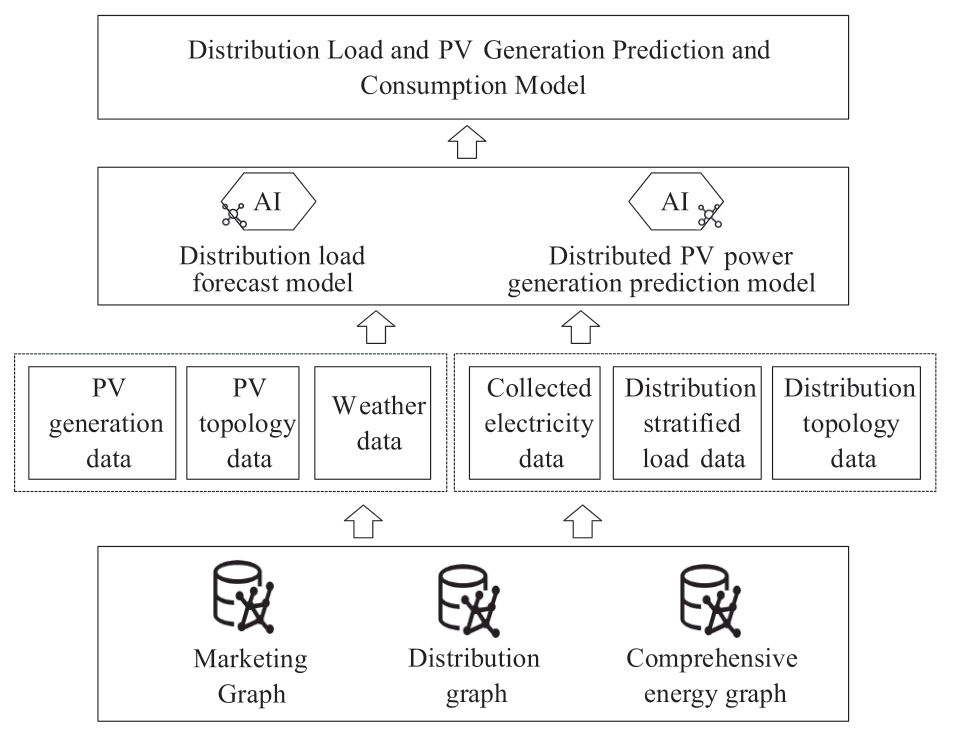
Fig.7 Distribution load and distributed photovoltaic generation prediction and consumption model
The software is deployed in the information intranet of a province to assist the EMS system for the prediction of distributed photovoltaic short-term loads.Specifically,the software is used to comprehensively analyze the load fluctuations of the regional distribution network for 763 distributed photovoltaic power generation users in a city,and a 15 min load matching forecast curve is obtained.The BP neural network,CNN-LSTM,ConvLSTM,and XGBoost models are implemented to build the load forecast models; the 5 and 10 d datasets are used for model training to verify the effect of the software forecast algorithm.Table 2 lists the forecast results of each model.
Table 2 Forecast results for each model

It can be observed that the forecast accuracy of the model improves with an increase in the length of the dataset.The accuracy of the BP model is the lowest,whereas that of the graph forecast is the highest.The CNN-LSTM and ConvLSTM models are based on the LSTM algorithm,where the difference between the results of these models is small.The XGBoost model can better utilize the sliding window data for multi-step prediction.The resultant effect is better than that of the other algorithms,albeit slightly lower than that of the graph forecast.The CNN-LSTM,ConvLSTM,and XGBoost models require the longest training times with an increase in the datasets,followed by the graph forecast; by contrast,the BP model requires the least training time.Therefore,the graph forecast presents the best comprehensive prediction ability and achieves good results in practice.
5.2 O&M knowledge graph reasoning application for marketing and distribution equipment
The developed O&M knowledge graph reasoning application software comprises a central control layer,an engine layer(graph question answering engine,document question answering engine,full-text search engine),a graph database,and system components supporting the engine layer.The engine layer implements Q&A services corresponding to O&M management,document retrieval,and intelligent search services based on knowledge graphs.Figure 8 depicts the core reasoning mechanism of the O&M knowledge graph reasoning application software used for the marketing and distribution equipment.Natural language processing and semantic analysis technology are used to realize rapid queries and quasi-real-time acquisition of the power equipment data based on the equipment account,equipment status information,equipment-related technical specifications,and equipment maintenance data.The associated entities and their attributes can solve the problem of the timeliness and accuracy of the O&M fault location,research,and verification to query the existing equipment by using knowledge graph multi-hop technology.Furthermore,the intelligence level of the O&M of marketing and distribution equipment can be improved.
The application is implemented in a province in China.An O&M knowledge graph query and answer engine is built for the daily O&M of 40735 kV distribution transformers and lower.Hundreds of documents such as equipment topology,historical operation data and standards,manuals,guidelines,and specifications corresponding to the distribution field are integrated.Users can obtain all the historical O&M data and information within the relevant scope,along with topology and probability analysis for faults,by using the relevant keywords.Since the application was put into operation,it has identified hundreds of faults,reduced the O&M time by 70%,and achieved good application results.
6 Conclusion
Herein,we proposed the “one graph of marketing and distribution” data model and a graph computing framework based on BSP for the marketing,distribution,and comprehensive energy business fields.A topology identification algorithm was also designed to maintain the relations between marketing users and distribution transformers.Furthermore,an accurate relation was established between the marketing and distribution businesses to effectively connect the marketing and distribution graph data.The proposed data model can express marketing and distribution businesses more efficiently and realize a precise expression of “the model is the business,” as compared with the existing independent operating relational data models and crossprofessional analysis and processing methods based on association tables.Moreover,the distributed photovoltaic power generation and distribution load forecasting system,established using the “one graph of marketing and distribution” model and graph computing framework,efficiently synergizes the distribution load demand and improves the real-time consumption of distributed energy.The application of knowledge graph reasoning for the O&M of distribution equipment helps in the rapid identification and intelligent analysis of defects in the distribution and consumption equipment.It should be noted that this study focused solely on the typical knowledge graph reasoning and graph machine learning prediction models.However,multi-factor prediction models combined with the topology of distribution equipment and various new energy sources have not been fully considered thus far.Hence,future works will focus on combined application research that integrates the topology optimization control of distribution equipment,real-time load forecasting,and multi-terminal new energy consumption.Additionally,we aim to further expand the application scenarios of the marketing and distribution businesses using graph data.
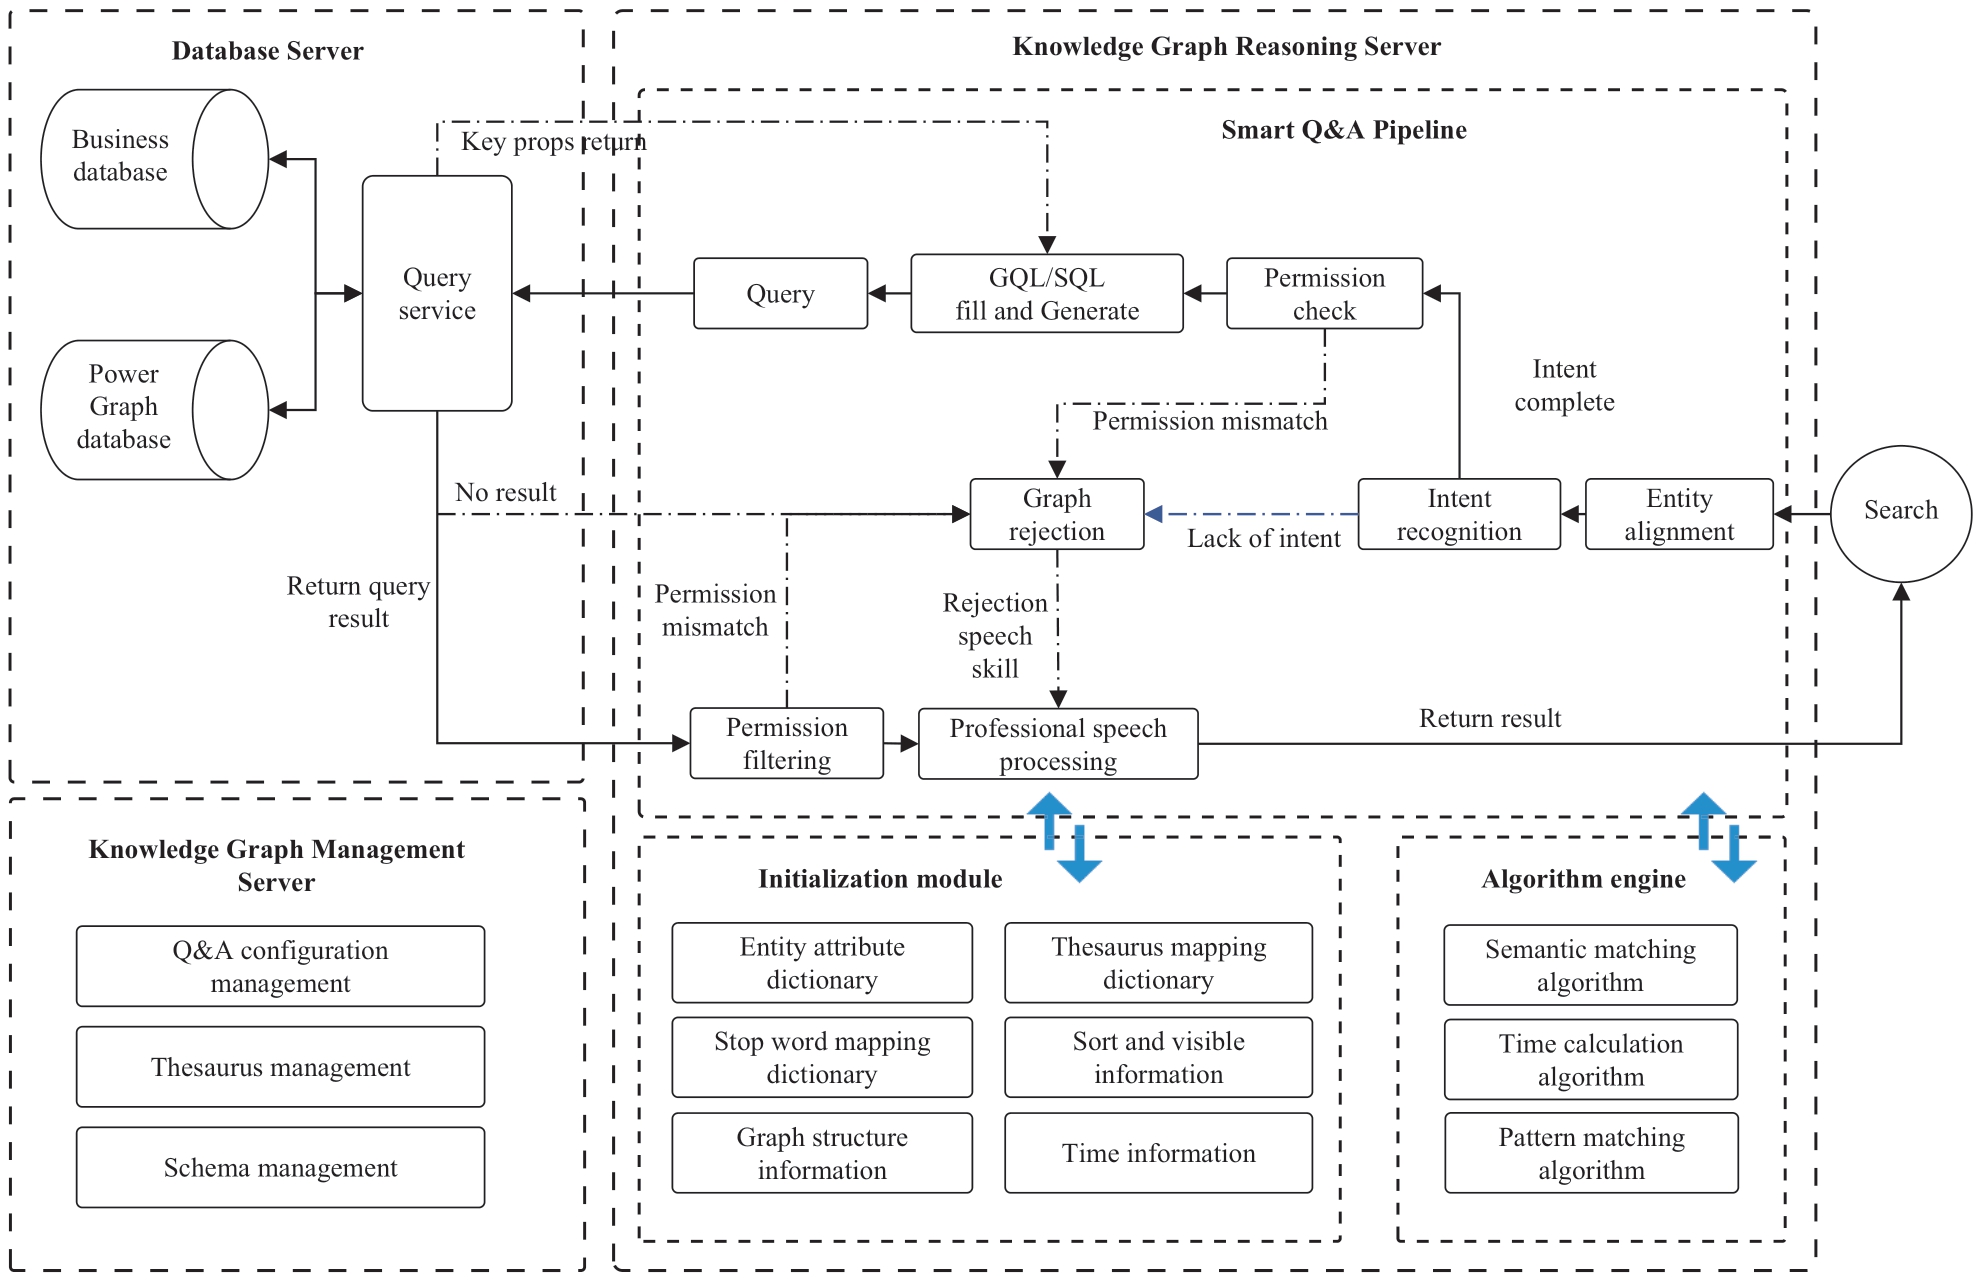
Fig.8 O&M knowledge graph reasoning application for marketing and distribution equipment
Acknowledgements
This work was supported by the National Key R&D Program of China(2020YFB0905900).
Declaration of Competing Interest
We declare that we have no conflict of interest.
References
[1] National Development and Reform Commission(2021)Accelerate the formulation of top-level design documents for carbon peak,carbon neutralization.http://www.xinhuanet.com/fortune/2021-05/18/c_1127460853.htm
[2] Xie X,He J,Mao H,et al.(2021)New issues and classification of power system stability with high shares of renewables and power electronics.Proceedings of the CSEE,41(2):461-474
[3] Kong Q,Wu Y(2021)Research on smart grid discovery law based on matching data fusion.Computer & Digital Engineering,49(2):310-314
[4] Liu P,Jiang W,Wang X,et al.(2020)Research and application of artificial intelligence service platform for the power field.Global Energy Interconnection,3(2):175-185
[5] Zhang B,Liu X,Xue D,et al.(2021)Realization of information fusion platform for distribution network.Microcomputer Applications,37(7):179-198
[6] Xiao Y,Zhao Y,Tu Z,et al.(2019)Topology checking method for low voltage distribution network based on improved Pearson correlation coefficient.Power System Protection and Control,47(11):37-43
[7] Yang T,Zhao L,Wang C(2019)Review on application of artificial intelligence in power system and integrated energy system.Automation of Electric Power Systems,43(1):2-14
[8] Li J,Wang X,He J,et al.(2021)Distribution network fault location based on graph attention network,Power System Technology,45(6):2113-2121
[9] Xiao M,Wang S,Ullah Z,et al.(2020)Topology detection in distribution system using kernel-node-map deep networks.IET Generation,Transmission & Distribution,14(19):4033-4041
[10] Fang J,Yang F,Tong R,et al.(2021)Fault diagnosis of electric transformers based on infrared image processing and semisupervised learning.Global Energy Interconnection,4(6):596-607
[11] Zhang S,Hou C(2021)Model of decentralized cross-chain energy trading for power systems.Global Energy Interconnection,4(3):324-334
[12] Zhou A,Zhu L,Wu X,et al.(2019)Accurate querying of frequent subgraphs in power grid graph data.Global Energy Interconnection,2(1):78-84
[13] Yan W,Wang G,Lin J,et al.(2019)Method for LV distribution network topology verification based on AMI metering data,Electric Power,52(2):125-133
[14] Liu Q,Li Y,Duan H,et al.(2016)Knowledge graph construction techniques.Journal of Computer Research and Development,53(3):582-600
[15] Grzegorz M,Matthew H A,Aart J C,et al.(2009)Pregal:a system for large-scale graph processing.Proceedings of the 21st Annual ACM Symposium on Parallelism in Algorithms and Architectures,Calgary,Alberta,Canada.135-145
[16] Miller J J(2013)Graph database application and concepts with NEO4J.Proceedings of the Southern Association for Information Systems Conference,Atlanta,USA,141-147
[17] Deutsch A,Xu Y,Wu M,et al.(2019)Tigergraph:a native MPP graph database.https://arxiv.org/pdf/1901.08248.pdf
[18] Sakr S,Orakzai F M,Abdelaziz I,et al.(2016)Large-scale graph processing with Apache Giraph,Springer Cham
[19] Gao Z,Zhao Y,Yu Y,et al.(2020)Low-voltage distribution network topology identification method based on knowledge graph.Power System Protection and Control,48(2):34-43
[20] Li W,Yu W,Xin B,et al.(2021)Method of supporting distribution network atlas checking based on graph database.Power System & Automation,43(5):37-44
[21] Ren J,Zhang X,Xue C,et al.(2021)Research on key technologies of power big data for smart grid applications.XINXIJISHU,05:147-152
[22] Zhao X,Li B,Shang H,et al.(2017)A revised BSP-bashed massive graph computation model.Chinese Journal of Computers,40(1):223-235
[23] Song J,Sun Z,Mao K,et al.(2017)Research advance on MapReduce based big data processing platforms and algorithms.Journal of Software.28(3):514-543
[24] Wang J,Cang M,Zhai X,et al.(2022)Research on power-supply cost of regional power system under carbon-peak target.Global Energy Interconnection,5(1):31-43
[25] Fan Y,Chi Y,Li Y,et al.(2021)Key technologies for medium and low voltage DC distribution system.Global Energy Interconnection,4(1):91-103
[26] Khodayar M,Wang J H(2019)Spatiotemporal graph deep neural network for short-term wind speed forecasting.IEEE Transactions on Sustainable Energy,10(2):670-681
[27] Tang Y,Liu T,Liu G,et al.(2019)Enhancement of power equipment management using knowledge graph.Proceedings of IEEE PES ISGT Asia,Chengdu,China:1-6
Biographies

Kai Xiao received master degree at North China Electric Power University,Baoding,in 2013.He is working in China Electric Power Research Institute Co.,Ltd.His research interests include power big data technology,graph computing and marketing business.

Daoxing Li received master degree at North China Electric Power University,Beijing,in 2021.He is working in China Electric Power Research Institute Co.,Ltd.His research interests include artificial intelligence and graph computing.

Xiaohui Wang received the Doctor’s degree from North China Electric Power University,Beijing,2012.He is currently working at the China Electric Power Research Institute Co.,Ltd.Beijing.His research interests include power big data technology,artificial intelligence,active distributed network,energy internet.

Pengtian Guo received master degree at North China Electric Power University,Beijing,in 2020.He is working in China Electric Power Research Institute Co.,Ltd.His research interests include power Internet of things and artificial intelligence.
(Editor Yajun Zou)
