0 Introduction
Power cable,GIS and other power equipment are widely used in urban grids due to easy installation and laying,and good electrical and heat resistance properties [1-2].However,power equipment in actual operation is affected by the installation process,laying environment,external damage and other factors,which can lead to insulation defects and even insulation breakdown accidents [3-4].Power equipment often produces electromagnetic waves,ultrasonic waves,and ultraviolet light before insulation accidents occur[5-7].These signals or phenomena can be detected to avoid insulation defects in the equipment and thereby improve the operational reliability of power equipment.Acoustic testing is a non-intrusive detection method that is less affected by external electromagnetic noise and has been widely implemented in the field [8-11].Vibration can be used to detect internal electrical faults in a DFIG stator,rotor [12].In reference [13],an optimized deep transfer learning network based on a one-dimensional convolutional neural network is built to identify the health conditions of planetary gearboxes from the resultant vibration signal.Partial discharge occurs in power equipment due to insulation defects,and the acoustic signal excited by the discharge has a wide frequency band.The transmission rate of acoustic signals in power equipment is low,and various interference noises are mixed during the transmission process.The acoustic array sensor device can fully utilize the spatiotemporal characteristics of the sound signal,which has a strong anti-interference ability for the interference signal.It can be used for the removal of background noise,sound source localization,and tracking target sound sources.Therefore,the acoustic array sensor device can be used to effectively detect the partial discharge ultrasound signal.
An acoustic array sensor device is an array consisting of several microphones arranged in a geometric structure.Sound source localization based on microphone arrays involves detecting multiple sound signals using microphone arrays,analyzing and processing the sound signals,and locating the sound source in the spatial domain.Previous studies on acoustic array sensor devices have focused on the arrangement of acoustic array sensors [14-15],beam localization algorithms,and simulation verification [16]to improve the positioning accuracy of the acoustic array sensor devices [17].Acoustic imaging technologies include the delay summation beamforming algorithm [18-21],non-negative least squares deconvolution beamforming[22],deconvolution approach for the mapping of acoustic sources(DAMAS)algorithm [23-24],multiple signal characterization(MUSIC)algorithm [25],and the artificial bee colony algorithm [26].In reference [27],acoustic array detection techniques were employed to analyze the time domain graph,spectral graph,and frequency domain-time domain chromatogram characteristics of different noise sources to identify the noise source types of the substation equipment.The sound recognition methods primarily include the pattern matching method [28],statistical model method [29],and artificial neural network method.These methods can obtain better results in practical applications;however,sound recognition methods based on the pattern matching technique involves a large number of operations.Recognition systems based on artificial neural networks require a long training time and have poor dynamic regularization ability.Therefore,such models cannot be adequately trained for large-scale samples.The method based on statistical modelling also involves a large number of operations during training,but the number of operations for sound recognition is lower than that of the pattern matching method.These factors limit the popularization and application of the three sound recognition methods presented above.Meanwhile,the research conducted on the diagnosis algorithm of the partial discharge type acoustic array sensors is relatively limited.The partial discharge type diagnosis method based on the PRPD diagram has a high rate of error in the system diagnosis.This affects the operation and maintenance strategy of the power equipment and reduces the reliability of the power equipment.
This study presents an equal-area multi-arm spiral array design model,which employs machine learning using the fast Fourier transform clean(FFT-CLEAN) sound source localization identification algorithm.The spatial resolution and iteration times of the system are verified through simulation analysis.The acoustic spectrogram formation and analysis diagnosis method can effectively reduce the system errors of the conventional phase resolved pulse sequence(PRPS)map diagnosis method,which are caused by the resolution of the acoustic array sensor device and the digital signal time domain pulse of an acoustic imaging device.The acoustic imaging technology based on the acoustic spectrogram can be used to quickly detect faults during the inspection of power equipment.It can also effectively improve the equipment maintenance process.
1 Design of the power equipment acoustic array sensor device
In recent years,handheld acoustic imaging equipment have been employed for the manual inspection of power equipment.The acoustic imaging technology involves the joint detection of the full spectrum of sound,light,and electricity.It can be used to achieve the non-contact collection of the power equipment state information and closed equipment state perspective.It can detect latent defects in electrical equipment,which are either visible or perceptible.Acoustic imaging technology can be implemented in substations to perform equipment detection,timely detection of fault causes,and to effectively improve the equipment maintenance process.
Various noises are present in the equipment test or operating environment which are unrelated to the partial discharge ultrasonic signal.They include mechanical vibration noise(120 Hz–4 kHz),corona noise(9–19 MHz),electromagnetic radiation noise(30 MHz–30 GHz),and so on.The transmission law of the acoustic signal generated by partial discharge within the equipment is complex and can penetrate various media,along with the complex and diverse local noise of the equipment and environment.Therefore,the robustness and false alarm rate of the existing acoustic imaging systems cannot meet the requirements of the front-line inspection staff,and further improvement of the acoustic imaging method is required.
1.1 Overall design of the power equipment acoustic array sensor device
The power equipment acoustic array imaging detection technology uses microphone arrays to measure the sound field distribution within a certain range.It then displays a visual image in the form of a cloud map,which can be used to measure the location of the sound emitted from power equipment and the state of radiation.The design of the power equipment acoustic array sensor device employs the microphone array technology and sound source localization technology.It contains three modules:data acquisition,data processing,and data display.First,the microphone array in the data acquisition module senses the partial discharge sound signal of the power equipment.The data processing module then superimposes and locates the sound information using the data obtained from the video acquisition module.Finally,the data display module visualizes the location point of the partial discharge of the power equipment.Fig.1 depicts the block diagram of the acoustic array sensor device system,and Fig.2 presents the data flow of sound source localization system.
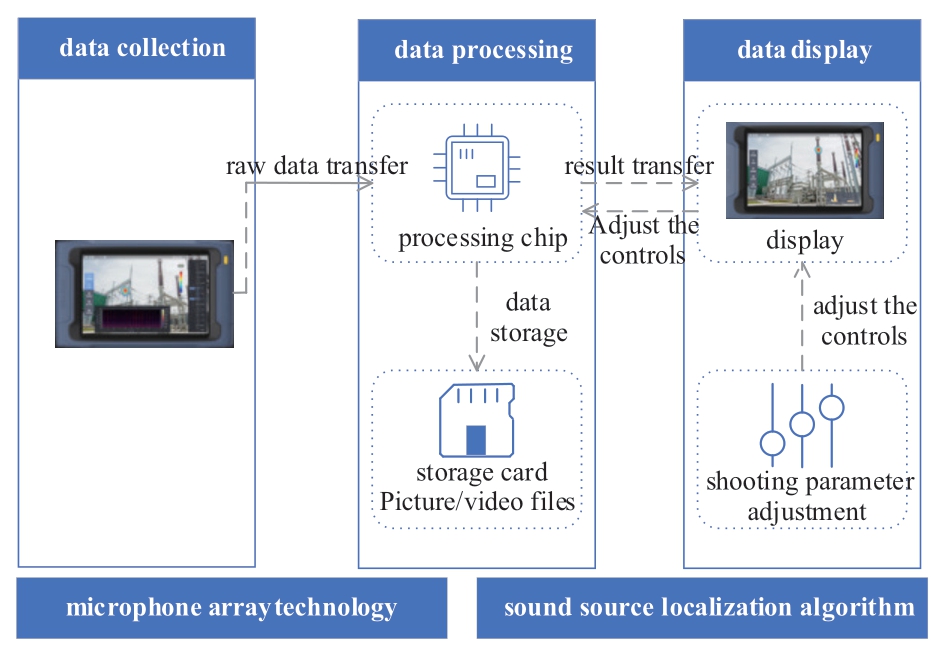
Fig.1 Block diagram of acoustic array sensor device
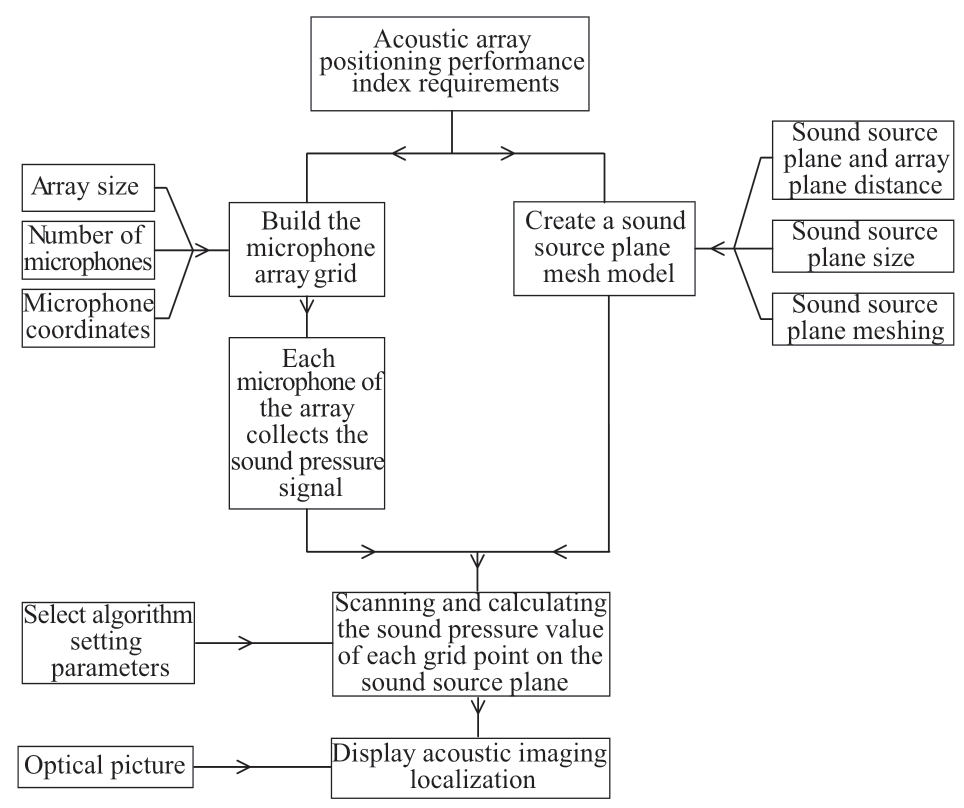
Fig.2 Data flow of sound source localization system
1.2 Microphone array technology
The conventional acoustic detection devices typically employ a single microphone noise collection system,which uses a single sound sensor for the power equipment operation data and fault sound collection.Therefore,they are vulnerable to background noise and external interference noise.The detection range of a single microphone is limited,and the collected target sound signal is of poor quality.It is particularly vulnerable to interference from other devices,due to which the microphone cannot focus on the acoustic characteristics of the power equipment fault.Additionally,when the power equipment abnormal state is low,a single microphone requires a long time for signal collection,abnormal sound labeling,and signal processing.The process is time-consuming and labor-intensive.Furthermore,the device cannot automatically remove the interference noise outside the region,leading to errors.
The power equipment acoustic array sensor device developed in this study can effectively perform power equipment inspection and presents several advantages over the conventional single-microphone imaging system.In the process of array design,low frequency resolution requires a large array aperture and high frequency dynamic range requires high microphone sensor density.Therefore,regular distribution processing is convenient,and spiral distribution presents good comprehensive performance.Considering the above factors,an equal-area multi-arm spiral array design model is employed in this study.
Fig.3 depicts the configuration of the three microphone arrays.Fig.3(a)depicts the proposed equal-area multi-arm spiral array,Fig.3(b)depicts the conventional grid array,and Fig.3(c)depicts the cross array for comparison.The device comprises 112 microphone channels,and a beamforming algorithm with high dynamic range and resolution is used for the visualization of the sound signal and the identification of the partial discharge.The resulting beam pattern demonstrates the effectiveness of the array in rejecting sound sources located far away from the focus point,which is determined by the next highest lobe in the array response,referred to as the maximum sidelobe level(MSL).
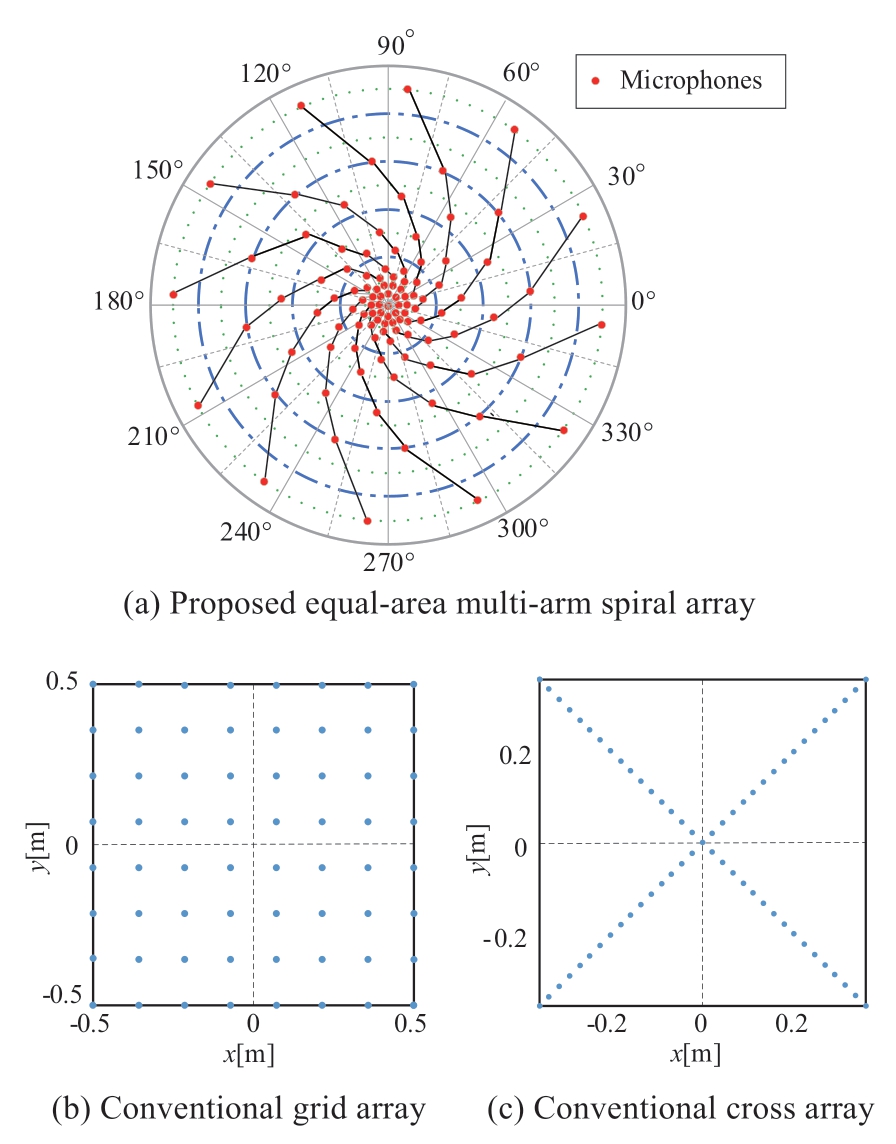
Fig.3 Acoustic array sensor device array design
Fig.4 depicts the MSL of the proposed equal-area multiarm spiral array,which is approximately -12 dB,while that of the grid array is -5 dB and that of the cross array is -6 dB.The absolute value of MSL indicates the dynamic range of the acoustic array.The equal-area multi-arm spiral array presents better performance with the dynamic range when compared to other arrays.
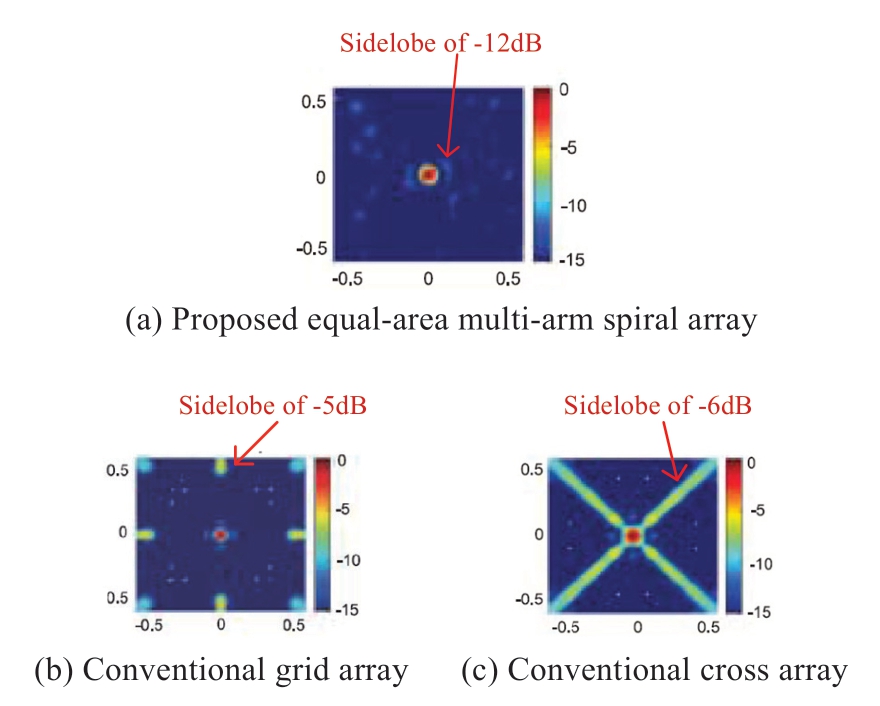
Fig.4 Acoustic array response
1.3 Sound source localization algorithm based on FFT-CLEAN
The sound source localization algorithms used to detect power equipment leakage and partial discharge localization include the beamforming algorithm,time differences of arrival(TDOA)method,and so on.These methods calculate the correlation matrix of the spatial spectrum by obtaining the signal of the sound transmission array.The direction of the sound source can be effectively estimated in theory.However,the practical estimation of the direction of the sound source with a suitable positioning accuracy requires a larger computational cost.The spectral estimation method used for a large array is computationally intensive and is vulnerable to environmental noise,which can lead to inaccurate localization.
In this study,the FFT-CLEAN algorithm is employed in the development of power equipment acoustic array sensor device for accurate sound source identification and localization.The basic concept of CLEAN involves clarifying the source identification results by repeatedly removing the array propagation function corresponding to the main flap peak from the conventional beamforming results.This method is integrated with FFT to obtain the FFT-CLEAN algorithm,which can effectively reduce the width of the main flap and attenuate the side flaps,thereby improving the accuracy of sound source identification and reducing the iterative workload.
First,the conventional beamforming output vector,b(0)=b,the mutual spectrum matrix of the acoustic signal received by the array microphone,D(0)=C,and the intensity distribution of the sound source reflected by the peak of the main flap,Q(0)=C,are initialized.The specific steps from the nth iteration to the n+1th iteration are as follows.The conventional beamforming output is calculated as follows:

The peak of the main flap of the conventional beamforming output,![]() is determined,followed by the location of the peak corresponding to the focus point,
is determined,followed by the location of the peak corresponding to the focus point,![]() The intensity distribution of the sound source is calculated as
The intensity distribution of the sound source is calculated as
where 0<1≤τ denotes the circulation factor and φ denotes the set beamwidth function.The beamwidth is set as R,when![]() ≡1 and when
≡1 and when![]() .The mutual spectrum of the main flap peak,
.The mutual spectrum of the main flap peak,![]() corresponding to the sound source is removed in D(n).The reconstructed conventional beam forms the output volume as follows:
corresponding to the sound source is removed in D(n).The reconstructed conventional beam forms the output volume as follows:

After I iterations of the calculation,the sound source intensity distribution is determined as![]() In the above iterative process,F denotes the Fourier transform and F-1 denotes the Fourier inverse transform.
In the above iterative process,F denotes the Fourier transform and F-1 denotes the Fourier inverse transform.
Fig.5 presents the simulation results of the sound source identification obtained by the MATLAB program by comparing the following three algorithms:DAMAS,CLEAN based on source coherence(CLEAN-SC),and FFT-CLEAN.
The results demonstrate the effectiveness of the algorithms in determining the two distinct acoustic source points in the identification maps.There are two simulated acoustic sources,placed 0.25 m apart in the simulation.In the curve,the color indicates the corresponding amplitude of the acoustic signals in the three maps depicted in Fig.5.Fig.5(a)depicts the DAMAS algorithm,in which the blackcolor edges of the two points merge.Fig.5(b)depicts the CLEAN-SC algorithm,in which the edges of the two points touch each other,but do not merge.Fig.5(c)depicts the FFT-CLEAN algorithm,in which the edges of two points diverge from each other for approximately 0.18 m,and can be observed clearly.The FFT-CLEAN presents the best spatial resolution among the three algorithms.
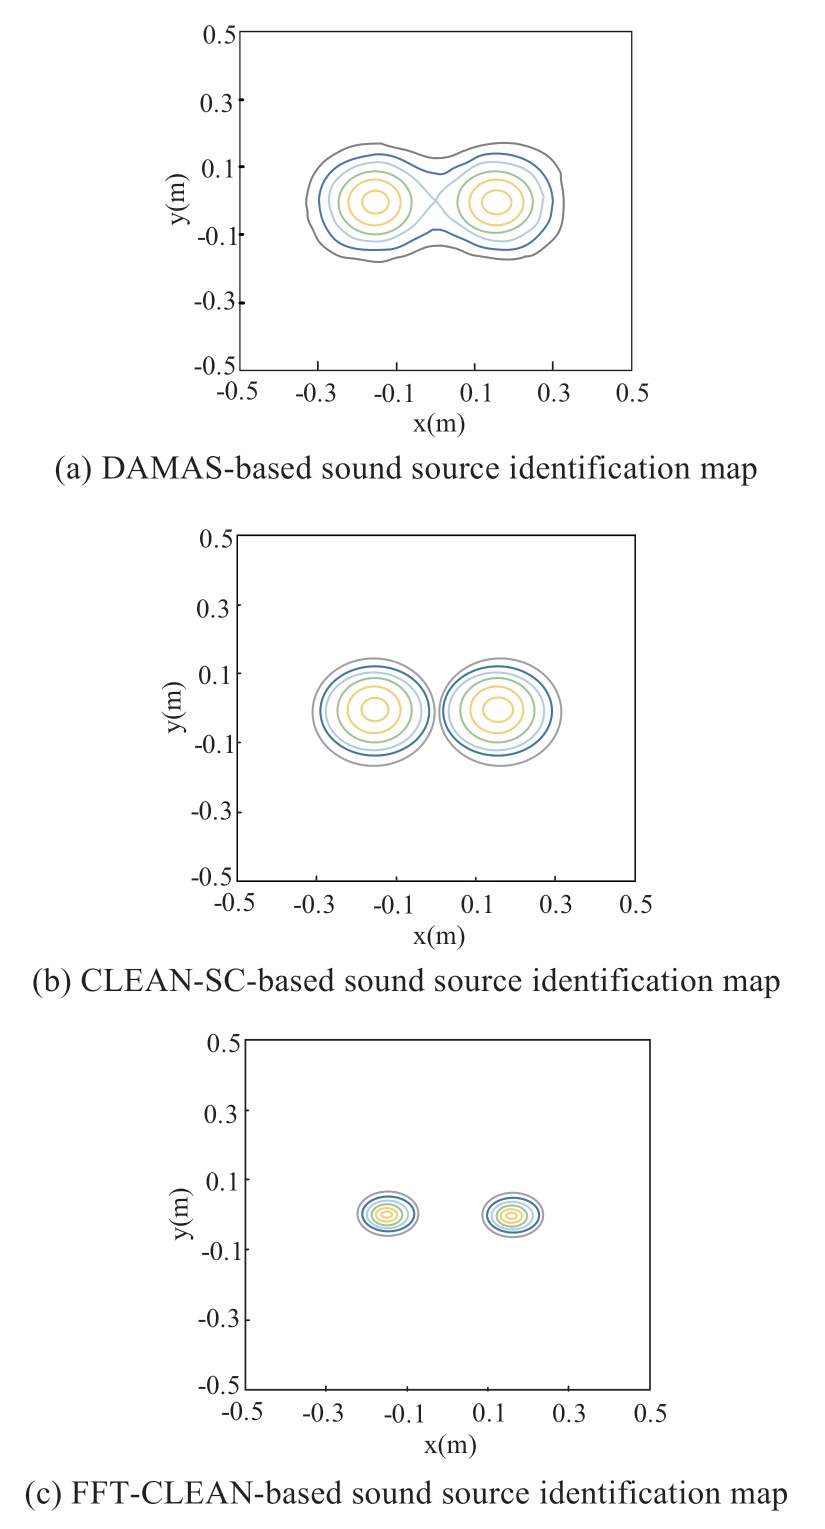
Fig.5 Algorithms for array spatial resolution enhancement
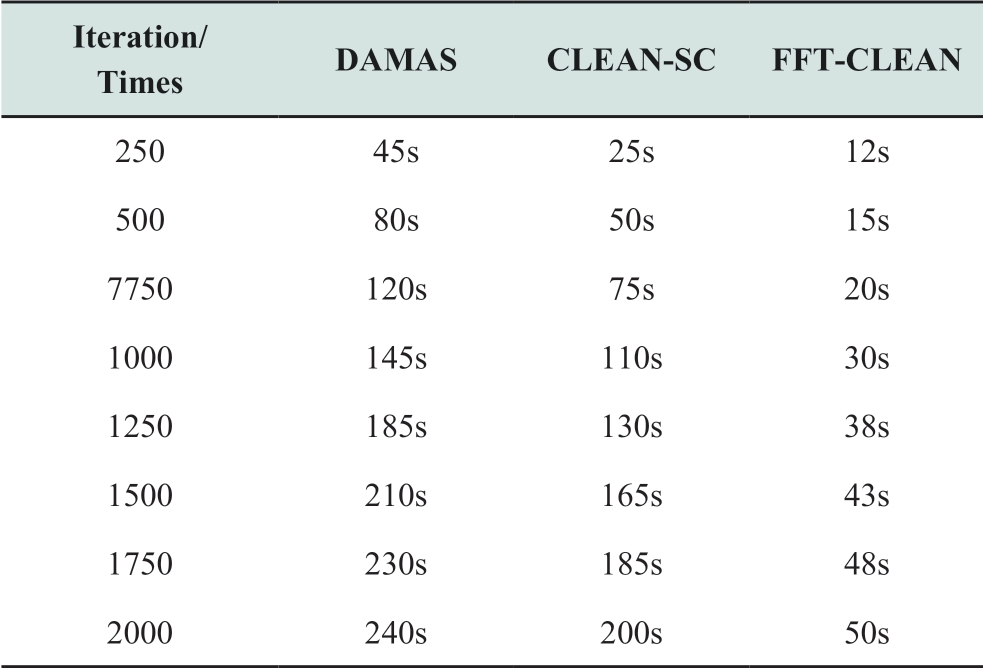
A comparison of the simulation speed comparison is shown in Fig.6.The simulation results demonstrate that the FFT-CLEAN machine learning algorithm improves the spatial resolution and reduces the computational workload.Table 1 presents the calculation time comparison data.The computational workload of FFT-CLEAN reduces with the increase in the iteration times.After 2000 iterations,the computational time of FFT-CLEAN is 1/5th of DAMAS,and 1/4th of CLEAN-SC.
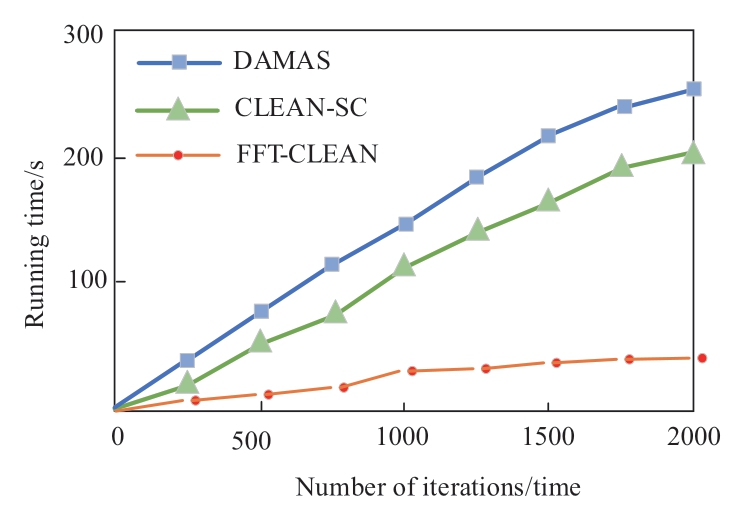
Fig.6 Sound source identification calculation time curve
Table 1 Comparison of calculation time between the three methods
1.4 Mapping method for acoustic array sensor devices
(1)Conventional PRPD map formation method
The original digital audio signal obtained by using the conventional acoustic imaging device partial discharge map is superimposed with a 50 Hz period,i.e.,20 ms based on the periodic characteristics of the partial discharge signal.The time-amplitude mapping is used to display the periodic pattern of the fault,which produces the PRPD mapping used for the diagnosis of partial discharge.Fig.7 depicts the mapping formation method of a conventional acoustic array sensor device.
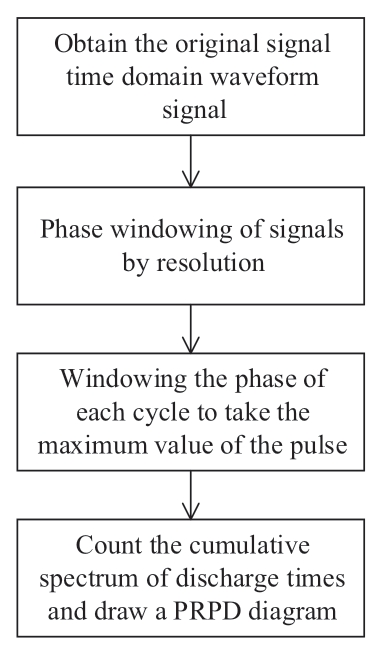
Fig.7 PRPD map formation method
Based on the process of the PRPD map formation,it can be concluded that the accuracy of the PRPD map exhibits a strong correlation with the resolution of the acoustic imaging device and the time domain pulse of the digital signal.However,a single microphone noise acquisition system is still used due to the complexity of the sound and propagation law of partial discharge generation and the diversity of the environmental conditions at the power equipment operation site.Therefore,the analysis and diagnosis model of the PRPD map presents a relatively high error rate.
Fig.8 depicts the testing circuit used to conduct the partial discharge experiments.A non-PD transformer with a high AC voltage,in the order of several kilovolts is used as the energy source for the test object.A partial discharge phenomenon is observed at the electrical weak point when the voltage applied to the defect models is higher than the threshold value of the partial discharge inception voltage(PDIV).The partial discharge current induced by discharges then flows through the test object and coupling capacitor.The partial discharge signals are amplified and transmitted to the detection equipment,which sample the signal,process the data,and display the result spectrum.
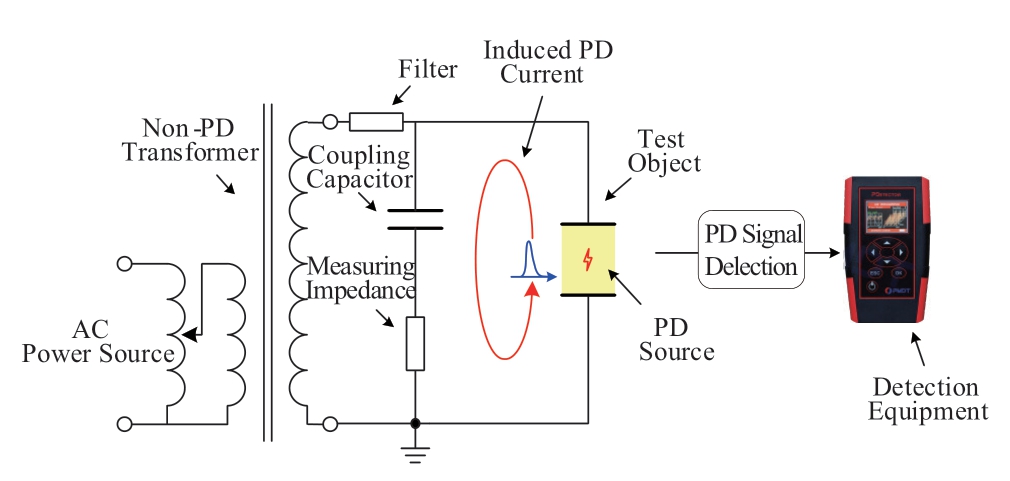
Fig.8 Testing circuit of PD experiment
Four defect models are developed and tested under the sinusoidal power-frequency voltage of several kilovolts to simulate the typical types of partial discharge in high voltage apparatus.The distinctive partial discharge patterns are corona PD,surface PD,void PD,and floating electrode PD,as shown in Fig.9.
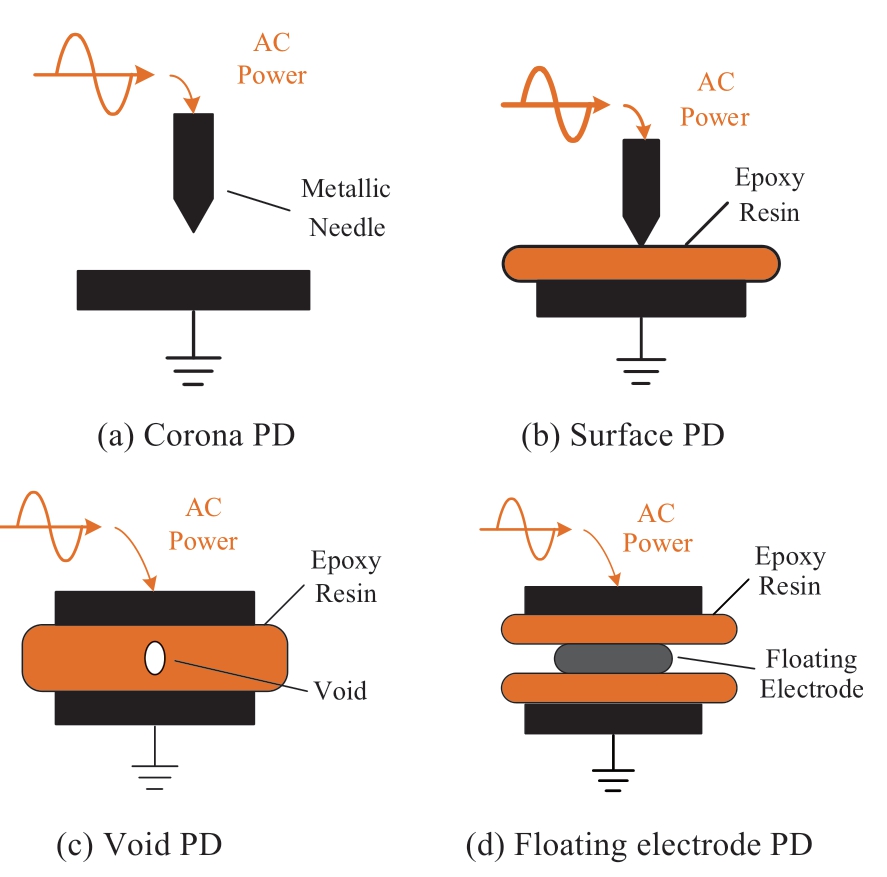
Fig.9 PD models of typical insulation defects
Fig.10 depicts the PRPD diagrams captured using the PD detection equipment from PMDT Ltd.The different types of partial discharge are distinguished based on the different characteristics of the PRPD diagram of power equipment.The different colors in the PRPD diagram indicate the density of the pulses.The unit is pulses/s(pulses per second),which refers to the number of normalized pulses recorded in one second.The bright color represents high density,while the dark color represents low density.
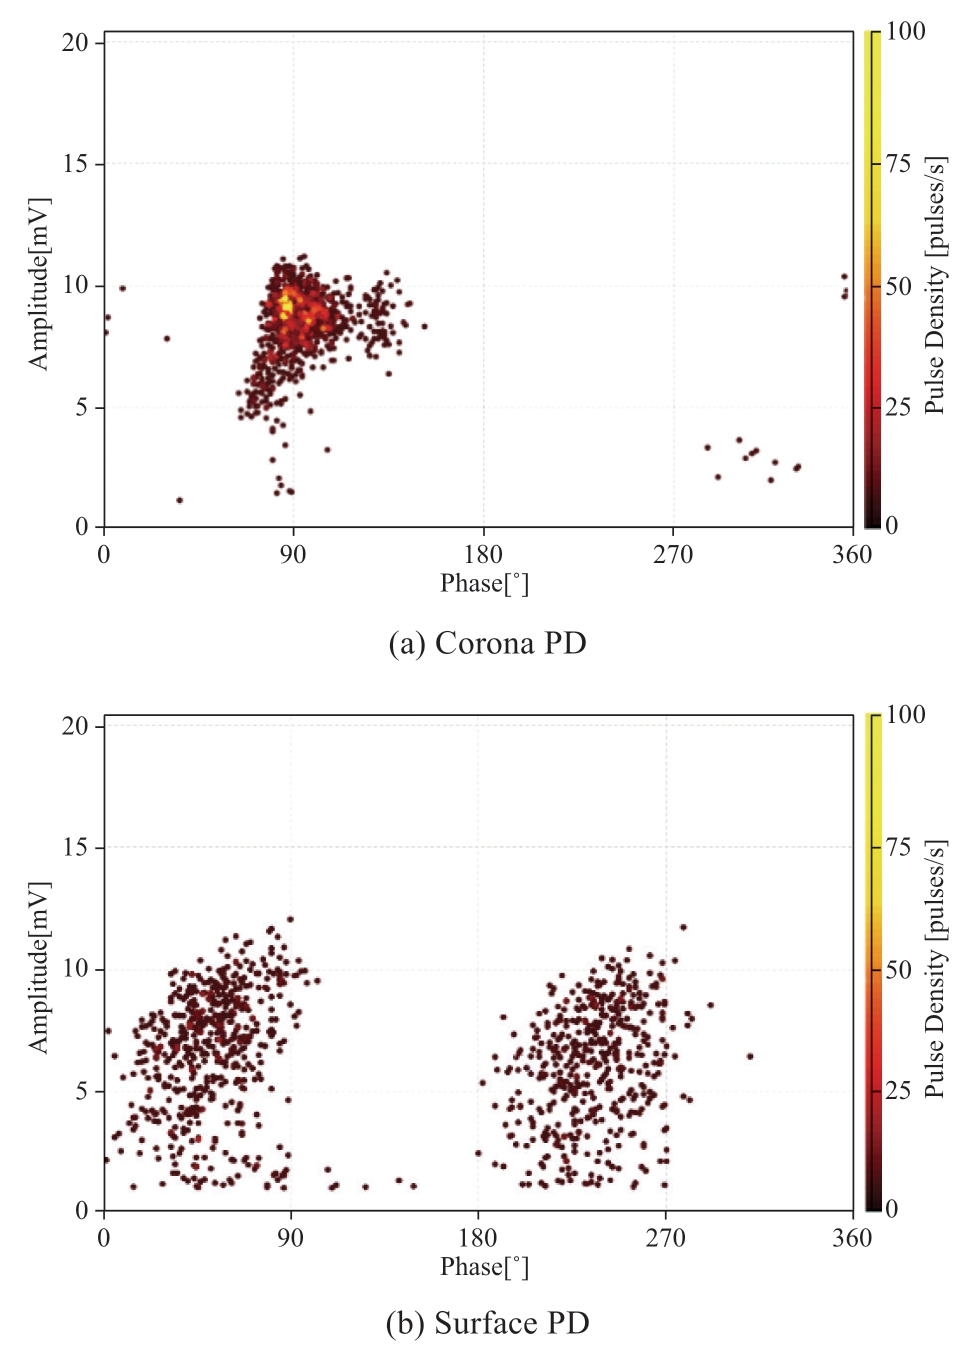
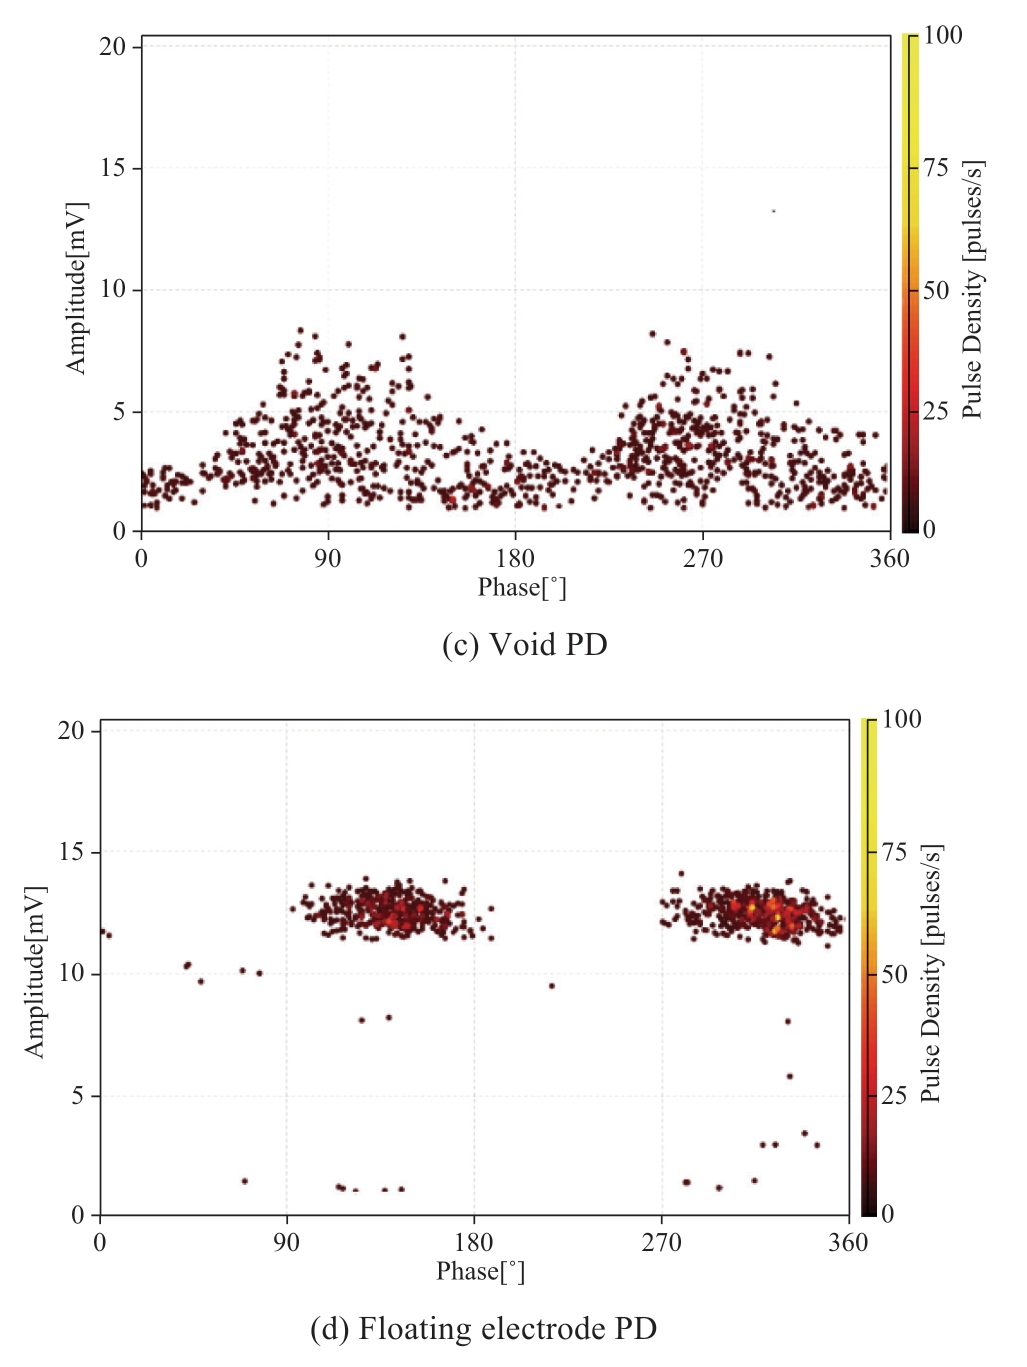
Fig.10 PRPD mapping of typical acoustic array sensor devices for power equipment
(2)Acoustic spectrogram formation method for acoustic array sensor device
The discharge characteristics of a power system primarily include its time-domain waveform,acoustic characteristics,statistical characteristics,and spectral characteristics.The time domain waveform is considered as the most intuitive representation of the signal,but it does not provide any detailed information about the characteristics of the signal.The acoustic spectrogram is formed through a detailed analysis of the acoustic and spectral characteristics of the sound signal.The time-frequency structure in the acoustic spectrogram reflects the signal time-domain and space-domain structure and can form a sparse basis function for acoustic perception.
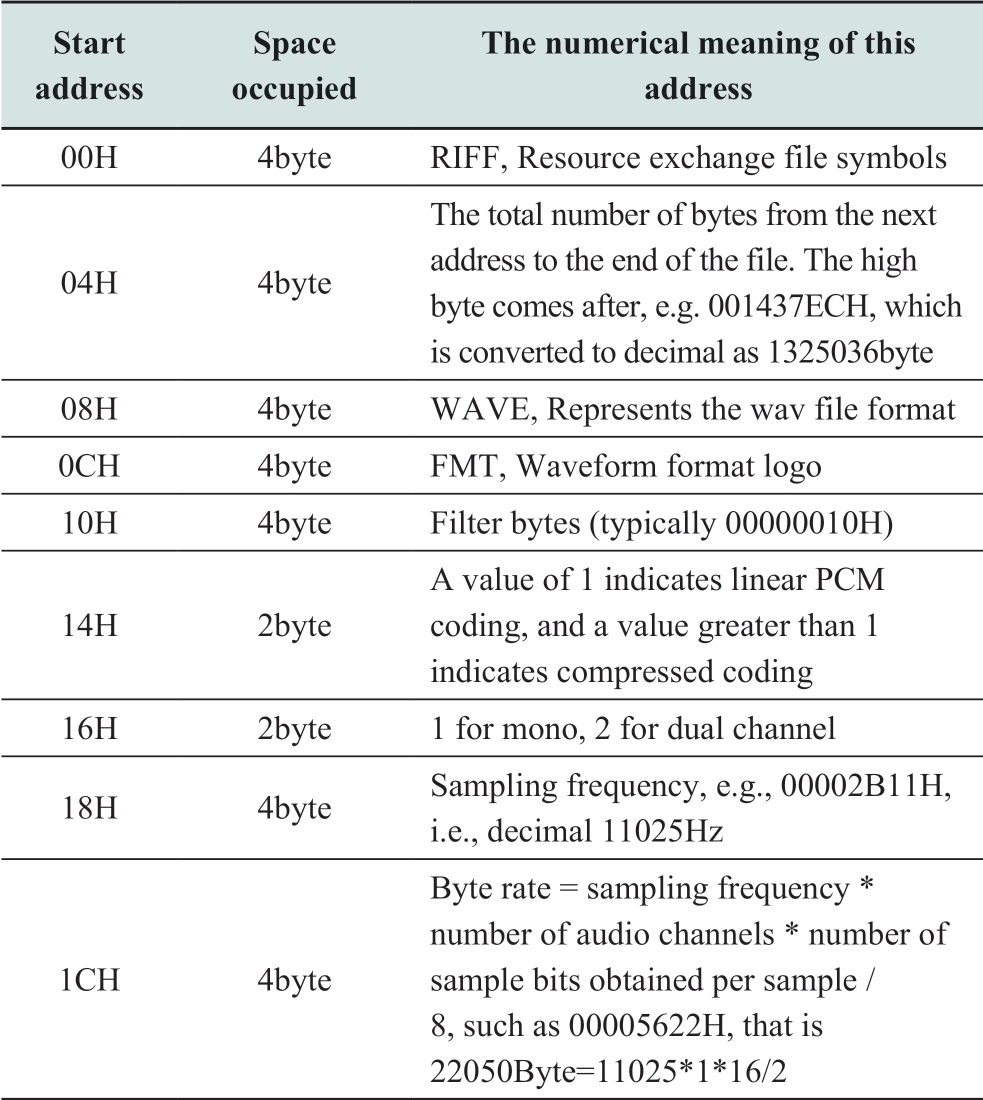
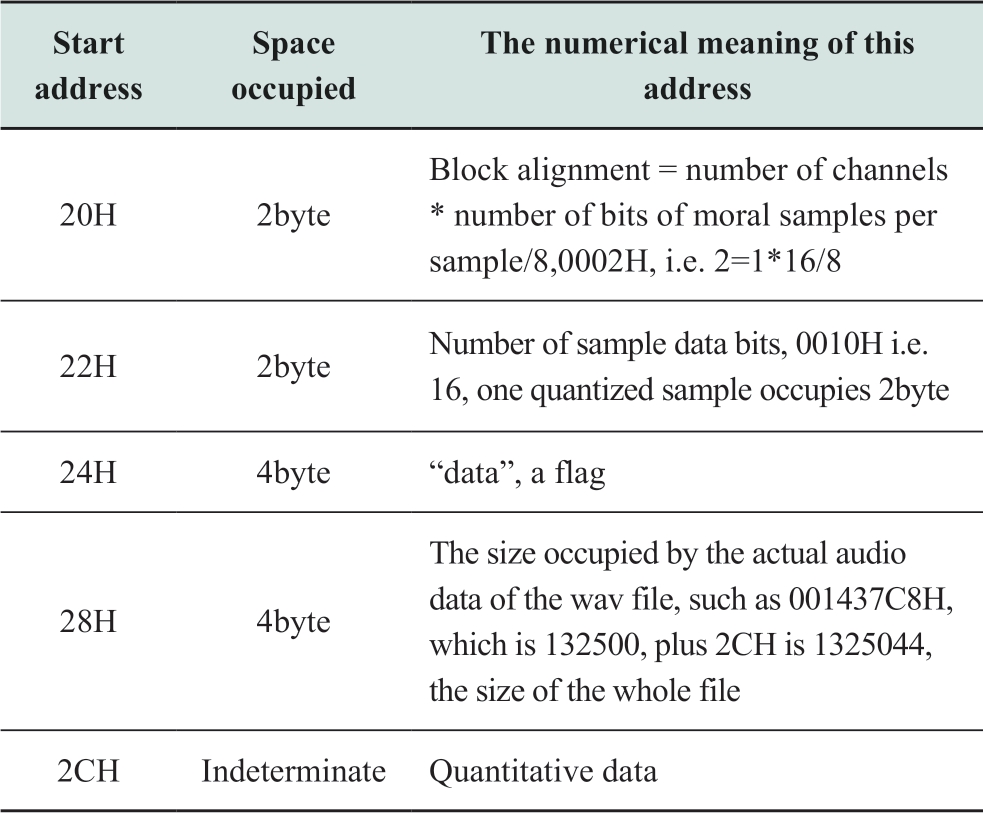
The acoustic spectrogram is a two-dimensional perceptual map that describes the sound signal and contains two-dimensional information on the frequency and sound pressure.The different frequency components of the sound signal at any given moment are represented by different grayscale values in the acoustic spectrogram.The sound pressure value is used to characterize each point and to enhance the characteristics of the sound signal.The sound array sensor device is a part of the sequential execution structure,which functionally consists of three main parts:audio data reading,data processing,and grayscale graph saving display.Fig.11 depicts the block diagram of the system.Table 2 presents the wav file data format.
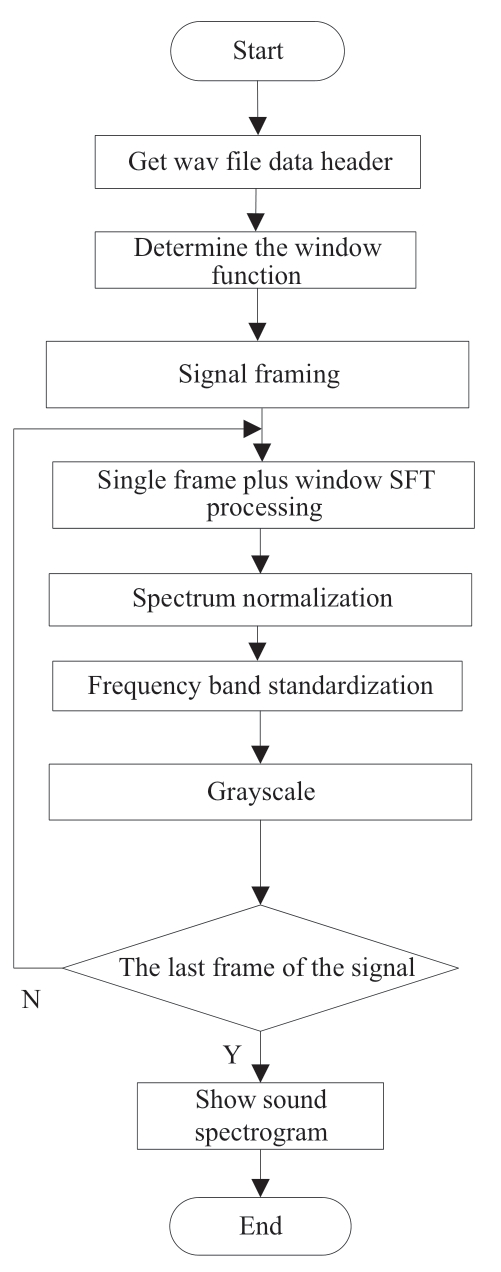
Fig.11 Method of forming acoustic spectrogram
Table 2 List of wav file data header information
continue
1.5 Application scenarios of acoustic array sensor device
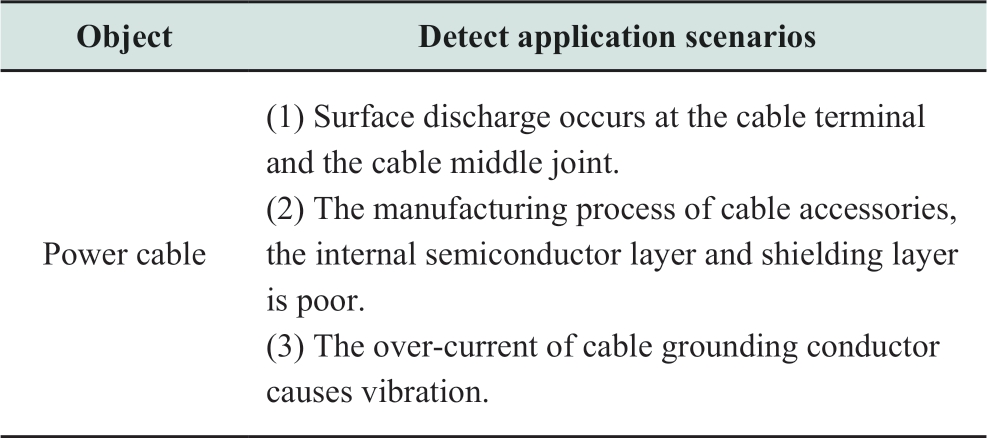
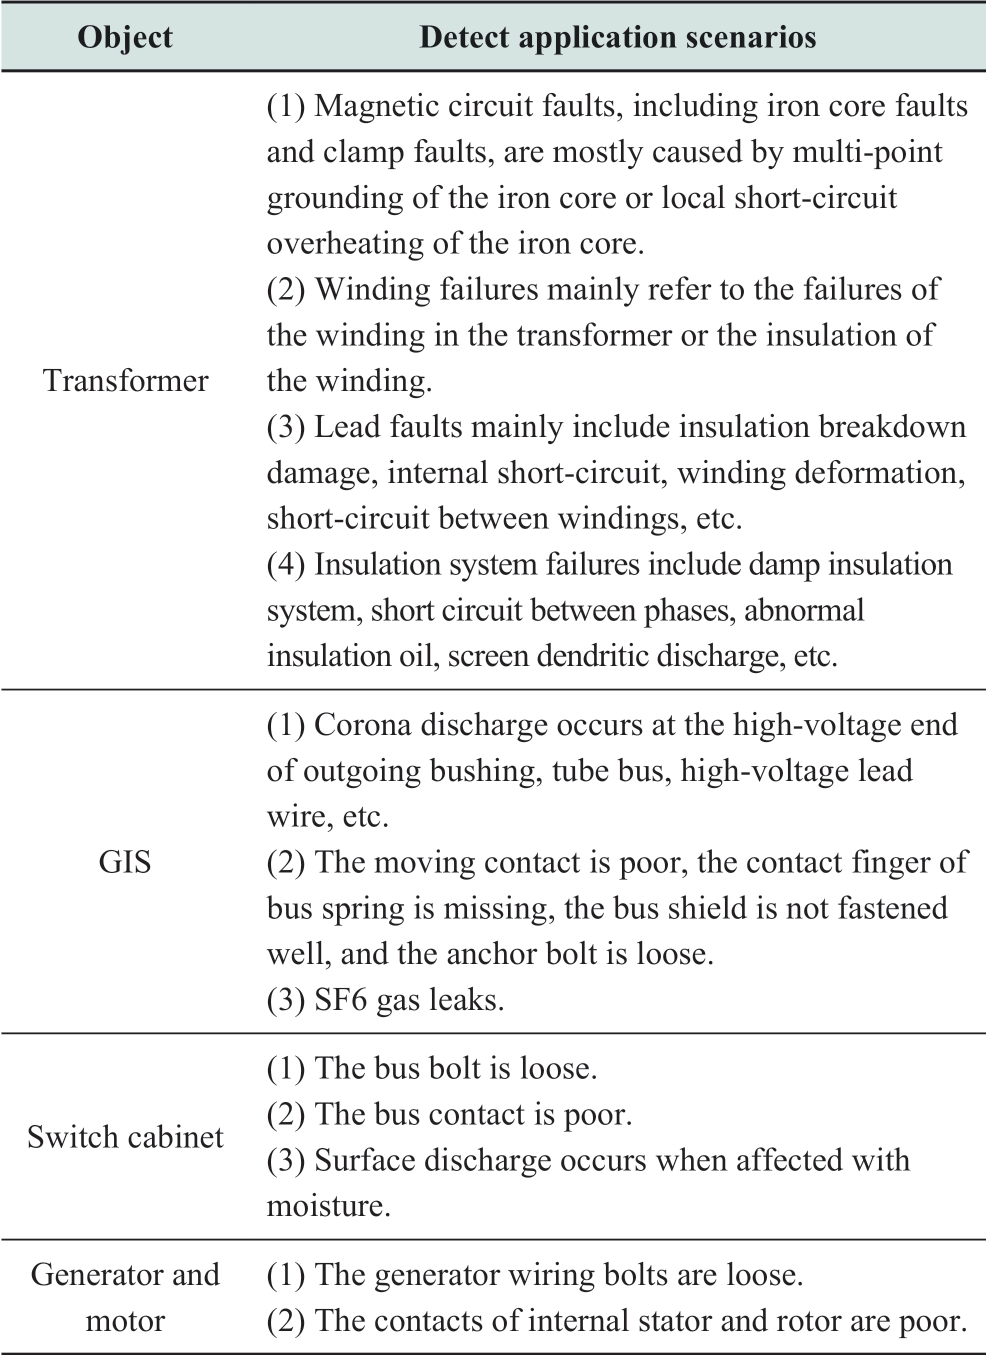
The mechanical vibration of power equipment will send out acoustic signals,which is essentially a kind of mechanical wave of power equipment radiating energy from vibration to sound transmission medium.The acoustic signals contain a lot of vibration information.When the equipment is in normal operation,the different states of the mutual movement between the fuselage and the firmware,parts,and parts themselves correspond to the different sounds emitted by the equipment,and the sound produced by the power equipment will also change when the operating state changes.When power equipment produces partial discharge,such as corona discharge with large discharge,corresponding sound signals will be generated.Therefore,the acoustic signals of power equipment contain rich information such as vibration and discharge,which is an important index to analyze the operating state of equipment.When power equipment fails,it will send out certain characteristic acoustic signals,which come from the following conditions,as shown in Table 3.
Table 3 Application scenario of power equipment acoustic array sensor device
continue
2 Audio information reconstruction
2.1 Signal framing and signal windowing
The original audio signal is a digital sequence with a high data length.Therefore,the original signal must be subdivided into several short-time signals of equal length.Each short-time signal is called a frame,with a certain overlap between the frames.The distance between the end position of each signal frame and the start position of the next signal frame is recorded as a step length,as shown in Fig.12.
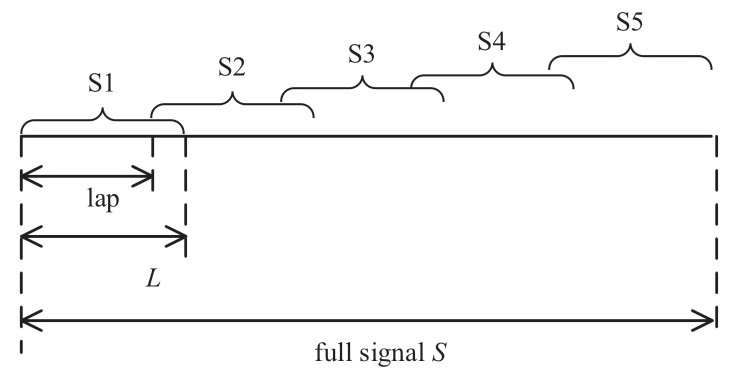
Fig.12 Signal framing diagram
A complete signal,S,is divided into several short-time signals,S1,S2,S3,S4,and S5 of equal length.A partial overlap region exists between S1 and S2,and the signal step length,lap,represents the distance between S1 and the start position of S2.Therefore,the step length between the signals is less than the signal length,L.The complete signal,S,can be divided into several short-time signals,as follows:
where the number of short-time signals is obtained by rounding up the operation results,L=1024.In this process,lap can be set freely,but a value greater than 512 is recommended for operational considerations.
The window coefficient is calculated based on the specific window function after setting the window signal width and window function.The short-time signal of the same length is then selected and the short-time signal sequence is multiplied by the corresponding number of bits with the window coefficient sequence.The new sequence is the window sequence of the short-time signal,as shown in Fig.13.

Fig.13 Short-time signal plus window schematic
A short-time Fourier transform of the temporal signal of the anomalous sound using a Hamming window as a sliding window is required to convert the pre-processed anomalous sound signal from time domain waveform into a timefrequency representation of the acoustic spectrogram.
where N represents the window length,ϖ(n)represents the Hamming window function,kfs/N represents the frequency corresponding to k,and fs denotes the sampling frequency.
The sound pressure value at each point is
where xt(k)represents the spectral value of the signal and S(k,t)represents its sound pressure value in dB.
2.2 Spectrum normalization
The normalization(data standardization)process is performed to avoid the effect of dimensionality between indicators and the data is standardized to solve the comparability between the data indicators.The indicators are in the same order of magnitude after the original data is standardized,which is convenient for comprehensive comparison and evaluation.
The min-max normalization and Z-score standardization are the commonly used standardization methods.The offdifference normalization is a linear transformation of the original data.It is performed to ensure that the calculation results are mapped between [0,1]; the conversion function is given as follows:
This function uses the outlier normalization method but the signal spectrum must be logarithmically converted before normalization for the conversion of a wider frequency band to a narrower frequency domain range for calculation and display.This is given as
where F(i) denotes the ith value in the FFT spectrum amplitude of the signal,and x denotes the converted value,which is consistent with the value of x in equation(8).
2.3 Audio signal standardization method of acoustic imaging
Generally,the audio file class saved in the field by the acoustic array sensor device truncates the high-frequency information to reduce the encoding bits,which reduces the audio decoding quality.Therefore,corresponding recovery techniques must be used to recover some signals without a serious loss of high-frequency information.We implemented the existing high-frequency reconstruction techniques,which primarily include non-blind and blind methods.The non-blind methods mainly include the PlusV high-frequency reconstruction method,BBSM-based simplified parametric high-frequency reconstruction,and minimum entropy-based high-frequency reconstruction method for audio signals [30].The blind methods mainly include linear extrapolation,mixed signal extrapolation,and nonlinear prediction.
This study employs the FFT spectral information reconstruction method based on the plural form,which is a blind high frequency reconstruction method.Different types of audio signals stored in the field can be integrated into the same frequency band,and the differences of their characteristics can be compared in this band.The blind highfrequency reconstruction method can save more coding bits than the non-blind high-frequency reconstruction method and is not limited by the type of coding.Additionally,the sub-square wave has been experimentally demonstrated to be a very effective methodology for decoding the audio quality based on harmonic and auditory characteristics.This method enables the high frequency recovery of signals with severe loss of high frequency information.Fig.14 depicts the reconstruction method.
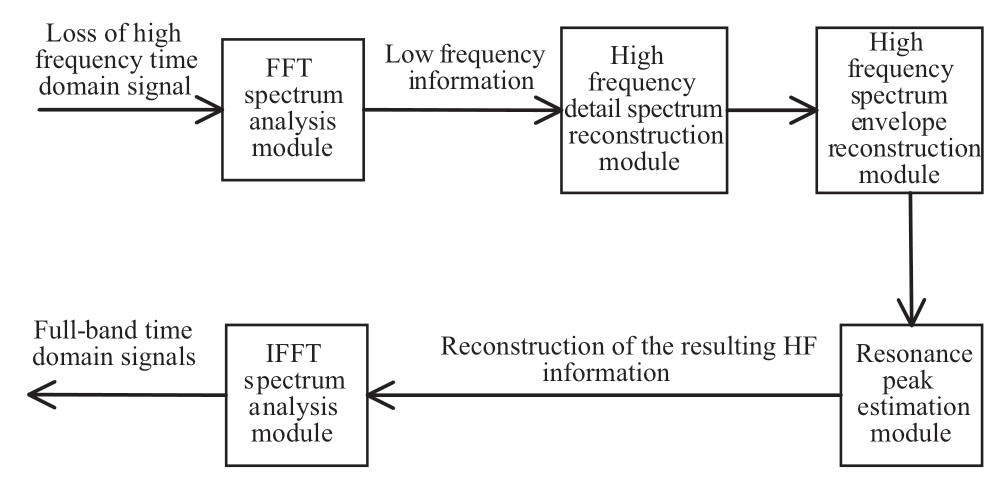
Fig.14 Complex FFT spectrum-based audio information reconstruction method
The specific implementation steps of the method used for the reconstruction of FFT spectral information based on the complex form are presented below.
(1)The original signal,Xori,which contains only low-frequency components,is framed into a short-time sequence,Xwin,after short-time windowing based on the acoustic spectrogram calculation method.
(2)The signal frequency domain amplitude sequence,Xfft,is obtained by the FFT spectral analysis transform of the short-time signal,Xwin.
(3)The maximum value of frequency,fu,is obtained in the frequency domain amplitude sequence,Xfft,and the signal is recovered to the level of 2fu since the ending frequency of the signal is twice as large as the starting frequency.
(4)The spectral information,xhigh,is reconstructed in the high frequency band [fu+1,2*fu] interval based on the spectral information,xlow,in the low frequency band [0.5*fu,fu].

(5)The low frequency envelope calculation and the low and high frequency intervals are divided into L1 and L2 based on the fixed width sub-band,C.The envelope value of the low frequency band spectral line is calculated as its energy.

(6)The envelope is converted to the logarithmic domain since it exhibits a linear decreasing characteristic in the logarithmic domain.A straight-line fit is then performed using the least squares method,the straight-line intercept,a,and slope,b,are calculated and correction is performed for the signal slope.
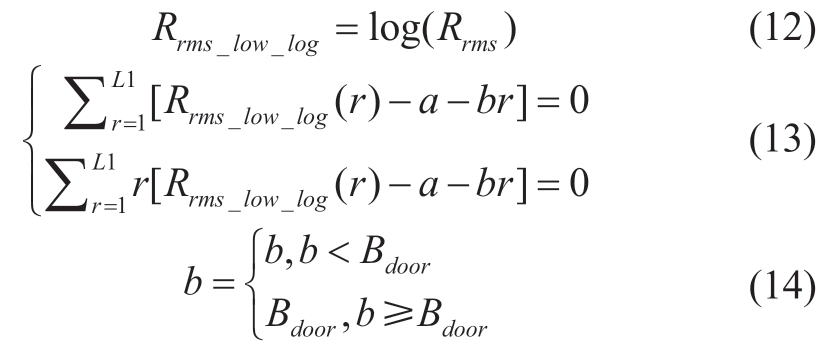
(7)The values of the HF interval are calculated in the logarithmic domain and are recovered in the exponential form based on the above linear parameters.

(8)The prediction order,p,is determined based on the resonance peak estimation.The corresponding coefficients for each order are calculated using the Durbin algorithm,the high-frequency envelope containing resonance marks is calculated based on the prediction coefficients,and it is recovered to the exponential form.

(9)The resonance peak amplitude is adjusted,the resonance peak sign bit,Rsign(r),is determined,and the high frequency information is obtained.

(10)Circularly calculation is performed to obtain the recovery frequency of each frame signal.
2.4 Grayscale
Grayscale is the conversion of a sequence of numbers such that the conversion result is in the interval [0,255].This is consistent with the threshold value of the white to black gradient region in the subsequent color plate.
The processing equation used is as follows:
where yrange denotes the conversion range,which is a constant value,2 in the program,and ymin denotes the lower limit of the interval,which is a constant value,-1.
Fig.15 depicts the sound spectrum generated based on the above steps using the high frequency reconstruction method.
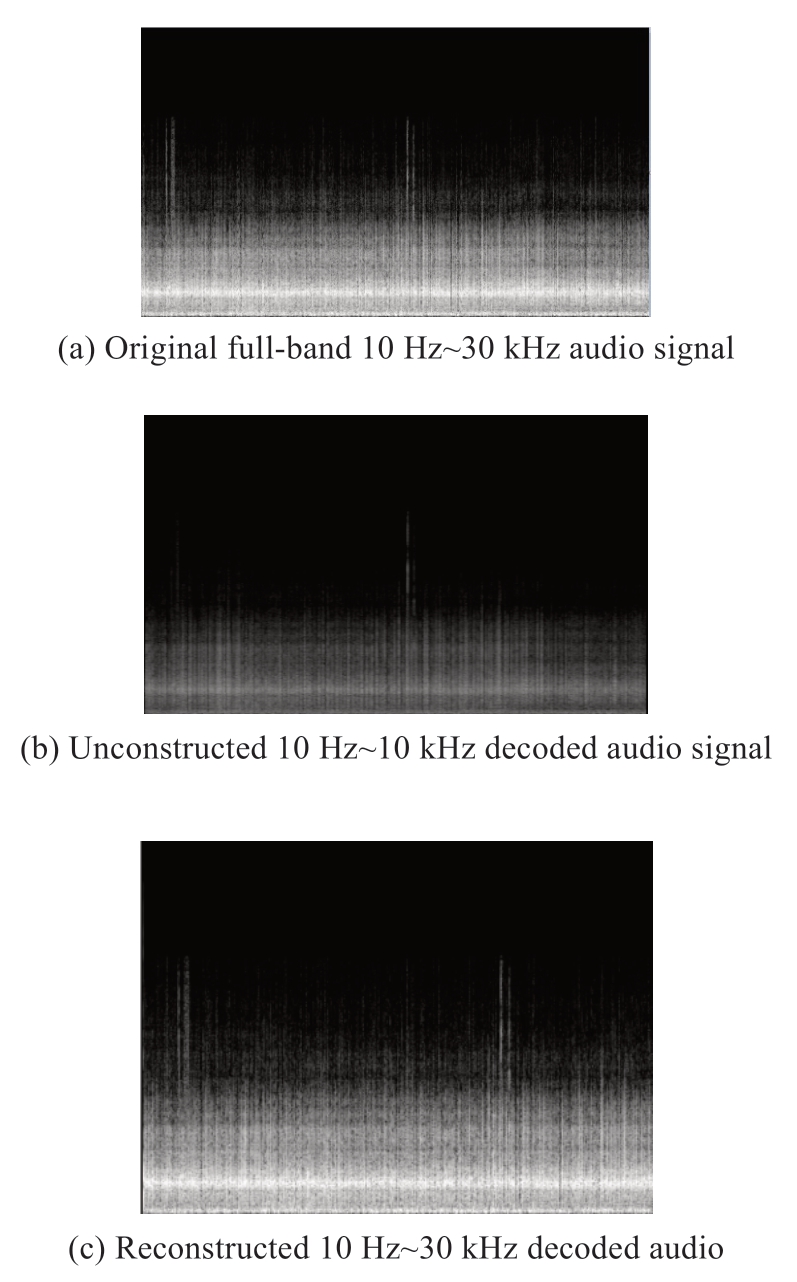
Fig.15 Comparison of the effect of audio reconstruction based on FFT spectral information
3 Laboratory validation
In this study,the same experimental circuit is used for the experiments of creeping,needle,slip,and floating discharge models.The experiments are conducted by using the partial discharge plus stepwise pressurization method to measure the number of pulses generated by the partial discharge.The pulse current partial discharge detector is highly sensitive.Therefore,the current voltage is calibrated as the starting discharge voltage when the pulse current tester detects the partial discharge signal for the first time.The proposed acoustic array sensor device is used for acoustic testing,and the partial discharge acoustic signal of the cable defect model is saved in the wav format to detect the acoustic partial discharge signal under the stable discharge voltage.The acoustic signals of different partial discharge models are analyzed by forming the sonogram to derive the acoustic spectrogram characteristics of different types of partial discharge models of cables.
3.1 Test model
Four types of cable accessory partial discharge defect types were constructed based on the field operation and maintenance experience of cable terminals.These are the creeping discharge model,needle discharge model,slip discharge model and floating discharge model.The creeping discharge defect model of the cable terminal is used to sprinkle approximately 5 mL of tap water on the main insulation of the cable set aside at both ends of the joint and inside the prefabricated joint,as shown in Fig.16(a).There are water droplets impregnated on the main insulation face of the cable terminal with a long axis of 5 mm and a short axis of 2 mm.These droplets are used to simulate the partial discharge caused by moisture at the cable terminal.The cable termination needle discharge defect model is tied to a needle tip with a curvature radius of 0.1 mm at the cable termination outer sheath,as shown in Fig.16(b).The cable terminal semiconductor paintslides to form the slip discharge model,as shown in Fig.16(c).It is used to simulate the partial discharge defects generated due to substandard cable terminal manufacturing processes.The cable terminal floating discharge model is simulated with a 2*1 mm metal sheet in the cable terminal,as shown in Fig.16(d).The four discharge defect models of 35 kV cable accessories are manufactured by a cable manufacturing company in Shanghai.
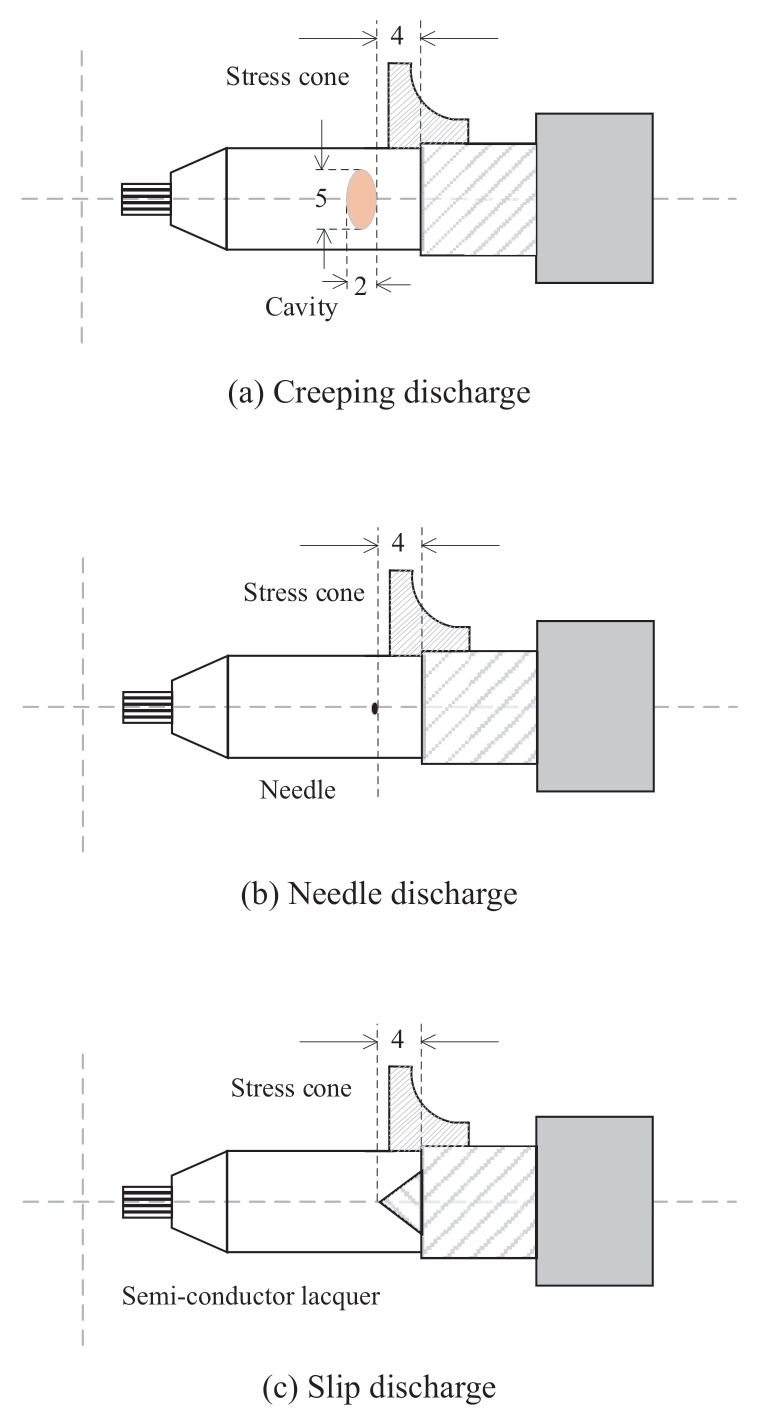
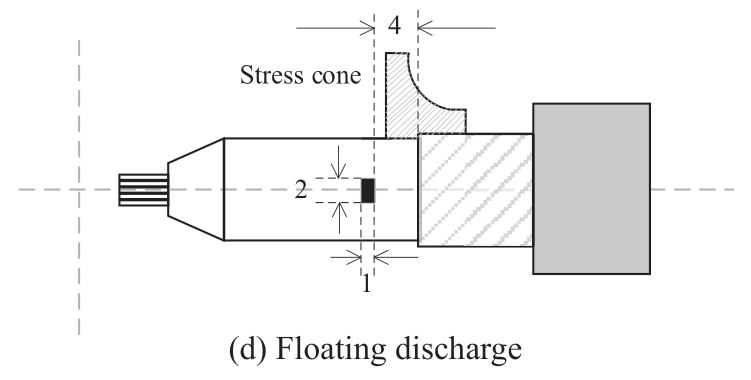
Fig.16 Cable termination partial discharge models(unit:mm)
3.2 Test environment description
The four cable defect models presented above were tested acoustically for partial discharge detection of cable defects by using the experimental circuit shown in Fig.17.The partial discharge audio signal is analyzed using the MATLAB simulation platform,and the eigenvalues of the partial discharge audio signal are extracted by using the audio identification algorithm.The effectiveness of the acoustic spectrogram formation algorithm is verified through the comparison of audio samples.
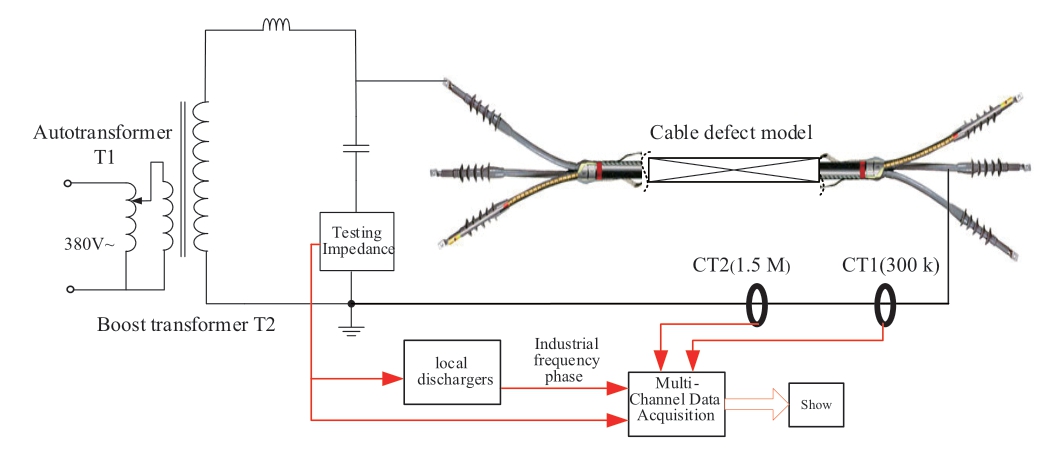
Fig.17 Experimental circuit for partial discharge detection of defect models
3.3 Test results and sound spectrogram characteristics
Table 4 presents the number of starting discharge pulses and the starting discharge voltage for the four cable defect partial discharge models used in the experiments.
Table 4 Number of starting discharge pulses and starting discharge voltage for the four cable defect models
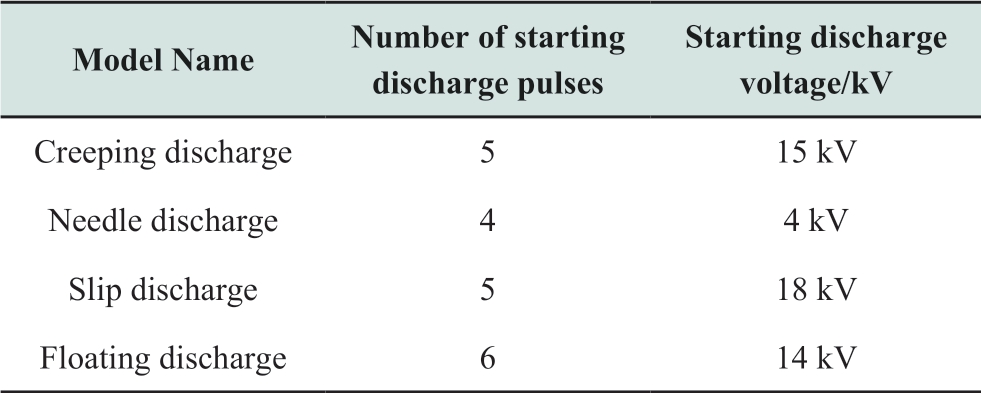
The MATLAB simulation platform was used to analyze the partial discharge audio signals and to derive the acoustic spectra of the four partial discharge models,as shown in Fig.18.
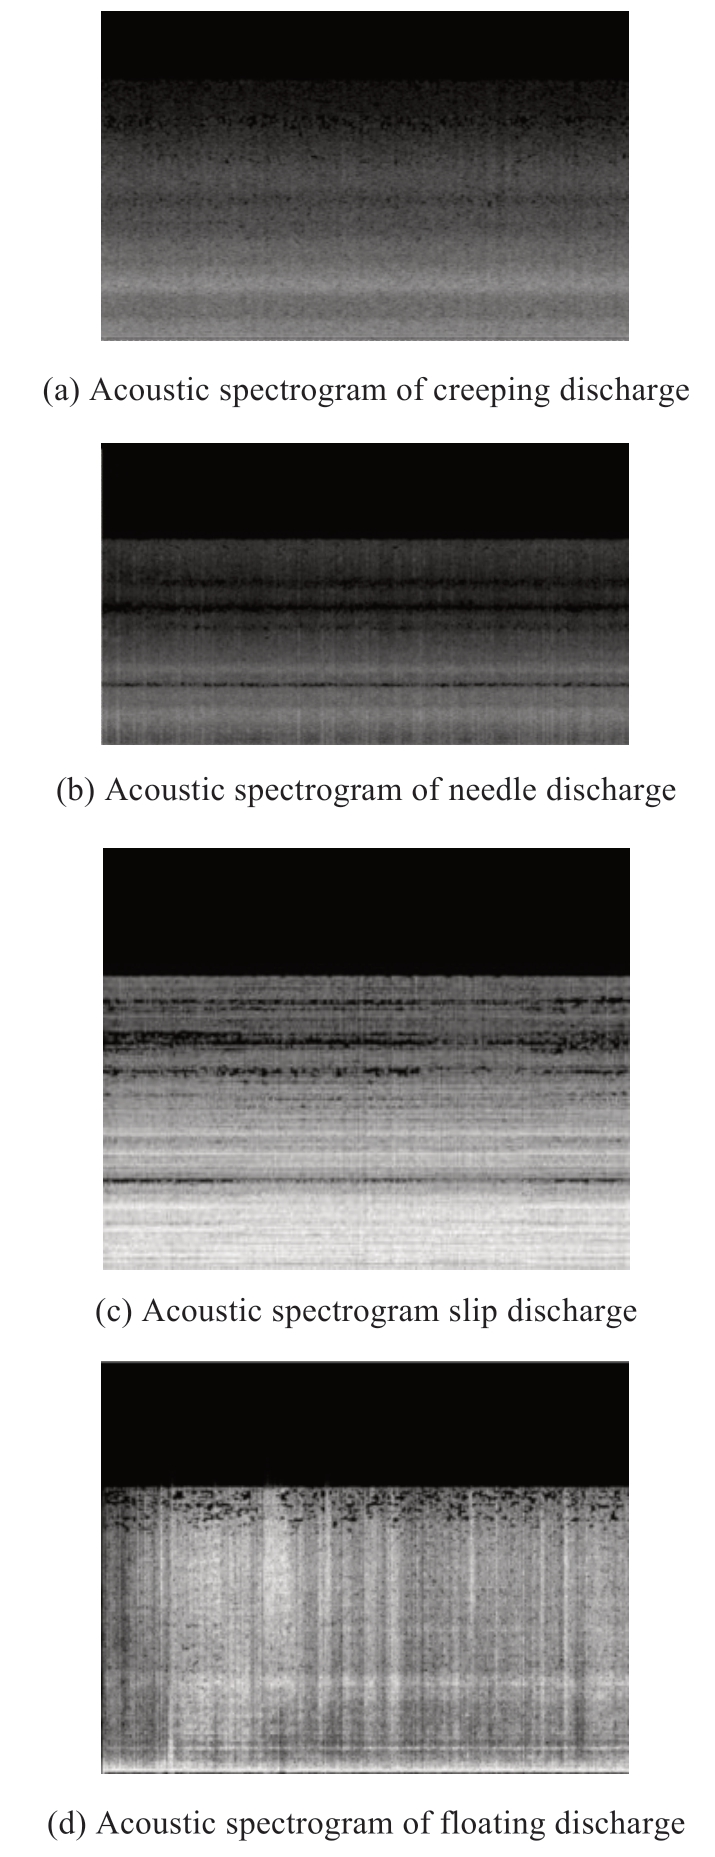
Fig.18 Acoustic spectrograms of cable terminal partial discharge
The following conclusions can be derived from the cable terminal partial discharge acoustic spectra presented above:
(1)The acoustic spectrum of the creeping discharge model of the cable terminal depicts a color demarcation in the middle region.
(2)The lower part of the acoustic spectrogram of the cable terminal needle discharge defect model depicts a complex interlaced demarcation,and the gray and black colors at the demarcation represent a gradient process,which varies significantly from the characteristics of the creeping discharge.
(3)The upper region of the acoustic spectrogram of the cable terminal slip discharge model depicts a color demarcation.The location is close to that of the floating model,and the signal gray streak distribution primarily exhibits horizontal streaks.
(4)A color demarcation is observed in the upper region of the grayscale diagram of the cable terminal floating discharge defect model,and the signal grayscale streak distribution mainly shows vertical stripes.
4 Field test verification
Field tests were conducted using the acoustic array sensor device for the No.3 ground transformer cable termination in a 220 kV substation.Fig.19 depicts the location of partial discharge at the site.The partial discharge diagnosis result of the acoustic array sensor device based on PRPD diagram has typical corona discharge characteristics.Fig.20 depicts the partial discharge type diagnosis result.
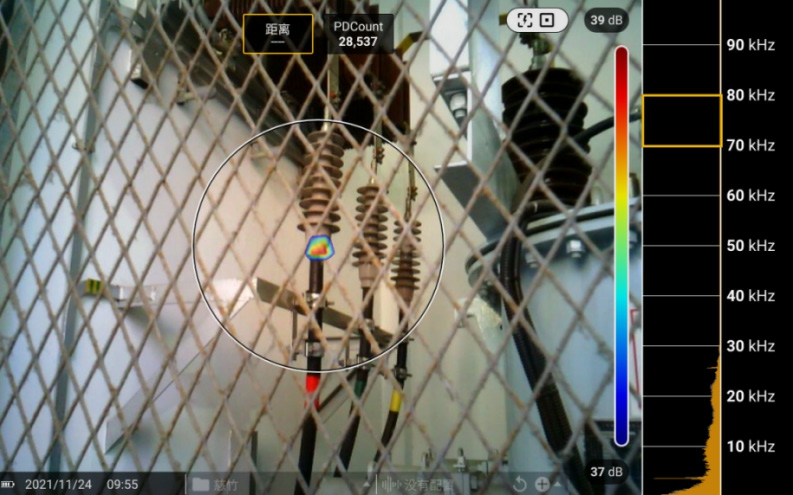
Fig.19 Detection results of the acoustic array sensor device
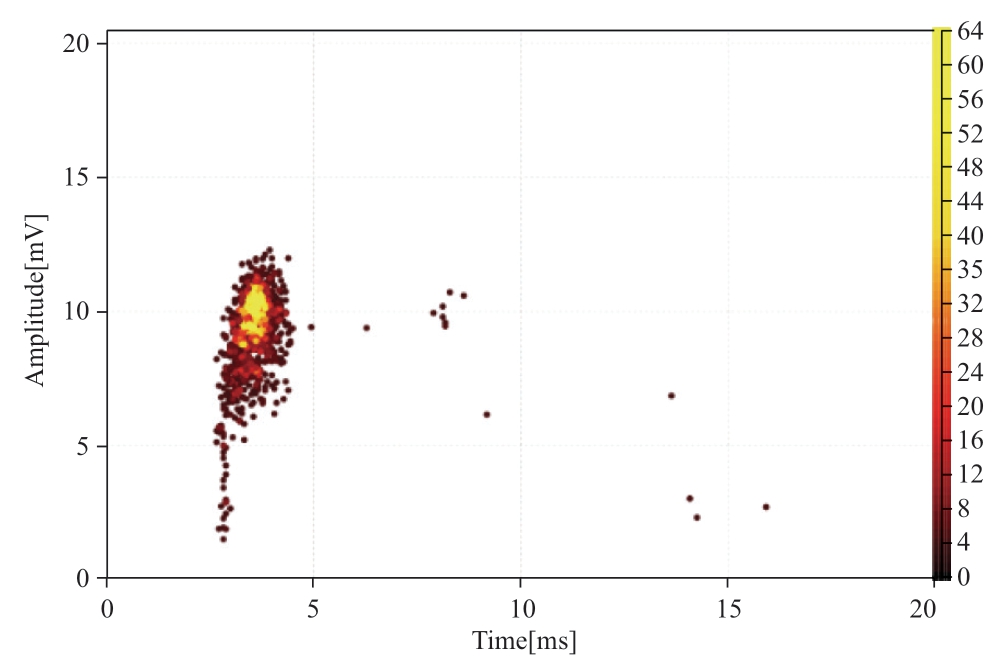
Fig.20 PRPD diagram of acoustic array sensor device
The sound information collected by the acoustic array sensor device was subjected to acoustic spectrogram analysis.Fig.21 depicts the obtained acoustic spectrogram of the ground transformer cable terminal.It shows color separation in the middle region,which are the typical characteristics of the creeping discharge model.The defective terminal is dissected on-site.The derivatives and discharge traces generated by the discharge can be observed through the slit at the end,and the location of the discharge source is consistent with the positioning point.The cause analysis demonstrates that the partial discharge generated by this cable terminal can be attributed to the outer sheath layer and the armor layer not being sealed tightly,and the presence of impurities or water vapor intrusion caused by the creeping discharge,as shown in Fig.22.It can be thus concluded that the partial discharge type diagnosis method of acoustic array sensor device based on the acoustic spectrogram can be applied for the diagnosis of the cable terminal defect model.
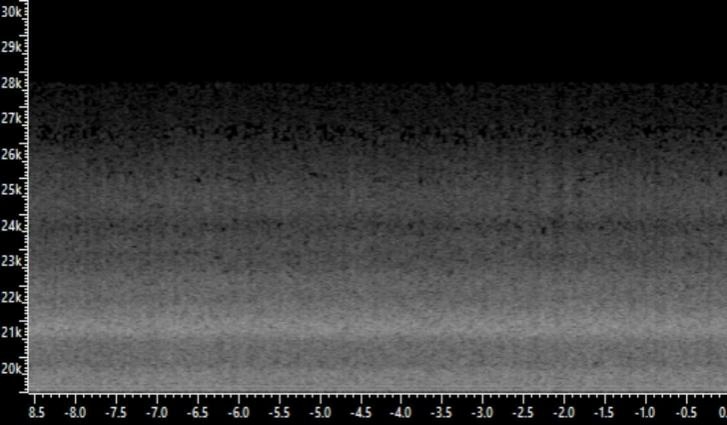
Fig.21 Partial discharge type acoustic spectrogram
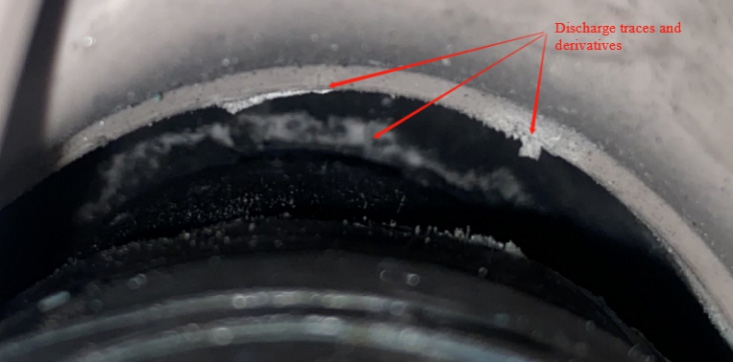
Fig.22 Disintegration verification
For 500 cable sites in a region,the test data of 1000 iterations of the cable terminal are obtained,where 500 cable terminal test solutions are obtained for sample labeling.Machine learning intelligent algorithms are used to learn the partial discharge characteristics of the samples.The diagnosis results of the conventional PRPS and acoustic spectrogram are tested and verified with 500 cable terminal test samples.Fig.23 presents the test results based on a normalized confusion matrix.
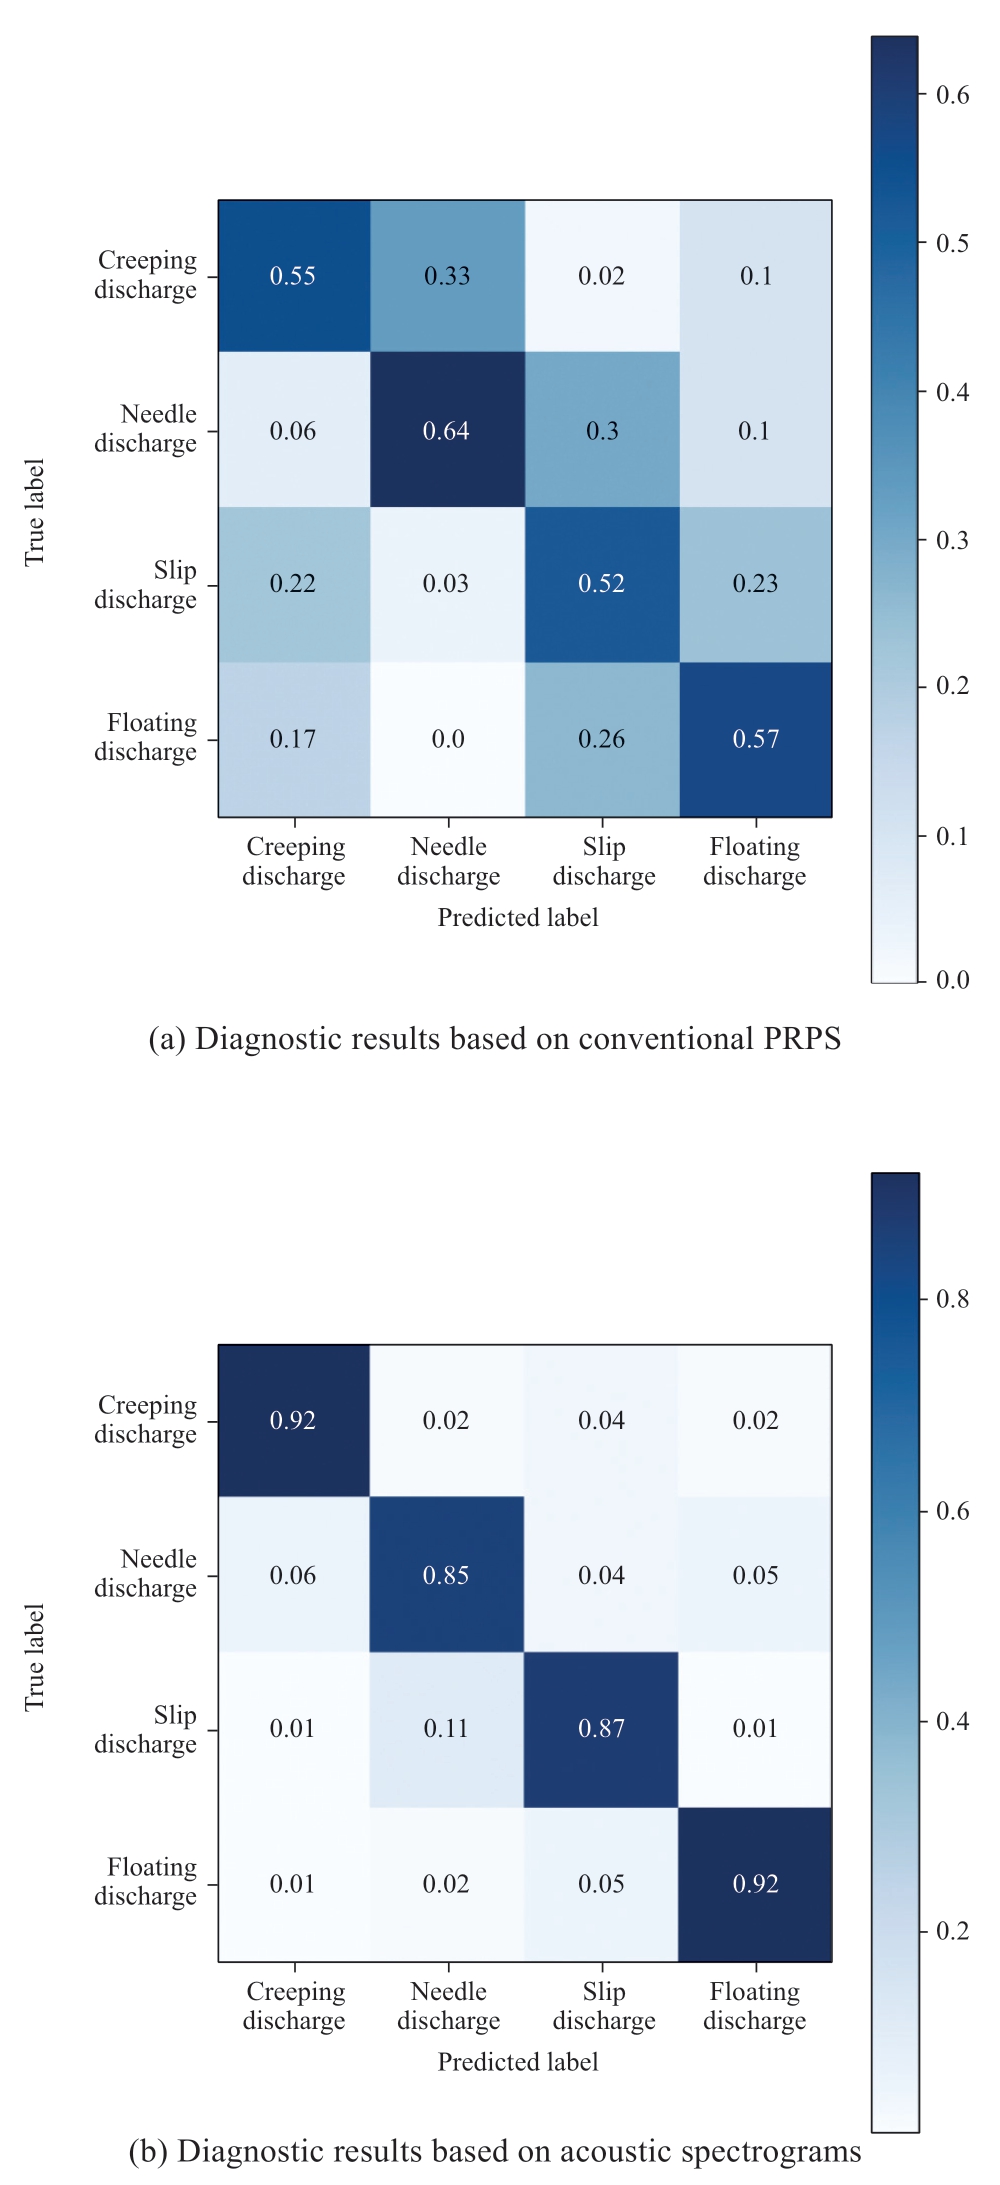
Fig.23 Analysis of diagnostic results of two different spectrograms
The comparison result for the probability of:diagnosing the actual creeping defect model as the creeping defect type is 0.92,diagnosing the actual needle discharge model as the needle discharge type is 0.85,diagnosing the actual slip partial discharge diagnostic model as the slip discharge type is 0.87,and diagnosing the actual floating defect model as the floating discharge type is 0.92.The diagnostic accuracy of each type of partial discharge model is significantly better than the diagnostic accuracy presented by the conventional PRPS map.
On-site monitoring has various functions including defect diagnosis and source location,which in determining the optimal number of sensors.Two or three sensors are preferred for defect type diagnosis.Every effective sensor can acquire the signals and then generate the PRPD diagram,which can be used for the defect type diagnosis.However,two or three sensors are insufficient for the defect source location.This issue is addressed by the equalarea multi-arm spiral array,which uses 112 sensors in the array.The equal-area multi-arm spiral array presents higher location resolution when compared to the conventional grid array and cross array.
5 Conclusion
(1)The audio sound source identification is expanded to two-dimensional sound spectrogram identification.Image processing techniques such as image saliency and sound spectrogram are then used to analyze and identify the sound spectrogram.
(2)The acoustic spectrogram of the creeping partial discharge defects model of the cable terminal shows a color demarcation in the middle region.The lower part of the acoustic spectrogram of the model,which depicts the needle partial discharge defects of the cable terminal,shows complex interlaced demarcation.The gray and black colors at the demarcation represent a gradient process,which varies significantly from the features of creeping discharge.The upper region of the acoustic spectrogram of the slip partial discharge type of the cable terminal shows a color demarcation,and the position is close to that of a floating model.The signal gray distribution of the floating model mainly shows horizontal stripes.The upper area of the grayscale diagram of the cable terminal floating partial discharge defect model shows color demarcation,and the distribution of signal grayscale stripes mainly shows vertical stripes.
(3)The acoustic array sensor device adopts the equalarea multi-arm spiral array design model,which is based on machine learning using the FFT-CLEAN sound source localization identification algorithm.This model avoids the interference factors in the noise acquisition system that uses a single microphone and a conventional beam forming algorithm.It improves the resolution of the acoustic array sensor device.The acoustic array sensor device based on the acoustic spectrogram analysis and diagnosis method can effectively reduce the system errors.
The research on acoustic imaging in this paper still has some improvement directions:
(1)The acoustic array algorithm in this paper should be considered how to transplant and integrate on special embedded chips such as FPGA,to further improve the efficiency and speed of calculation and analysis,reduce the time and overhead of algorithm processing,and further miniaturize the detection equipment.
(2)In view of the impact of the distance between the acoustic sound source plane and the sensor array plane on the imaging effect,binocular ranging can be considered to directly measure the distance between the sensor array and the source plane in future field instrument development.In addition,it is necessary to consider how to optimize the fusion with visible light images,and improve the display effect of acoustic imaging through the comparison of visible light and acoustic imaging images.
Acknowledgements
This work was supported by the science and technology project of State Grid Shanghai Municipal Electric Power Company(No.52090020007F)and National Key R&D Program of China(2017YFB0902800).
Declaration of Competing Interest
We declare that we have no conflicts of interest.
References
[1] Chen Z Z,Zhao P,Zhao J K,et al.(2018)Review and prospect of DC cable transmission in the world.Global Energy Interconnection(in Chinese),1(4): 487-495
[2] Dong X,Yang Y,Zhou C K,et al.(2017)Online monitoring and diagnosis of HV cable faults by sheath system currents.IEEE Transactions on Power Delivery,32(5):2281-2290
[3] Zhu B,Yu X Y,Tian L G,et al.(2022)Insulation monitoring and diagnosis of faults in cross-bonded cables based on the resistive current and sheath current.IEEE Access,10:46057-46066
[4] Gudmundsdottir U S,Gustavsen B,Bak C L,et al.(2011)Field test and simulation of a 400-kV cross-bonded cable system.IEEE Transactions on Power Delivery,26(3):1403-1410
[5] Sanseverino E R,Li Vigni V,di Stefano A,et al.(2019)A twoend traveling wave fault location system for MV cables.IEEE Transactions on Industry Applications,55(2):1180-1188
[6] Shan B L,Li S N,Cheng J H,et al.(2021)Distinguishing and locating thermal aging segments and concentration defects in XLPE distribution cables.Proceedings of CSEE,41(23): 8231-8241
[7] Mousavi Gargari S,Wouters P A A F,van der Wielen P C J M,et al.(2011)Partial discharge parameters to evaluate the insulation condition of on-line located defects in medium voltage cable networks.IEEE Transactions on Dielectrics and Electrical Insulation,18(3):868-877
[8] Poudineh-Ebrahimi F,Ghazizadeh-Ahsaee M(2018)Accurate and comprehensive fault location algorithm for two-terminal transmission lines.IET Generation,Transmission and Distribution,12(19):4334-4340
[9] Lundgaard L E,Hansen W(1998)Acoustic method for quality control and in-service periodic monitoring of medium voltage cable terminations.1998 IEEE International Symposium on Electrical Insulation,Arlington,Virginia,USA:130-133
[10] Marzinotto M,Mazzanti G(2015)The feasibility of cable sheath fault detection by monitoring sheath-to-ground currents at the ends of cross-bonding sections.IEEE Transactions on Industry Applications,51(6):5376-5384
[11] Pan W X,Li Y,Sun K,et al.(2020)Incipient fault location method of cable based on both-end electric quantities.IEEE Access,8:219503-219512
[12] Chen R,Yang Y and Jin T.(2022)A hierarchical coordinated control strategy based on multi-port energy router of urban rail transit.Protection and Control of Modern Power Systems,7:15
[13] Li D,Zhao Y,and Zhao Y.(2022)A dynamic-model-based fault diagnosis method for a wind turbine planetary gearbox using a deep learning network.Protection and Control of Modern Power Systems,7:22
[14] Li X,Wu X,Shi Y,et al.(2019)Charged detection system of GIS mechanical fault based on the acoustical imaging.High Voltage Apparatus,55(5):42-46
[15] Lin Q,Yang J J,Xu Z T,et al.Modeling and structural optimization of acoustic imaging sensor unit for detecting abnormal noises of dry-type transformer.2021 International Conference on Power System Technology(POWERCON).Haikou,China.IEEE,2388-2392
[16] Ji H,Lei X,Xu Q,et al.(2022)Research on characteristics of acoustic signal of typical partial discharge models.Global Energy Interconnection,5(1):118-130
[17] Liu S Y(2020)Research on testing technology of microphone array acoustic imaging.University of Electronic Science and Technology of China
[18] Si W R,Fu C Z,Xu P,et al.(2021)Research on loose detection of transformer core based on acoustic imaging and image processing.High Voltage Apparatus,57(11):180-186
[19] Ma X.(2020)Research on acoustic imaging algorithm characterized by signal recovery.Nanjing University
[20] Peng P,Liu Y,Wan X,et al.(2021)Acoustic imaging technology and its application in fault diagnosis of switch cabinet.2021 IEEE International Conference on Data Science and Computer Application(ICDSCA),Dalian,China:423-426
[21] Zhao L,Wang S,Yang Y,et al.(2021)Detection and rapid positioning of abnormal noise of GIS based on acoustic imaging technology.The 10th Renewable Power Generation Conference(RPG 2021).Online Conference.IET,653-657
[22] Shao Y Y,Wang X,Peng P,et al.(2021)Research and application on typical abnormal noise of 10kV dry-type transformer.Transformer,58(5):82-87
[23] Shao Y Y,Wang X,Peng P,et al.(2021)Research on defect detection method of power equipment based on acoustic imaging technology.China Measurement & Test,47(7):42-48
[24] Tang W(2021)Research and system implementation of acoustic imaging and sound source location technology of power equipment.South China University of Technology
[25] Li J,Guo R,Sun S,et al.(2019)Acoustic imaging and its application in transformers.2019 IEEE Sustainable Power and Energy Conference(iSPEC),Beijing,China:450-453
[26] Zheng J,Zhang J,Yang F D,et al.(2022)Research on imaging technology of ultrasonic echo applied to live detection of switchgear insulation defects.2022 12th International Conference on Power,Energy and Electrical Engineering(CPEEE),Shiga,Japan:27-33
[27] Yuan G G,He Y H(2020)Analysis of sound source identification of substation equipment based on acoustic array.Mechanical and Electrical Information,2020(21):5-9
[28] Liu P(2012)Research on abnormal sound feature extraction and classification in public places based on spectrogram.Chongqing University
[29] Du S B(2014)Research on electrical equipment fault detection based on audio feature.Shandong University
[30] Bai X L,Hu J L,Xu S(2015)Minimum entropy based high frequency reconstruction of audio signal.Audio Engineering,30(2):37-40
Biographies

Xing Lei received M.S.degree at North China Electric Power University in 2006,and received Ph.D.degree at Shandong University in 2012.He is working in State Grid Shanghai Municipal Electric Power Company.His research interests include power system automation,equipment maintenance.

Hang Ji received B.S.degree at North China Electric Power University in 2006.He is working in State Grid Shanghai Municipal Electric Power Company.His research interests include power system automation,equipment management.
Qiang Xu received bachelor’s degree at Shanghai Jiaotong University in 2002.He is working in State Grid Shanghai Municipal Electric Power Company.His research interests include power system automation,equipment maintenance.

Ting Ye received B.S.degree at Fudan University in 2012.He is working in State Grid Shanghai Municipal Electric Power Company.His research interests include power system automation,equipment maintenance.

Shengfu Zhang received B.S.degree at Fudan University in 2010.He is working in State Grid Shanghai Municipal Electric Power Company.His research interests include power system automation,equipment maintenance.
Chengjun Huang received Ph.D.degree at Shanghai Jiaotong University in 2000.He is the chairman of Power Monitoring and Diagnostic Technology Ltd.San Jose,USA.His research interests include partial discharge detection technology,intelligent power equipment,and condition maintenance technology.
(Editor Dawei Wang)
