0 Introduction
Generally,the inspection of high-voltage equipment is essential to ensure the reliability of power supplies in power grids.Regular inspections can help promptly detect and hence replace defective devices,reduce the frequency of power outages,and improve user experience.With the development of power grids in recent years,the demand for automatic inspection of power equipment has gradually increased to alleviate the mismatch between the number of devices and distribution of workers.Compared with the current popular manual inspection methods for substations,automated inspection presents several advantages.First,it can reduce the working time of operation and maintenance personnel at stations and improve the efficiency of operation and maintenance.Second,it is conducive to the comprehensive assessment of equipment status by integrating multiple inspection methods [1].In addition,the inspection route can be flexibly adjusted during intelligent inspection to further determine the on-site situation and reduce blind spots during inspection.Currently,automated inspection tasks are often performed by inspection robots or unmanned aerial vehicles [2,3].Such machines automatically record equipment images and determine the existence of faults.Once a hidden danger is discovered,staff members on duty are immediately notified,following which they confirm the validity of the alarm and devise next steps.Meanwhile,the collected data and analysis results are uploaded to the server to construct the power equipment image database.
Existing fault diagnosis and analysis methods based on infrared images of power equipment can be categorized into two types:feature-based and segmentation-based frameworks.For a feature-based framework,fault diagnosis is based on certain features proposed previously.For instance,in references [4-6],the authors extracted the graylevel co-occurrence matrix,pixel brightness statistics,and color moments,respectively.In reference [7],the authors extracted the Zernike moments of an image.In reference [8],the authors used improved Hu moments to extract image features.However,the feature-based framework suffers from two primary limitations:(1)herein,features are often selected based on expert experience,which implies that strong transferability and robustness may not be guaranteed;(2)fault diagnosis based on such features is a black box model,which implies that the temperature status of the device remains unknown.To address these limitations,a segmentation-based framework has been proposed,wherein fault diagnosis is based on the results of object detection and temperature region segmentation.In addition,this approach enables the combination of infrared inspection criteria,thus substantially reducing the number of required training samples.
For a segmentation-based framework,the operation process includes the classification of equipment types,the acquisition of temperature distribution,and equipment status identification based on infrared inspection criteria.Although a few of these tasks have been investigated in the field of computer vision,modifications and improvements based on specific applications are still necessary.For the fault diagnosis of power equipment,the problem of limited data needs to be considered by researchers and engineers,as it is one of the primary factors resulting in poor performance.
In this study,we aim to address the aforementioned problem in the infrared image recognition of power equipment; for this,we propose the following framework:first,a deep self-attention network is adopted to identify a target equipment component.This network extracts features from an input image and transfers them to an encoder–decoder structure for feature embedding.The embedded features are used to predict the type and location of the component.Thereafter,a segmentation module based on multi-factor similarity calculation(MFSC)is used to obtain the temperature distribution of the target component.This algorithm progressively merges similar regions based on the similarity calculation,which eventually divides the given image into two parts:foreground and background.Finally,the temperature range is calculated within these sub-regions defined by the segmentation module.
Compared with the frameworks considered in related studies,the proposed framework demonstrates the following advantages:(1)The deep self-attention network focuses on context information in the image,including the relationship between regions and global semantic information,which improves object detection accuracy and reduces data dependency to a certain extent.(2)The segmentation module based on the MFSC considers additional regional factors,including the texture,shape,and size,which help substantially improve the segmentation quality.Experiments based on actual inspection images indicate that this framework exhibits satisfying performance and,therefore,provides a certain reference for the inspection automation technology of power equipment.
1 Model Structure
1.1 Overall framework
The framework of the recognition model based on equipment infrared images is illustrated in Fig.1; it comprises three parts:(1)an object recognition module based on a deep self-attention network [9],(2)a preliminary image segmentation module based on a graph segmentation algorithm [10],and(3)a final image segmentation and temperature calculation module based on the MFSC [11].The complete process is executed as follows:first,the equipment category,i.e.,the transformer and location,is identified from the original image.Following this,the location image is intercepted,and preliminary image segmentation is performed to derive multiple regions.Multifactor similarity is then used to obtain a merged region to determine the foreground and background,and the device temperature range is calculated for the foreground.
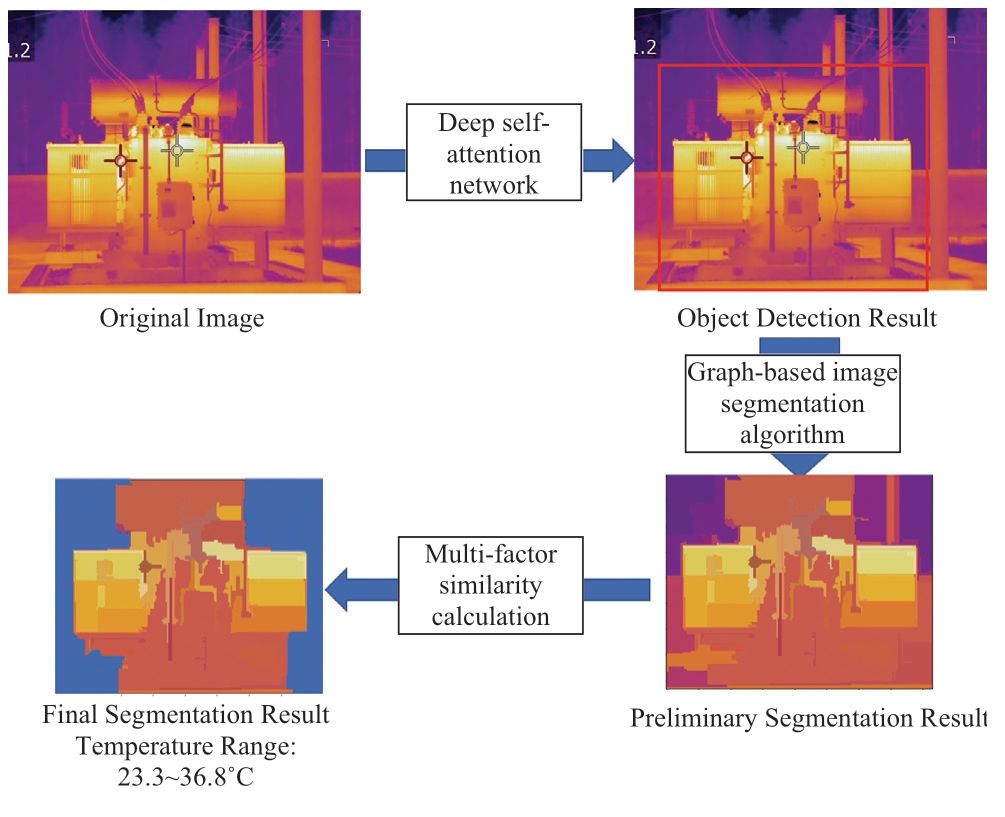
Fig.1 Recognition Model Structure Based on Infrared Images of the Equipment
1.2 Object recognition based on the deep selfattention network
The deep self-attention network model comprises four parts:a basic network,encoder,decoder,and prediction branch [9](Fig.2).The Resnet network proposed in reference [12] is used as the basic network to extract features from original images.Here,let f∈RC×HW×be the extracted feature map,where C indicates the number of channels,and H and W denote the height and weight of the feature map,respectively.Following this,the feature map is fused to reduce dimensionality.This step is completed by a convolution layer with a size of 1×1.The feature map after fusion is denoted as fo∈Rd×H×W,where d indicates the number of channels after the change.After concatenating the fused feature maps based on pixels,we obtain ∈Rd×HW and deploy this into the deep self-attention network encoder.This encoder comprises a multibranch self-attention module and feedforward network [13].In addition,fixed-position coding is added to the input layer of the self-attention module to ensure that the module is not affected by the pixels in series [9].
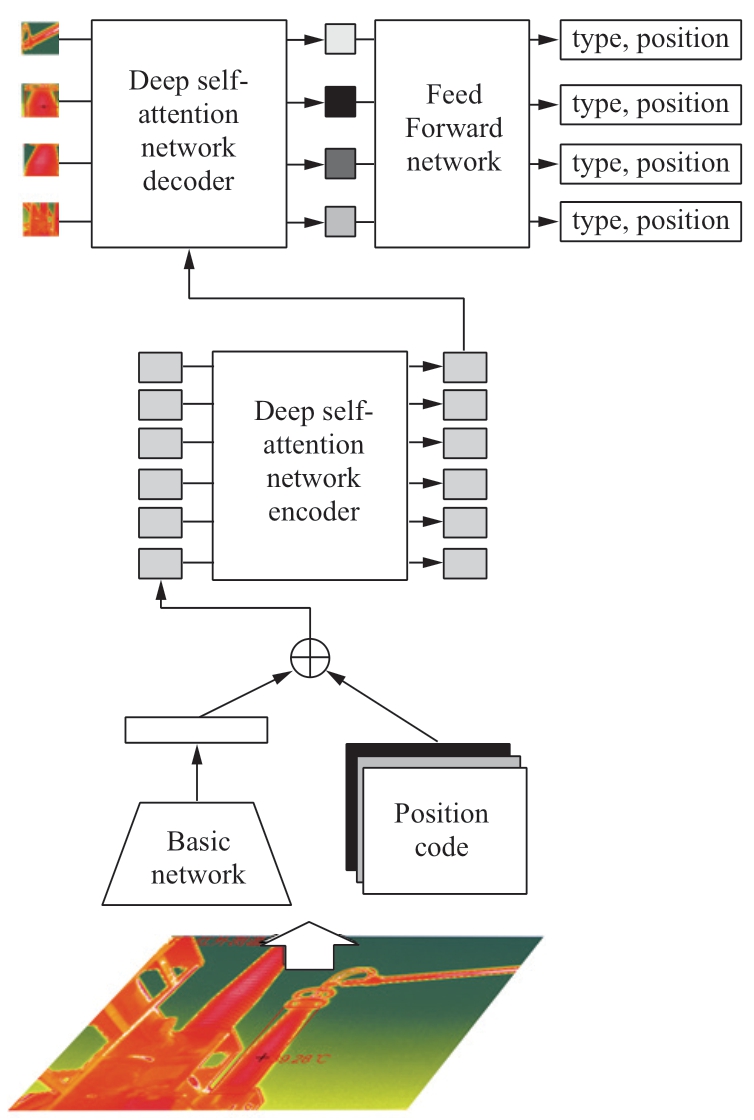
Fig.2 Network Architecture of a Transformer
The primary concept of the deep self-attention network is its attention mechanism,i.e.,

where Q,K,and V denote the query,key,and value vectors,respectively.![]() denotes a normalization scalar.fsfm indicates the softmax function.fatt denotes the attention module.Based on this module,the transformer network is proposed.First,Q,K,V are calculated according to input vectors.
denotes a normalization scalar.fsfm indicates the softmax function.fatt denotes the attention module.Based on this module,the transformer network is proposed.First,Q,K,V are calculated according to input vectors.
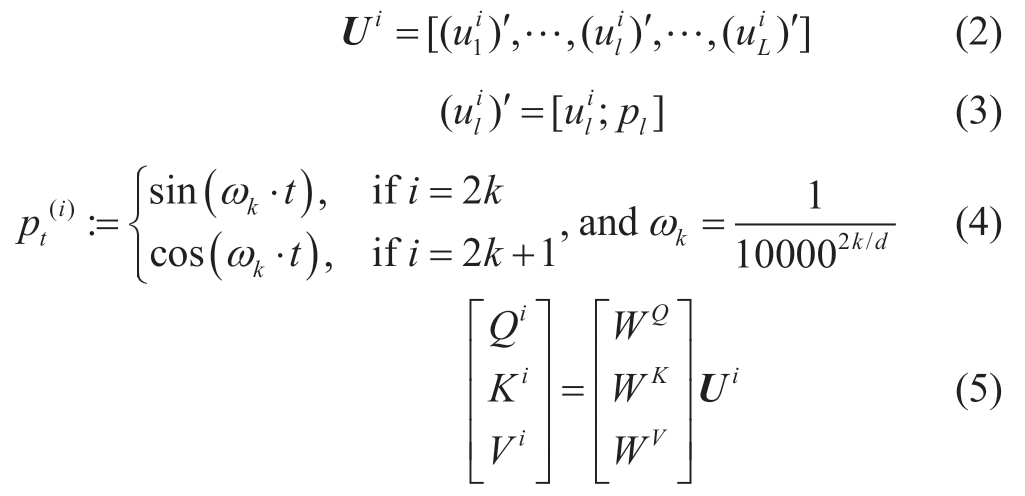
where pi denotes positional encoding; ωk indicates the frequency of sine functions; d denotes the encoding dimension; and WQ,WK,and WV indicate learnable parameter matrices.
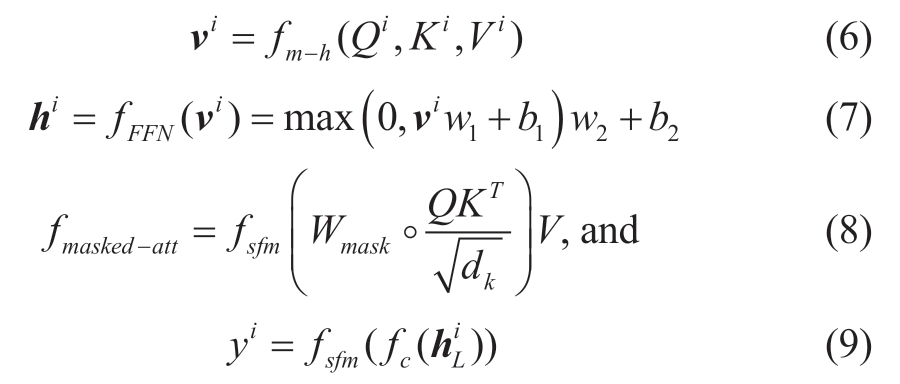
where fFFN denotes element-wise non-linear mapping,w1 and w2 denote the learnable weights,and b1 and b2 indicate the learnable offsets.fmasked−att indicates the masked attention module used in the decoder,and Wmask denotes the masked weighted matrix.hi denotes the hidden layer information obtained from the decoder,and  denotes the output of the last stage,i.e.,L.fc corresponds to the linear layer,and yi denotes the prediction label of the ith object.
The deep self-attention network decoder comprises a multi-branch self-attention module and an encodingdecoding attention module.The primary function of this module is to decode embedded feature map outputs using an encoder.Here,the number of embedded feature maps is N,the size is d,and the two parameters are different from each other.The decoder operates in parallel to improve the operating efficiency of the model.Simultaneously,the position code learned by the decoder is used as an input to the attention module to generate decoded features.Finally,the prediction branch comprising the feedforward network predicts the output features of the decoder,and the prediction result includes the corresponding type and coordinates of the candidate frame.During this process,the self-attention module and encoding-decoding mechanism provide the model with paired object relationships and semantic information regarding the entire image.For power equipment identification,the aforementioned information is extremely critical and can significantly improve the identification accuracy.
1.3 Equipment temperature identification based on the MFSC
The target identification result obtained after implementation of the deep self-attention network is input into the device temperature identification module based on the MFSC.The result of target recognition is in the form of multiple rectangular boxes,and the type,coordinates,and confidence of each rectangular box are provided.For the target device,it is necessary to further determine its temperature distribution.For this task,existing studies mostly adopt two methods that involve(1)the conversion of infrared images into grayscale images,and the application of clustering methods to divide the heating-device-generated image into several regions [14];(2)the application of various operators to directly extract infrared image features[15,16].However,such methods are not robust.First,direct clustering based on the spatial location and gray values ignores other relevant information,such as the texture and size.Second,the use of various operators often involves threshold selection,and the determination of an appropriate threshold becomes difficult.
If the aforementioned task is regarded as an image segmentation problem,a suitable unsupervised image segmentation method is required.In the field of machine learning,the performance of supervised learning models is often better than that of unsupervised learning models;however,supervised learning involves label assignment.To obtain the temperature distribution of a device,labeling the device image is often a time-consuming and laborious task.Moreover,the use of similar labels for the same types of devices with large temperature distributions stands to obstruct model training.Therefore,the most reasonable approach involves the use of an unsupervised learning method.
With reference to an existing study [14],the calculation of equipment temperature distribution can be regarded as a clustering problem.However,the difference here is that this study considers all the aspects including the color,texture,size,shape,and other related factors.As the online clustering method is carried out in a step-by-step manner,the results are endowed with a hierarchy during the solving process.First,the complete image is divided into two categories:target object and background.Second,the target object is divided into multiple regions with large temperature differences,which makes the calculation of equipment temperature differences convenient.
The basic concept of the model is illustrated in Fig.3.First,an image segmentation algorithm based on a graph is used to obtain preliminary segmentation results [10].Following this,multi-factor similarity is obtained,and the similarity is then used to merge adjacent regions to obtain the final segmentation result.During the initial segmentation,pixel points are used as the unit,and the basic feature is color.The final segmentation is based on the area,and the basic features include the color,texture,size,and shape.The formula adopted for determining the similarity of each factor is introduced below.

Fig.3 Equipment Temperature Identification Model
Suppose the number of regional channels is c.For an RGB image,c=3,whereas for gray-scale images,c=1.For each channel,we use a histogram to count the pixel values.Let  be the number of histogram groups.A dimensional vector can be used to represent the distribution of a histogram of each channel in the region.The color similarity calculation formula can be expressed as
where Ri and Rj represent regions i and j,respectively.![]() denotes the color feature vector of i; n=
denotes the color feature vector of i; n=![]() indicates the color feature vector dimension.
indicates the color feature vector dimension.
The color feature vector Ct of the merged area Rt can be obtained using

where size(Ri)denotes the number of pixels in region Ri.
Every central pixel has eight adjacent pixels; hence,eight directions can be obtained by connecting the central and surrounding adjacent pixels.After calculating the gradient of each region along the eight directions,the![]() group histogram is used to calculate the gradient value.Thereafter,the
group histogram is used to calculate the gradient value.Thereafter,the![]() dimensional vector can be used to represent the distribution of the histogram of each channel in the region.The texture similarity calculation formula can be expressed as
dimensional vector can be used to represent the distribution of the histogram of each channel in the region.The texture similarity calculation formula can be expressed as
where Ti=![]() denotes the texture feature vector of I,and n=
denotes the texture feature vector of I,and n=![]() indicates the texture feature vector dimension.
indicates the texture feature vector dimension.
For a region,the number of pixels directly indicates the size of the region,and the calculation formula for size similarity can be expressed as
where size(im)denotes the number of pixels in the entire image.
For any two regions,the better the conformity of their shapes,the smaller the combined rectangular bounding box Bij.The shape similarity calculation formula can be expressed as
The final similarity can be expressed as
where α=(α1,α2,α3,α4)is the weight vector.
Fig.4 illustrates the flowchart of the image segmentation algorithm based on multi-factor similarity.After the algorithm determines foreground RF and background RB,the temperature distribution in the device can be determined according to the different regions contained in the foreground and background.The formulas for the determination of temperature rise Tr,temperature difference Td,and relative temperature difference δ are as follows:

Fig.4 Flowchart of the Image Segmentation Algorithm

The aforementioned temperature difference calculation method is based on a single device.If a three-phase equipment comparison is involved,the temperature difference between phases can be obtained by subtracting the maximum temperature of the reference phase from the maximum temperature of the superheated phase.
2 Case studies
Previous experiments on the fault identification process have been conducted based on infrared images of power equipment.As the proposed framework is divided into two processes:target identification and temperature identification,each process is executed by its own module.Therefore,herein,each module is compared with other commonly used methods of the same type,and different module combinations are tested to illustrate the feasibility and superiority of the proposed method.
2.1 Dataset description
The dataset used in this study included 500 infrared images of power equipment,which were captured by on-site inspection robots.The images were manually annotated.The types of power equipment included transformers,lightning arresters,bushings,voltage transformers,and current transformers.The target components included porcelain bottles,transformer fans,and oil pillows.A typical scenario of the dataset is illustrated in Fig.5.In the experiment,300 images were randomly selected as the training set,100 images as the validation set,and the remaining 100 images as the test set.The training set was used to train the model.The validation set was used to verify the model performance in the training stage,and the test set was used at the final test stage.
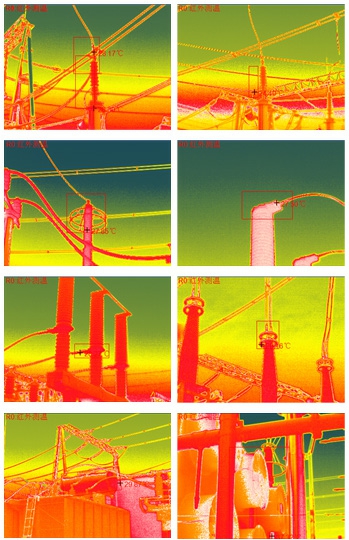
Fig.5 Infrared Images of Power Equipment in a Substation
As image recognition algorithms are dependent on training samples,the requirements of shooting distance,shooting angle,and ambient temperature will be explained herein.Considering the safety distance,an inspection robot should be in close proximity so that the device under test can cover the entire field of view.For equipment with a long shooting distance,such as overhead lines,medium and long focal-length lenses should be used to ensure image clarity.For different types of devices,three shooting directions must be selected in advance.During the process,obstructions should be minimized between the inspection robot and devices.On this basis,the best inspection angle is determined and recorded.In the infrared inspection process,first,all the parts are comprehensively inspected.If abnormal parts are observed,multiple thermal and RGB images are captured.Following this,key components,such as joints and equipment body,are captured individually.Notably,the temperature of the environment should not be lower than 5 °C,and the humidity of air should not be greater than 85%.In addition,the inspection process should not be subject to extreme weather conditions,such as those presented by thunder,rain,fog,and snow.
2.2 Equipment classification and temperature identification based on the proposed framework
Weight initialization for the deep self-attention network is based on a normalized scheme,and the backbone network is pretrained on the ImageNet dataset with frozen Batchnorm layers.The device identification results based on the deep self-attention network are presented in Fig.6.Considering the rectangular bounding box of each device in the figure,we can state that each bounding box includes the following attributes:type,size,location,and confidence.It can be observed that the model identification effect is better for other types of equipment.Table 1 lists the test results corresponding to different network architectures to further verify the rationality of the proposed structural design and confirm the best parameter selection.The average precision[17] is selected as the evaluation index,which indicates the average of the accuracy under different recall rates.Here,the precision represents the proportion of real samples that are predicted to be positive,and recall represents the proportion of positive examples in the sample that are correctly predicted.Note that a negative correlation exists between the precision and recall.
In addition,the Intersection over Union(IoU)[18],which denotes the degree of overlap between two rectangular boxes,is selected as the evaluation index for device location recognition.By setting different IoU thresholds,the location recognition results can be filtered.For an IoU threshold of 50%,the recognition result and label data rectangle overlap by >50%,and these results are regarded as correct.Table 1 lists three datasets:AP50,AP75,and mAP.The distribution corresponds to IoU threshold values of 50% and 75% and IoU values ranging from 50% to 95%.In Table 1,TR denotes the transformer network; R50 and R101 denote 50-layer ResNet and 101-layer ResNet models,respectively,and DC5 denotes a dilated convolution layer added to the fifth stage of the basic network.The results of the validation(left)and test(right)sets have also been provided.
Table 1 AP of Different Network Structures
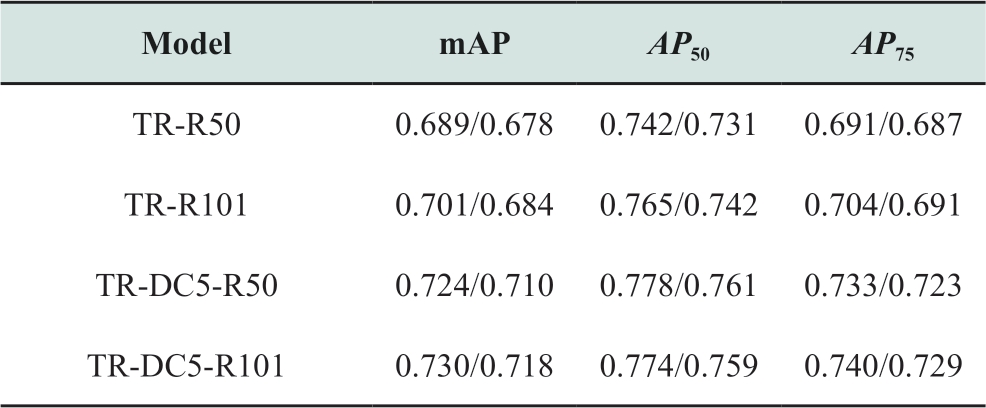
The test of the network architecture is based on the basic network mechanism,i.e.,the ResNet model.Notably,the number of network layers significantly impacts the model performance.A deep network has a large number of parameters and demonstrates strong fitting ability.However,it requires a high volume of data and more time for model training.In addition,in the final stage of model training,additional dilated convolution [19] is often added to improve feature resolution.As listed in Table 1,the aforementioned two aspects are tested,i.e.,R50 and R101.Simultaneously,an additional dilated convolution layer is included in the fifth stage(DC5).Here,“No DC5” implies the absence of a dilated convolutional layer.Based on the recognition accuracy rate,we can observe that increasing the number of layers negligibly improves the model performance.This is because the deep network requires sufficient data support.However,the sample size considered in this study is relatively small and,hence,cannot exploit the strong fitting ability of the network.Moreover,the addition of dilated convolution significantly inhibits the model performance because high resolution is more conducive to target recognition.Particularly,in the case of power equipment identification,few devices correspond to a small infrared image area,and high resolution significantly improves the identification performance.
Fig.6 presents the results of device temperature identification based on the MFSC.The temperature range is marked next to each device in the figure.To evaluate the effect of temperature identification,the following indicators are proposed herein:temperature identification precision rate(TPx)and difference in TPx(DTPx),where x represents the temperature difference threshold.For instance,TP0.5 indicates that the threshold is 0.5 ℃.Note that the maximum and minimum differences between the recognition and actual results cannot exceed the threshold;otherwise,it is judged as a recognition error.DTPx implies that the difference between the recognized temperature difference in the device and the actual temperature difference in the device cannot exceed the threshold x.Table 3 lists the relevant accuracy details of temperature recognition corresponding to the proposed method based on the MFSC.The temperature identification accuracy appears extremely high,which meets the requirements of on-site operations.
Table 2 AP of Different Object-Detection Models

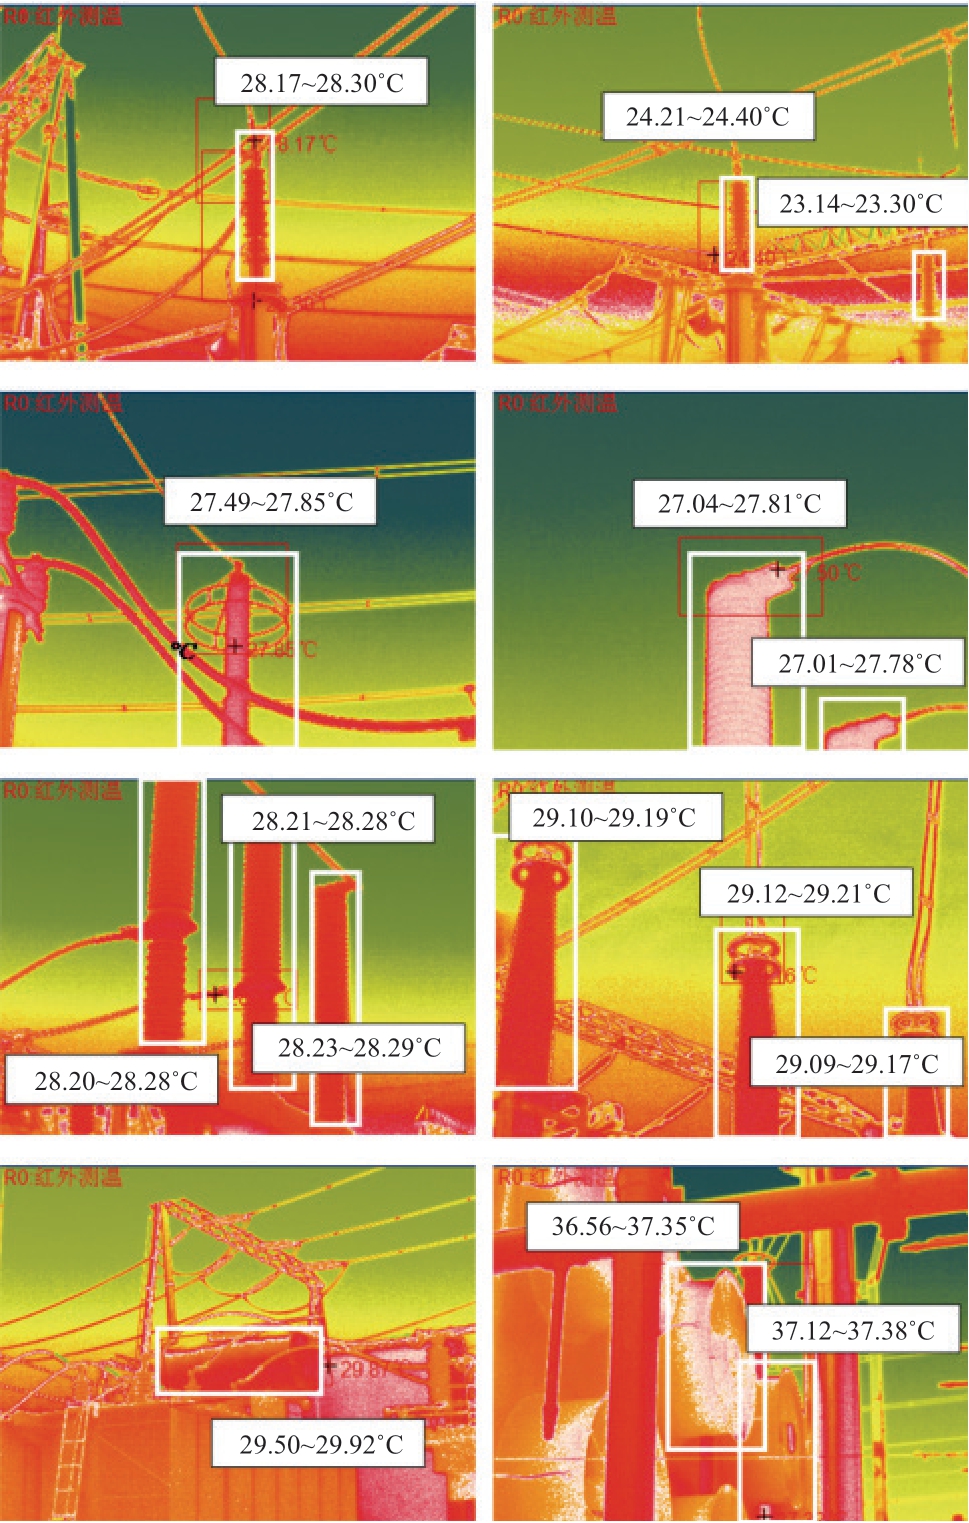
Fig.6 Recognition Results of Power Equipment in a Substation Based on Infrared Images.
2.3 Comparison with other models
The proposed method is then compared with other commonly used models to reflect its superiority.The comparative analysis is based on two aspects:equipment identification and temperature identification.For equipment identification,the following deep self-attention networks:faster region-based convolution neural network(faster RCNN)[20] and single-shot detector(SSD)[21] are used.For temperature identification,the MFSC,OTSU [22],and k-means clustering [23] are used.
With regard to current mainstream target recognition models,the aforementioned networks can be divided into two categories:(1)two-stage models:deep self-attention networks and faster RCNN;(2)single-stage models:SSD.The advantages of the former and latter models constitute high accuracy and high operating efficiency,respectively.Fig.7 presents the model structure of faster RCNN,which is primarily divided into four parts:(1)basic network,which uses the ResNet50 network to extract features from the original image and share it with the region proposal network(RPN);(2)the regional candidate network(RPN),which is used to obtain the rectangular candidate frame of each object,and the position information of the candidate frame is provided at the same time;(3)region of interest pooling,which is used to extract the feature maps of fixed-size candidate regions;(4)prediction branch,which is used to generate the final prediction results according to the feature map of the candidate region.
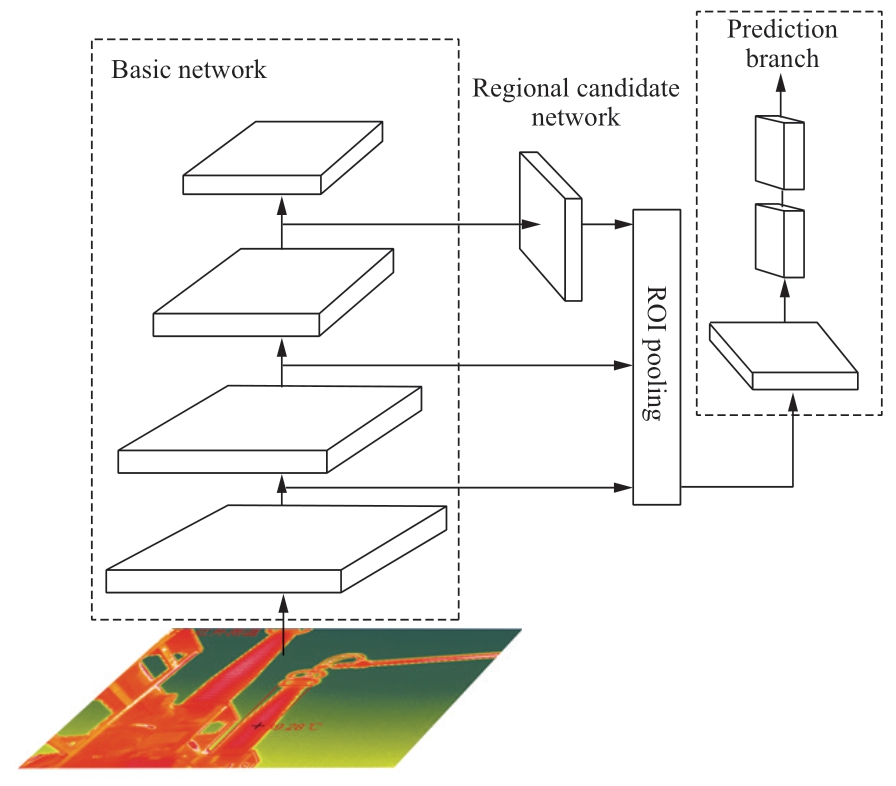
Fig.7 Network Architecture of Faster RCNN
The single shot multi-box detector(e.g.,SSD)structure is illustrated in Fig.8; it includes a basic network,additional feature layers,and prediction branches.The basic network uses the VGG16 network to extract features [24].Additional feature layers based on preset anchor points and the feature pyramid technology [25] are used to extract multi-scale features as a supplement.The prediction branch is used to predict the type and location of objects,and non-maximum suppression [26] is used to eliminate duplicate recognition results.In contrast to the faster RCNN and SSD models,the underlying module of the deep self-attention network is a self-attention layer.The processing sequence divides the image into small areas and arranges them in order.Thereafter,this region sequence is provided as an input to the encoder and decoder for feature mapping.Finally,the prediction branch is used for prediction.This approach demonstrates the advantages of parallel computing,few inter-regional association operations,high computational efficiency,and ease of use.In addition,the model has a certain degree of interpretability; that is,the focus of the model can be understood through the attention mechanism.
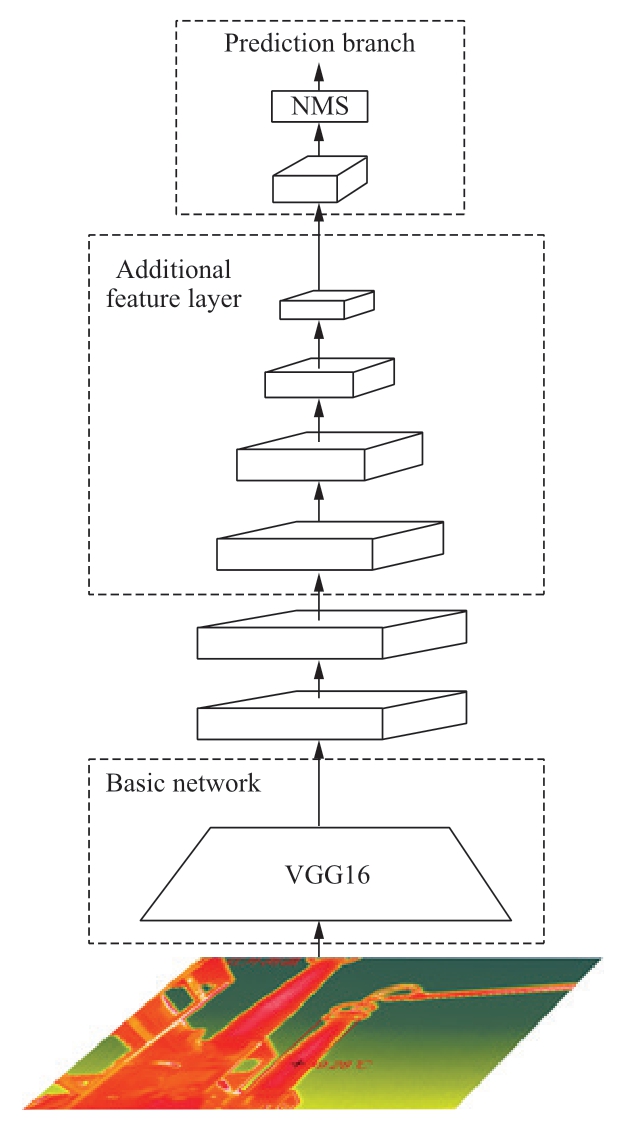
Fig.8 Network Architecture of SSD
Table 2 provides a comparison between the average accuracy of different models,where TR denotes the deep self-attention network,and FRCNN denotes the faster RCNN network.The results of the validation(left)and test(right)sets are also provided.The accuracy of the proposed method is significantly higher than that of the other two networks.This is because the deep self-attention network considers the relationship between different regions in the image,as well as the overall context and other information,which helps improve the accuracy of the substation infrared image recognition process.
A comparison between various temperature recognition models examines the effect of image segmentation,which involves distinguishing the overheated area of the equipment,the reference area,and the background.The comparison methods include the OTSU algorithm and k-means clustering.For the OTSU algorithm,the infrared image is converted into a gray-scale image,and the segmentation threshold is calculated based on the concept of maximizing the variance between classes.Based on this threshold,the image can be divided into a foreground and background; that is,the gray threshold that maximizes the variance between the foreground and background classes is determined.Moreover,the attributes processed by k-means clustering are gray values.After randomly selecting k cluster centers at the initial moment,the sample points are classified according to the distance from the cluster center,and the obtained categories are used to recalculate the cluster centers.The aforementioned process is repeated until the cluster center no longer moves.
Table 3 lists the corresponding accuracy rates of different temperature identification models.To independently verify the effect of each temperature identification model,the device location information in the label is used,which implies that the location information is completely accurate.In Table 3,MFSC1,MFSC2,and MFSC3 are simplified versions of the MFSC.The factors considered in these simplified versions are MFSC1(color),MFSC2(color and texture),and MFSC3(color,texture,and shape).In these models,we assign a value of 0 to the weights of ignored factors.
Table 3 Precision of different temperature identification models

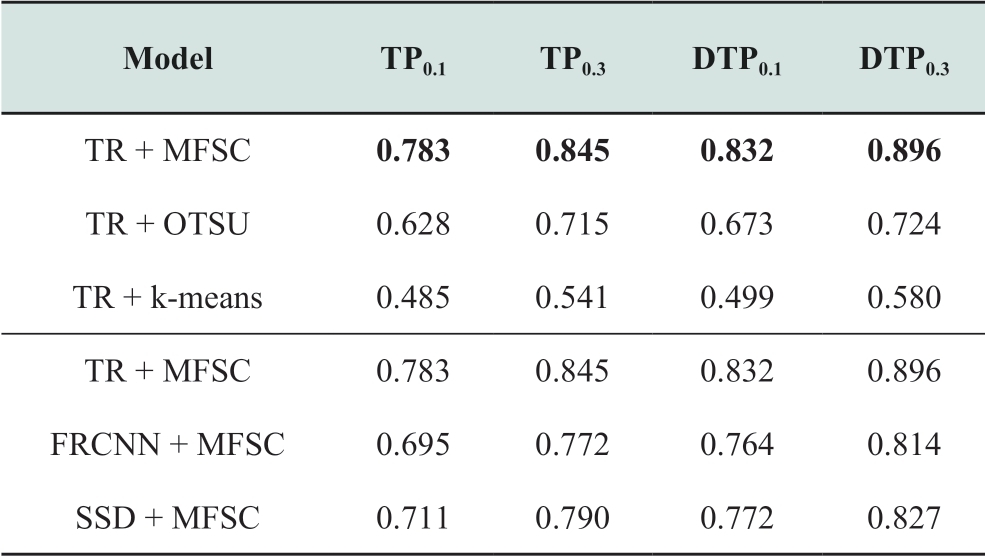
The temperature recognition accuracy of the MFSC method is much higher than that of the other two methods because the former method considers additional information,including the texture,size,and shape.For device contour recognition based on infrared images,an accurate judgement cannot be made solely based on color,that is,the temperature information.Thus,it is necessary to comprehensively consider various types of information,such as the size,shape,and texture.Table 4 lists the temperature accuracy rates corresponding to different recognition models.Herein,a combination of different target and temperature identification models is considered.The performance of the proposed model framework is significantly better than that of other models.
Table 4 Temperature precision of different recognition models
Finally,the equipment fault diagnosis experiment is carried out.According to the application analysis of DL/T 664—2016 “Application Rules of Infrared Diagnosis for Live Electrical Equipment”,different devices possess different alarm temperatures.Thus,according to the equipment type and temperature range predicted by the model,combined with the aforementioned standards,the operating conditions of the equipment can be easily obtained.Table 5 lists the results of the equipment fault diagnosis experiment.It should be mentioned that the true failure rate is based on the manual map recognition result,i.e.,the proportion of faulty equipment in the total equipment under actual conditions.For example,the test set comprises 100 images,of which 17 images correspond to lightning arresters,including 13 normal equipment and 4 overheated equipment; therefore,the true failure rate is 0.235.In a similar manner,the predicted failure rate is based on the model recognition result,i.e.,the proportion of faulty equipment in the total equipment in the predicted result.The recognition accuracy rate employs the average value of the normal and abnormal device recognition F1 scores.The F1 score is the harmonic average of the accuracy and recall.The accuracy represents the proportion of devices that are judged to lie in this category in the prediction results,and the recall represents the percentage of devices that are truly a part of the category that is successfully identified by the model.
Table 5 Fault-Detection Precision of Different Power Equipment Parts
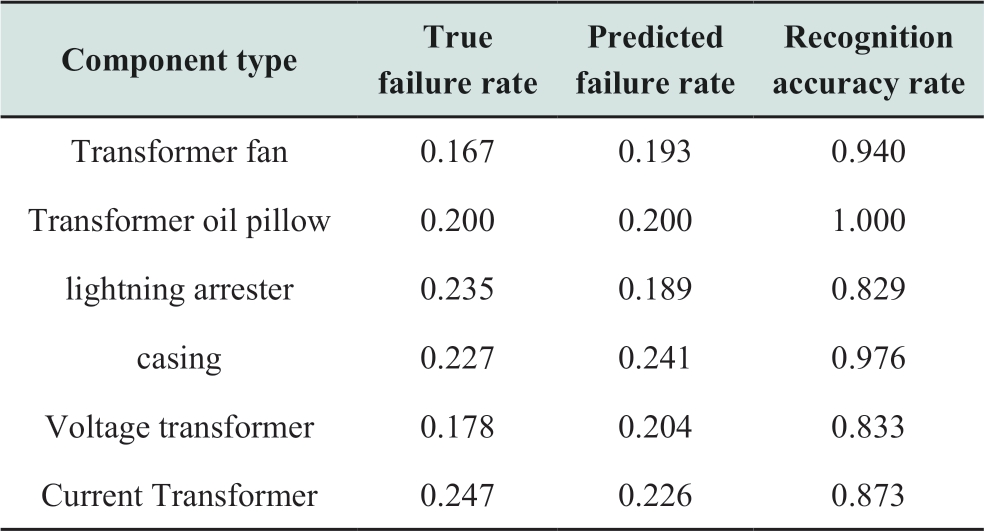
The prediction accuracy rate of the proposed framework is relatively high for various types of components,which indicates the rationality of the framework design.Compared with other components,the prediction accuracy of lightning arresters,voltage transformers,and current transformers is lower.This can be attributed to the complicated background in the images of such components; additionally,in this case,the difficulty in target recognition and temperature recognition is higher; thus,the overall fault prediction accuracy rate is not high.If the photo resolution can be increased while the shooting angle is reasonably selected to reduce background interference,the prediction accuracy of the aforementioned components can be significantly improved.
3 Conclusion
This paper proposes a recognition framework based on the infrared images of power equipment,which includes two primary stages:equipment classification and temperature distribution identification.In the first stage,a deep selfattention network is introduced,and in the second stage,an MFSC-based segmentation module is adopted.
(1)The introduction of the deep self-attention network for power equipment classification is considered relevant,as context information,being the focus of the deep selfattention network,is quite useful in this task.It improves the object detection accuracy and reduces data dependency.
(2)The design of the MFSC-based segmentation module is one of the primary contributions of this study.First,the transformation of the temperature distribution identification task into a segmentation problem is demonstrated.Following this,multi-factor similarity between regions is determined as the criterion for region merging.The advantage of this module is that it considers various factors,including the texture,shape,and size,which improve the segmentation quality.
Based on the experiments performed in this study,the proposed method is found to be significantly better than other related methods.For instance,the average equipment detection accuracy(mAP)and temperature precision(TP0.1)of the proposed model are,respectively,7.5% and 14.8%higher than the corresponding values of other related methods.In addition,the recognition accuracy rate of the proposed method is at least 82.9% for various component types,which satisfies the criteria of actual applications.The experimental results indicate that the proposed framework is conducive to a further development in the power equipment inspection automation technology.
Acknowledgements
This work was supported by National Key R&D Program of China(2019YFE0102900).
Declaration of Competing Interest
We declare that we have no conflict of interest.
References
[1] Han S,Yang F,Jiang H,et al.(2020)A Smart Thermography Camera and Application in the Diagnosis of Electrical Equipment.IEEE Transactions on Instrumentation and Measurement,70:1-8
[2] Chen D Q,Guo X H,Huang P,et al.(2020)Safety distance analysis of 500kV transmission line tower UAV patrol inspection.IEEE Letters on Electromagnetic Compatibility Practice and Applications,2(4):124-128
[3] Yang L,Fan J F,Liu Y H,et al.(2020)A review on state-ofthe-art power line inspection techniques.IEEE Transactions on Instrumentation and Measurement,69(12):9350-9365
[4] Jaffery Z,Dubey A(2014)Design of early fault detection technique for electrical assets using infrared thermograms.International Journal of Electrical Power & Energy Systems,2014(63):753-759
[5] HUDA A S N,TAIB S,JADIN M S,et al.(2012)A semiautomatic approach for thermographic inspection of electrical installations within buildings.Energy Build,55:585-591
[6] HUDA A S N,TAIB S,JADIN M S,et al.(2014)A new thermo-graphic NDT for condition monitoring of electrical components using ANN with confidence level analysis.ISA Transactions,53(3):717-724
[7] Li S,Lee M C,Pun C M(2009)Complex zernike moments features for shape-based image retrieval [J].IEEE Transactions on Systems,Man,and Cybernetics-Part A:Systems and Humans,39(1):227-237
[8] Sit A,Kihara D(2014)Comparison of image patches using local moment invariants.IEEE Transactions on Image Processing,23(5):2369-2379
[9] Cao R,Fang L Y,Lu T,et al.(2021)Self-attention-based deep feature fusion for remote sensing scene classification.IEEE Geoscience and Remote Sensing Letters,18(1):43-47
[10] Felzenszwalb P F,Huttenlocher D P(2004).Efficient graph-based image segmentation.International journal of computer vision,59(2):167-181
[11] Uijlings J R R,Van De Sande K E A,Gevers T,et al.(2013)Selective search for object recognition.International journal of computer vision,104(2):154-171
[12] Jiang Y N,Li Y,Zhang H K(2019)Hyperspectral image classification based on 3-D separable ResNet and transfer learning.IEEE Geoscience and Remote Sensing Letters,16(12):1949-1953
[13] Vaswani A,Shazeer N,Parmar N,et al.Attention is all you need.arXiv preprint arXiv:1706.03762,2017
[14] Rankin B M,Meola J,Eismann M T(2017)Spectral radiance modeling and Bayesian model averaging for longwave infrared hyperspectral imagery and subpixel target identification.IEEE Transactions on Geoscience and Remote Sensing,55(12):6726-6735
[15] Shao J,Hu W Y,Jia F M,et al.(2013)Application of infrared thermal imaging technology to condition-based maintenance of power equipment.High Voltage Apparatus
[16] Zheng H B,Sun Y H,Liu X H,et al.(2021)Infrared image detection of substation insulators using an improved fusion single shot multibox detector.IEEE Transactions on Power Delivery,36(6):3351-3359
[17] Behl A,Mohapatra P,Jawahar C V,et al.(2015)Optimizing average precision using weakly supervised data.IEEE Transactions on Pattern Analysis and Machine Intelligence,37(12):2545-2557
[18] Zhao M X,Ning K,Yu S M,et al.(2020)Quantizing oriented object detection network via outlier-aware quantization and IoU approximation.IEEE Signal Processing Letters,27:1914-1918
[19] Yu F,Koltun V.Multi-scale context aggregation by dilated convolutions.arXiv preprint arXiv:1511.07122,2015
[20] Ren S Q,He K M,Girshick R,et al.(2017)Faster R-CNN:Towards real-time object detection with region proposal networks.IEEE Transactions on Pattern Analysis and Machine Intelligence,39(6):1137-1149
[21] Singh S P,Sharma M K,Lay-Ekuakille A,et al.(2021)Deep ConvLSTM with self-attention for human activity decoding using wearable sensors.IEEE Sensors Journal,21(6):8575-8582
[22] Otsu N(1979)A threshold selection method from graylevel histograms.IEEE Transactions on Systems,Man,and Cybernetics,9(1):62-66
[23] Khan I,Luo Z W,Huang J Z et al(2020)Variable weighting in fuzzy k-means clustering to determine the number of clusters.IEEE Transactions on Knowledge and Data Engineering,32(9):1838-1853
[24] Simonyan K,Zisserman A.Very deep convolutional networks for large-scale image recognition.arXiv preprint arXiv:1409.1556,2014
[25] Jin Z C,Liu B,Chu Q,et al.(2020)SAFNet:A semi-anchorfree network with enhanced feature pyramid for object detection.IEEE Transactions on Image Processing,29:9445-9457
[26] Shi M,Peng O Y,Yin S Y,et al.(2019)A fast and powerefficient hardware architecture for non-maximum suppression.IEEE Transactions on Circuits and Systems II:Express Briefs,66(11):1870-1874
Biographies

Yaocheng Li received bachelor’s degree of Electrical Engineering from Southwest Jiaotong University,Chengdu,China,in 2018.He is currently pursuing Ph.D.degree at Shanghai Jiaotong University.His current research interest is computer-vision-based autonomous defect detection in power transmission equipment.

Yongpeng Xu received the Ph.D.degree from Shanghai Jiao Tong University,in 2019.In addition,from 2019 to 2021,he worked as a Post Doctoral Researcher in Shanghai Jiao Tong University.Currently,he is a assistant research fellow in the School of Electronic Information and Electrical Engineering,Shanghai Jiao Tong University,Shanghai,China.His interests include condition monitoring,partial discharge and fault diagnosis.
Mingkai Xu Senior engineer,graduated from Shandong University of technology with a bachelor’s degree in 1997,majoring in power system and automation.Now he works in State Grid Jinan power supply company,engaged in power grid operation,safety production and other management work.His main research interest is power system relay protection.
Siyuan Wang Senior engineer,graduated from Shandong University with a master’s degree in 2006,majoring in power system and automation.Now he works in State Grid Jinan power supply company,engaged in the operation and maintenance management of substation electrical equipment.His main research interest is the operation and maintenance of primary equipment of power grid.

Zhicheng Xie received the B.Sc.degree in South China University of Technology,Guangzhou,China,in 2012 and Ph.D.degree in Huazhong University of Science and Technology,Wuhan,China,in 2017.His researches mainly focus on intelligent operation and maintenance technology for transformer and bushing.
Zhe Li received the B.Sc.,M.E.and Ph.D.degrees in high voltage and insulation technology at Shanghai Jiao Tong University,China in 2000,2005 and 2007,respectively.He has been an associate professor in the Department of Electrical Engineering,Shanghai Jiao Tong University,and he was invited to Waseda University,Japan as a visiting researcher from 2008 to 2010.His interest is dielectric properties of polymer nano-composite and electrical insulation.
Xiuchen Jiang received the B.E.degree in high voltage and insulation technology from Shanghai Jiao Tong University,Shanghai,China,in 1987,the M.S.degree in high voltage and insulation technology from Tsinghua University,Beijing,China,in 1992,and the Ph.D.degree in electric power system and automation from Shanghai Jiao Tong University in 2001.Currently,he is a Professor in the Shanghai Jiao Tong University.His research interests are electrical equipment online monitoring as well as condition-based maintenance and automation.
(Editor Dawei Wang)
