0 Introduction
Renewable energy has been a vital aspect for the transition toward achieving a sustainable economy,but its development often requires additional transmission infrastructure.As countries try to pursue a low-carbon and clean development,the large-scale integration of clean energy is pivotal for this accomplishment.The integration of power systems forms the foundation of utilizing clean energy,because clean energy is not uniformly distributed across the globe nor it is always situated in proximity of the load centers.In Southeast Asia,the resource reserve and the renewable energy distribution is imbalanced as Indonesia and Vietnam possess 98% of the hard coal reserve and 51% of the crude oil reserve in the region [1].Moreover,countries such as Laos have huge enormous potential for hydroelectric and solar energy generation [2].Unleashing this potential will greatly benefit the whole region in terms of a low-carbon and clean development [3].Cross-border power interconnection is one of key factors in the process of energy transition of Southeast Asia [4].
Numbers of literatures has identified the challenges of power interconnection in the region and have suggested regional cooperation in terms of technology,policy,and market.The major barriers and technical challenges to promote power interconnection in the region have been analyzed and certain technologies have been proposed to resolve the current limitations [5].In addition,a super-grid interconnection linking Australia to ASEAN countries has been proposed with a critical appraisal of the benefits,potential,challenges,and issues encountered by the initiative [6].More importantly,the current grid flexibility in Southeast Asia has been assessed using score-based quantitative indicators [7].In particular,Ref.[8] presented a power-flow-based methodology to analyze the regional power grid.Furthermore,the power markets and institutions of Southeast Asia have been comparatively analyzed [9][10].Similarly,the political forces that drive electricity grid expansion in the EU and ASEAN have been analyzed [11].In terms of geography,these existing research predominantly focus on the power interconnection within ASEAN countries or with Australia,whereas that with China and other neighboring regions is not adequately considered.A larger interconnected grid promotes the consumption of renewable energy according to the complimentary load and renewable energy of various countries.Thus,the power interconnection between Southeast Asia,China,and South Asia should be explored and investigated.In terms of modeling,present simulation models have not considered high percentage of renewable energy production and distribution in the Southeast Asia–China–South Asia region.Furthermore,in terms of the analysis content,there is no in-depth analysis of the hourly resolution operation characteristics and the economics of cross-border channels in the entire region,which is significant in the form of a region-wise grid.
Therefore,this study conducts a detailed economic analysis of cross-border interconnection channels based on an improved simulation model covering Southeast Asia and its surrounding regions considering variable renewable energy(VRE)characteristics.Essentially,the three features have been stated as follows:1)an hourly resolution model is established considering the power interconnection between Southeast Asia,China,and Bangladesh,which provides an improved understanding of the future prospect of this region; 2)a hierarchy of VRE generating modules is proposed to enhance the practicality and usability of the comprehensive production simulation for longterm planning; 3)the operation pattern and economics of the transmission channels were analyzed to obtain a more valuable fundament for promoting these projects.The remainder of this paper is organized as follows:the basic condition of Southeast Asia and its demand for interconnection is introduced in Section 1.Thereafter,the details on the simulation model are provided in Section 2.In particular,a detailed analysis was performed to estimate the operation condition of channels and emissions in Section 3.Moreover,a sensitivity analysis was conducted in Section 4 to demonstrate the influence of various factors on the economics of multiple comparable cases.Finally,the conclusions are remarked in Section 5.
1 Overview of Southeast Asia Electricity Sector
1.1 Current electricity sector
Southeast Asia is rich in natural resources as well as renewable energy forms.According to an OECD report,the unexploited potential for hydropower in the Southeast Asia is substantial [3].In general,most countries offer an enormous potential for solar power,but relatively,only a few regions is rich in suitable wind resources [12].
As the economy of Southeast Asia has displayed strong development,the power consumption is estimated to increase tremendously.Overall,the electricity generation of the region has tripled from 1995 to 2015,as depicted in Fig.1.During this period,the annual growth rate of electricity generation has been 7%.Notably,the lower-Mekong countries have grown even more rapidly but with a lower base [2].According to the Asian Development Bank,Southeast Asian countries will require an allocation of up to 5.7% of their GDP for infrastructure,including transmission and distribution capacity increase,to increase their power generation capacity with respect to the power consumption [13][14].Regarding the power trade in the region,ASEAN countries are seeking to export power as a source of export revenue in the future.Between 2000 and 2015,the annual power export of Laos has increased from 2.8 to 11.5 TWh.Moreover,Cambodia imported 1.5 TWh of power to manage the declined hydroelectric power generation during the dry season [2].
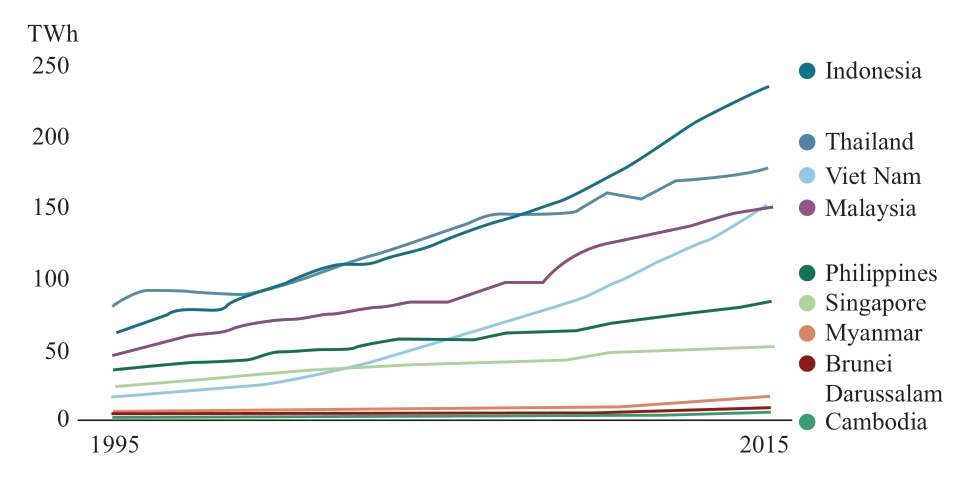
Fig.1 Electricity generation by country in Southeast Asia
1.2 Outlook
For instance,70% of Cambodia’s power load is concentrated in the region of the capital city [12],whereas most of its hydroelectric power is dispersed and requires transmission channels to adequately utilize its potential.The situation is similar in the region of Southeast Asia for any single country.The hydroelectric power generation stations in Southeast Asia are primarily concentrated in countries such as Cambodia,Laos,and Myanmar,whereas other countries such as Vietnam and Indonesia possess large crude oil and fossil fuel reserves.
As ASEAN aspires to enhance the connectivity of the countries in this region [15],more transmission channels should be constructed to satisfy the increasing power consumption.In addition,as they intend to reduce their carbon emission,a higher renewable energy consumption can be expected in the long term [16],which further requires transmission infrastructure.
2 Methodology
To assess the economics of the transmission channels,a compendious production simulation was conducted herein to illustrate the status of the channels.The costs and revenue were calculated according to the results of the production simulation.
The input of this simulation contained the load and its forecast,VRE curves,generation planning,typical yield of pollutant,potential pollution,and carbon tax.Productively,the output of this simulation yielded the operation schedule of the generation,channel utilization data,amount of pollutant generated,etc.
As discussed in Section 2.1,the VRE curves were generated by the module,and the framework of the entire simulation is provided in Section 2.2.In addition,a reference case is elaborated in Sections 2.3–2.9.
2.1 Hierarchy VREs Curves Generating Module
The extraction of the characteristics of the VREs is still a major challenge in long-term power system planning.In particular,the power from VREs,e.g.,wind and solar,is driven by the meteorological conditions such as the momentary wind speed or solar irradiation.More importantly,the temporal and spatial unpredictability of the resources is frequently incompatible with the existing system load.Thus,the clustering algorithm based on the historical data constitutes a basic method for analyzing the VRE output and similar problems.According to the characteristics of various problems,the primary improvements are related to the determination of the number of clustering groups and the construction of the appropriate distance function [17-20].This section applied a hierarchy clustering method to simulate the primary character of wind and solar energy in Southeast Asia,which is based on the monthly–daily–hourly time scales of VREs output throughout the year.First,the number of clustering group is extracted by monthly features,and thereafter,the distance function was constructed on the daily–hourly scale to more appropriately reflect the volatile characteristics of VREs.
1)Monthly level:this stage uses the affinity propagation(AP)clustering algorithm to detect the primary pattern of the VREs considering energy and power fluctuations.The monthly energies(column 1)and the hourly variations in power for the given month(column 2)form the input matrix.Thereafter,the AP clustering approach was used to obtain the number of groups as the outcome.
2)Daily level and Hourly level:the evaluation of similarity between the VRE power curves,denoted as the distance between the curves,forms the key approach for clustering.It applies a method to combine the daily level and hourly level data to compute the distances using the following equation:
where αi,j denotes the distance of the i-th curve and j-th curve.The subdistance σi,j denotes the Euclidean distance at the hourly level and τi,j represents the subdistance based on the discrete rate of variations at the daily level.β1 and β2 indicate the weighting factor of the two subdistances,herein set as 0.7 and 0.3,respectively.φ denotes the uniform coefficient.In particular,
where t denotes the t-th day,and n denotes the total days(generally 365).di,t and dj,t represent the absolute values of the rate of variations in the VRE output energy between t-th day and(t–1)-th day of the i-th and j-th curve.
Based on the calculated group numbers and the distance αi,j,the k-means clustering method was applied to generate the typical VRE curves.
2.2 Production Simulation
The basic function of the production simulation was to consider the characteristics of the various types of power plants in the power generation system(including wind power,solar power,hydropower,thermal power,and so on),completely utilize the capacity of the power plants,and simulate the system operation mode to verify whether the installed capacity of the system fulfilled the demand of the system.The detailed method is illustrated in Ref.[21].
The objective function aimed to minimize the total operation cost,as follows:
where Pit denotes the thermal power output i at t; Ft(Pit)accounts for the operational cost of thermal power i at t;χi and ψi indicate the cost of initiation and termination of thermal power,respectively; uit and uit–1 denote the state of plant i at t and(t–1),respectively,uit =1 attests service conditions and uit =0 indicates out of service.T denotes the total hours of the simulation period(such as 8760 h),and Nt implies the total number of thermal power plants.
1)The predominant constraints are stated as follows:the balance between electric power generation and load is crucial for maintaining the security and quality of the operation of the power system.The power balancing equation states
where Dt and PLt denote the load and loss of the system,respectively,Pjt indicates the output of hydroelectric power j at t; Nh denotes the number of hydroelectric power stations.
2)The reserve is a backup energy generation capacity used by the electric grid in the occurrence of an unexpected fault such as the unavailability of a power plant.The reserve of the system equation can be stated as
where,Rs(Pit)denotes the reserve of thermal power i at t,and Rh(Pjt)indicates the reserve of hydroelectric power j at t; RES(t)denotes the demand of the reserve at t.
3)The equation of upper and lower limits of output can be expressed as
where![]() and
and![]() denotes the upper and lower limit of the hydroelectric power and thermal power output.
denotes the upper and lower limit of the hydroelectric power and thermal power output.
4)The ramp rate equals the maximum rate of variations(increase or decrease)in megawatts per minute from power plants,which reflects the flexibility of the system.The ramp rate equation is related as
where RURi and RDRi denotes the upper and down limits of the ramp rate of the power plant,respectively.
5)During the operation of a hydropower station,its water consumption per unit time is related to the generation power,water head,and generation efficiency.If the water head is constant in a simulation period,the water flow constraint for each hydropower plant must be satisfied.The equation of hydropower characteristics can be stated as
where Qjt(Pjt)represents the water consumption of hydropower at t; Wj denotes the limitation of the water consumption at a given period.
Upon considering the water head as constant,the relationship between the power generated by a hydropower and the amount of water consumed can be derived as
where,aj,bj,and cj denotes the characters of a hydro power.
6)For the wind and solar power,each hourly generation curves,as discussed in Section 3.1,was derived from the daily load curve,and the operation of other units in the system was simulated.This produced a settled percentage curtailment of wind and solar power in case the system was under peak shaving difficulty.
The entire flowchart of the simulation is presented in Fig.2.
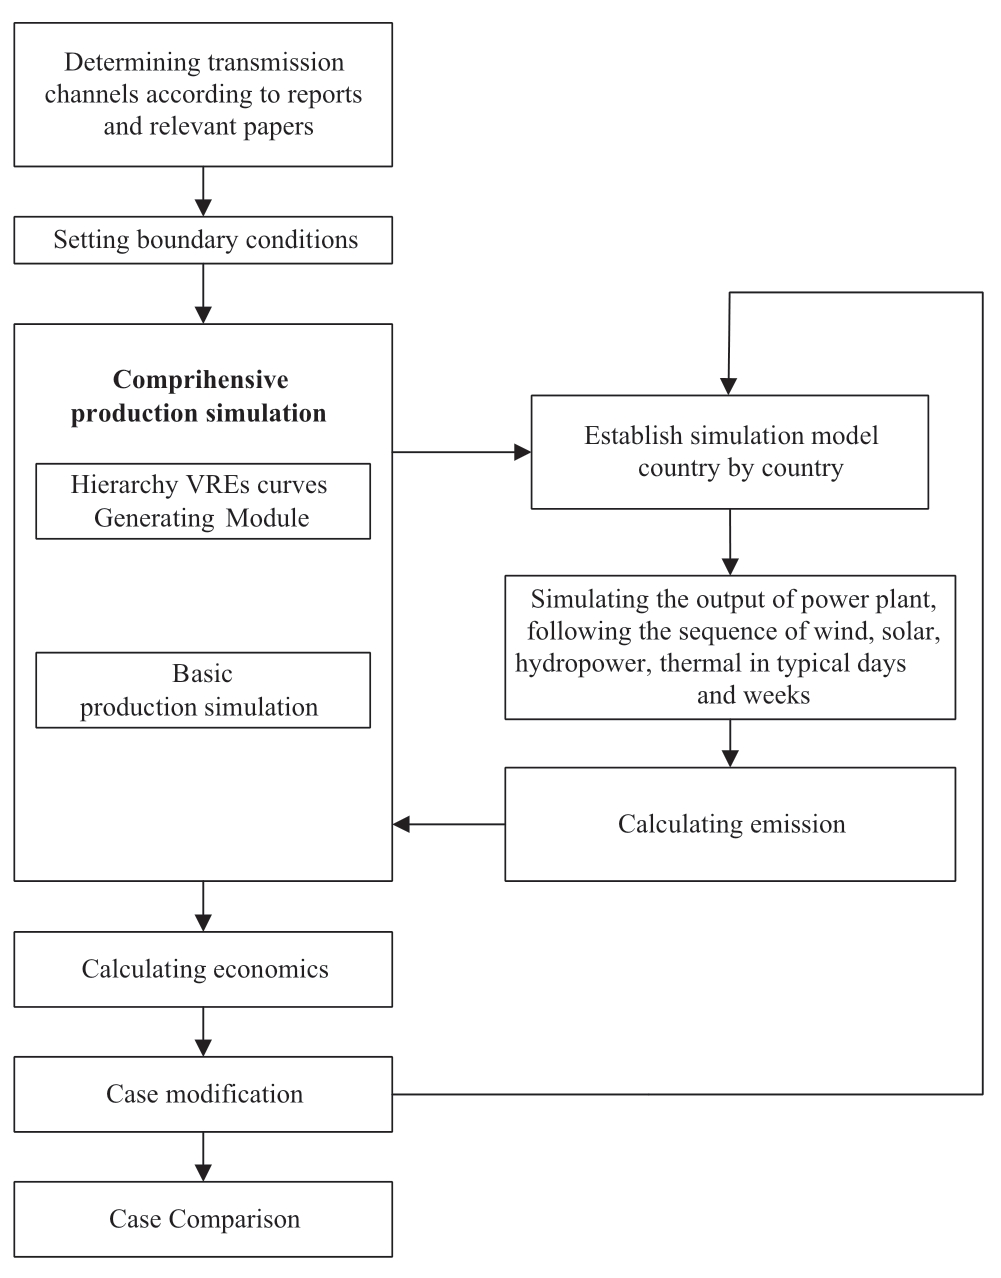
Fig.2 Methodology
2.3 Load forecast
The simulated year was 2035.As the annual power consumption has increased by approximately 7% each year from 1995 to 2015 [3],the increase is expected to remain robust and strong based on the relatively optimistic outlook on the economy of Southeast Asia.Therefore,we considered an annual maximum load growth of 5.3% and an annual power consumption growth of 4.7% [22].
2.4 Generation planning
The generation capacities in the simulation were set according to the ASEAN Energy Outlook(AEO)2017,and it refers to the IRENA Remap 2016 report.The total installed capacity in the simulation was 267 GW,which was consistent with the average capacity of the AEO businessas-usual scenario(i.e.,262 GW)[22].This extremely minor disparity occurred,because the AEO does not specify much detailed information regarding the installed capacity and inconsistently serve as a deterministic source.
2.5 Transmission channel and its properties
The transmission channels were set corresponding to the existing research and ASEAN power grid measures [22].Studies have demonstrated that the establishment of multiple transmission channels between the Southeast Asian countries is technically feasible [24].However,a few modifications have been executed on the previous result according to a few regional power planning reports.These amendments intend to eliminate the inconsistency between the simulated case and the existing planning of the region,thereby rendering the results more credible [25].
All channels except for the Thailand–Malaysia and Vietnam–China are set to allow free flow of power in both directions,following the principle of minimizing power cost in the receiving country.Thailand–Malaysia and Vietnam–China channels contain fixed power transmission as these projects have already manifested substantial progress in its application.Moreover,the capacity of the Vietnam–China channel was set to be lower than its current planning owing to the uncertainty in its subsequent application.
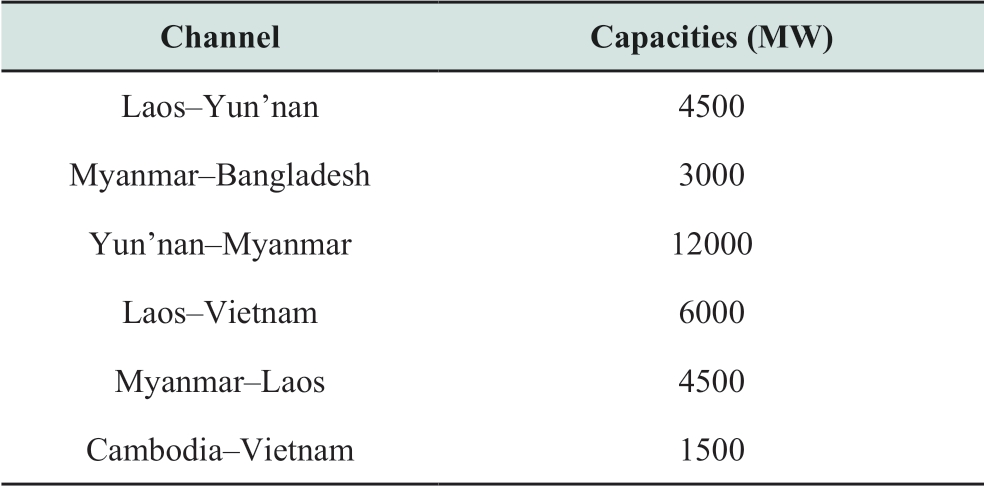
The selected channels(the project package)are listed in Table 1.
Table 1 Selected channels of simulation
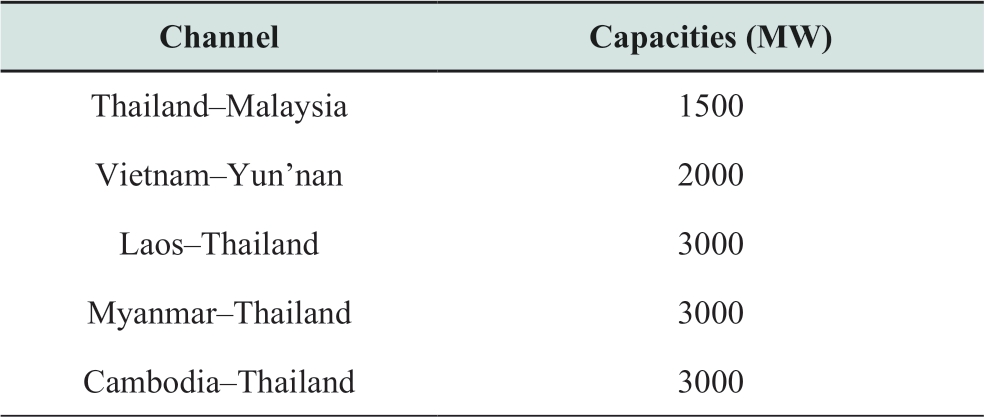
continue
2.6 Transmission channel investment estimation
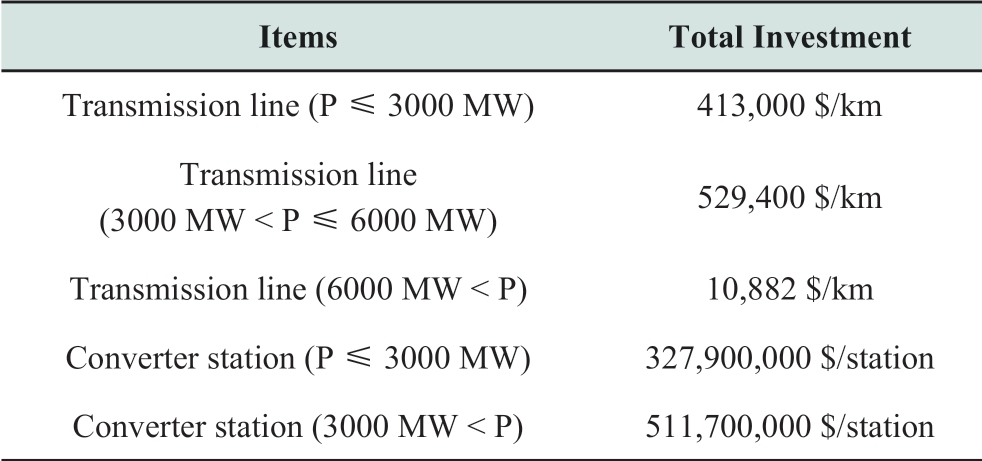
The investment of transmission channels refers to the current market figures [26,27] listed in Table 2.
Table 2 Basic investment estimation parameters
2.7 Pollutant and CO2 emission
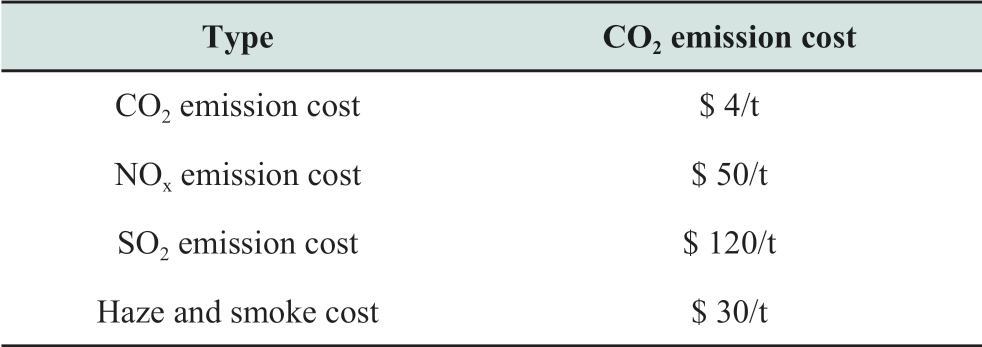
The figures from the typical thermal power plant statistics were adopted for the pollutant and CO2 emission standards.Additionally,the potential fee and charge for the pollutant and CO2 were determined according to the relevant standards of other Asian countries such as India,China,Japan,and South Korea.The exact tax or charge is stated in Table 3.
Table 3 Pollutant and CO2 emission cost parameters
2.8 Seasonal factors
Based on the weather conditions and the result of the hierarchy VRE-curves-generating method,the seasonal power output fluctuations in hydro,solar,and wind demand noteworthy attention.In general,the seasons(dry and wet seasons)significantly impact the output of hydroelectric power,which critically influences the generation mix.Incidentally,solar and wind electricity could be separated into two groups using the hierarchy VREs curves generation approach.The wet season of hydropower corresponds to a group in which wind power covers a greater capacity factor and solar energy presumes a lower capacity factor.The dry season of hydropower corresponds to another group in which solar is associated with a higher capacity factor and wind constitutes a lower capacity factor.For more illustrative and convenient comparison,January and September will represent the dry and wet seasons,respectively.
2.9 Other key factors
For simplicity,the tariff was set as 0% in the initial simulation.As ASEAN can be deemed as a medium of regional development cooperation in the region,it can propose a low or exempted tariff [28][29].Nonetheless,a sensitivity analysis will be conducted on the tariff to demonstrate its influence on the economics of such projects.
3 Result and discussions
3.1 Simulation results
Among the 11 transmission channels,4 typical channels were analyzed in-depth for simplicity,e.g.,Myanmar–Thailand,Yun’nan–Myanmar,Myanmar–Laos,and Cambodia–Vietnam.The selection principle aimed to represent all the categories of countries in the study region.For instance,Myanmar,Laos,and Cambodia are mostly exporter of the clean energy,whereas Thailand and Vietnam possess higher portion of thermal power,and they tend to consume greater amount of clean energy via imports.
The power transmitted by channels in the dry(January)and wet(September)seasons are depicted in the Figs.3–10.
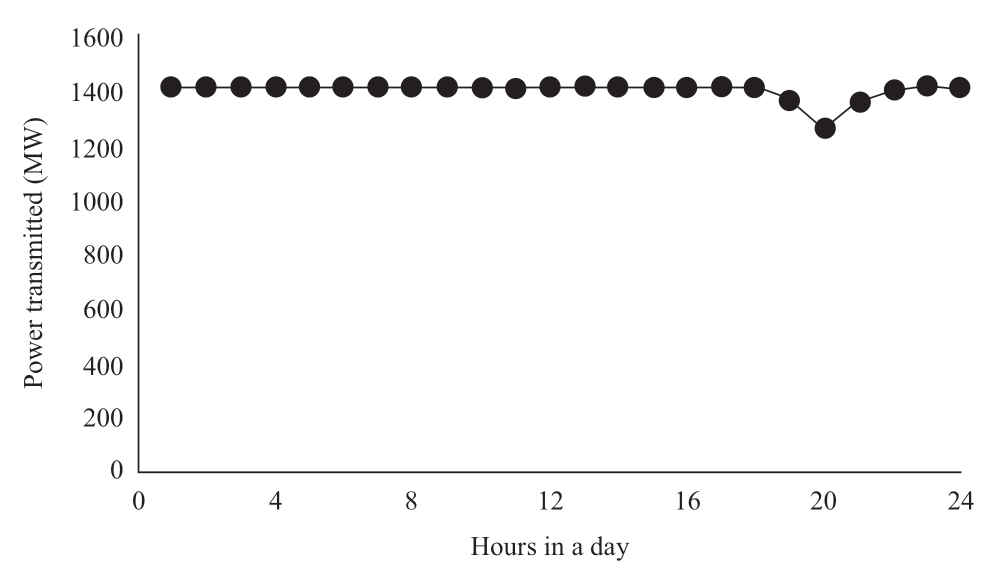
Fig.3 Myanmar–Thailand Channel(3 GW,wet)
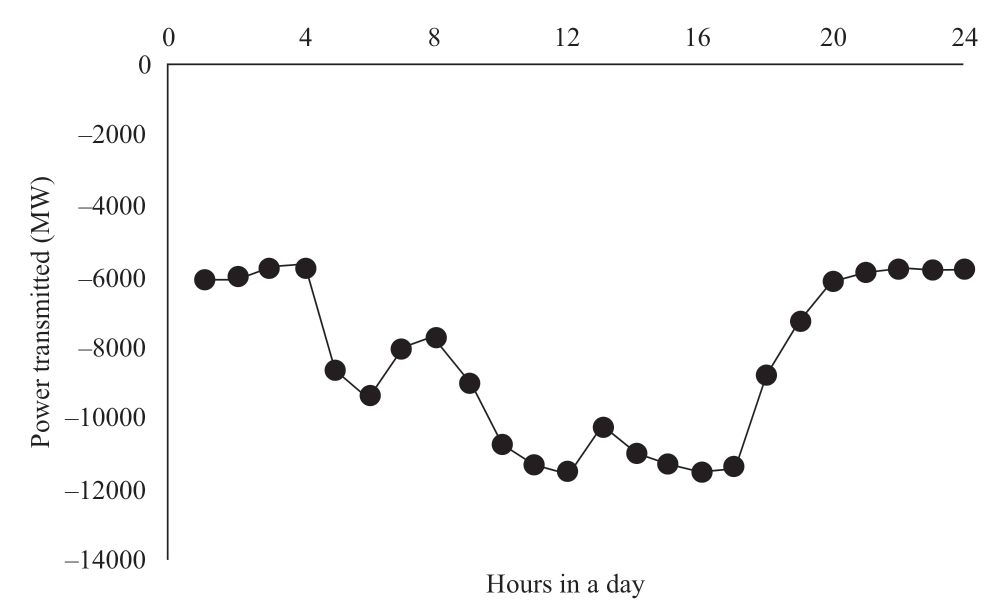
Fig.4 Yun’nan–Myanmar(12 GW,wet)
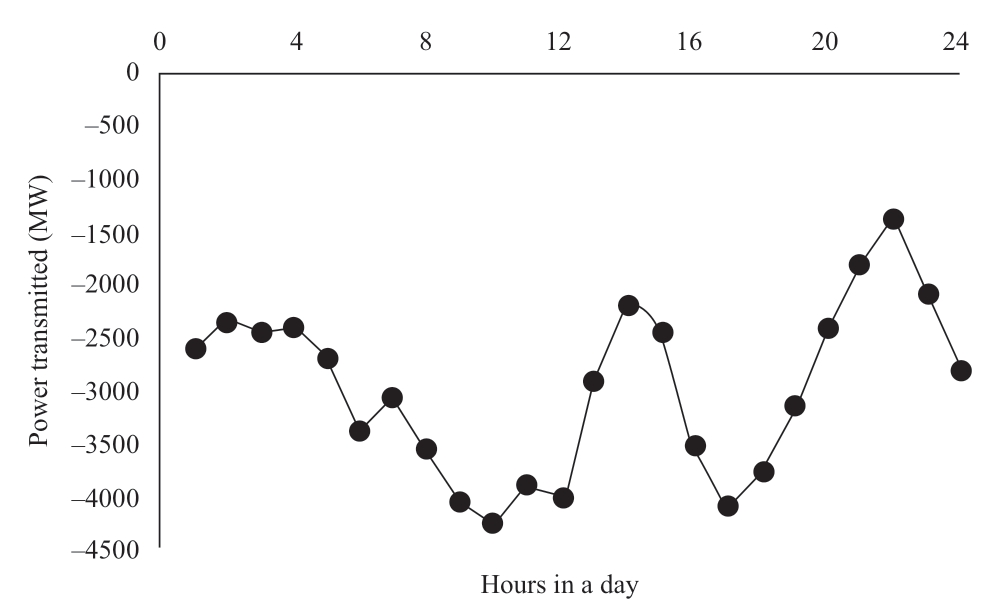
Fig.5 Myanmar–Laos(4.5 GW,wet)
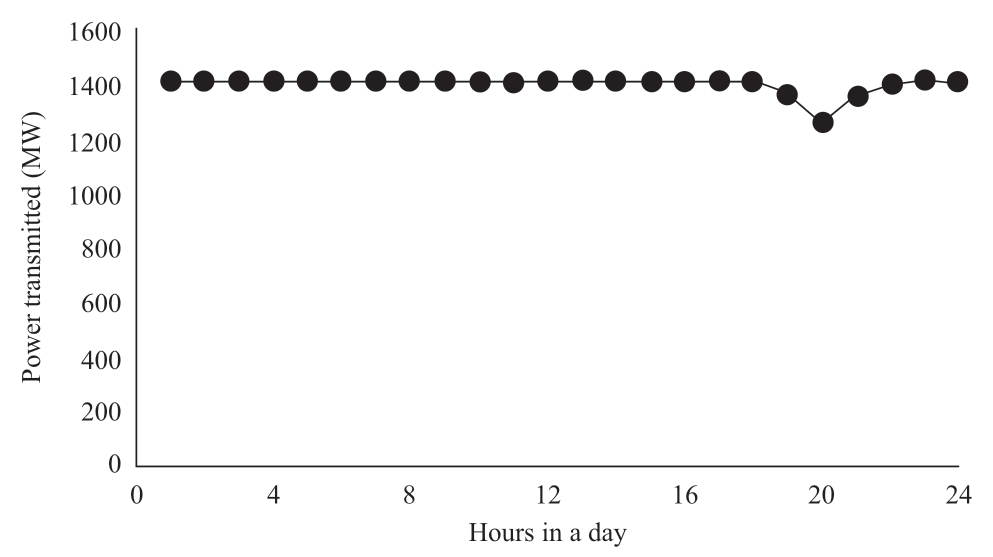
Fig.6 Cambodia–Vietnam(1.5 GW wet)
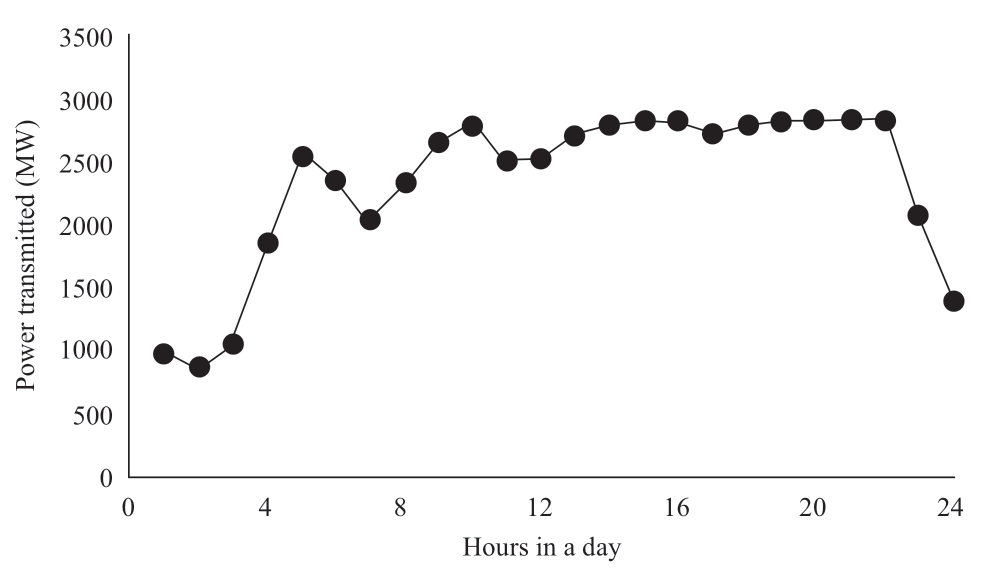
Fig.7 Myanmar–Thailand(3 GW,dry)
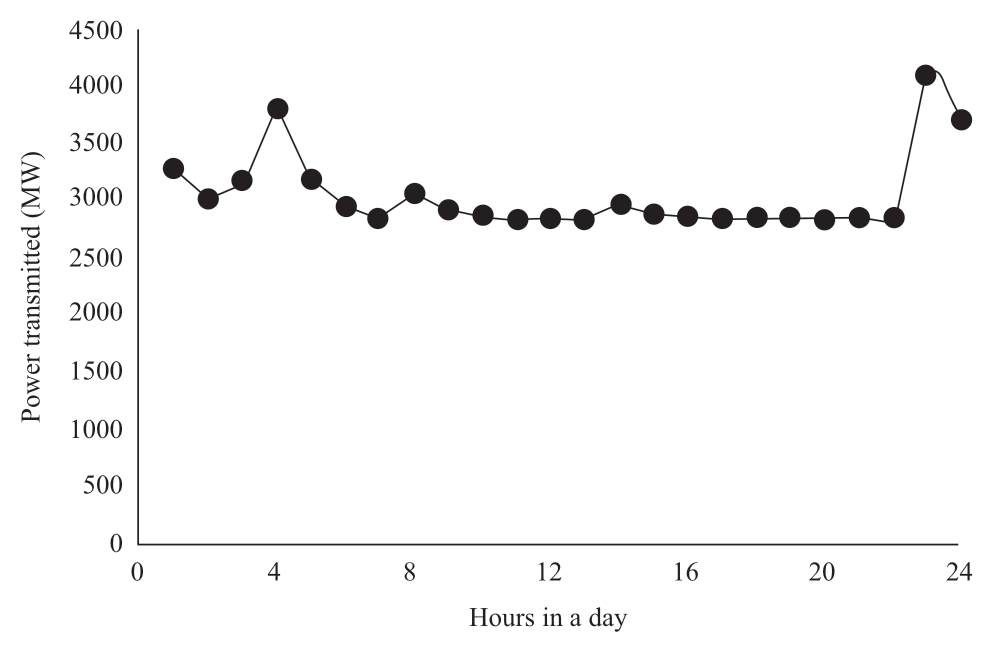
Fig.8 Yun’nan–Myanmar(12 GW,dry)
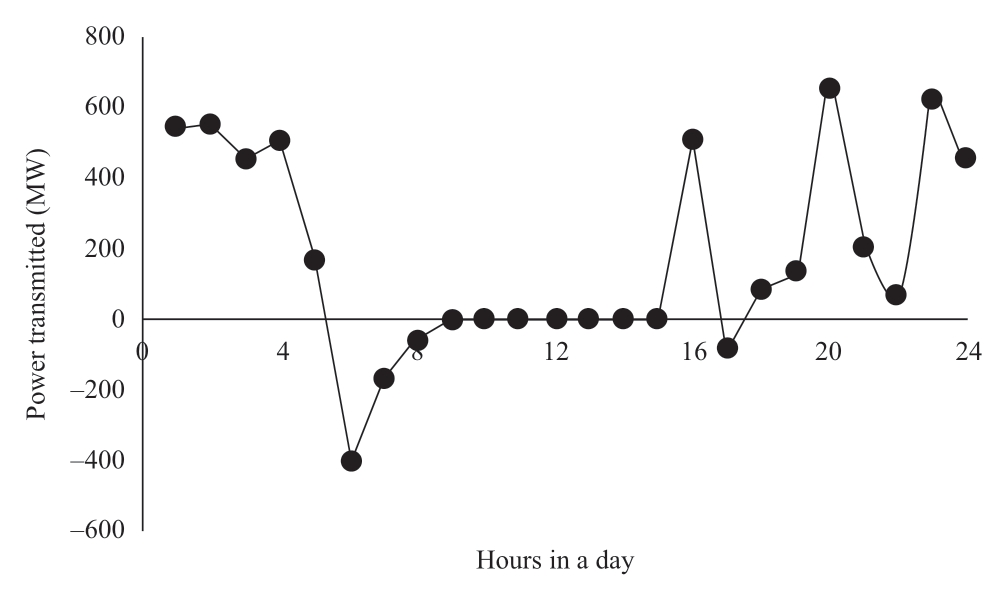
Fig.9 Myanmar–Laos(4.5 GW,dry)
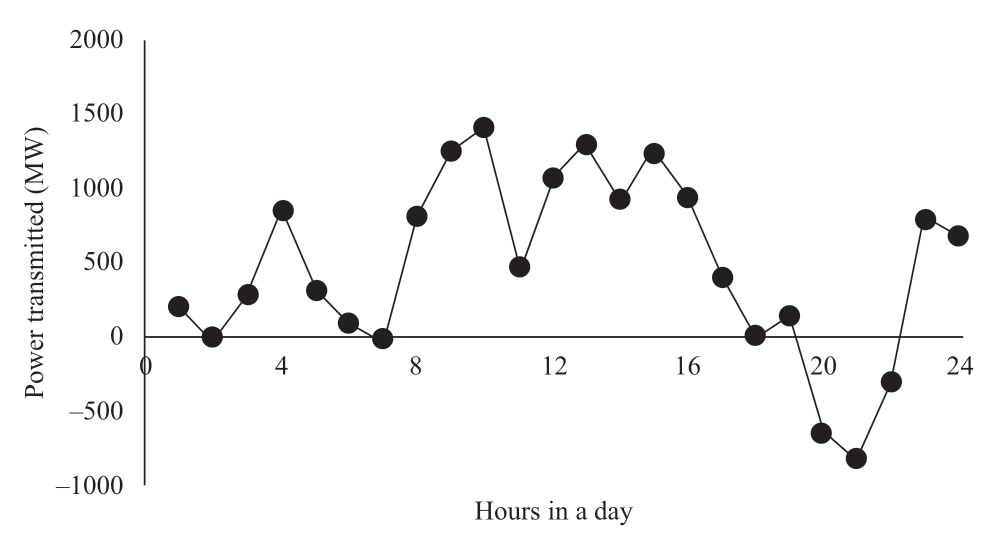
Fig.10 Cambodia–Vietnam(1.5 GW,dry)
In particular,an emission reduction of multiple agents such as CO2 and SO2 was observed.Moreover,the case with clean energy transmission channels was compared to the one with modified channels(20% of current capacity,hereinafter referred to as the 20% case).This reduction in the capacity reflects the existence of necessary interconnection between the countries,but with much less interactions.Furthermore,the emission and its reduction in both the cases is listed in Table 4.
Table 4 Emission and its cost reduction(104 ton)

3.2 Preliminary analysis on power transmitted via channels
1)During wet and dry seasons
The distinct characteristics can be spotted by comparing the two sets of figures for dry and wet seasons.In the dry season,all channels experienced a relatively low utilization rate compared to that in the wet season.The transmitted power in the wet season was 1.44 times that in the dry season.Considering a particular channel in the dry season as an example,the Myanmar–Laos channel displayed prominent fluctuations in its output curve with relatively low transmitted capacity,whereas during 9 am–2 pm,its output was fixed at 0,indicating that either there is no requirement for additional power in Laos at that moment or the power transmitted is unfavorable for Laos.Conclusively,the utilization varied considerably between the dry and wet seasons.Reasonably,policymakers should consider this disparity during their decision-making process,especially the 0.44 times gap between the seasons.
2)Between multiple types of countries
The distinct categories of channels exhibit varying characteristics of utilization.For instance,from power exporter to importer,the utilization rate was relatively stable,but with a few peaks in the early morning(1–4 am).This is partly because the load was at its minimum and the solar power were not at its output period.In contrast,the Myanmar–Laos channel,from exporter to exporter,transmitted power inconsistently from Laos to Myanmar.According to the detailed simulation result,this fluctuation corelated to the total power transmitted from Myanmar to South Asia and Myanmar to China.Consequently,this implies that the power from Laos could utilize the channel between these two countries for transmission to other regions or countries.
Summarily,the channels have to be categorized by the interconnecting countries.The characteristics were vital for countries to coordinate and improve their planning,or even in their power trade agreements,to obtain a more promising and stable profit.
3)Discussion on results
As a rule of thumb,a higher utilization rate will yield a higher profitability.In addition,significant fluctuations in the transmitted power act as evidence of uncertainty between the two interconnected sides.In principle,the fluctuation implies that the power transmitted is not economically favorable for a particular side during certain time periods.This preliminary analysis suggests that the profitability of these channels was affected by factors including seasons and the types of countries interconnected,despite the considerably high renewable penetration.This implies that stakeholders must be aware of these potential factors and a more extensive analysis is necessary.
Moreover,for the 20% case,except for the reduction in emissions,the result revealed that certain countries experienced severe wind and solar curtailment during the dry season if the capacity of the channels were relatively low.This is partly caused by the lack of peak load regulation ability and the fact that clean energy consumption is not always feasible in a particular country.
3.3 Economic analyses
The total investment is enumerated in Table 5.
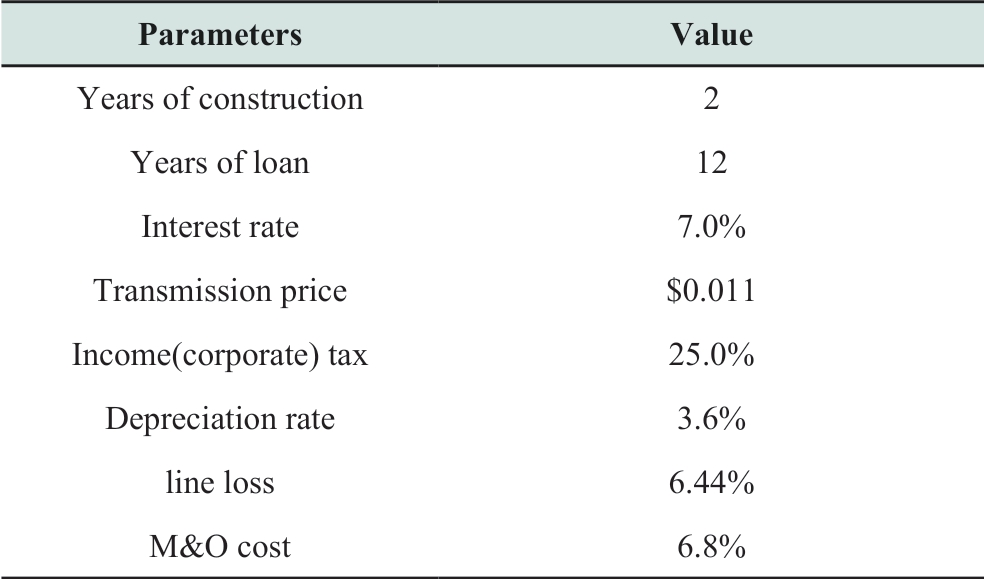
The significant parameters such as the depreciation rate,transmission loss,maintenance and operation cost,and tax are presented in Table 6.All factors were selected according to the data from the existing HVDC projects.However,a few factors are worth mentioning.The number of years of construction was selected according to the ongoing HVDC projects.Although the construction of all projects shall not begin simultaneously,this illustrative case will potentially reflect the approximated economics of the projects package.As the interest rate of the Asia Development Bank is ~2%,this case assumes 7.0% for a commercial loan [30].In addition,the transmission price was selected according to the existing HVDC projects,because this rate will not render the power transmitted as exceedingly expensive.
Table 5 Investment of Transmission Channels
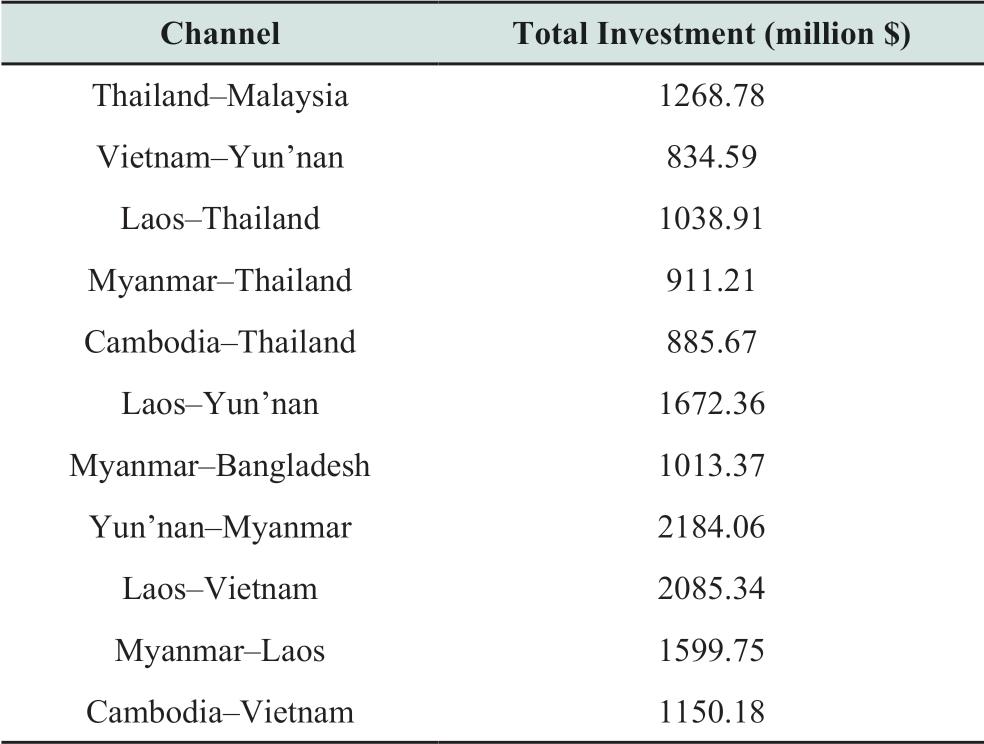
Table 6 Economics calculation parameters
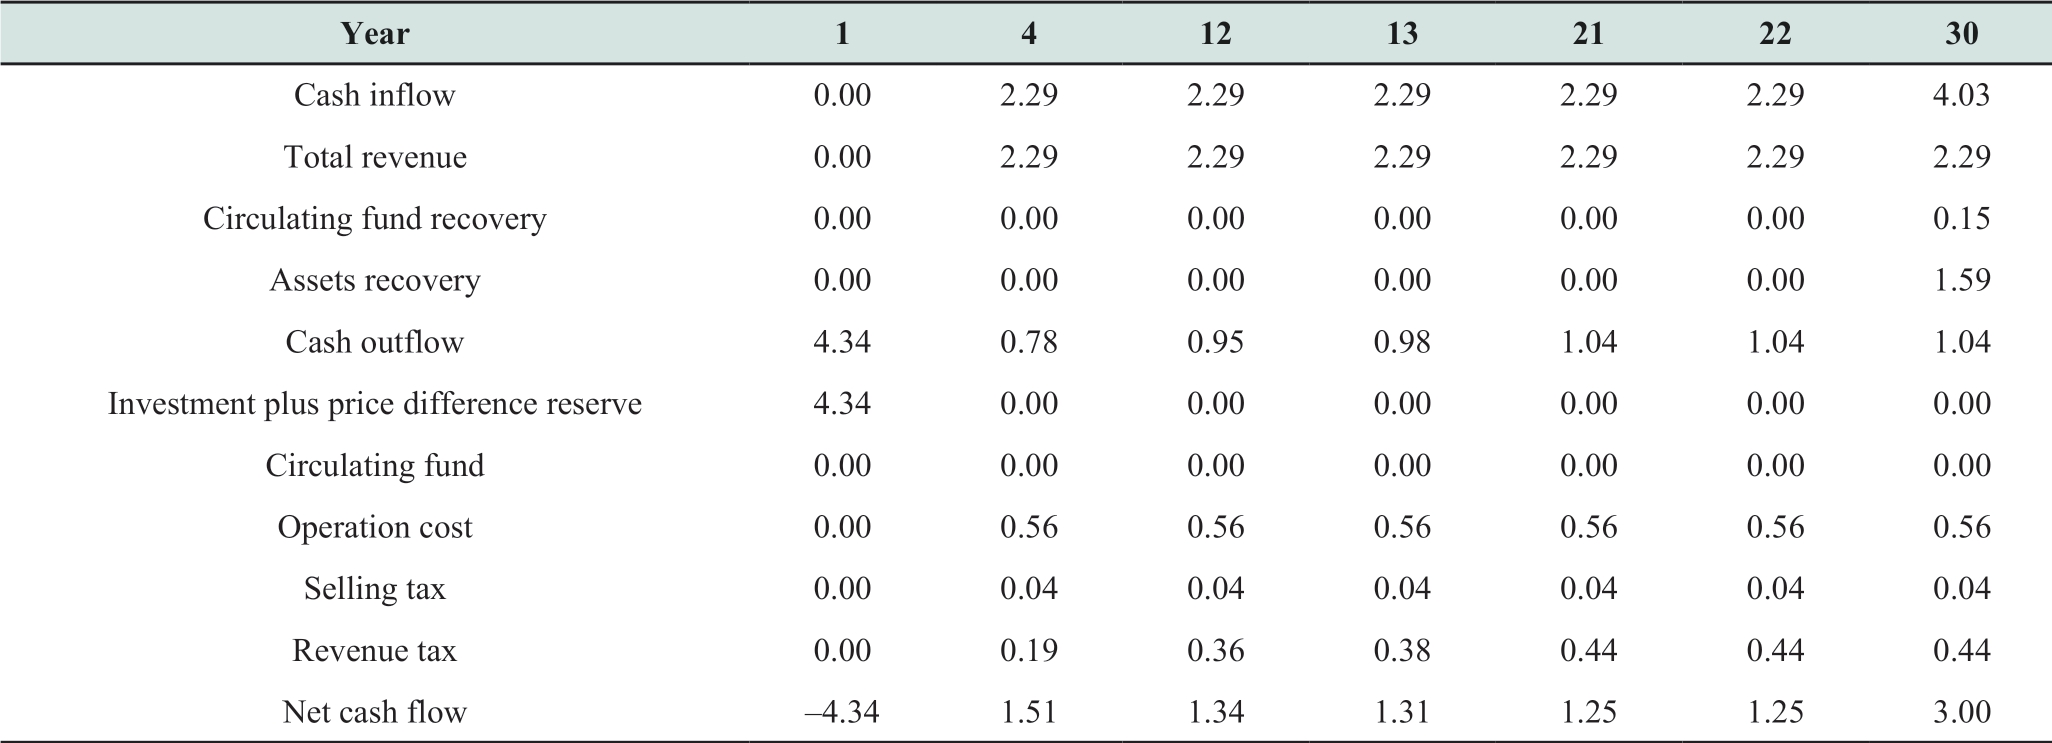
The specific economic calculation of the project package is presented in Table 7.
Table 7 Economic calculation of projects package(Billion $)
continue

According to Table 7,the cumulative net cash flow will produce positive yield in the 13th year,and its present value will become positive in the 22nd year.The IRR of the project package is 8.68%,which is higher than the loan cost.However,the long repayment period implies the disinterest of private sector in investing.
Apart from the financial statistics,the channels will reduce pollution and CO2 emissions.Comprehensively,the exact annual emission cost reduction is presented in Table 8.
Table 8 Annual emission cost reduction

4 Sensitivity analysis
To account for the uncertainty in development,a sensitivity analysis should be performed to determine the impact of the related parameters on the results.Accordingly,the clean energy penetration,tariff,and CO2 costs were regarded as the factors of sensitivity analysis.
For clean energy penetration,the ASEAN Plan of Action for Energy Cooperation(APAEC)2016–2025 aims to achieve a renewable energy target of 23% by 2025 in the ASEAN Total Primary Energy Supply [1].This is the main driver of the interconnection in Southeast Asia,and varying levels of penetration could significantly affect the economics of the project.For the tariff,it is an essential economic component that bears the potential to significantly raise the energy prices,diminish the internal rate of return,and lengthen the payback period [31].To deduce the CO2 cost considering the global efforts in mitigating climate change,certain Southeast Asian countries have contributed toward setting national CO2-emission-reduction targets,and thus,the carbon prices have served as a key driver of regional connectivity [4][32].
In the sensitivity analysis,we evaluated a sensitivity factor to present the relationship between the economics and additional parameters of the projects.

SAF represents the sensitivity factor between A and F,where F denotes the uncertainty factor.Therefore,ΔF/F indicates the variation rate of the uncertainty factor.A denotes a factor of economics,and similarly,ΔA/A represents the variation rate of the economic factor.
4.1 Clean energy penetration
As the development of clean energy generation will not completely satisfy the expectation,we further performed a sensitivity analysis.If the emissions have to decrease,the energy transmitted through the channels should be less and the environmental benefits should be reduced[4].Accordingly,three scenarios were set to evaluate the sensitivity factor,namely,the reference case,decreased case 1,and decreased case 2.The sensitivity factor between the clean energy penetration and project revenue is presented in Table 9.
Table 9 Sensitivity factor of clean energy penetration

Table 10 Sensitivity factor of tariff

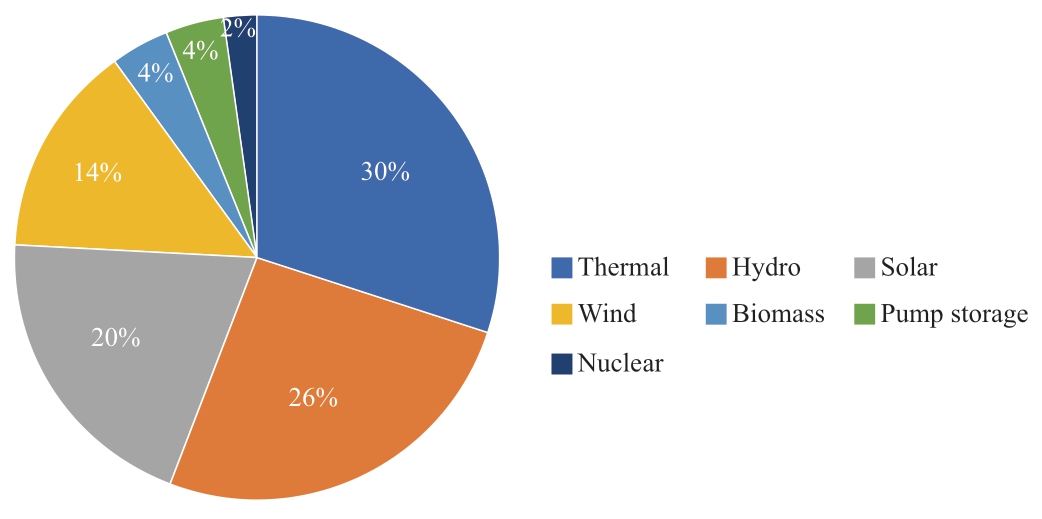
Fig.11 Simulated generation mix
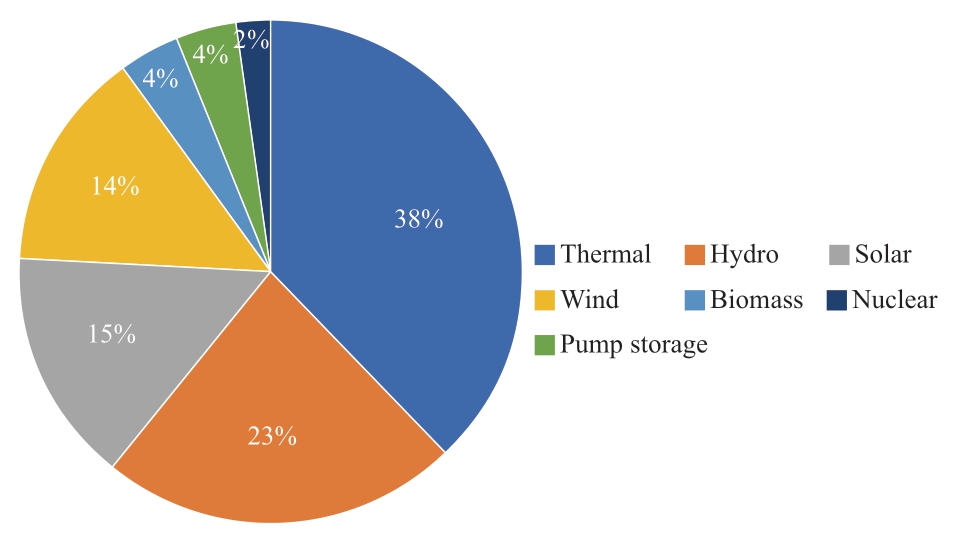
Fig.12 Decreased case 1 clean-energy-generation mix
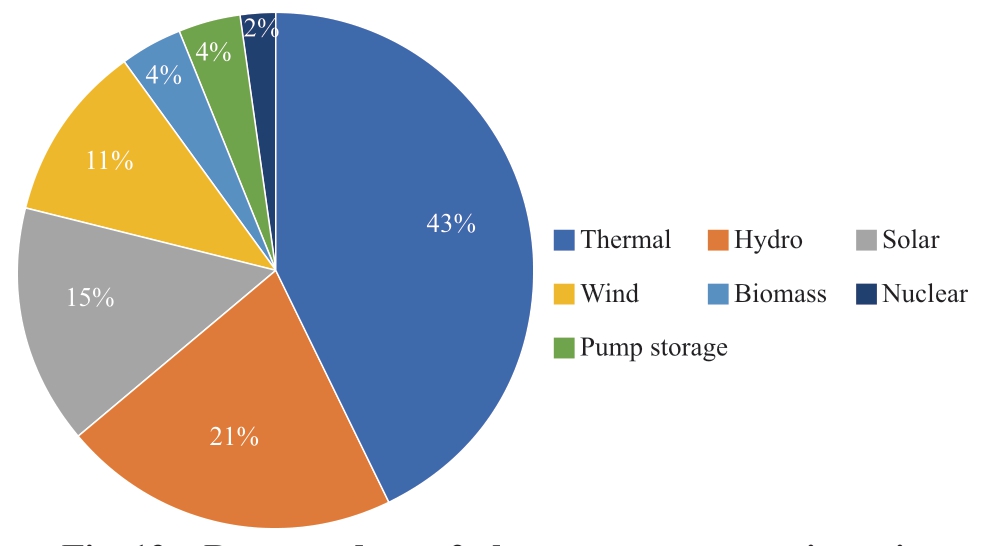
Fig.13 Decreased case 2 clean-energy-generation mix
The three generation mixes are illustrated in Figs.11–13.According to the simulation results,the utilized hour of the decreased cases 1 and 2 were 4429 h and 3759 h,respectively,compared to a utilized hour of 5111 h in the reference case.Overall,the penetration of clean energy will significantly affect the economics of the project,i.e.,a deterioration in clean energy penetration will reduce the project’s revenue.As the clean energy penetration decreases,the utilization rate of the channel in dry season will diminish to a large extent.Possibly,hydropower yields a relatively low output in the dry season that renders the clean energy consumption in a given country as much more realistic.In case of availing the channel,a transmission cost will occur—neither a demand exists between the load and generation for clean energy nor the clean energy on a particular side offer any distinctive advantages compared to the other.In addition,if a high portion of clean energy is planned,the countries have to construct such channels,because the channels will enable the optimization of clean energy in the region.In case they are not constructed,one can refer to the results of the 20% case,which indicated that most countries would experience severe wind and solar curtailment,which is unacceptable.
4.2 Tariff
The import duty(tariff)of ASEAN countries were followed according to the ASEAN Common Effective Preferential Tariff(CEPT),which limits the import duty to 0–5%.Consequently,the tariff in the sensitivity analysis was set as 2%,4%,and 6% with the economic factor represented by the IRR of the project.
As indicated in Table 10,the sensitivity factor of tariff was insignificant.Although the base tariff was low,the IRR was relatively small(8.68%),and consequently,the effect of tariff moderately influenced the IRR.Specifically,an IRR of 7.52% is acceptable for a tariff rate of 6%.
Table 11 Sensitivity factor of CO2 and pollution cost

4.3 CO2 and pollution cost
The current CO2 and pollution costs were determined according to the standards of other countries.These costs would inevitably increase with the development of the economy and further global efforts toward net zero emission.For instance,the carbon emission charge of South Korea was approximately $28.5/t compared to $4/t in our reference case [30,33].If these numbers were adjusted,the CO2 and pollution reduction will impact the project revenue.
As listed in Table 11,the CO2 emission price is one of the most sensitive factors.The underlying reasons are that the reduction of CO2 emission,caused by the channels,was in a larger scale compared to the other pollutions such as NOx and SO2.As the CO2 emission price is relatively variable and will predictively increase in the future,a relatively higher revenue can be anticipated from the transmission channels,including the results of the traditional financial assessment.
5 Conclusions
This paper presented an improved comprehensive simulation model,which could consider the characteristics of VREs.Based on the model,we simulated the operation conditions of a cross-regional power grid interconnecting Southeast Asia,China,and South Asia for the first time.The analyses of the simulation results unraveled the following conclusions:
1)The seasonal deviation in the interconnection channels should be considered.The utilization rate of the channels in the dry season was lower than that in the wet season.Therefore,the maintenance of the channel could be deployed in dry seasons.
2)The total electricity transported from Myanmar to South Asia and Myanmar to China was proportional to the Myanmar–Laos channel.Comprehensively,Myanmar displays a potential to serve as a significant clean energy transmission hub for the three regions of Southeast Asia,China,and South Asia.
3)Clean energy penetration significantly impacts the economics of these channels.A higher clean energy penetration necessitates a more robust transmission connections,which might improve the interconnection economics,thereby demonstrating that the channels were essential toward a Southeast Asia power grid with a high clean energy penetration.
4)The tariff is relatively low in Southeast Asia,and it benefits from a high level of trade connectivity.Therefore,the sensitivity factor was approximately 4.5%,which is not a major economic factor for the projects.
5)Among the pollution costs,the CO2 price constituted the most influential aspect.If harsh efforts are required to be implemented to reduce CO2 emissions,it will potentially affect the economics of interconnections to a greater extent.
Conclusively,several topics ought to be analyzed in depth to further assess the economics of these channels.Initially,the variations in corporate tax of each country could be considered.In addition,the actual policy of CO2 and pollution emission costs require to be clarified rather than using a reference.Lastly,the political risks involved the development of the infrastructure between the countries could be examined.
Acknowledgements
Supported by Science and Technology Foundation of GEIG(52450018000M).National Key R&D Program of China(2016YFB0900500).
Declaration of Competing Interest
We declare that we have no conflict of interest.
References
[1] ACE(2017)The 5th ASEAN energy outlook 2015-2040.ACE,Jakarta
[2] IRENA(2018)Renewable energy market analysis Southeast Asia.IRENA,Abu Dhabi
[3] OECD(2017)Economic outlook for Southeast Asia,China and India 2017:Addressing Energy Challenges.OECD,Paris
[4] Shi X(2016)The future of ASEAN energy mix:a SWOT analysis.Renewable and sustainable energy reviews 50:34-41
[5] Ahmed T,Mekhilef S,Shah R,et al.(2017)ASEAN power grid:a secure transmission infrastructure for clean and sustainable energy for South-East Asia.Renewable and Sustainable Energy Reviews 67:1420-1435
[6] Halawa E,James G,Shi X,et al.(2018)The prospect for an Australian–Asian power grid:a critical appraisal.Energies,11:23-41
[7] Huang YW,Kittner N,Kammen DM(2018)ASEAN grid flexibility:preparedness for grid integration of renewable energy.Energ Policy,128:711-726
[8] Ahmed T,Mekhilef S,Shah R,et al.(2018)Modelling of ASEAN power grid using publicly available data.2018 IEEE PES Asia-Pacific Power and Energy Engineering Conference(APPEEC)
[9] Shi X(2014)A green vision vs.a brown outlook:the future of ASEAN’s energy mix.Asian research working papers
[10] Aalto P(2014)Energy market integration and regional institutions in east Asia.Energ Policy,74:91-100
[11] Thius GBE(2012)Forging the ties that bind:comparing the factors behind electricity market integration in the EU and ASEAN.EU Centre Working Paper No.6,May 2012
[12] Birol FPBA(2013)Southeast Asia energy outlook.World Energy Outlook Special Report
[13] ADB(2017)Asian development outlook 2017 update:Sustaining Development through Public-Private Partnership:Highlights.ADB,Manila
[14] ADB(2017)Meeting asia’s infrastructure needs.Manila,ADB.
[15] ASEAN(2010)Master plan on ASEAN connectivity.ASEAN,Jakata
[16] Lean HHSR(2010)CO2 emissions,electricity consumption and output in ASEAN.Appl Energ,87:1858-1864
[17] Wang B,Liu C,Feng S,et al.(2018)Prediction method for shortterm wind power based on wind farm clusters.High Voltage Engineering,44:1254-1260
[18] Balouchestani M,Krishnan S(2014)Advanced K-means clustering algorithm for large ECG data sets based on a collaboration of compressed sensing theory and K-SVD approach.Paper presented at International Symposium on Communication Systems,Macau,China
[19] Chun P,Rong Y,Hui S(2015)Multi-objective DG planning based on K-means clustering and multi-scenario timing characteristics analysis.Electric Power Automation Equipment,35:58-65
[20] Wang X,Chen ZY,Peng XG(2016)A new combinational electrical load analysis method based on bilayer clustering analysis.Power System Technology,40:1495-1501
[21] Luo SH(2005)Research on modeling and solution algorithms of modern power system optimization.Dissertation,Huazhong University of Science and Technology
[22] ACE(2016)Renewable energy outlook for ASEAN.ACE,Jakarta
[23] ASEAN(2018)ASEAN power grid.https://asean.org/? static_post=programme-area-no-1-asean-power-grid.Accessed 1 Nov 2018
[24] Xiao JY,Wu LL(2018)Application of DC grid in global energy interconnection and case study.Journal of Global Energy Interconnection,1:32-38
[25] ACE(2017)Our journey in 2017-Annual report.ACE,Jakarta.
[26] Sun K(2012)Model and method of study on power Flow and Scale Optimization.Electric Power Construction,33:8-11
[27] Liu ZY(2010)SGCC Transmission and transformer project general cost:500kV transmission.China Electric Power Press,Beijing
[28] ASEAN(2018)Taxatioin of ASEAN member countries
[29] Wu YS(2012)Energy Market Integration in East Asia:Theories,Electricity Sector and Subsidies.Economic Research Institute for ASEAN and East Asia,Jakarta
[30] ADB(2018)Public sector financing stats.ADB,Manila
[31] You PY,Wang XH,Zhang Y(2015)Economic research on Asia-Europe long-distance UHV power transmission.Power System Technology,39:2087-2093
[32] IEA(2012)Energy Technology Perspectives 2012.IEA,Paris
[33] Kim Y(2018)Carbon tax plan floated.url:http://www.koreaherald.com/view.php?ud=20100217000038.Accessed 1 Nov 2018
Biographies

Yuan Gao received Master degree at University of Strathclyde in 2017 and bachelor degree in North China Electric Power University.He is working in State Grid Economics and Technological Research Institute.His research interests are power grid planning.
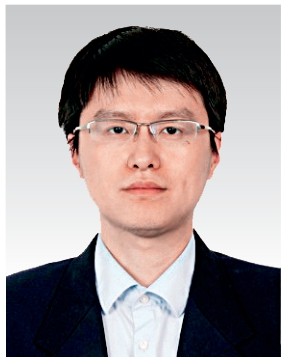
Han Jiang received his bachelor and Ph.D.degrees from College of Electrical Engineering,Zhejiang University,Hangzhou,China in 2006 and 2012.He is working in Global Energy Interconnection Development and Cooperation Organization,Beijing.His research interests include power system planning,control and renewable energy.

Fangzheng Peng received Master degree at Cornell University in 2017 and bachelor degree in Huazhong University of Science and Technology.He is working in State Grid Economics and Technological Research Institute.His research interests are power grid planning.

Yi Gao received her bachelor degree in electrical engineering from the Zhengzhou University,China,in 1996,and master and Ph.D.degrees in electrical power engineering in 2006 and 2010 respectively from the University of Saskatchewan,Canada.She is working in Global Energy Interconnection Development and Cooperation Organization,Beijing.She has been engaged in the research of power grid planning and reliability analysis of power system.Currently,she focuses on the global energy interconnection development planning study.

Yan Zhang graduated from University of Bath with degree of Ph.D in Electrical Engineering.Currently,her main research area is power grid planning.

Xunpeng Shi received a LLM from University of Dundee,a MERE and Ph.D.of Economics from the Australian National University.Currently he is the Principal Research Fellow at the Australia-China Relations Institute,University of Technology Sydney and a‘Chutian Scholar’ Visiting Professor at Hubei University of Economics.His areas of expertise include the Chinese economy,and energy economics and policy,with a regional focus of Australia,ASEAN,and Northeast Asia.
(Editor Yanbo Wang)
