0 Introduction
Under the guidance of the “30-60” double-carbon,a target,China’s power industry is actively promoting the transformation of low-carbon energy [1] and accelerating the construction of a new power system based on new energy sources [2].By 2020,the installed capacity of wind power has reached 271.53 million KW,with a yearon-year increase of 34.6%,whereas the installed capacity of photovoltaic power generation has reached 253.43 million KW,an increase of 24.1% year-on-year [3].It is expected that,in 2030,the installed scale of new energy in China will exceed that of coal power,and new energy power generation will become the first power source [4];by 2050,the proportion of new energy consumption will reach 60% [5].However,renewable energy generation,such as wind power generation,has the characteristics of volatility,randomness,and intermittence [6],which brings new challenges to the safe and stable operation of power grids [7-8].The coordinated operation of the energy storage system and wind farm makes the output power of the wind farm stable,which has become an effective way to smooth wind power fluctuation [9-10].At present,many countries have built a number of energy storage technology projects to smooth wind power fluctuations [11-13],but most of them are mainly based on battery energy storages [14-15].However,the battery energy storage system has a shorter life,is prone to produce toxic substances that pollute the environment,and has the phenomenon of self-discharge.In addition,its stored energy is relatively small [16-17].These characteristics make it difficult to meet practical needs.
Hydrogen energy storage has the advantages of high energy density,green environment protection,large energy storage capacity,and seasonal long-term storage [18-19].Combining hydrogen and electricity provides a new idea to reduce the impact of power fluctuations on power grids[20],and has a broad application scenario in the future [21-22].Compared to traditional hydrogen production from fossil energy sources,causing large carbon emissions[23],hydrogen production from electrolytic water via renewable energy sources can basically achieve zero carbon emissions and is the ultimate goal of future hydrogen energy development [24-25].However,the volatility of renewable energy sources can lead to frequent start-stop,variable load,and low-load operation of hydrogen storage systems,which have a large negative impact on the system lifetime and the efficiency of the electrolyzer [26].The literature[27] states that frequent start-ups and stops may cause the electrolyzer to operate at substandard temperatures for long periods of time,thus reducing its productivity.Therefore,the coordination of the hydrogen storage system with the fluctuating intermittent new energy generation system has become an urgent issue to be addressed.
At present,research on energy storage systems mainly focuses on capacity optimization and operation control.Meanwhile,research on the extraction of the typical operation curves of energy storage systems under the mode of smoothing wind power fluctuations has been scarce.Based on the typical operation curves,the operation characteristics of energy storage systems are retrieved,and the influences of start-stop,variable load,low load,and other operating states on the performance and life of energy storage systems are explored.Now,the generation of the typical curves is widely used in load curves.The typical daily load curves are extracted by cluster analysis of six characteristic indexes,such as load rate and maximum utilization hour rate in reference [28].In reference [29],typical electricity consumption characteristics and typical meteorological characteristic indicators are first optimized to form the optimal feature subset.Next,the improved peak density fast search clustering(CFSFDP)algorithm is used to cluster the residential electricity consumption data.In reference [30],six indicators,such as peak load rate and valley load rate,are selected,and the improved PFCM and FLDA are applied to the clustering of load curves.
However,hydrogen storage systems have not been put into large-scale application.Research on electrolytic hydrogen production in high-ratio new energy grids is lacking,and the durability and decay law of electrolytic hydrogen production under fluctuating power input from a source/grid is not yet clear.The generation of the typical operation curves of hydrogen storage systems is the basis of the above-mentioned research.In this study,by collecting the actual output data of a wind farm,the typical operation curves of a hydrogen energy storage system are generated under the mode of stabilizing wind power fluctuations in the application scenario.First,the curves are classified by fuzzy C-means according to the characteristic parameters of different time periods.Second,a typical power value at any time is obtained by a cloud model,and then,the typical operation curves of the hydrogen storage system are obtained by integration.According to the typical operation curves,combined with the operation characteristics of each component,the optimal allocation of capacity is achieved with the lowest annualized total cost as the goal.
1 Structure of the hybrid energy storage system
To meet the relevant regulations of the output power of the wind farm and to reduce the adverse impact of wind power fluctuations on the power grid,the energy storage system is directly installed at the wind farm side; that is,the wind power fluctuation is stabilized before connection to the grid.In this study,a hydrogen-super capacitor hybrid energy storage system is used to stabilize the wind power fluctuation,and its structural model is shown in Fig.1.
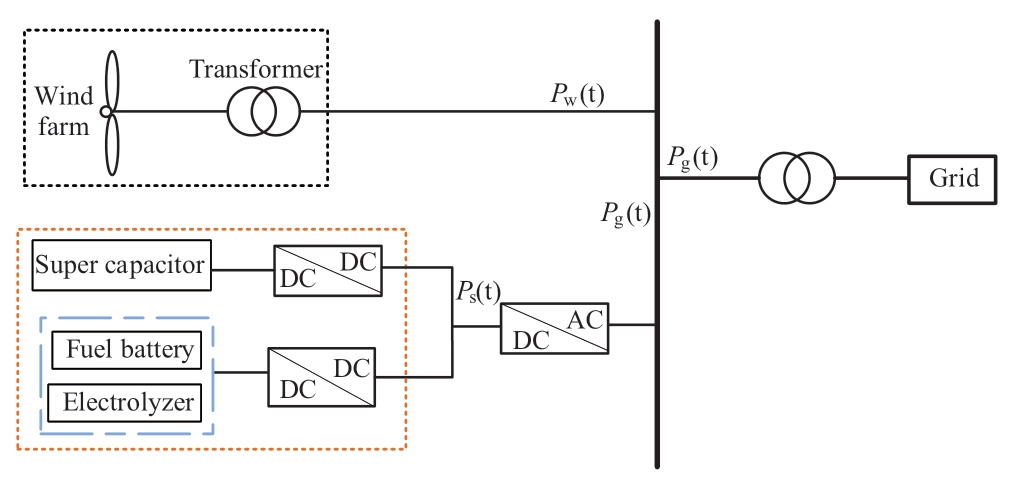
Fig.1 Structural model of a hybrid energy storage system
The hybrid energy storage system consists of a wind farm,a fuel cell,an electrolyzer,a super capacitor,etc.As shown in Fig.1,Pw(t)is the original output of the wind power,Pg(t)is the grid-connected power after stabilization,andPs(t)is the total output of the hybrid energy storage system.The Ps(t)is positive when the energy storage system is charging,and negative when the energy storage system is discharging.The relationship between the variables is shown in(1):
2 Generation method of the typical operation curves of the hydrogen energy storage system
2.1 EMD decomposes to distribute the wind power output
The charge and discharge of the hybrid energy storage system are shared by the supercapacitor and the hydrogen energy storage.Among them,based on the characteristics of high power density and high response speed,supercapacitors are used to bear high-frequency power fluctuations.The hydrogen energy storage system composed of an electrolytic cell and a fuel cell has the characteristics of high energy density and high storage capacity,which are used to absorb low-frequency power.In this study,through the EMD decomposition of the original wind power output,a group of IMF components and residual components are obtained:
where s(t)is the original signal,ci(t)is the i-th IMF component decomposed,n is the order of the IMF components,and r(t)is the residual component.
The data are gathered from a wind farm with an installed capacity of 400 MW in Northeast China,and the time interval is 15 min.Taking one day’s wind power fluctuation as an example,the EMD decomposition results of the original wind power output data are shown in Fig.2.IMF2 is regarded as the hydrogen storage stabilization instruction,IMF1 is regarded as the supercapacitor stabilization instruction,and the rest components are grid-connected power.
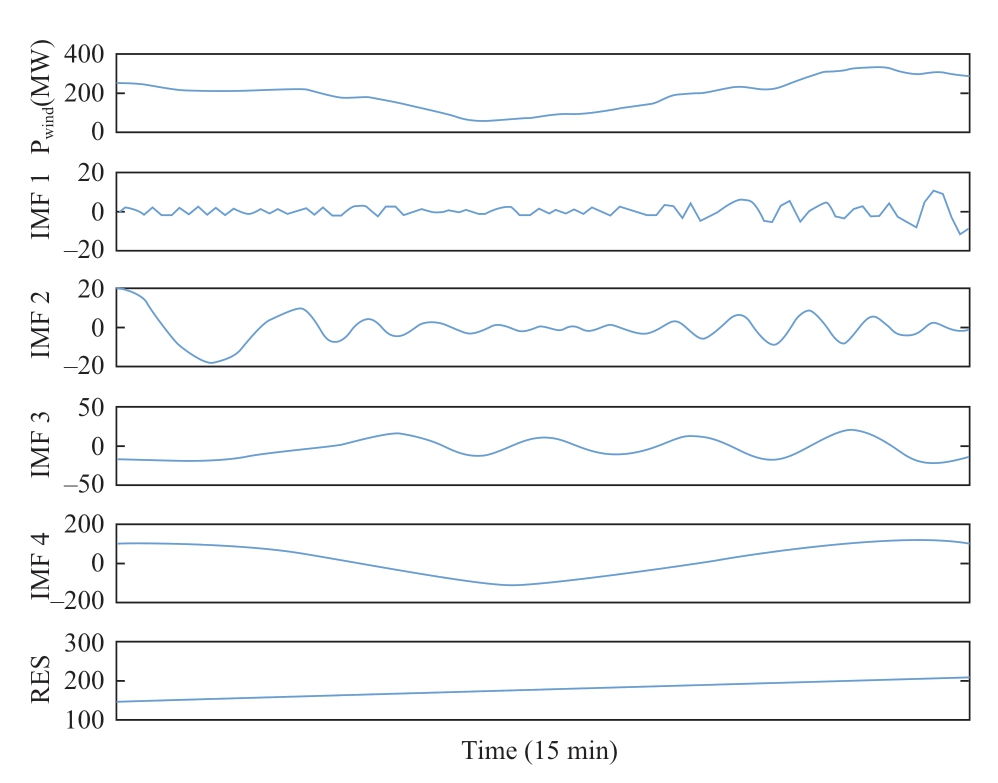
Fig.2 IMF component and residual component obtained from the EMD decomposition of the wind power on a certain day
As can be seen from Fig.2,the charging and discharging power amplitude of the supercapacitor is small and fluctuates frequently.The charging and discharging power of the hydrogen energy storage system is high,but the fluctuation is low,which accords with the operating characteristics of both systems.
Fig.3 shows the comparison of the grid-connected power of the wind power before and after decomposition.It can be seen from the figure that the grid-connected power after decomposition has been effectively smoothed.On this basis,the daily wind power output is decomposed by EMD,and the annual operation curves of the hydrogen storage system are obtained(Fig.4).
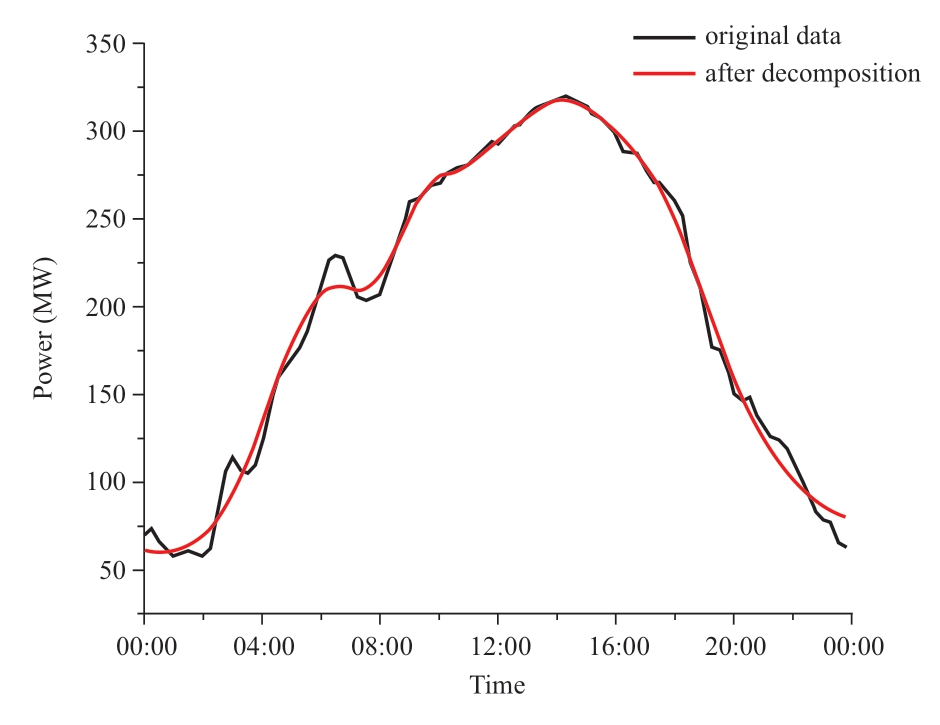
Fig.3 Smoothing result on a certain day
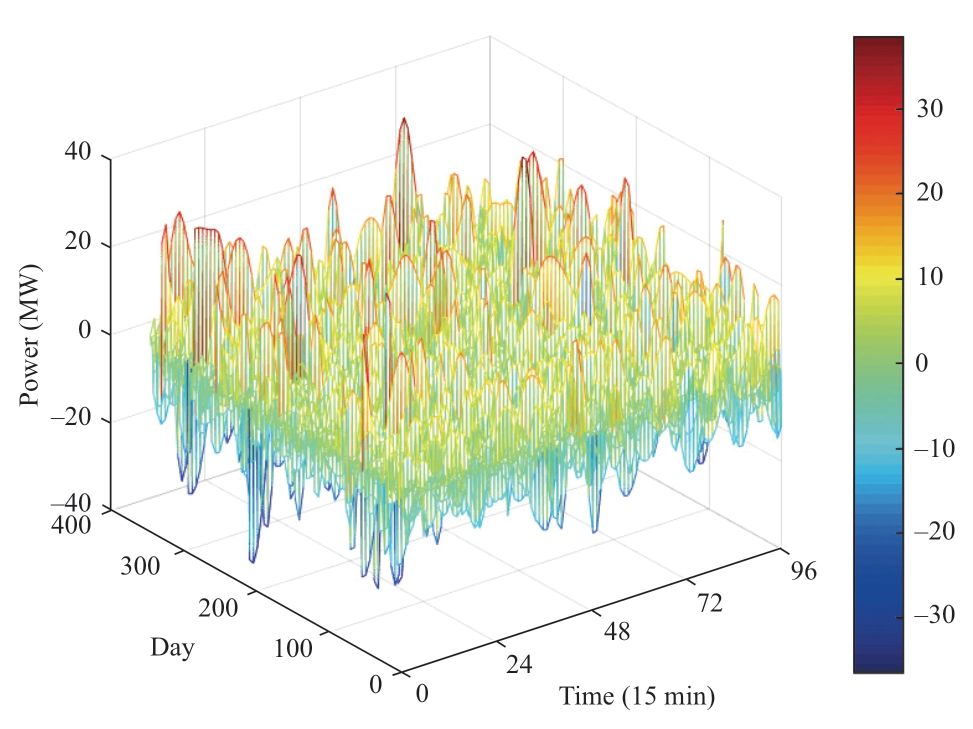
Fig.4 Annual operation curves of the hydrogen energy storage system
2.2 Parameter selection and cluster analysis
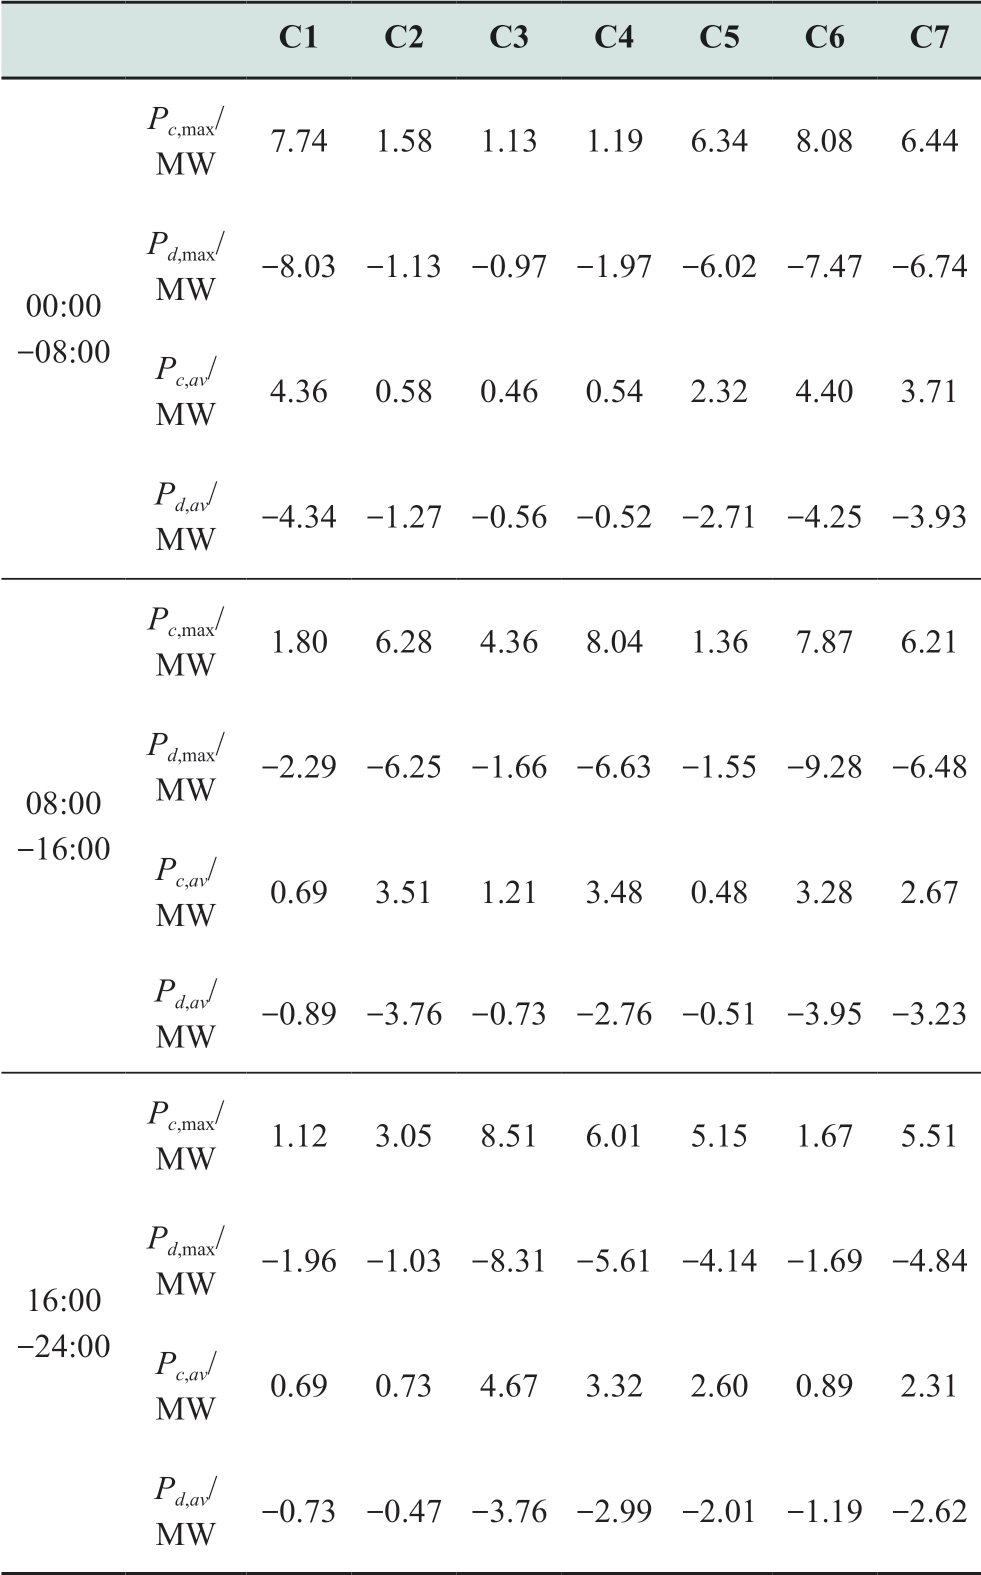
First,the day is divided into three time periods(00:00–8:00,8:00–16:00,16:00–24:00)on average,and the characteristic parameters of each curve in each time period are counted.Next,the characteristic parameter matrix of all curves is obtained.The characteristic parameters selected herein are the maximum charging power(Pc,max),maximum discharging power(Pd,max),average charging power(Pc,av),and average discharging power(Pd,av).
After that,all the operation curves are classified based on the characteristic parameters.This study adopts the fuzzy C-means clustering(FCM)algorithm.
2.3 Fuzzy C-means clustering algorithm
Compared with traditional classification methods such as K-means,the FCM algorithm has more flexible clustering characteristics.It is a clustering algorithm that determines the degree to which each sample belongs to a certain cluster through the degree of affiliation.Its core idea is to have high similarity between samples of the same class and low similarity between samples of different classes.Assuming that the sample data set is D=(x1,x2...xn),the sample data set is divided into c classes,and the affiliation of any sample xi in D to the j-th class is uij,the basic steps of FCM clustering are as follows:
(1)Initially,an affiliation matrix U(0),where any element uij![]() =1,is generated;
=1,is generated;
(2)The cluster center is calculated:
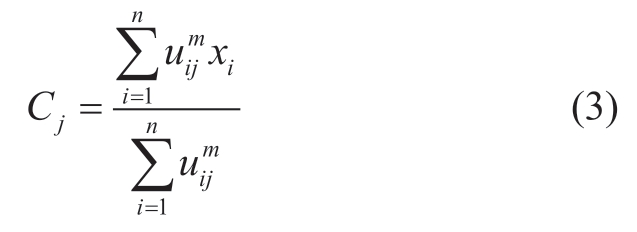
where xi represents the i-th sample in the sample dataset;Cj represents the cluster center of the j-th class; and m is the fuzzy index,usually taken as 2;
(3)The affiliation matrix U is updated using(4):

Let the number of iterations be k.Next,U(k) and U(k+1)are compared.If the change between the two is less than a certain threshold ε,the degree of affiliation will not change significantly with further iterations,and the procedure stops;otherwise,return to step(2).
2.4 Clustering results and analysis
The annual operation curves are divided into seven categories,and the results are shown in Fig.5.
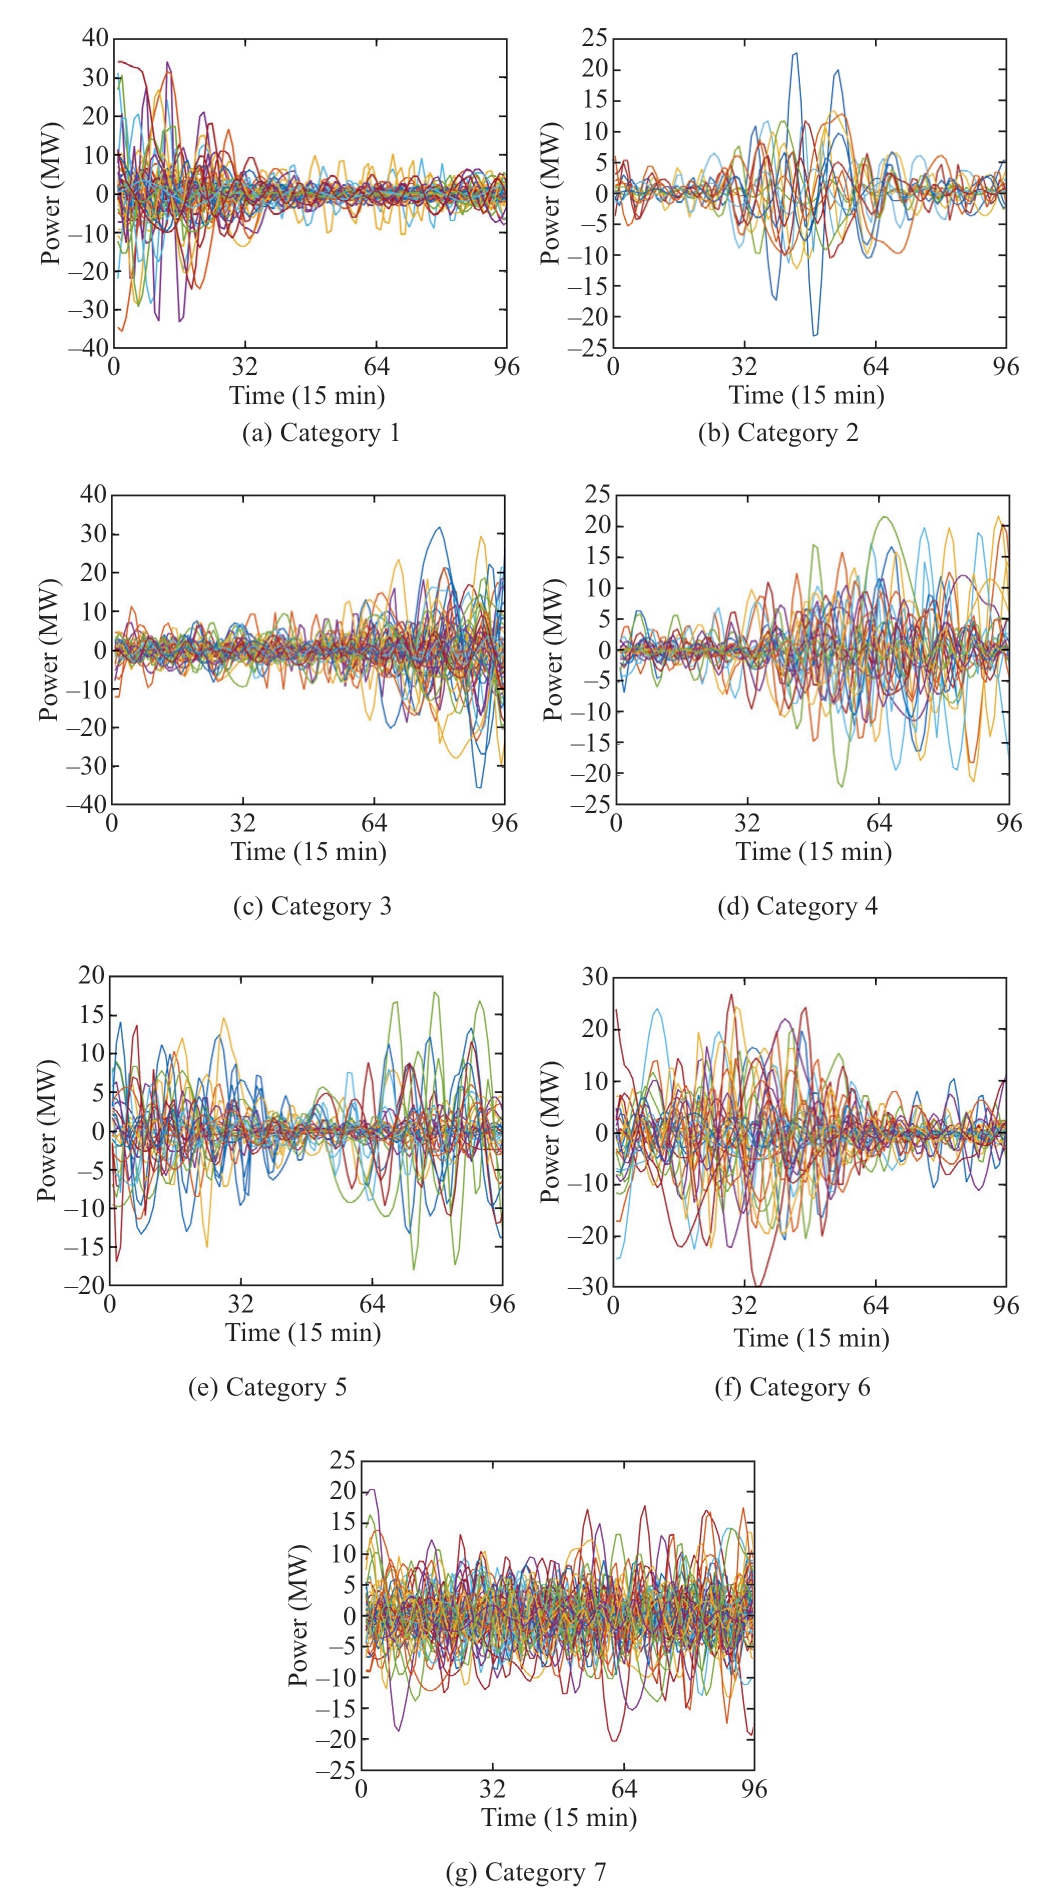
Fig.5 Clustering results of the annual operation curves
As can be seen from Fig.5,the operating power of Category 1 in the period of 00:00–8:00 is obviously higher than that in the other two periods,that of Category 2 in the period of 8:00–16:00 is higher,and that of Category 3 in the period of 16:00–24:00 is higher.In Category 4,the operating power of the energy storage from 00:00 to 16:00 is obviously higher than that from 16:00 to 24:00.Category 5 has a higher operating power from 8:00 to 24:00,and Category 6 has a higher output from 00:00 to 8:00 and 16:00 to 24:00.The operating power of each period in Category 7 is relatively average.
2.5 Generation method of the typical operation curves based on a cloud model
The basic ideas of the typical-operation curve generation method are as follows:
(1)The typical power value at any given moment is obtained by the frequency distribution of charging and discharging power at that moment;
(2)The typical power values at all times are connected to obtain the typical operation curve.
The cloud model is a qualitative and quantitative uncertainty transformation model based on fuzzy set theory and probability statistics.A reverse cloud generator is the core element of cloud extraction from complex cloud clusters,such as expectation(Ex),entropy(En),superentropy(He),etc.Any type of probability distribution can be decomposed into the sum of several normal distributions.Therefore,the frequency distribution of charging and discharging power of the energy storage system at each moment is decomposed into several cloud droplets,and the typical power value that can represent the operation characteristics of the energy storage system at that moment is expected from each cloud droplet.
Based on the method above,seven typical operation curves are generated on the basis of clustering,and the results are shown in Fig.6.The probability of the seven appeared curves is 19.24%,5.16%,19.59%,8.93%,10.31%,13.40%,and 23.37%,respectively.

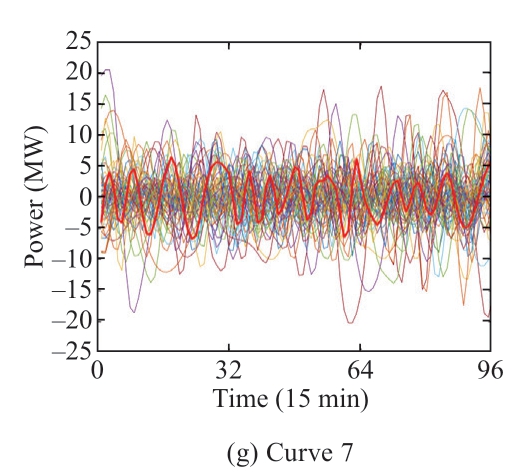
Fig.6 Seven typical operation curves
The characteristic parameter matrices of the seven curves are shown in Table 1.It can be seen from Table 1 that there are obvious differences in the distribution of the characteristic parameters of the seven curves,which confirms the effectiveness of the method of generating the typical operation curves proposed in this paper.
Table 1 Characteristic parameter matrix of seven typical operation curves
3 Capacity allocation and optimal scheduling model
3.1 Determination of the rated power of the electrolyzer and fuel cell
According to the “China Hydrogen Energy Industry Development Report 2020,” the load regulation factor of the proton exchange membrane water electrolysis for hydrogen production can reach 0% to 160%; that is,the operating power of the electrolyzer can exceed the rated power for a short time and operate in an overload state.Using this feature can reduce the rated power of the electrolyzer,as shown in(5):
where PN refers to the rated power of the electrolyzer,Pel(t )refers to the electrolysis power of the electrolyzer at time t,and ϕ refers to the load regulation factor.
In this study,taking the load regulation factor as ϕ=1.5,the rated power of the electrolyzer is determined by(6):
The rated power of the fuel cell is determined by the maximum discharge power,as shown in(7):
According to(6)and(7),the rated powers of the electrolyzer and fuel cell are 6 MW and 10 MW,respectively.
3.2 Determination of the rated capacity of the hydrogen storage tank and optimal scheduling operation
In actual operation,in order to avoid excessive storage of hydrogen storage tanks,the output of the electrolyzer and fuel cell is constrained by the remaining storage space of hydrogen storage tanks.At the same time,considering the economy of the system,the capacity of hydrogen storage tanks should not be too large.Therefore,the electrolyzer and the fuel cell may not be able to charge and discharge completely according to the power curve.Therefore,in the optimal scheduling model,the lowest cost is taken as the objective function combined with the constraints of the electrolyzer,fuel cell,and hydrogen storage tank and their mutual constraints.Subsequently,the optimal capacity of the hydrogen storage tank is determined through the optimal calculation,and the operating power curves of hydrogen storage after optimal scheduling are obtained.Objective function
In the process of optimal scheduling,considering the economy of the system,the objective function is established with the lowest cost as the goal:
where Cb and Cq are the investment cost of the hydrogen storage tank and the penalty of electricity abandonment,respectively:

where γ represents the industry benchmark rate of return,set at 8%; yb is the service life of the hydrogen storage tank; Cbe is the unit capacity cost of the hydrogen storage tank; Pt,d is the theoretical value of the charge and discharge power of the hydrogen energy storage system at time t on the d-th day; Pel,t,d and Pfc,t,d are the actual charge and discharge powers of the electrolyzer and fuel cell at time t on the d-th day,respectively;and ξqis the penalty coefficient.
Constraint condition
(1)Electrolyzer power constraint:

where Pel_lim,t is the operating power of the electrolyzer constrained by the remaining storage space of the hydrogen storage tank at time t,QMAX is the upper limit of storage capacity of the hydrogen storage tank,Qt is the hydrogen storage capacity of the hydrogen storage tank at time t,ηel is the efficiency of the electrolyzer,∆t is the time interval,HHHV is the calorific value of hydrogen,and Pel,t is the actual operating power of electrolyzer at time t.
(2)Fuel cell power constraint:

where Pfc_lim,t is the operating power of the fuel cell constrained by the remaining storage space of the hydrogen storage tank at time t,QMIN is the lower limit of storage capacity of the hydrogen storage tank,ηfc is the efficiency of the fuel cell,and Pfc,t is the actual operating power of the fuel cell at time t.
(3)Storage capacity constraint of the hydrogen storage tank
The current hydrogen quantity of the hydrogen storage tank is used to describe the state of charge(SOC)of the hydrogen storage system,which can be expressed as(13):
where Q(N)is the rated capacity of the hydrogen storage tank.
In addition,to ensure that the hydrogen storage tank has sufficient daily storage space,the capacity of the hydrogen storage tank is the same at 00:00 and 24:00 in a day:
3.3 Example analysis and capacity allocation
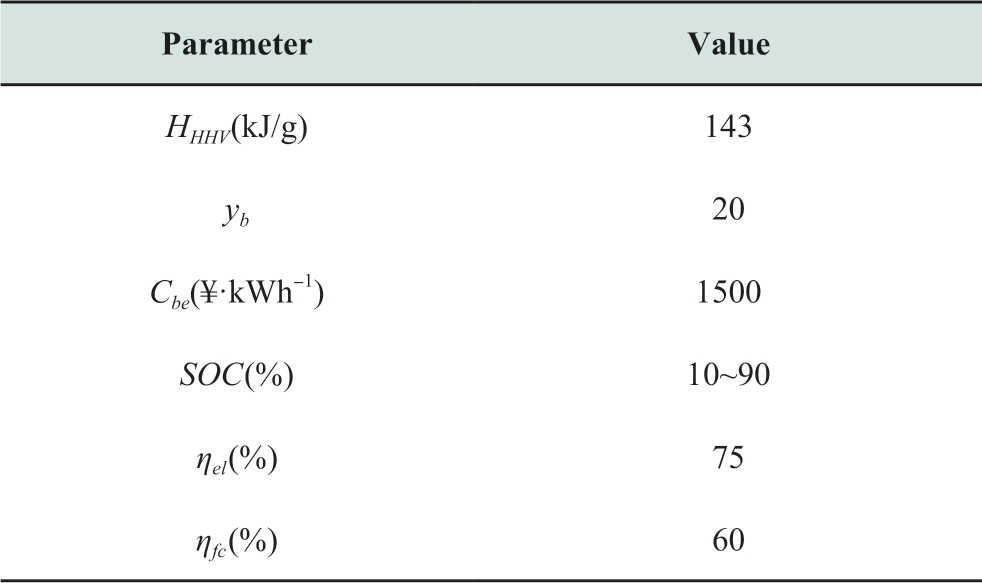
Let the penalty coefficient ξq be 0.8,the initial state of charge of the hydrogen storage tank be 0.2,and the days of the seven typical operation curves be 70,19,72,33,37,49,and 85 days,respectively in proportion.Other relevant parameters of the hydrogen energy storage system are listed in Table 2.
Table 2 Relevant parameters of the hydrogen energy storage system
With the aforementioned method,the optimal solution is obtained by combining the CPLEX commercial solver of YALMIP toolbox in MATLAB.
With an increase in the capacity of the hydrogen storage tank,the amount of discarded electricity decreases,but the cost increases gradually.Fig.7 shows the objective function–capacity relationship.
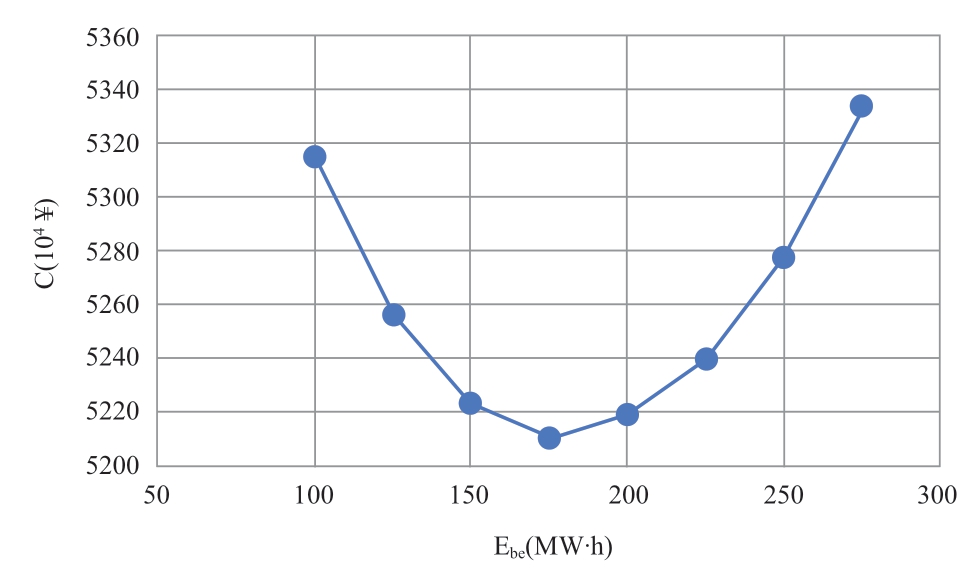
Fig.7 7 Cost under different capacities of hydrogen storage tanks
It can be seen from the figure that the target cost function decreases first and then increases with the capacity,so the capacity corresponding to the lowest cost is selected as the rated capacity of the hydrogen storage tank.In this example,the rated capacity of the hydrogen storage tank is 175 MW·h.It can be seen from Fig.8 that the state of charge of the hydrogen storage tanks corresponding to different operation curves all change in the range of 0.1–0.9,which confirms the effectiveness of the control strategy.

Fig.8 7 Charge state of the hydrogen storage tank under the seven operation curves
The same method is adopted to optimize the capacity of the supercapacitor with the lowest cost function including investment cost and equipment cost as the goal.The rated capacity of the supercapacitor ESC is determined by(15)and(16):

where SOCmax and SOCmin are the upper and lower limits of the state of charge of the supercapacitor,respectively; ESC(t )is the cumulative capacity of the supercapacitor; PSC(t )is the charging and discharging power of the supercapacitor at time t; ∆t is the time interval; and ηC and ηD are the charging and discharging efficiencies of the supercapacitors,respectively.
4 Conclusions
Wind power fluctuations bring great challenges to the safe and stable operation of power grids,and energy storage systems can effectively alleviate their intermittence and uncertainty.In this paper,a generation method of the typical operation curve of a hydrogen storage system under the application mode of stabilizing wind power fluctuations is proposed based on the measured data of a wind farm.Furthermore,the power and the capacity are optimally allocated according to the typical operation curves.
(1)The wind power is pretreated by the EMD decomposition method and decomposed to obtain the annual hydrogen storage operation curve according to the operation characteristics of different components;
(2)The curves are divided into three periods and classified according to the characteristics of different periods.From the clustering results,it can be seen that there are obvious differences among the seven types of operation curves;
(3)On the basis of clustering,the seven typical operation curves are generated based on a cloud model.The curves generated by this method can ensure that the power at any moment can fully reflect the charging and discharging power characteristics of all curves in the class at that moment.
(4)Based on the generated operation curve,the optimal capacity allocation result of the hydrogen energy storage system is obtained,which improves the economy of the system to the greatest extent on the premise of meeting the operation characteristics.
The generated typical operation curves can be used to explore the attenuation law of electric hydrogen production systems,develop the fluctuation adaptability platforms of electric hydrogen production systems,and provide some reference for the construction of electric hydrogen adaptation evaluation systems.
Acknowledgements
This work was supported by the National Key Research and Development Program of China(Materials and Process Basis of Electrolytic Hydrogen Production from Fluctuating Power Sources such as Photovoltaic/Wind Power,No.2021YFB4000100).
Declaration of Competing Interest
We declare that we have no conflict of interest.
References
[1] Zhou X X,Chen S Y,Lu Z X,et al.(2018)Technology features of the new generation power system in china.Proceedings of the CSEE,38(07):1893-1904+2205
[2] Qiu W Q,Wang M C,Lin Z Z,et al.(2021)Comprehensive evaluation of shared energy storage towards new energy accommodation scenario under targets of carbon emission peak and carbon neutrality.Electric Power Automation Equipment,41(10):244-255
[3] Zhu L Z,Qu L N,Liu C,et al.(2021)Improved calculation method of equivalent short-circuit ratio for power generation cluster of renewable energy.Automation of Electric Power Systems,45(22):74-82
[4] Xin B A(2021)Accelerating the construction of a new electricity system to help achieve the “double carbon” target.State Grid,2021(08):10-12
[5] Cheng Y H,Zhang N,Wang J M,et al.(2019)Comprehensive evaluation of transmission network planning for integration of high penetration renewable energy.Automation of Electric Power Systems,43(03):33-42+57
[6] Erdiwansyah M,Husin H,et al.(2021).A critical review of the integration of renewable energy sources with various technologies.Protection and Control of Modern Power Systems,6(1):37-54
[7] Kang C Q,Jia W Z,Xu Q Y,et al.(2013)Capability evaluation of wind power accommodation considering security constraints of power grid in real-time dispatch.Proceedings of the CSEE,33(16):23-29+22
[8] Yue T J,Chen J,Liu P H,et al.(2014)Strategy of improving large-scale wind farm output fluctuation based on energy storage system,42(04):47-53
[9] Liu Y M,Wang W,Xu Q Y,et al.(2019)A fuzzy control strategy combined with wind power prediction and energy storage soe for smoothing wind power output.Power System Technology,43(07):2535-2543
[10] Ding M,Wu J(2017)A novel control strategy of hybrid energy storage system for wind power smoothing.Electric Power Components and Systems,45(12):1265-1274
[11] Francisco D,Andreas S,Oriol G,et al.(2012)A review of energy storage technologies for wind power applications.Renewable and Sustainable Energy Reviews,16(4):2154-2171
[12] Hu J,Yang S L,Hou C Y,et al.(2015)Present condition analysis on typical demonstration application of large-scale energy storage technology and its enlightenment.Power System Technology,39(04):879-885
[13] Luo X,Wang J H,Dooner M,et al.(2015)Overview of current development in electrical energy storage technologies and the application potential in power system operation.Applied energy,2015(137):511-536
[14] Li J L,Niu M,Wang S X,et al.(2020)Operation and control analysis of 100 mw class battery energy storage station on grid side in jiangsu power grid of china.Automation of Electric Power Systems,44(02):28-35
[15] Wang R G,Dai L S,Liang Z R,et al.(2019)Performance comparison of microgrid integrated energy storage system based on different kinds of batteries.Power Capacitor & Reactive Power Compensation,40(01):166-171+179
[16] Cai G W,Kong L G,Xue Y,et al.(2014)Overview of research on wind power couplèd with hydrogen production technology.Automation of Electric Power Systems,38(21):127-135
[17] Wang J,Kang L X,Liu Y Z(2020)Optimal design of electricityhydrogen energy storage systems for renewable energy penetrating into chemical process systems.CIESC Journal,71(3):1131-1142
[18] Chen W R,Fu W X,Han Y,et al.(2021)Optimal configuration of wind-solar-hydrogen multi-energy complementary microgrid with demand side.Journal of Southwest Jiaotong University,56(03):640-649
[19] Joakim A,Stefan G(2019)Large-scale storage of hydrogen.International Journal of Hydrogen Energy,44(23):11901-11919
[20] Cao J W,Zheng Y,Zhang W Q,Yu B(2021)Hydrogen energy development driven by the Energy Internet.Journal of Tsinghua University(Science and Technology),61(04):302-311
[21] Si Y,Chen L J,Chen X T,et al.(2021)Optimal capacity allocation of hydrogen energy storage in wind-hydrogen hybrid system based on distributionally robust.Electric Power Automation Equipment,41(10):3-10
[22] Luo Z X,Cao Y(2020)Development prospect of hydrogen energy industry and its development path in china.Sino-Global Energy,25(02):9-15
[23] Zhao X Y,Li G D,Sun X T,et al.(2021)Key technology and application progress of hydrogen production by electrolysis under peaking carbon dioxide emissions and carbon neutrality targets.Journal of Global Energy Interconnection,4(05):436-446
[24] Xu S,Yu B Y(2021)Current development and prospect of hydrogen energy technology in china.Journal of Beijing Institute of Technology(Social Sciences Edition),23(06):1-12
[25] He Q,Meng Z X,Shen Y,et al.(2021)Analysis and thinking of hydrogen energy policies in China under “double carbon” target.Thermal Power Generation,50(11):27-36
[26] Zhang G T,Wan X H(2014)A wind-hydrogen energy storage system model for massive wind energy curtailment.International Journal of Hydrogen Energy,39(3):1243-1252
[27] Frano B(2014)PEM electrolysis for production of hydrogen from renewable energy sources.Solar Energy,78(5):661-669
[28] Liu S,Li L Z,et al.(2016)Strategy of improving large-scale wind farm output fluctuation based on energy storage system,42(04):47-53
[29] Zhang J,Xia F,Yuan B,et al.(2022)Clustering method for residential electricity consumption behavior based on feature optimization strategy.Smart Power,46(06):153-159
[30] Wu H Z,Zhu C X,Zhang Y S,et al.(2022)Adaptive method for selecting typical days based on improved fuzzy clustering algorithm.Smart Power,50(01):60-67
Biographies

Yanhui Xu is the corresponding author.He received the Ph.D.degree at North China Electric Power University,2010.He is working in North China Electric Power University.His research interests include dynamic power system analysis and load modeling.

Yijia Xu is working towards master degree at North China Electric Power University,Beijing,China.Her research interests include new energy storage technologies.

Yan Huang received her Bachelor’s and Master’s degrees from North China Electric Power University,Beijing in 2002 and 2005.She is working at the Energy Development Research Institute,China Southern Power Grid,Guangzhou.Her research interests include ecnomic engineering and project management.
(Editor Yanbo Wang)
